MMG Ltd. · HKEX:1208
MMG — FY2021 Earnings Presentation
41 slides from MMG's earnings presentation, Mar 25, 2022
Slide 1: 2021 Annual Results
2021 Annual Results 25 March 2022
Slide 2: Disclaimer
DISCLAIMER The information contained in this presentation is intended solely for your personal reference and may not be reproduced, redistributed or passed on, directly or indirectly, to any other person (whether within or outside your organisation/firm) or published, in whole or in part, for any pu
Slide 3: Overview
OVERVIEW 2021 Performance Financial Results Strategy and Outlook ? Questions and Answers
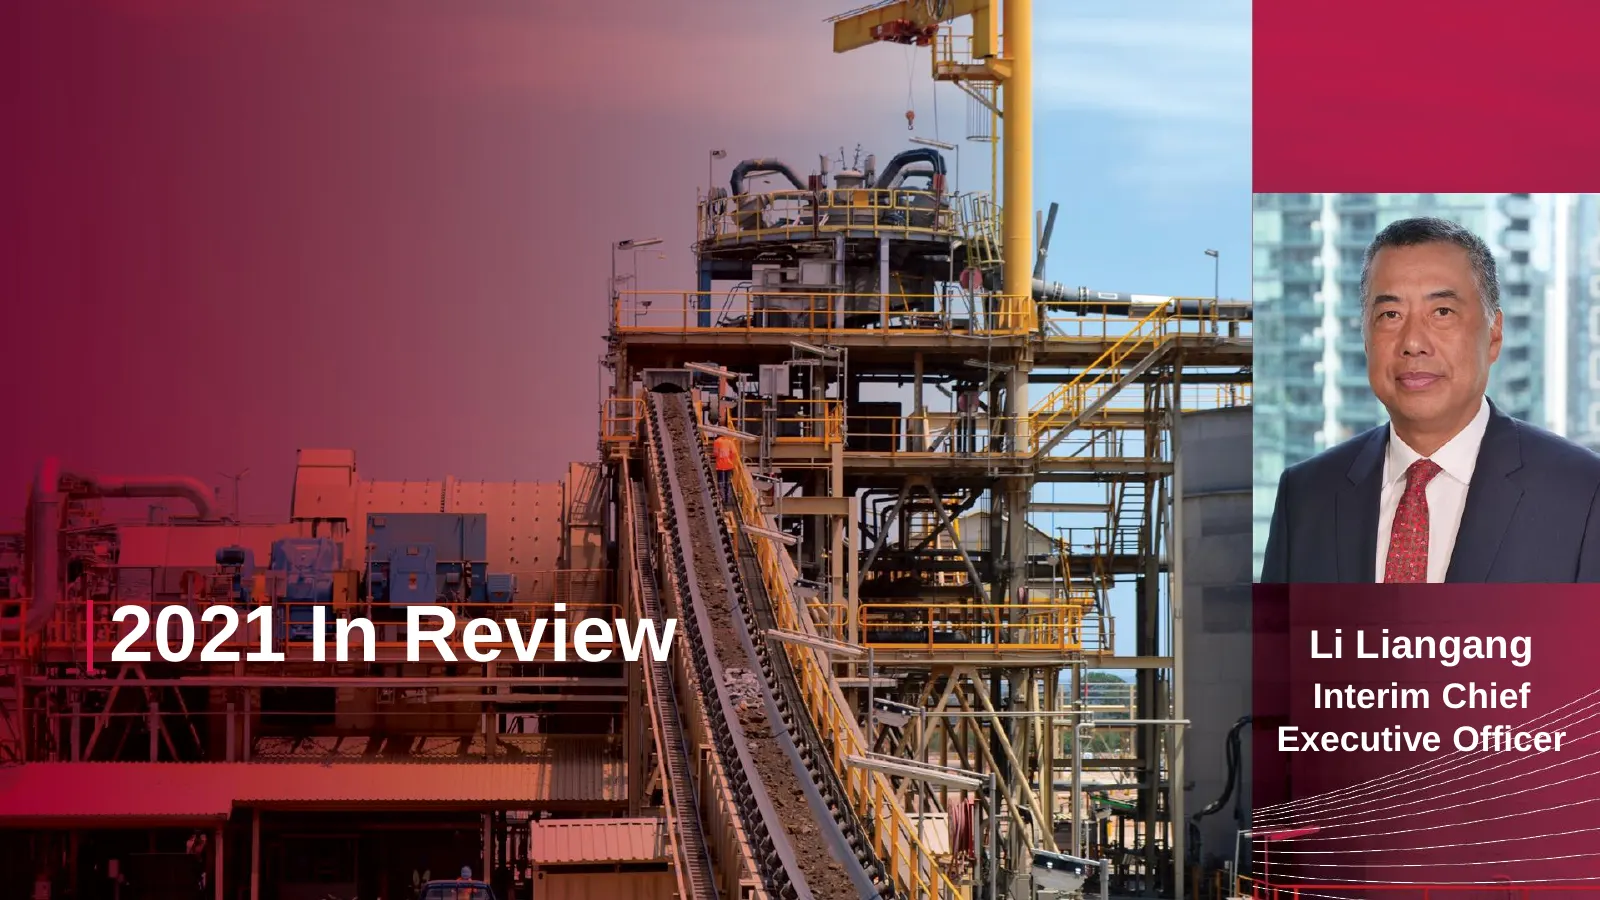
Slide 4: 2021 In Review
2021 In Review Li Liangang Interim Chief Executive Officer
Slide 5: 2021 Scorecard
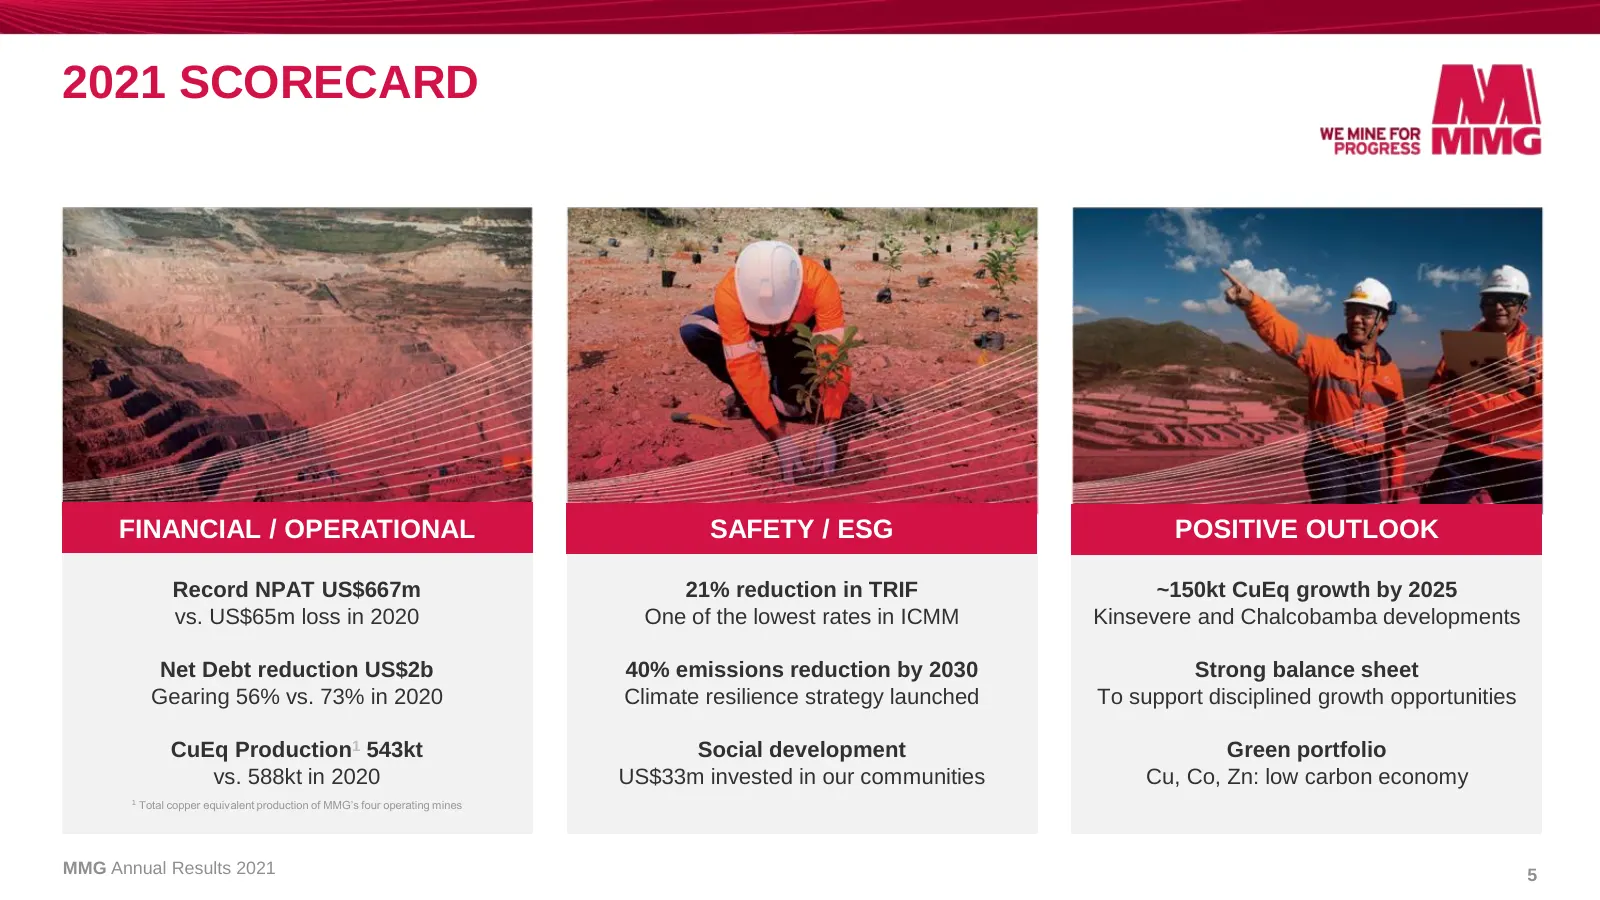
2021 SCORECARD FINANCIAL / OPERATIONAL SAFETY / ESG POSITIVE OUTLOOK Record NPAT US$667m 21% reduction in TRIF ~150kt CuEq growth by 2025 vs. US$65m loss in 2020 One of the lowest rates in ICMM Kinsevere and Chalcobamba developments Net Debt reduction US$2b 40% emissions reduction by 2030 Strong bal
Slide 6: ESG Approach & Safety Performance
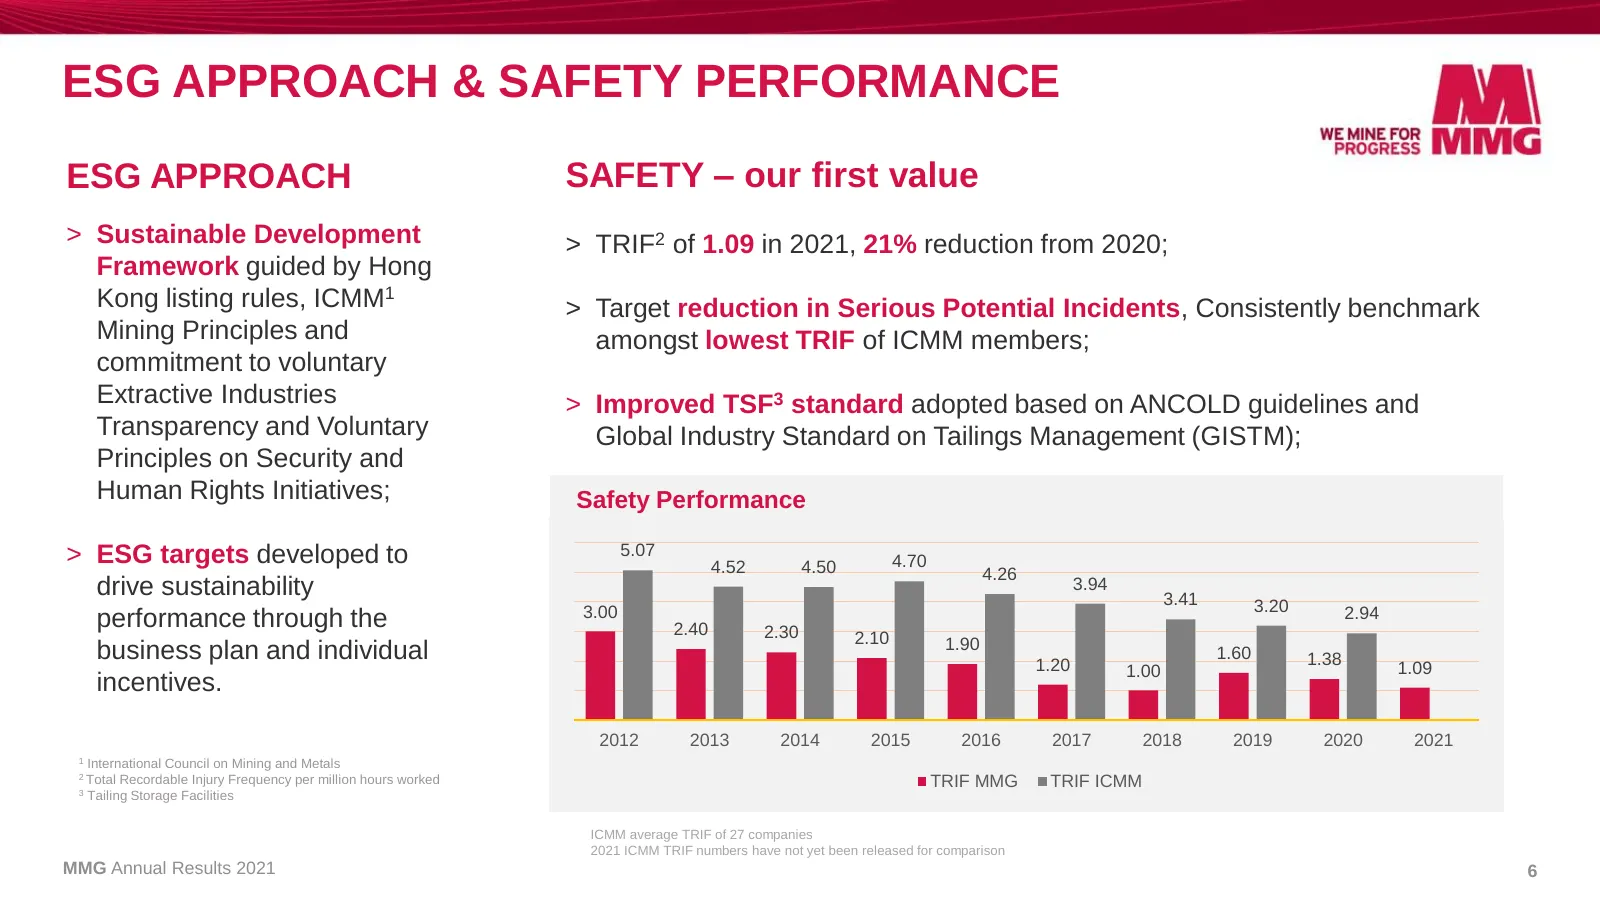
ESG APPROACH & SAFETY PERFORMANCE ESG APPROACH SAFETY – our first value > Sustainable Development > TRIF2 of 1.09 in 2021, 21% reduction from 2020; Framework guided by Hong Kong listing rules, ICMM1 > Target reduction in Serious Potential Incidents, Consistently benchmark Mining Principles and among
Slide 7: Environment & Social Performance
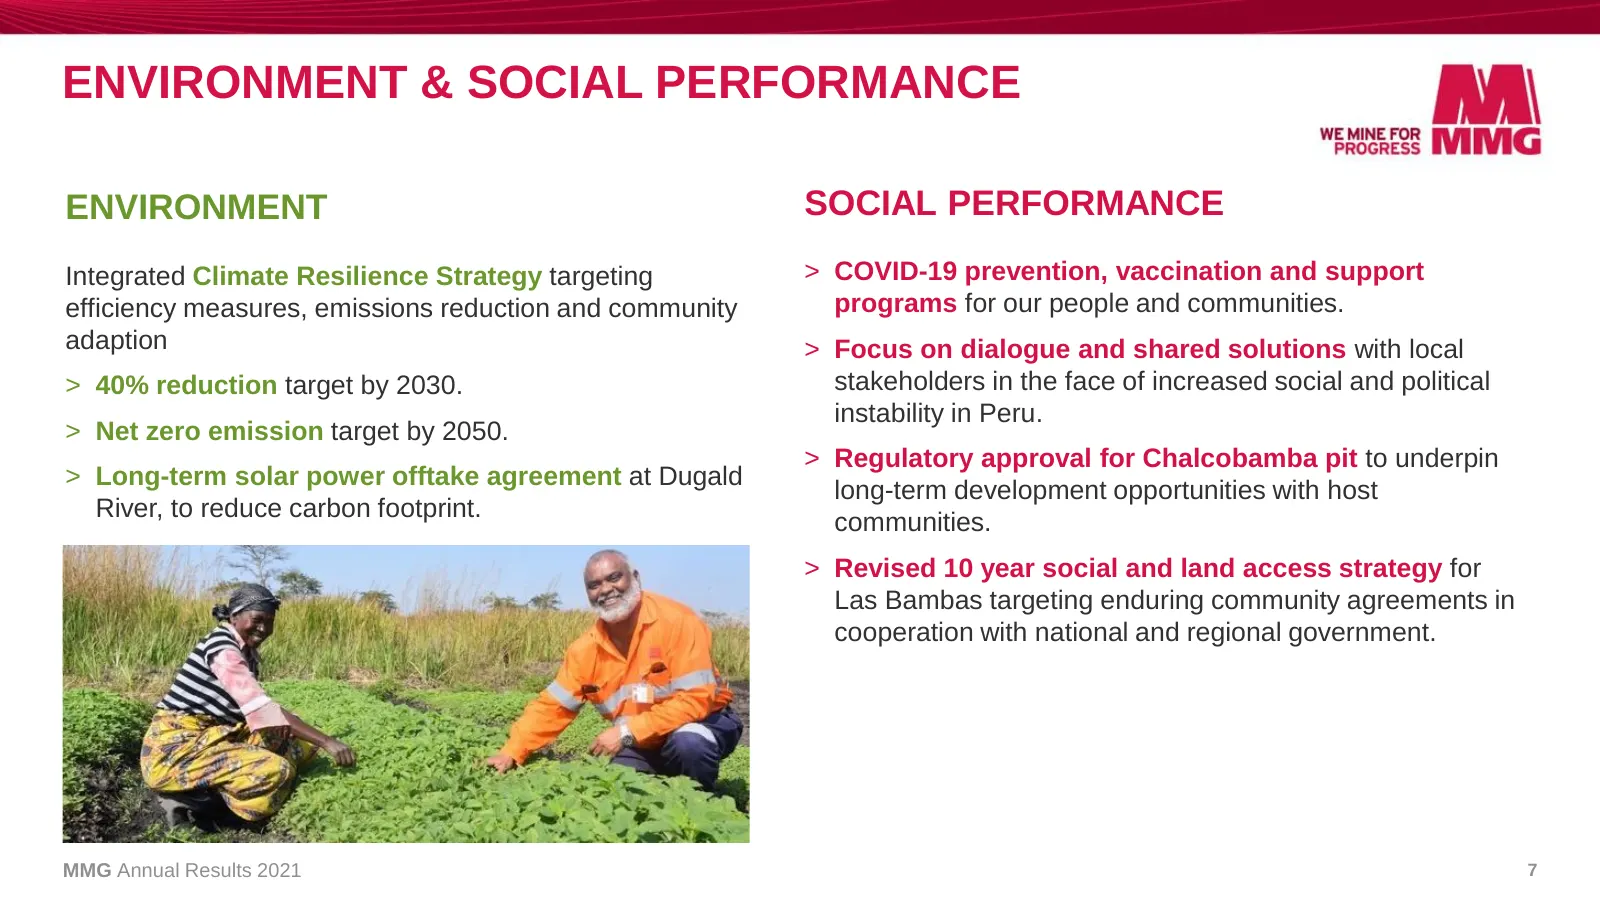
ENVIRONMENT & SOCIAL PERFORMANCE ENVIRONMENT SOCIAL PERFORMANCE Integrated Climate Resilience Strategy targeting > COVID-19 prevention, vaccination and support efficiency measures, emissions reduction and community programs for our people and communities. adaption > Focus on dialogue and shared solu
Slide 8: Managing the Challenges of Concentrate Transport
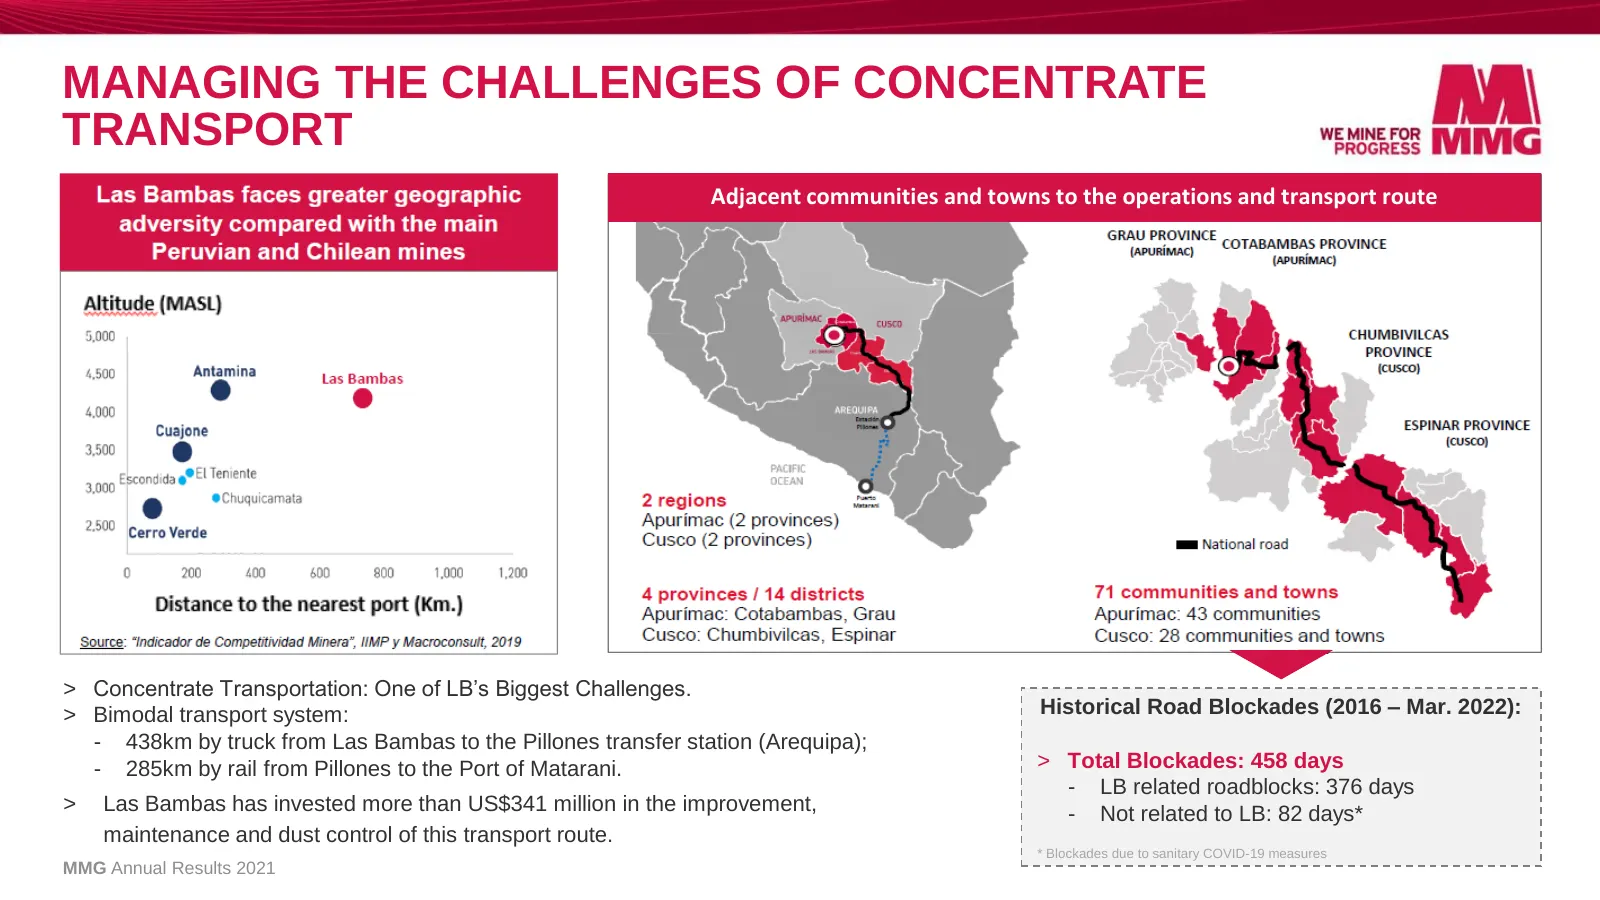
MANAGING THE CHALLENGES OF CONCENTRATE TRANSPORT Adjacent communities and towns to the operations and transport route > Concentrate Transportation: One of LB’s Biggest Challenges. > Bimodal transport system: Historical Road Blockades (2016 – Mar. 2022): - 438km by truck from Las Bambas to the Pillon
Slide 9: Financial Results
Financial Results Ross Carroll Chief Financial Officer
Slide 10: Financial Performance
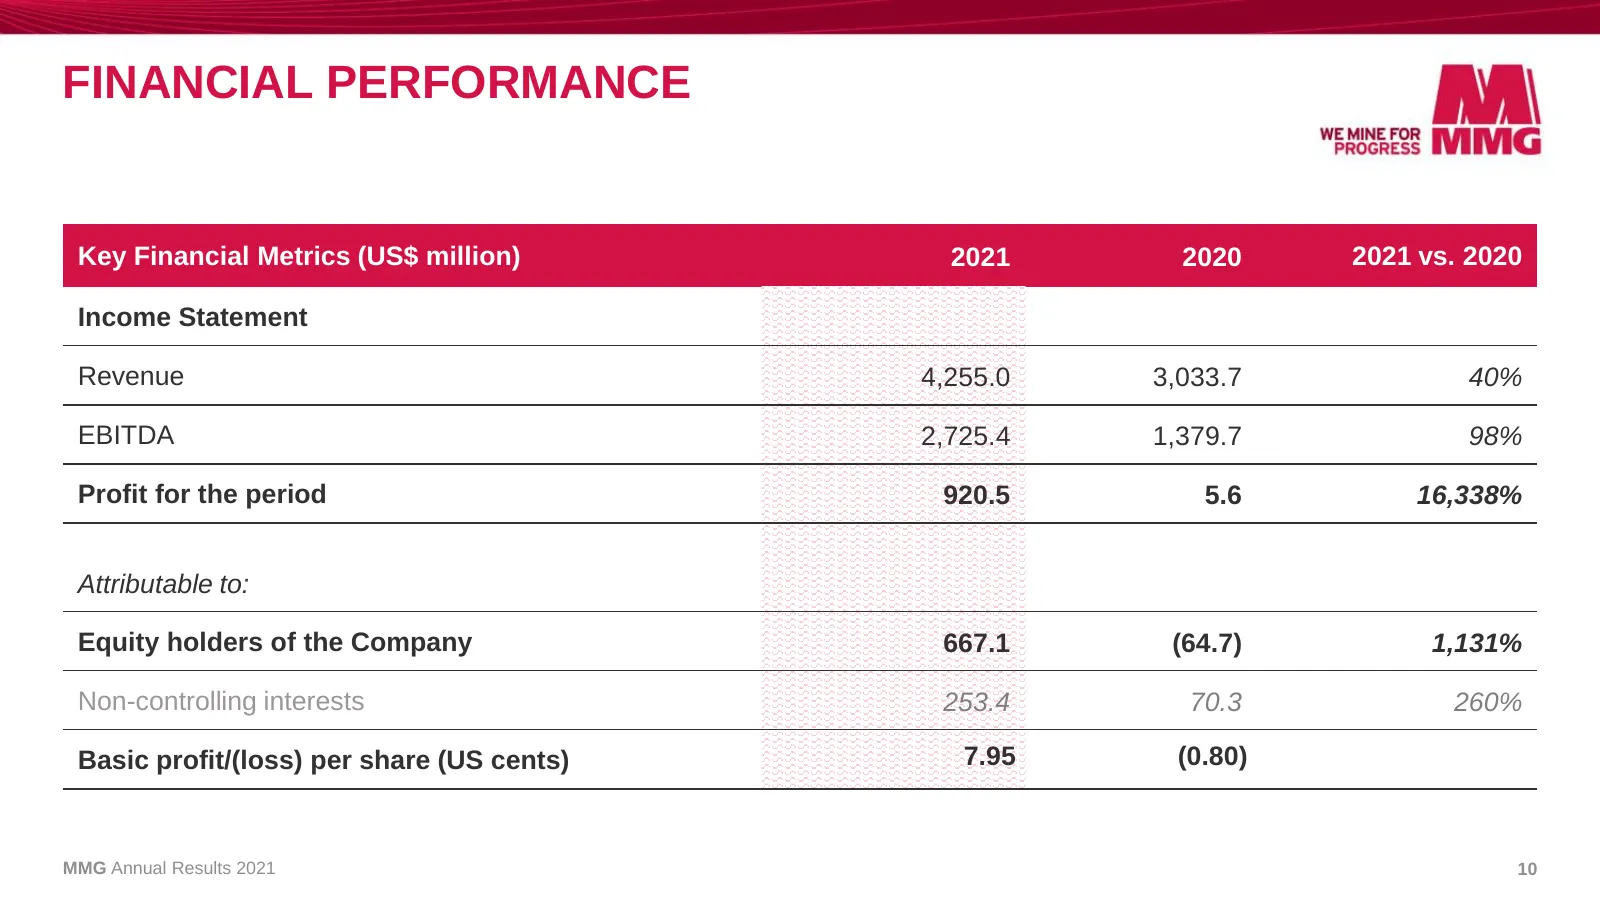
FINANCIAL PERFORMANCE Key Financial Metrics (US$ million) 2021 2020 2021 vs. 2020 Income Statement Revenue 4,255.0 3,033.7 40% EBITDA 2,725.4 1,379.7 98% Profit for the period 920.5 5.6 16,338% Attributable to: Equity holders of the Company 667.1 (64.7) 1,131% Non-controlling interests 253.4 70.3 26
Slide 11: EBITDA Waterfall
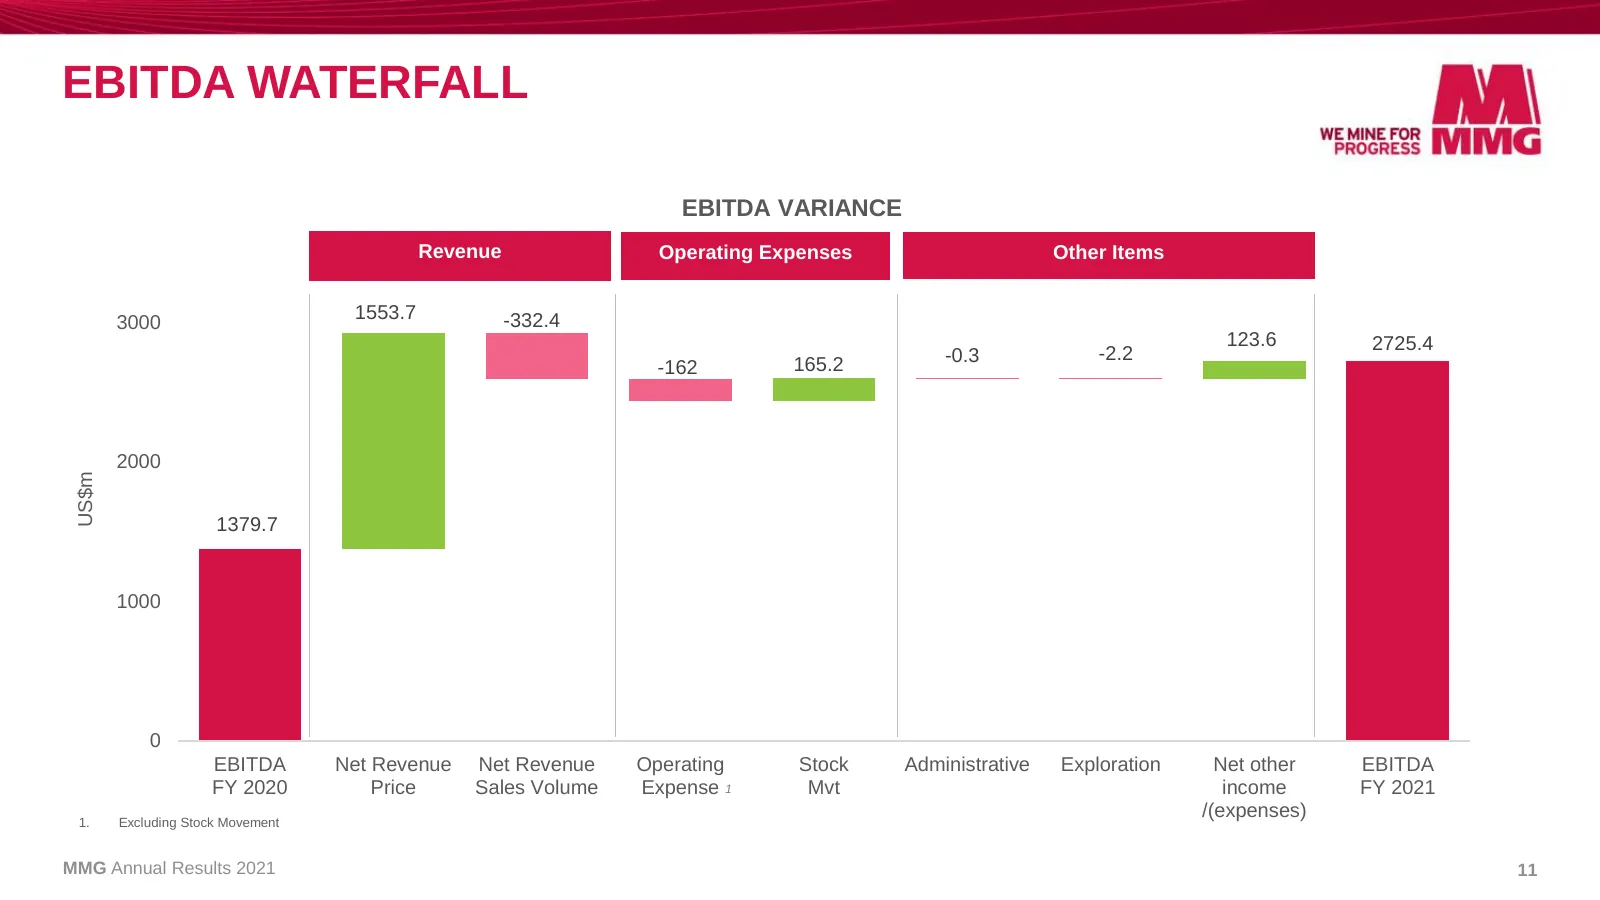
EBITDA WATERFALL EBITDA VARIANCE Revenue Operating Expenses Other Items 3000 1553.7 -332.4 123.6 2725.4 -0.3 -2.2 -162 165.2 2000 US$m 1379.7 1000 0 EBITDA Net Revenue Net Revenue Operating Stock Administrative Exploration Net other EBITDA FY 2020 Price Sales Volume Expense 1 Mvt income FY 2021 /(ex
Slide 12: Net Debt Reduced by $2.0 Billion
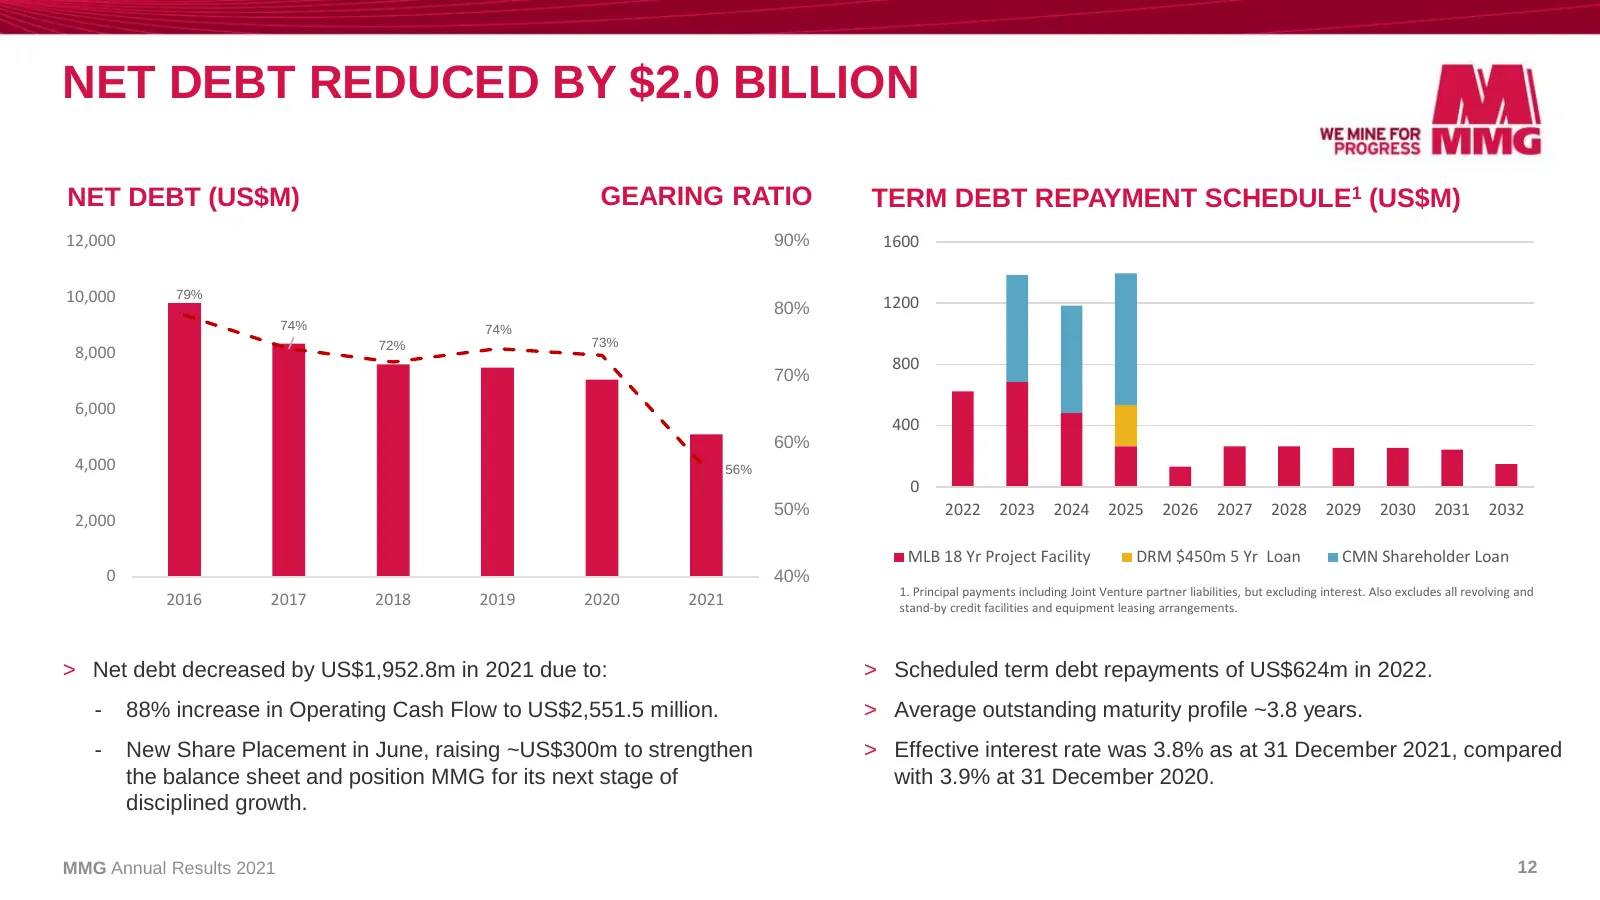
NET DEBT REDUCED BY $2.0 BILLION NET DEBT (US$M) GEARING RATIO TERM DEBT REPAYMENT SCHEDULE1 (US$M) 12,000 90% 1600 10,000 79% 1200 80% 74% 74% 72% 73% 8,000 800 70% 6,000 400 60% 4,000 56% 0 50% 2022 2023 2024 2025 2026 2027 2028 2029 2030 2031 2032 2,000 MLB 18 Yr Project Facility DRM $450m 5 Yr L
Slide 13: Capital Expenditure Outlook
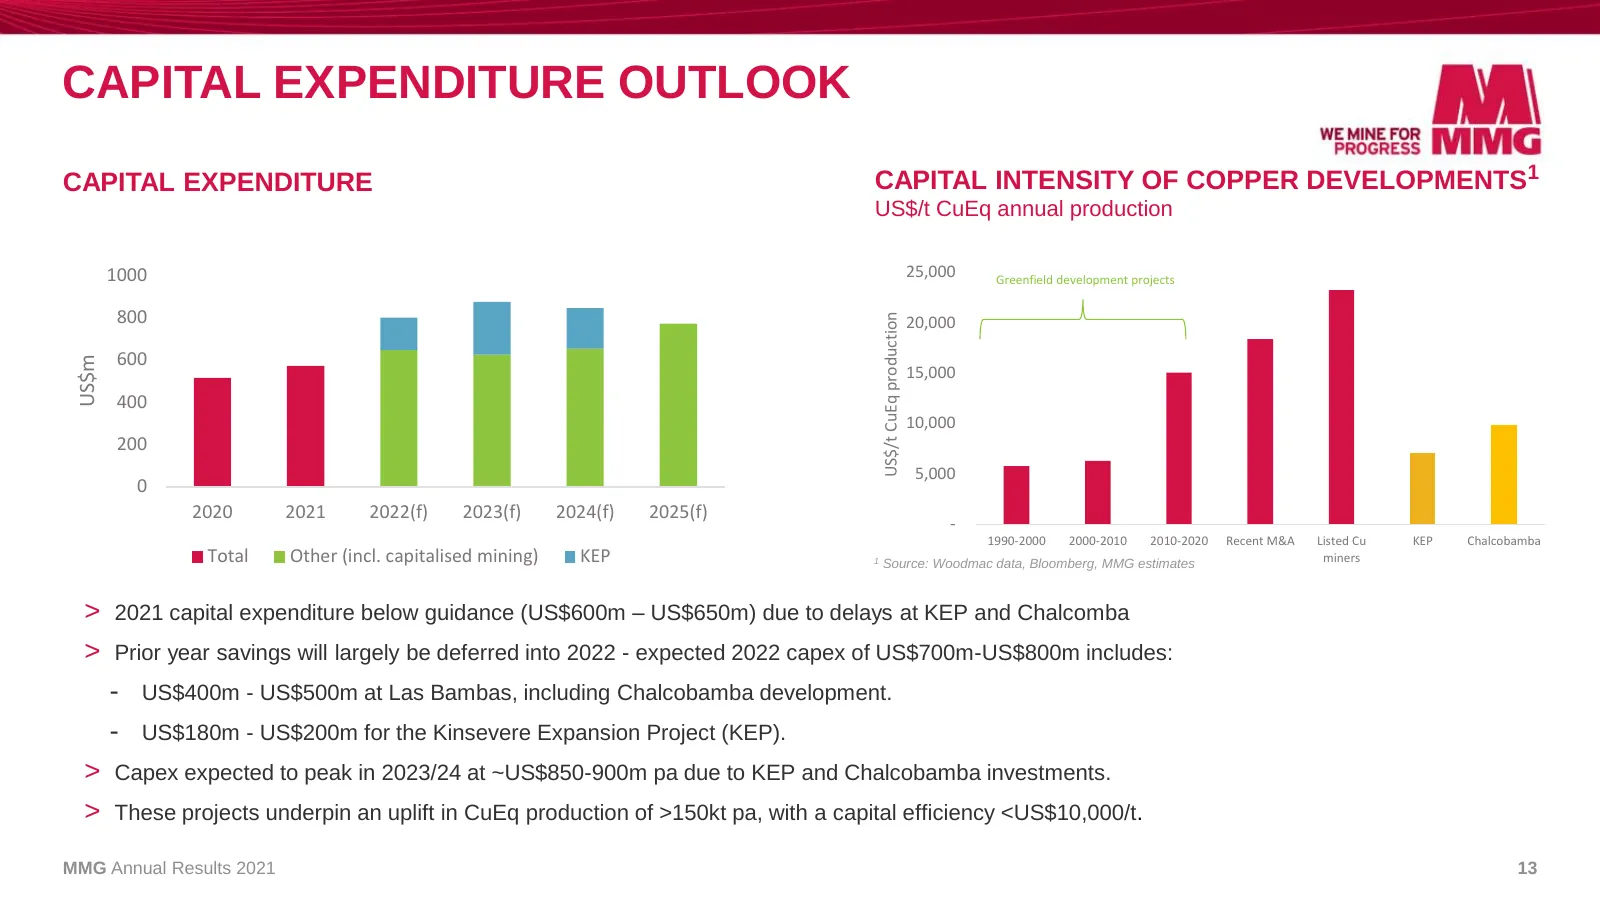
CAPITAL EXPENDITURE OUTLOOK CAPITAL EXPENDITURE CAPITAL INTENSITY OF COPPER DEVELOPMENTS1 US$/t CuEq annual production 1000 25,000 Greenfield development projects 800 US$/t CuEq production 20,000 600 US$m 15,000 400 10,000 200 5,000 0 2020 2021 2022(f) 2023(f) 2024(f) 2025(f) - 1990-2000 2000-2010 2
Slide 14: Commodity Price Sensitivity
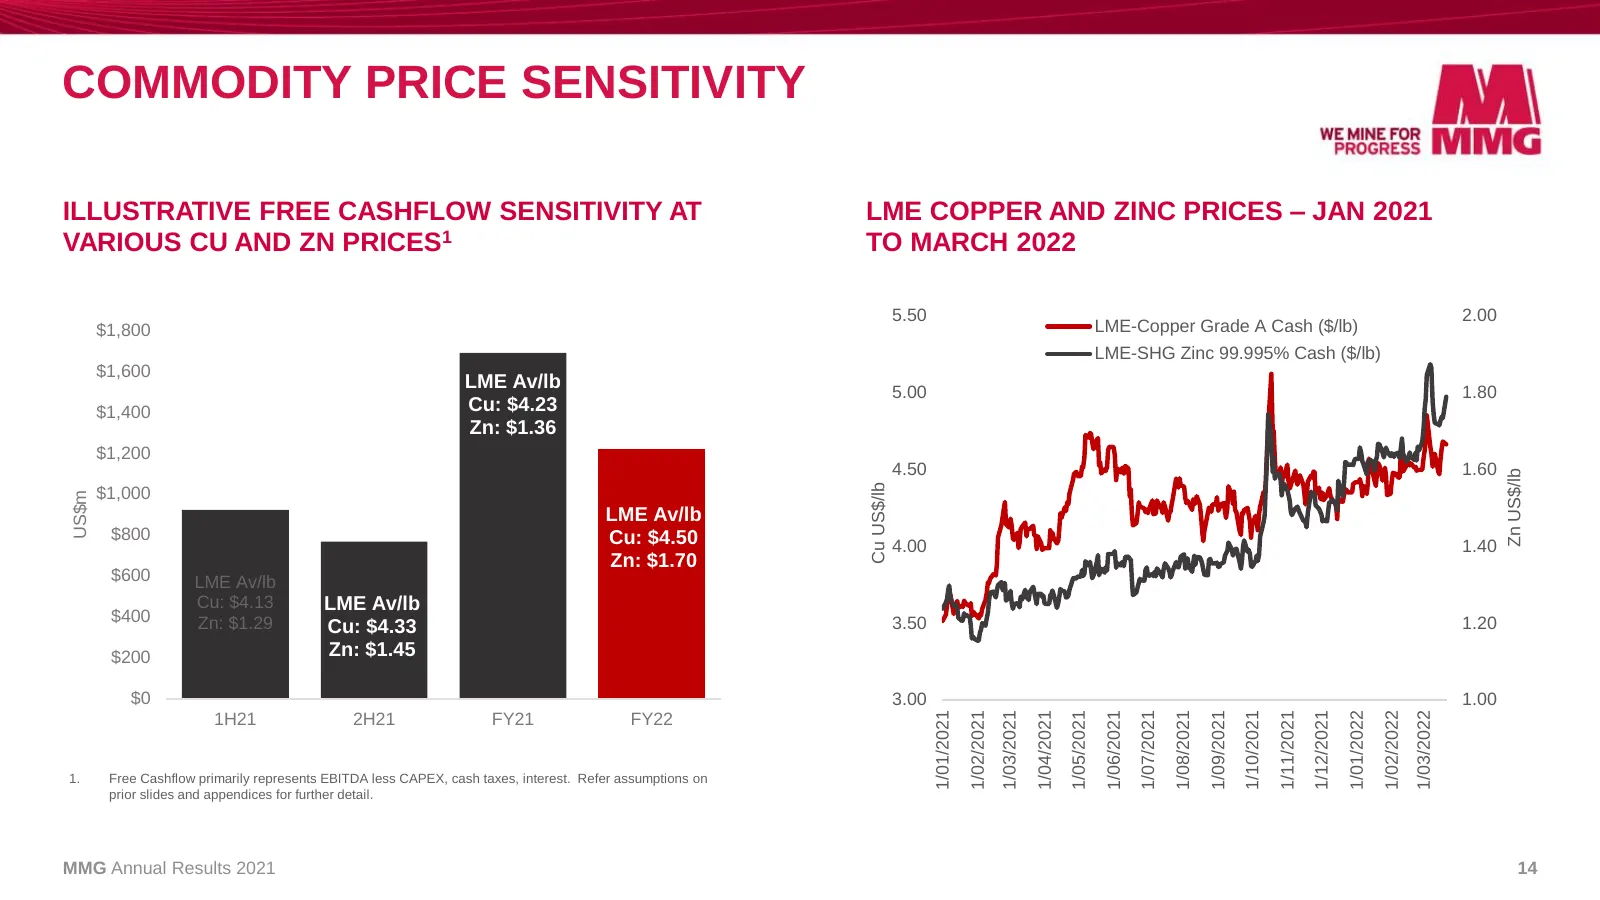
COMMODITY PRICE SENSITIVITY ILLUSTRATIVE FREE CASHFLOW SENSITIVITY AT LME COPPER AND ZINC PRICES – JAN 2021 VARIOUS CU AND ZN PRICES1 TO MARCH 2022 5.50 2.00 $1,800 LME-Copper Grade A Cash ($/lb) LME-SHG Zinc 99.995% Cash ($/lb) $1,600 LME Av/lb 5.00 1.80 $1,400 Cu: $4.23 Zn: $1.36 $1,200 4.50 1.60
Slide 15: Las Bambas
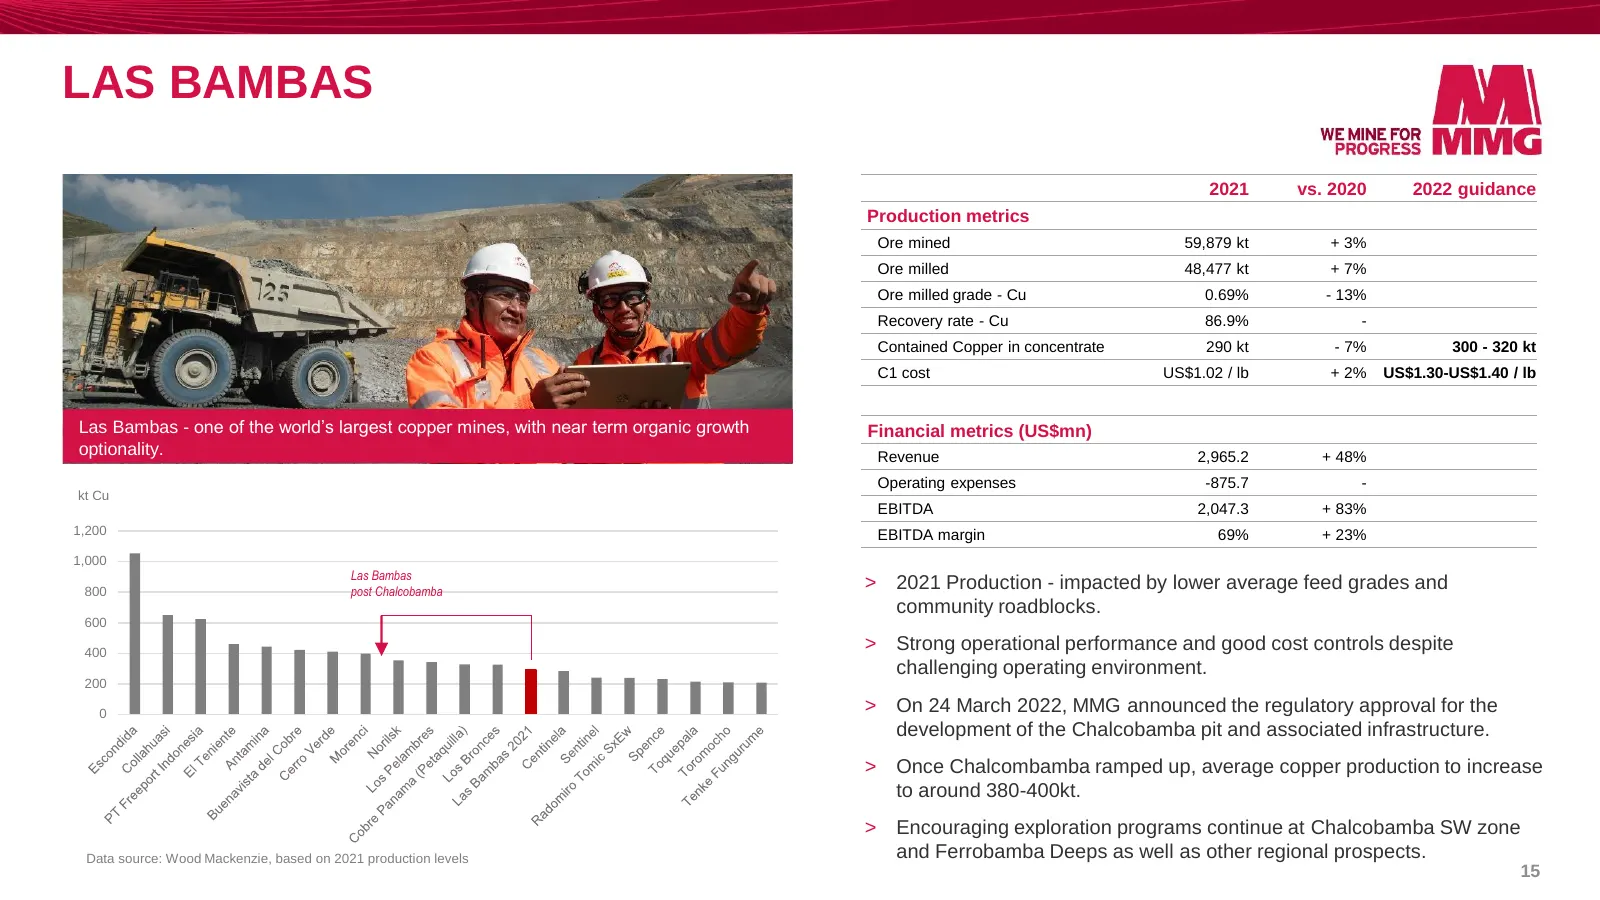
LAS BAMBAS 2021 vs. 2020 2022 guidance Production metrics Ore mined 59,879 kt + 3% Ore milled 48,477 kt + 7% Ore milled grade - Cu 0.69% - 13% Recovery rate - Cu 86.9% - Contained Copper in concentrate 290 kt - 7% 300 - 320 kt C1 cost US$1.02 / lb + 2% US$1.30-US$1.40 / lb Las Bambas - one of the wo
Slide 16: Kinsevere
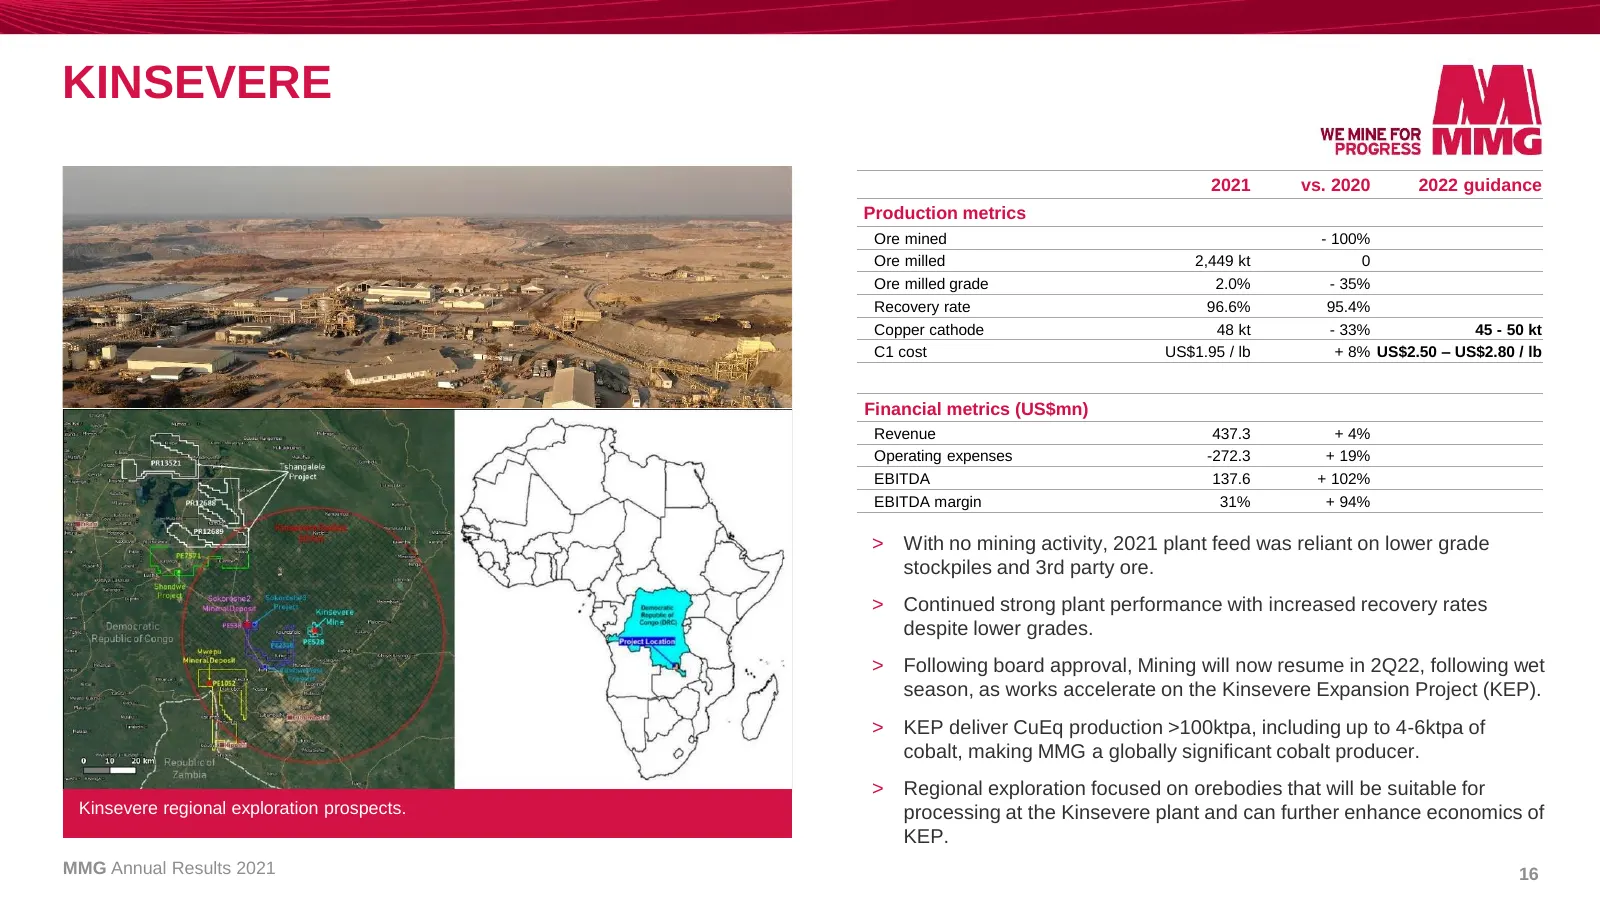
KINSEVERE 2021 vs. 2020 2022 guidance Production metrics Ore mined - 100% Ore milled 2,449 kt 0 Ore milled grade 2.0% - 35% Recovery rate 96.6% 95.4% Copper cathode 48 kt - 33% 45 - 50 kt C1 cost US$1.95 / lb + 8% US$2.50 – US$2.80 / lb Financial metrics (US$mn) Revenue 437.3 + 4% Operating expenses
Slide 17: Dugald River
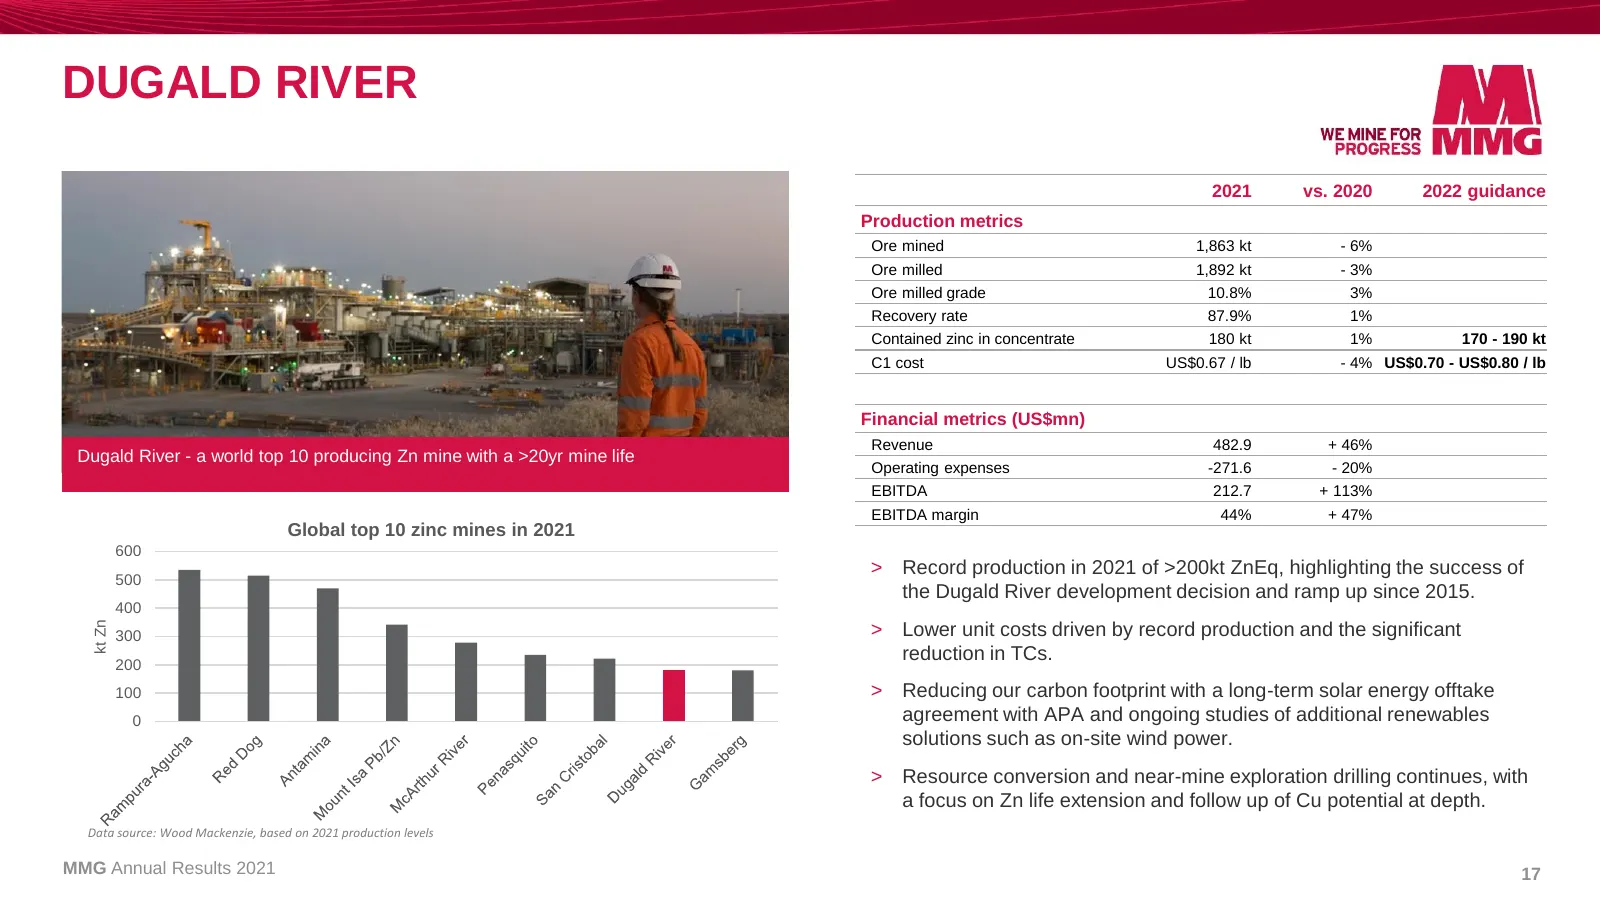
DUGALD RIVER 2021 vs. 2020 2022 guidance Production metrics Ore mined 1,863 kt - 6% Ore milled 1,892 kt - 3% Ore milled grade 10.8% 3% Recovery rate 87.9% 1% Contained zinc in concentrate 180 kt 1% 170 - 190 kt C1 cost US$0.67 / lb - 4% US$0.70 - US$0.80 / lb Financial metrics (US$mn) Revenue 482.9
Slide 18: Rosebery
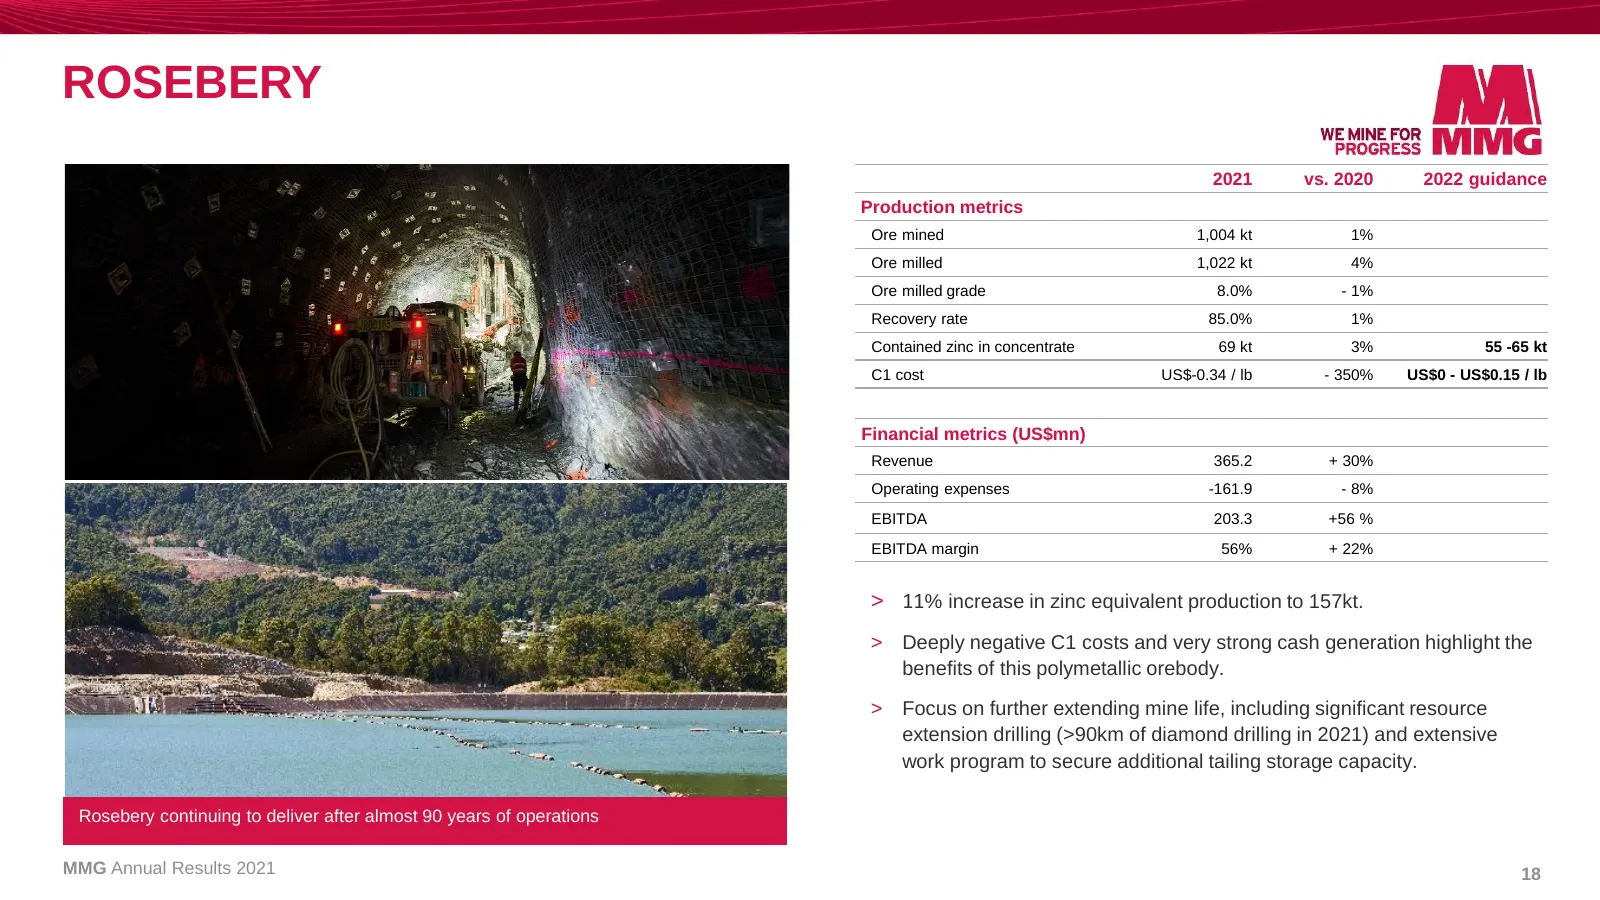
ROSEBERY 2021 vs. 2020 2022 guidance Production metrics Ore mined 1,004 kt 1% Ore milled 1,022 kt 4% Ore milled grade 8.0% - 1% Recovery rate 85.0% 1% Contained zinc in concentrate 69 kt 3% 55 -65 kt C1 cost US$-0.34 / lb - 350% US$0 - US$0.15 / lb Financial metrics (US$mn) Revenue 365.2 + 30% Opera
Slide 19: 2022 Strategy and Outlook
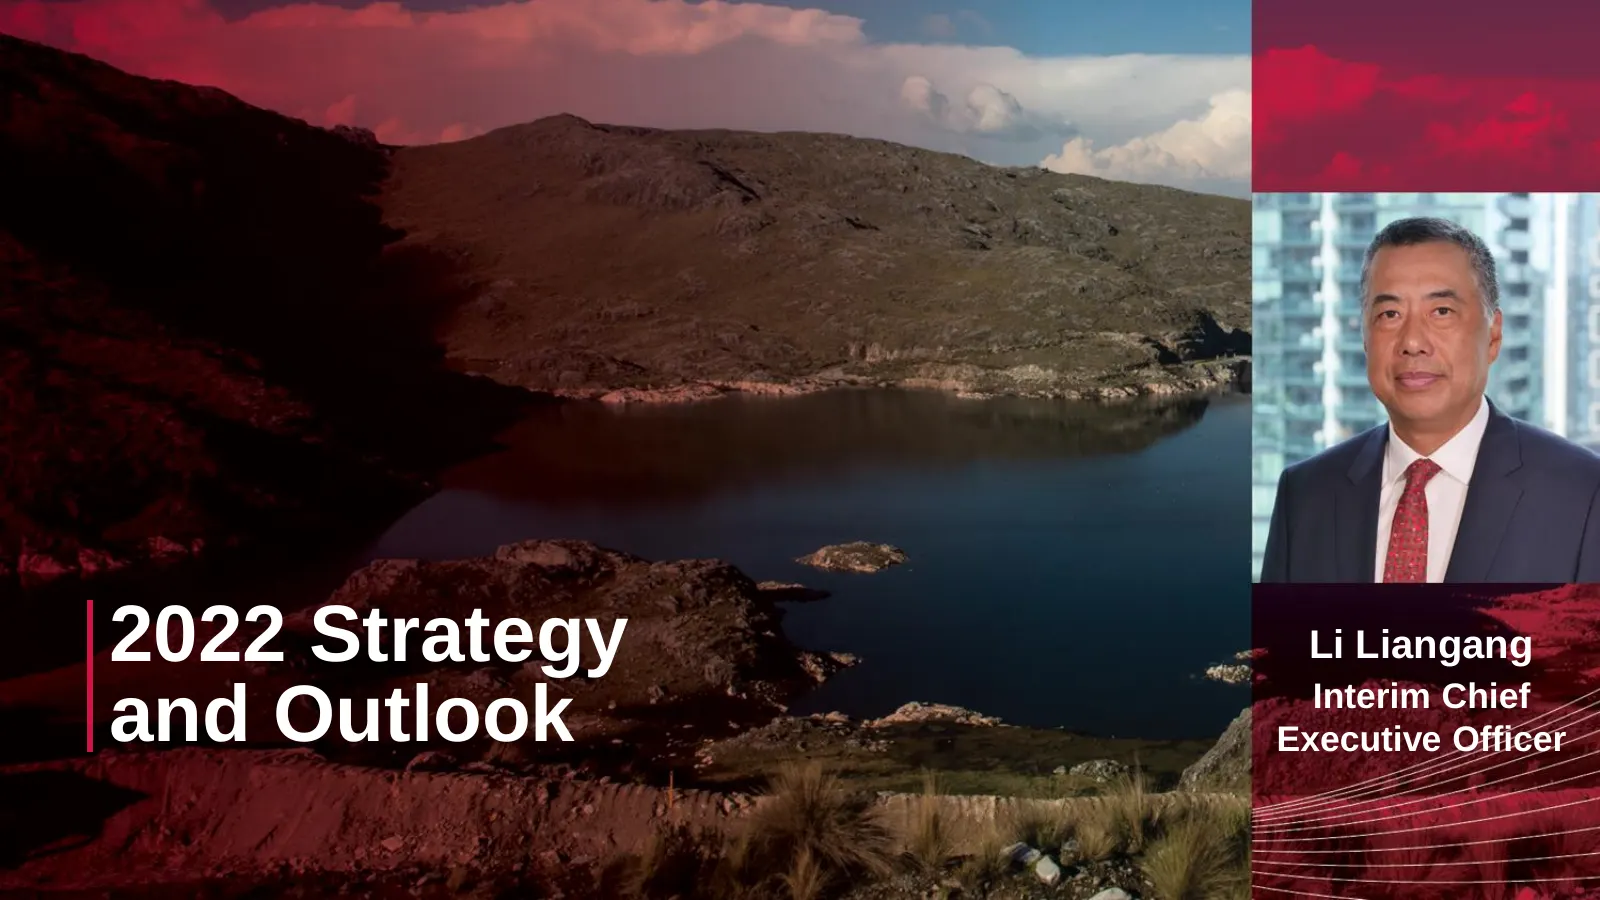
2022 Strategy Li Liangang Interim Chief and Outlook Executive Officer
Slide 20: KEP and Chalcobamba Development Add >150kt CuEq Growth by 2025
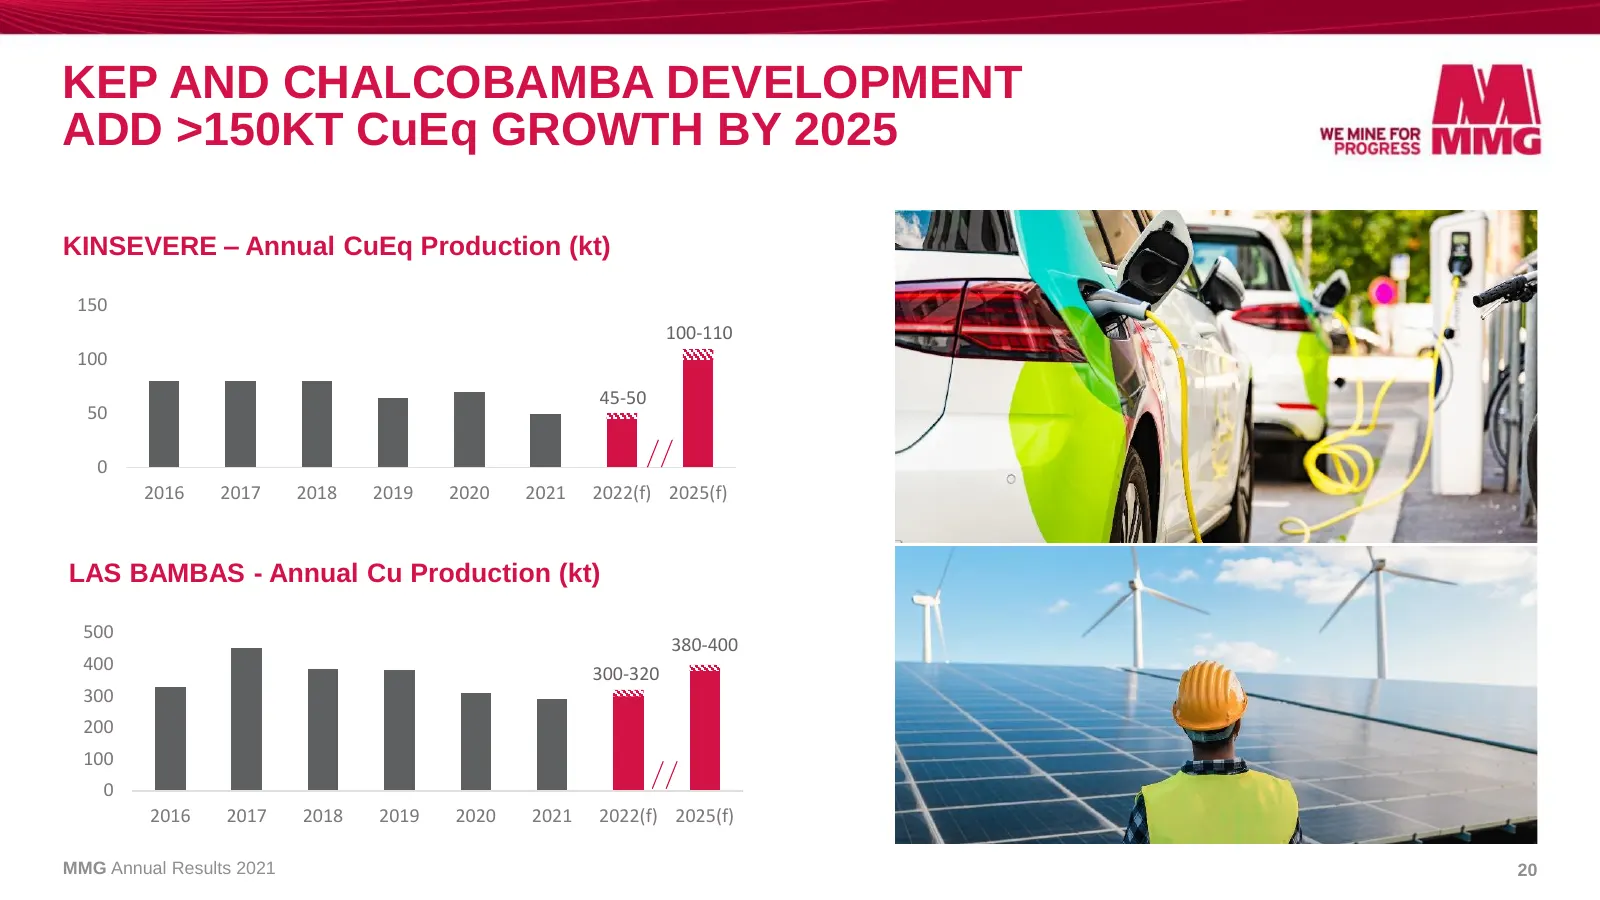
KEP AND CHALCOBAMBA DEVELOPMENT ADD >150KT CuEq GROWTH BY 2025 KINSEVERE – Annual CuEq Production (kt) 150 100-110 100 45-50 50 0 2016 2017 2018 2019 2020 2021 2022(f) 2025(f) LAS BAMBAS - Annual Cu Production (kt) 500 380-400 400 300-320 300 200 100 0 2016 2017 2018 2019 2020 2021 2022(f) 2025(f) M
Slide 21: Our Commodities Are Essential for a Low-Carbon Future
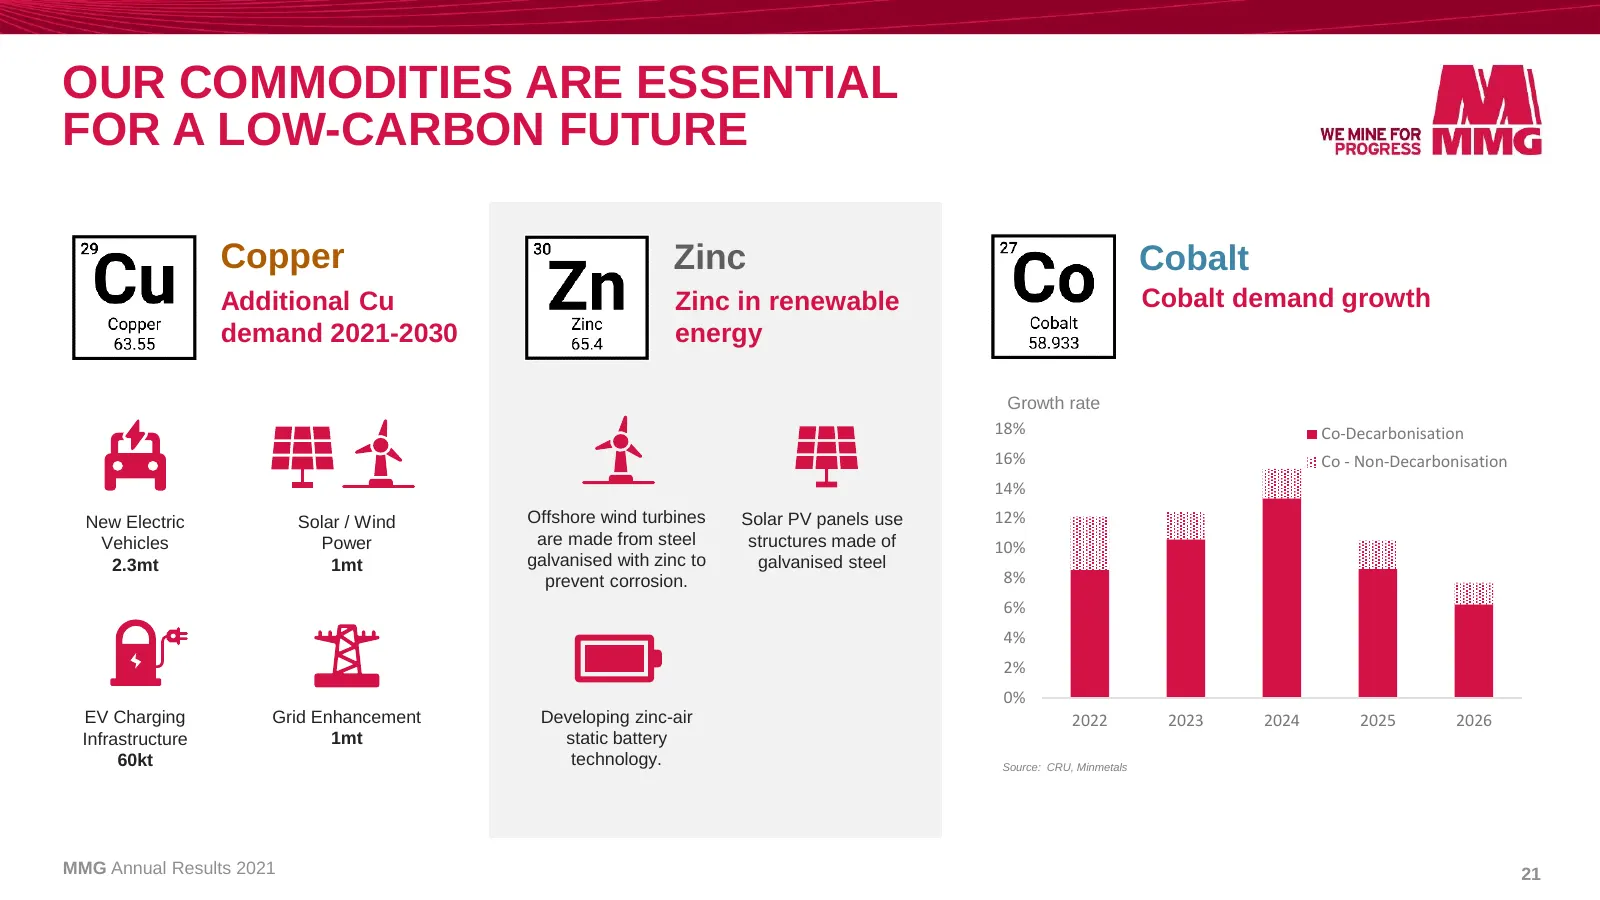
OUR COMMODITIES ARE ESSENTIAL FOR A LOW-CARBON FUTURE Copper Zinc Cobalt Additional Cu Zinc in renewable Cobalt demand growth demand 2021-2030 energy Growth rate 18% Co-Decarbonisation 16% Co - Non-Decarbonisation 14% New Electric Solar / Wind Offshore wind turbines Solar PV panels use 12% Vehicles
Slide 22: 2021 Annual Results Q&A
2021 Annual Result Len Q&A
Slide 23: Appendix
Appendix
Slide 24: MMG Asset Base and 2022 Guidance
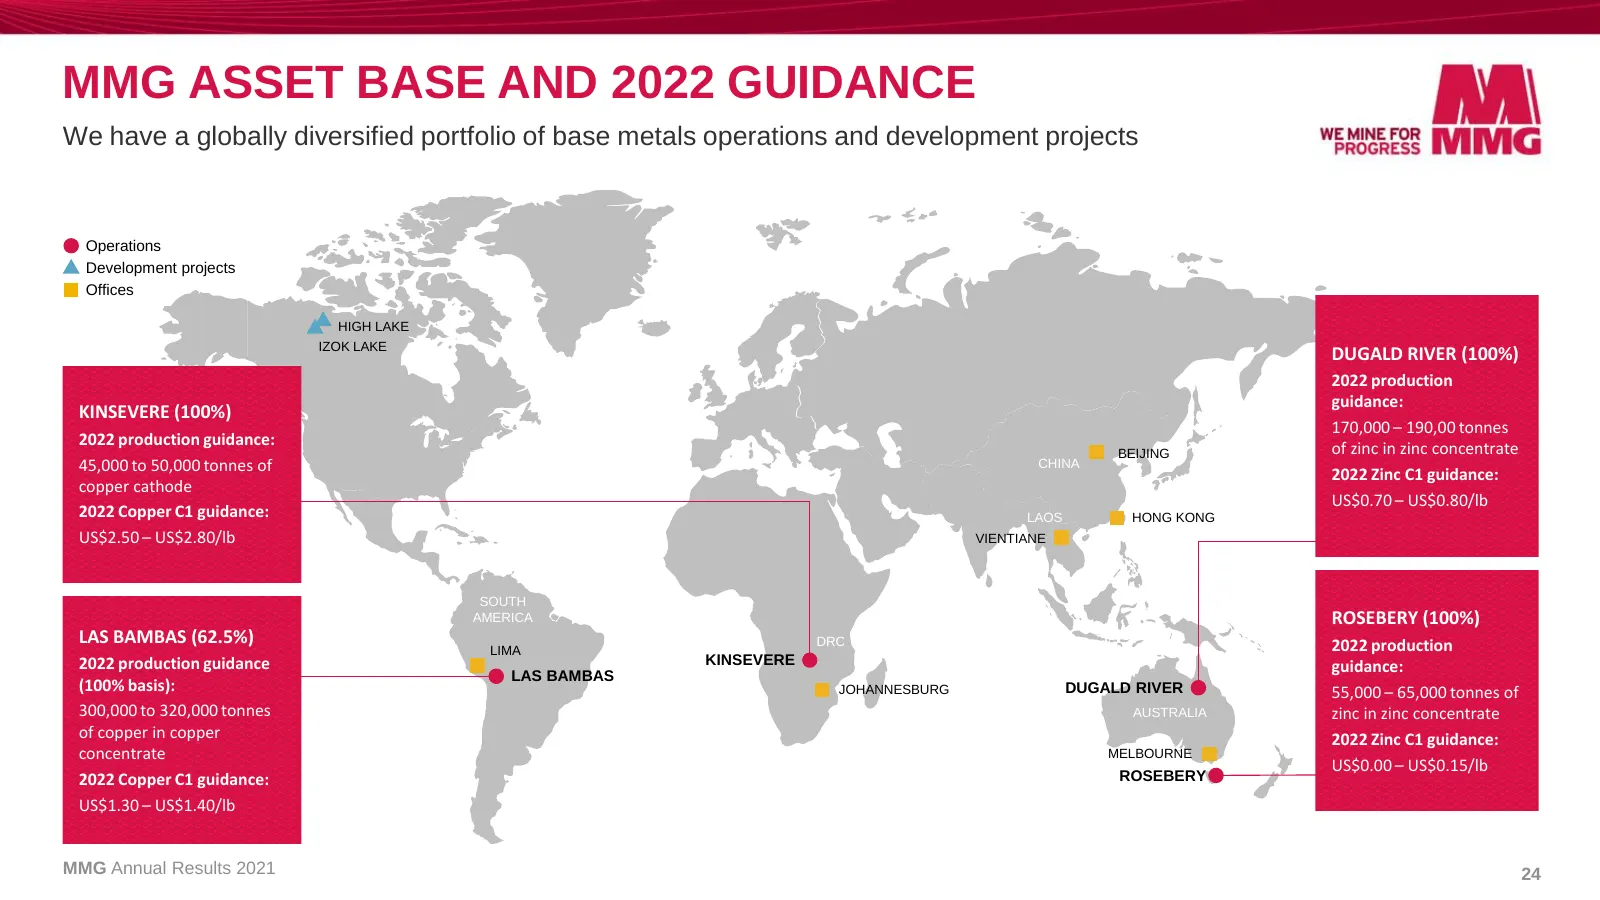
MMG ASSET BASE AND 2022 GUIDANCE We have a globally diversified portfolio of base metals operations and development projects Operations Development projects Offices HIGH LAKE IZOK LAKE DUGALD RIVER (100%) 2022 production guidance: KINSEVERE (100%) 170,000 – 190,00 tonnes 2022 production guidance: BE
Slide 25: Earnings Sensitivity to Commodity Price and FX
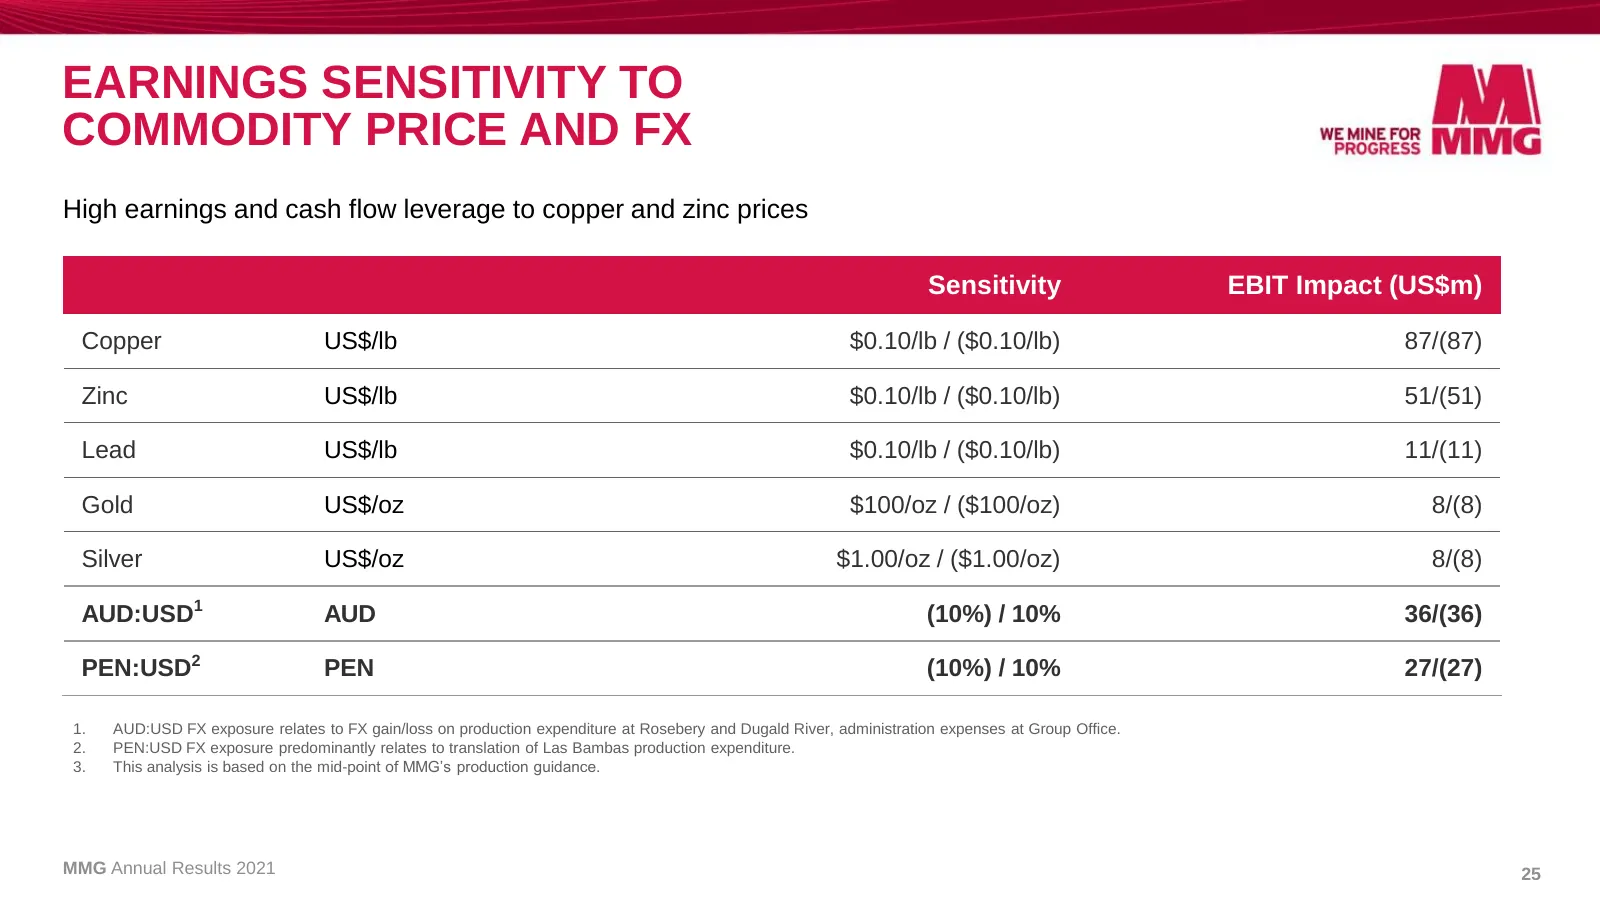
EARNINGS SENSITIVITY TO COMMODITY PRICE AND FX High earnings and cash flow leverage to copper and zinc prices Sensitivity EBIT Impact (US$m) Copper US$/lb $0.10/lb / ($0.10/lb) 87/(87) Zinc US$/lb $0.10/lb / ($0.10/lb) 51/(51) Lead US$/lb $0.10/lb / ($0.10/lb) 11/(11) Gold US$/oz $100/oz / ($100/oz)
Slide 26: 2022 Illustrative Spot EBITDA & FCF
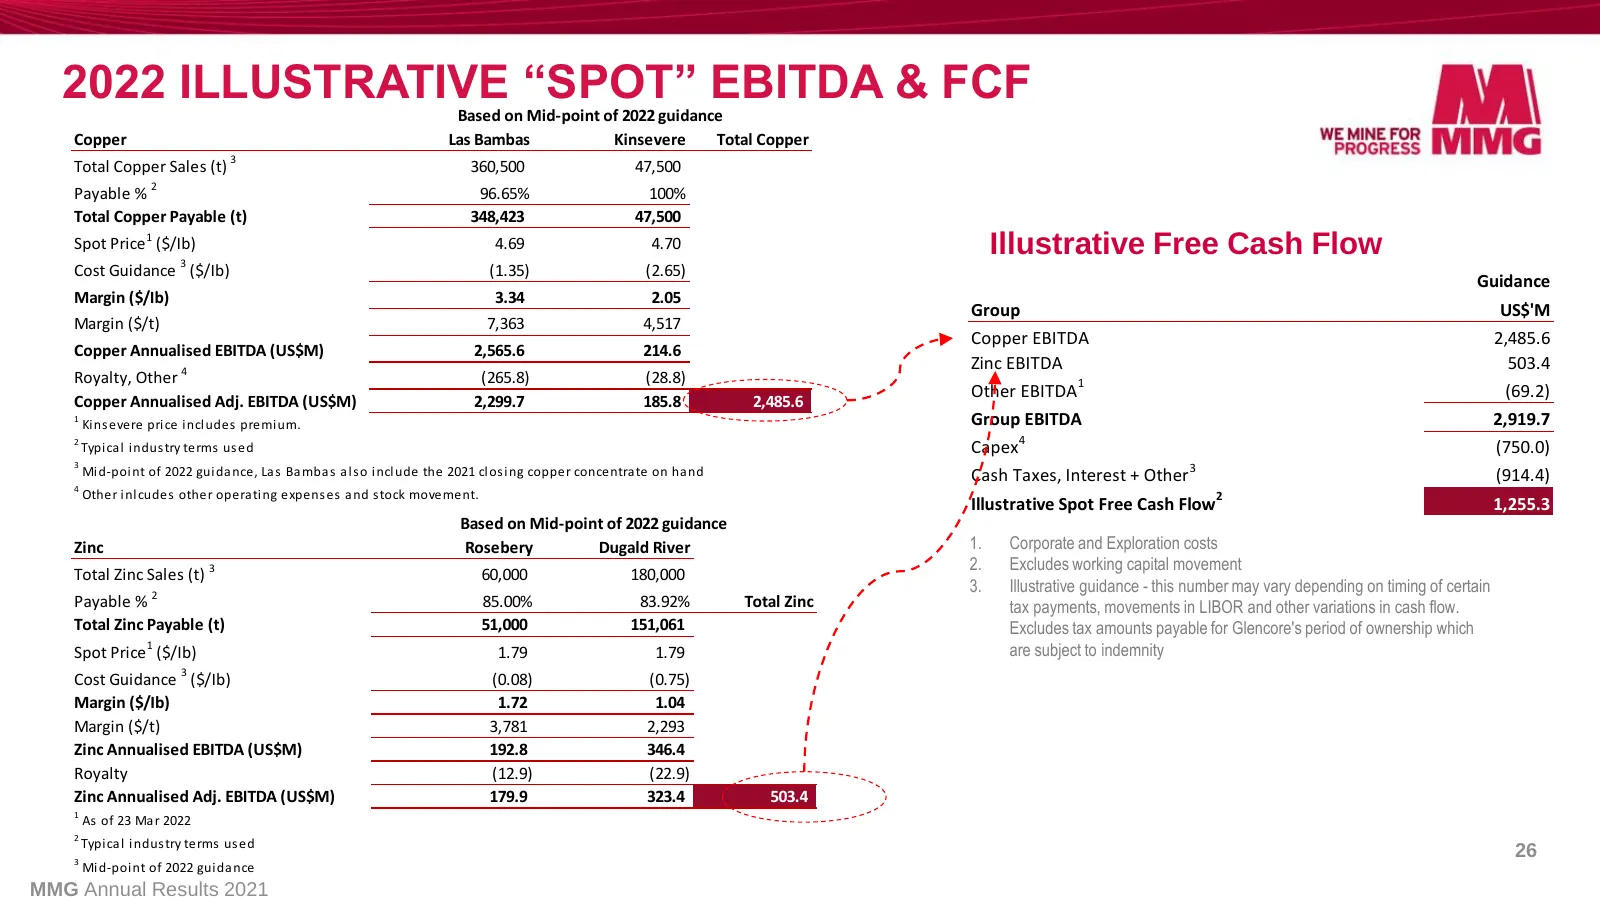
2022 ILLUSTRATIVE “SPOT” EBITDA & FCF Based on Mid-point of 2022 guidance Copper Las Bambas Kinsevere Total Copper Total Copper Sales (t) 3 360,500 47,500 Payable % 2 96.65% 100% Total Copper Payable (t) 348,423 47,500 Spot Price 1 ($/Ib) 4.69 4.70 Illustrative Free Cash Flow Cost Guidance 3 ($/Ib)
Slide 27: Profit to MMG Equity Holders
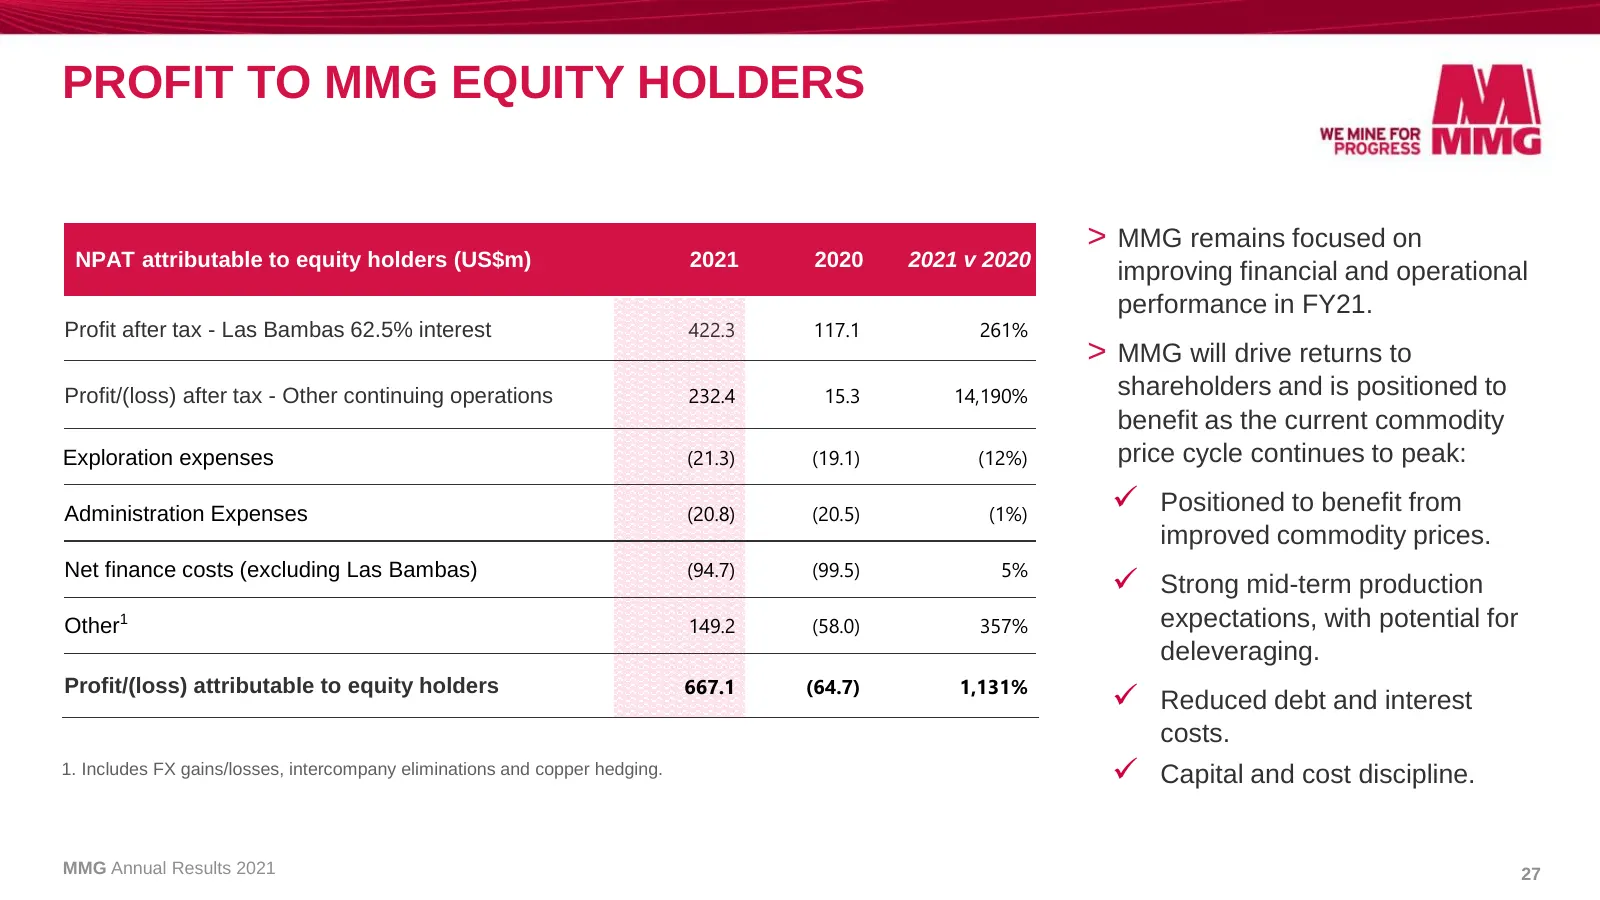
PROFIT TO MMG EQUITY HOLDERS > MMG remains focused on NPAT attributable to equity holders (US$m) 2021 2020 2021 v 2020 improving financial and operational performance in FY21. Profit after tax - Las Bambas 62.5% interest 422.3 117.1 261% > MMG will drive returns to Profit/(loss) after tax - Other co
Slide 28: Kinsevere Expansion Project
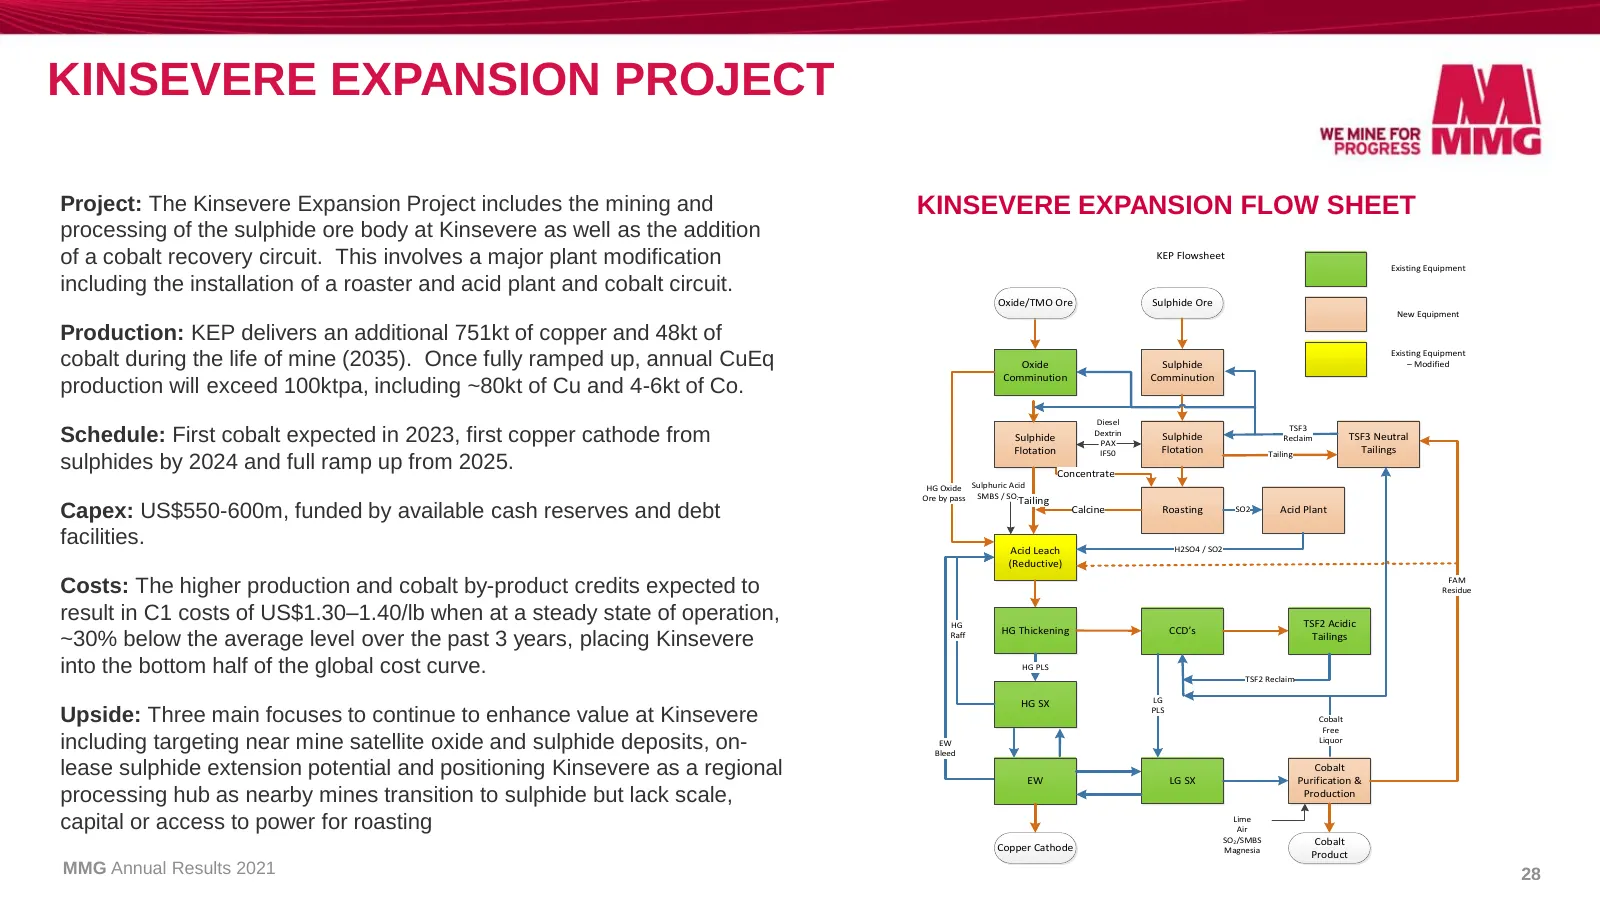
KINSEVERE EXPANSION PROJECT Project: The Kinsevere Expansion Project includes the mining and KINSEVERE EXPANSION FLOW SHEET processing of the sulphide ore body at Kinsevere as well as the addition of a cobalt recovery circuit. This involves a major plant modification KEP Flowsheet Existing Equipment
Slide 29: Chalcobamba Development
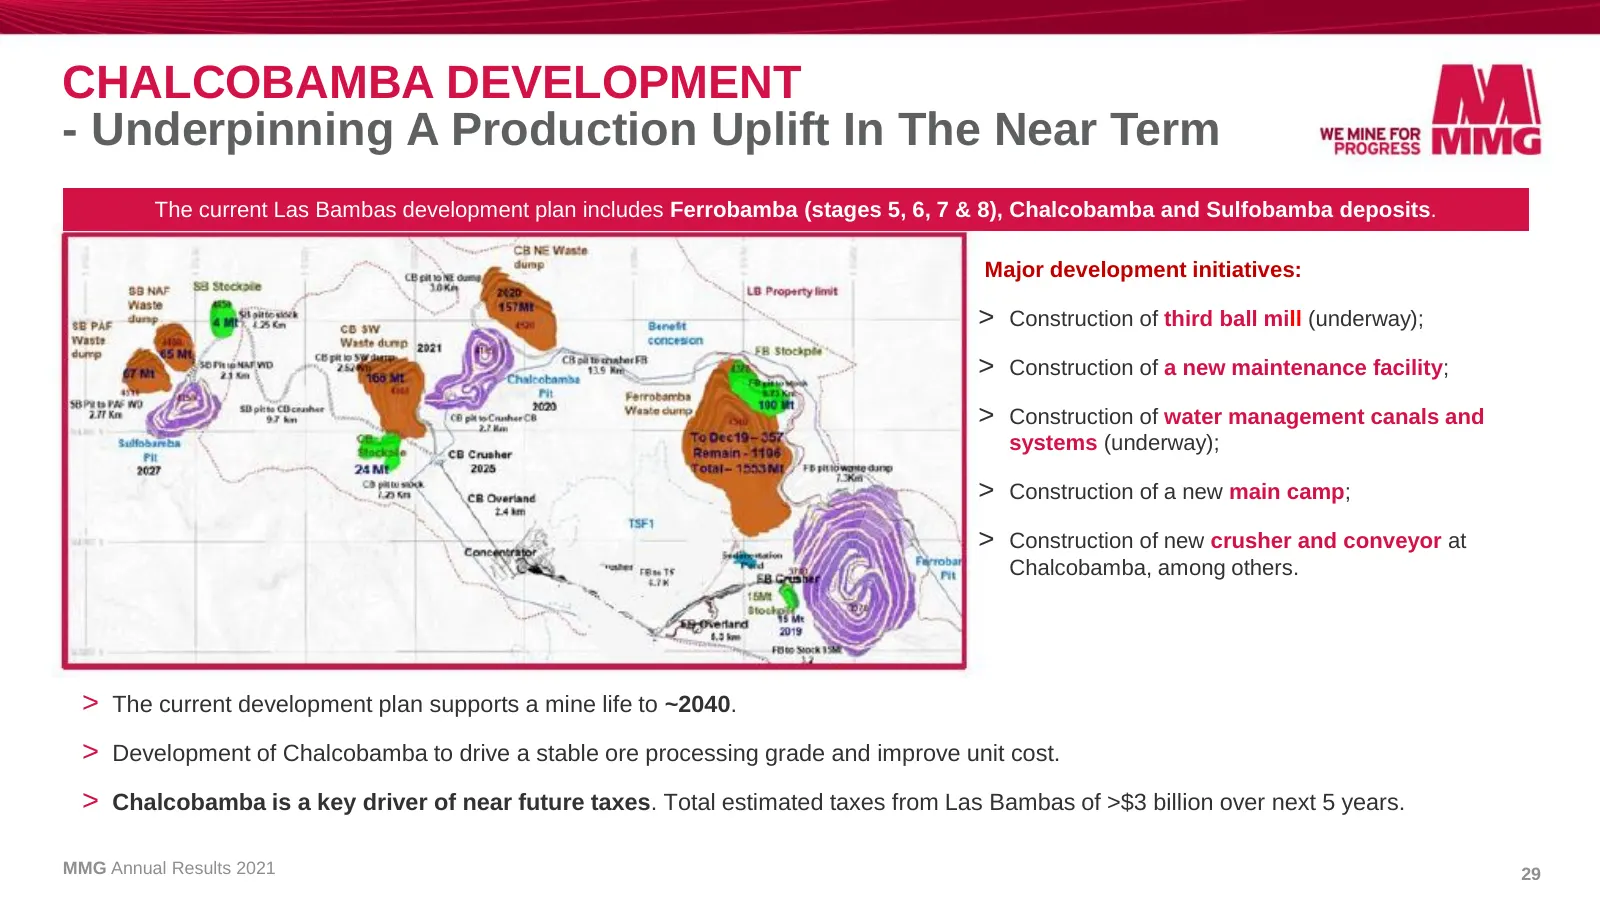
CHALCOBAMBA DEVELOPMENT - Underpinning A Production Uplift In The Near Term The current Las Bambas development plan includes Ferrobamba (stages 5, 6, 7 & 8), Chalcobamba and Sulfobamba deposits. Major development initiatives: > Construction of third ball mill (underway); > Construction of a new main
Slide 30: Financial Dashboard
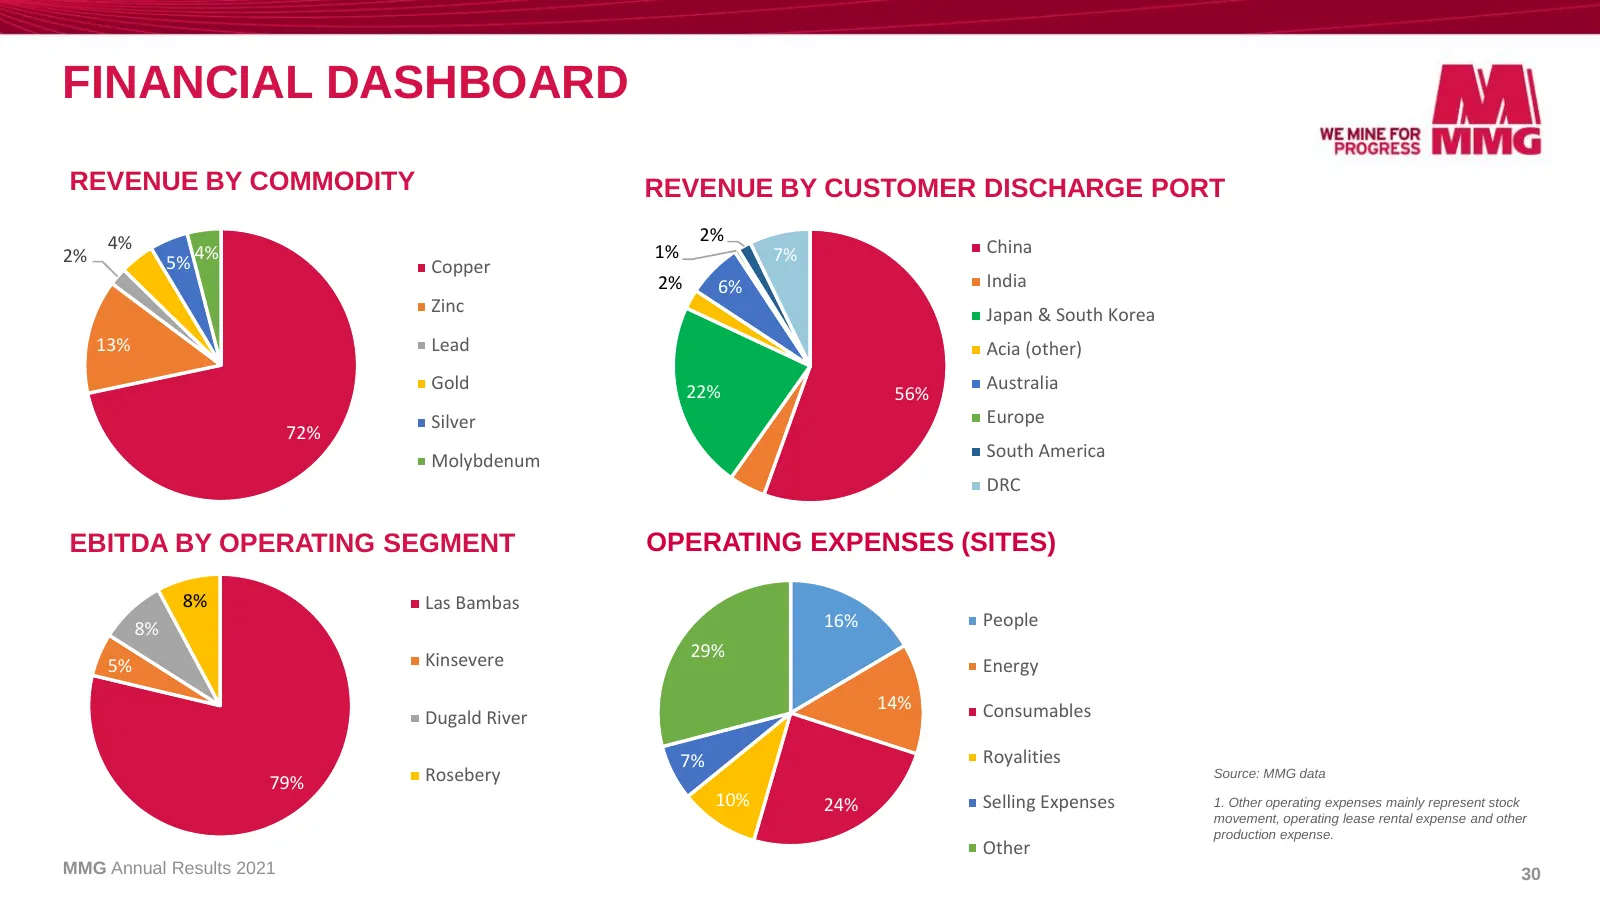
FINANCIAL DASHBOARD REVENUE BY COMMODITY REVENUE BY CUSTOMER DISCHARGE PORT 4% 2% 1% China 2% 5% 4% Copper 7% 2% 6% India Zinc Japan & South Korea 13% Lead Acia (other) Gold 22% Australia 56% Silver Europe 72% Molybdenum South America DRC 4% EBITDA BY OPERATING SEGMENT OPERATING EXPENSES (SITES) 8%
Slide 31: Las Bambas 2021 Performance
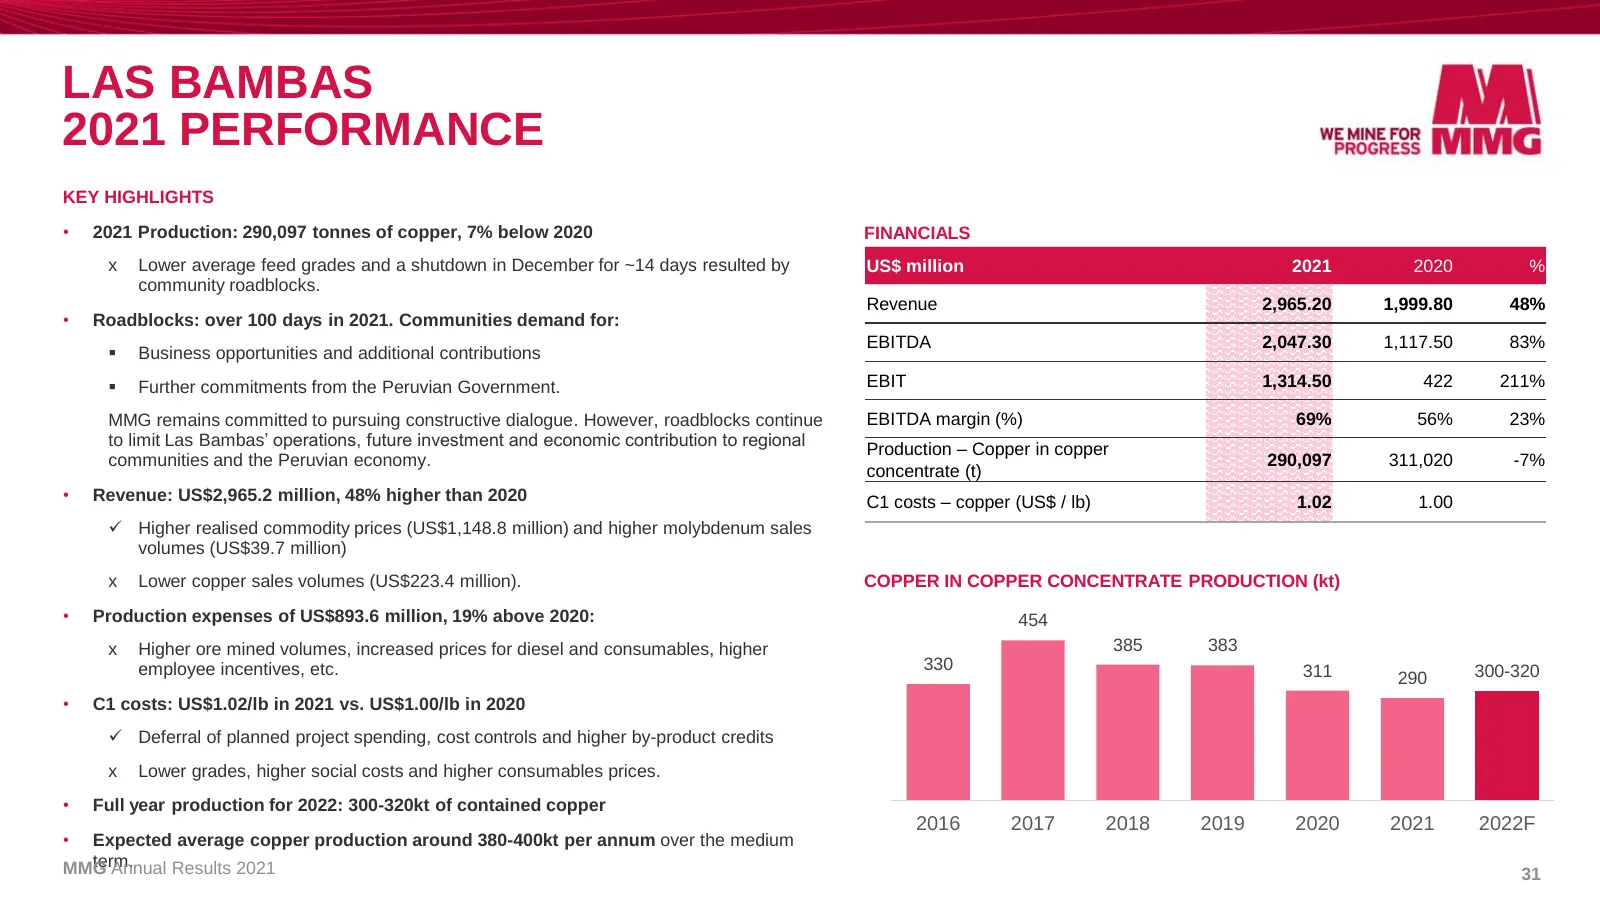
LAS BAMBAS 2021 PERFORMANCE KEY HIGHLIGHTS • 2021 Production: 290,097 tonnes of copper, 7% below 2020 FINANCIALS x Lower average feed grades and a shutdown in December for ~14 days resulted by US$ million 2021 2020 % community roadblocks. Revenue 2,965.20 1,999.80 48% • Roadblocks: over 100 days in
Slide 32: Kinsevere 2021 Performance
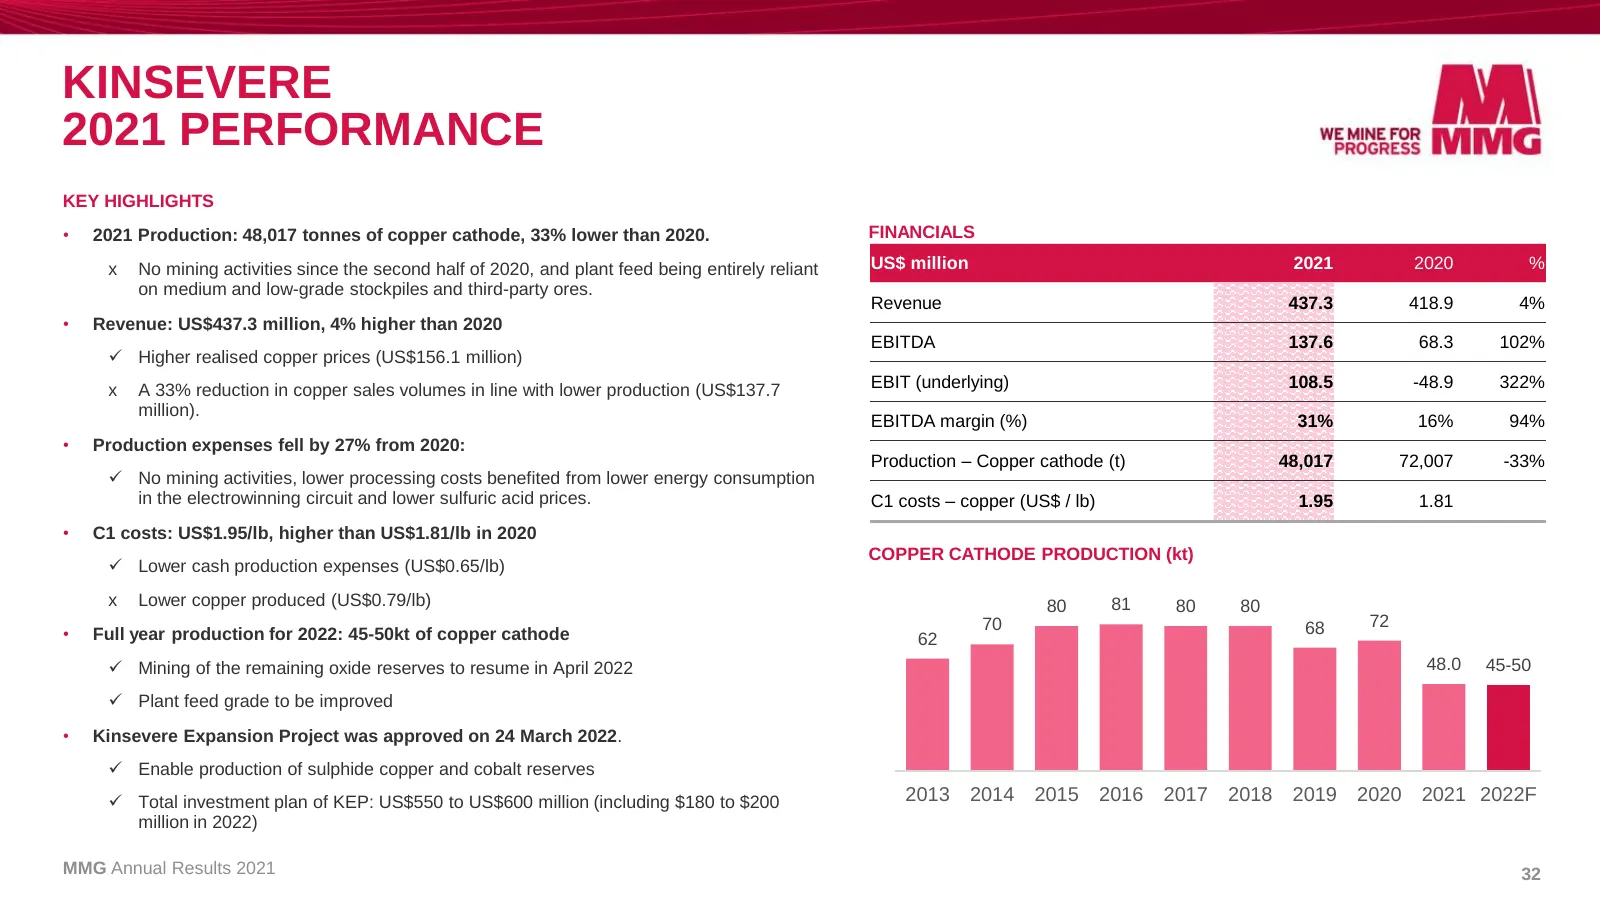
KINSEVERE 2021 PERFORMANCE KEY HIGHLIGHTS • 2021 Production: 48,017 tonnes of copper cathode, 33% lower than 2020. FINANCIALS x No mining activities since the second half of 2020, and plant feed being entirely reliant US$ million 2021 2020 % on medium and low-grade stockpiles and third-party ores. R
Slide 33: Dugald River 2021 Performance
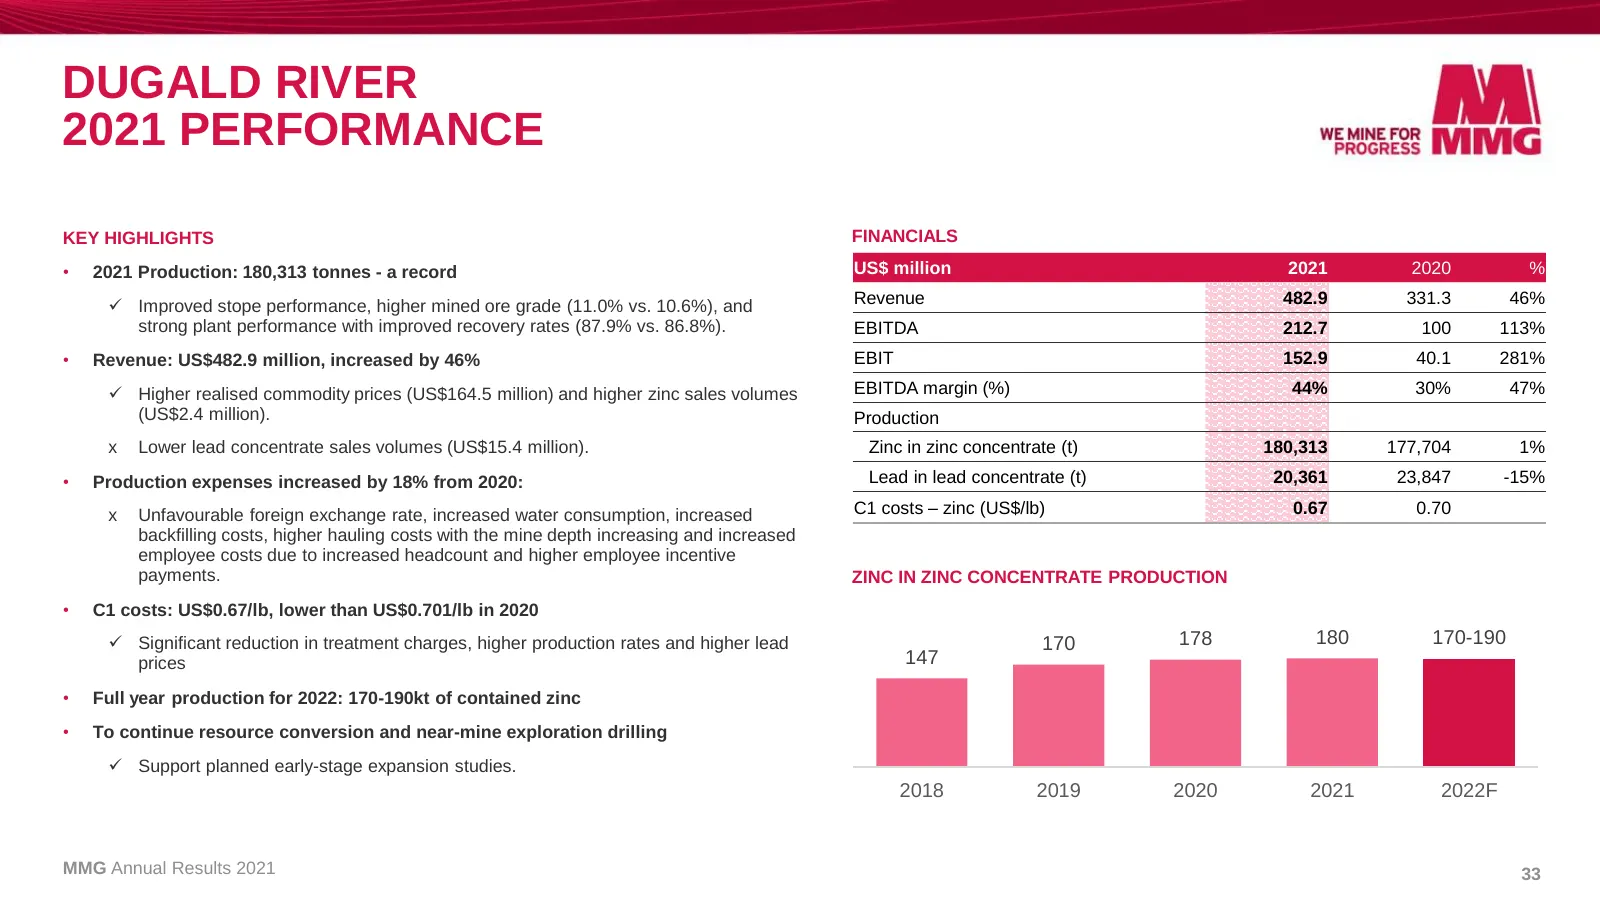
DUGALD RIVER 2021 PERFORMANCE KEY HIGHLIGHTS FINANCIALS • 2021 Production: 180,313 tonnes - a record US$ million 2021 2020 % ✓ Improved stope performance, higher mined ore grade (11.0% vs. 10.6%), and Revenue 482.9 331.3 46% strong plant performance with improved recovery rates (87.9% vs. 86.8%). EB
Slide 34: Rosebery 2021 Performance
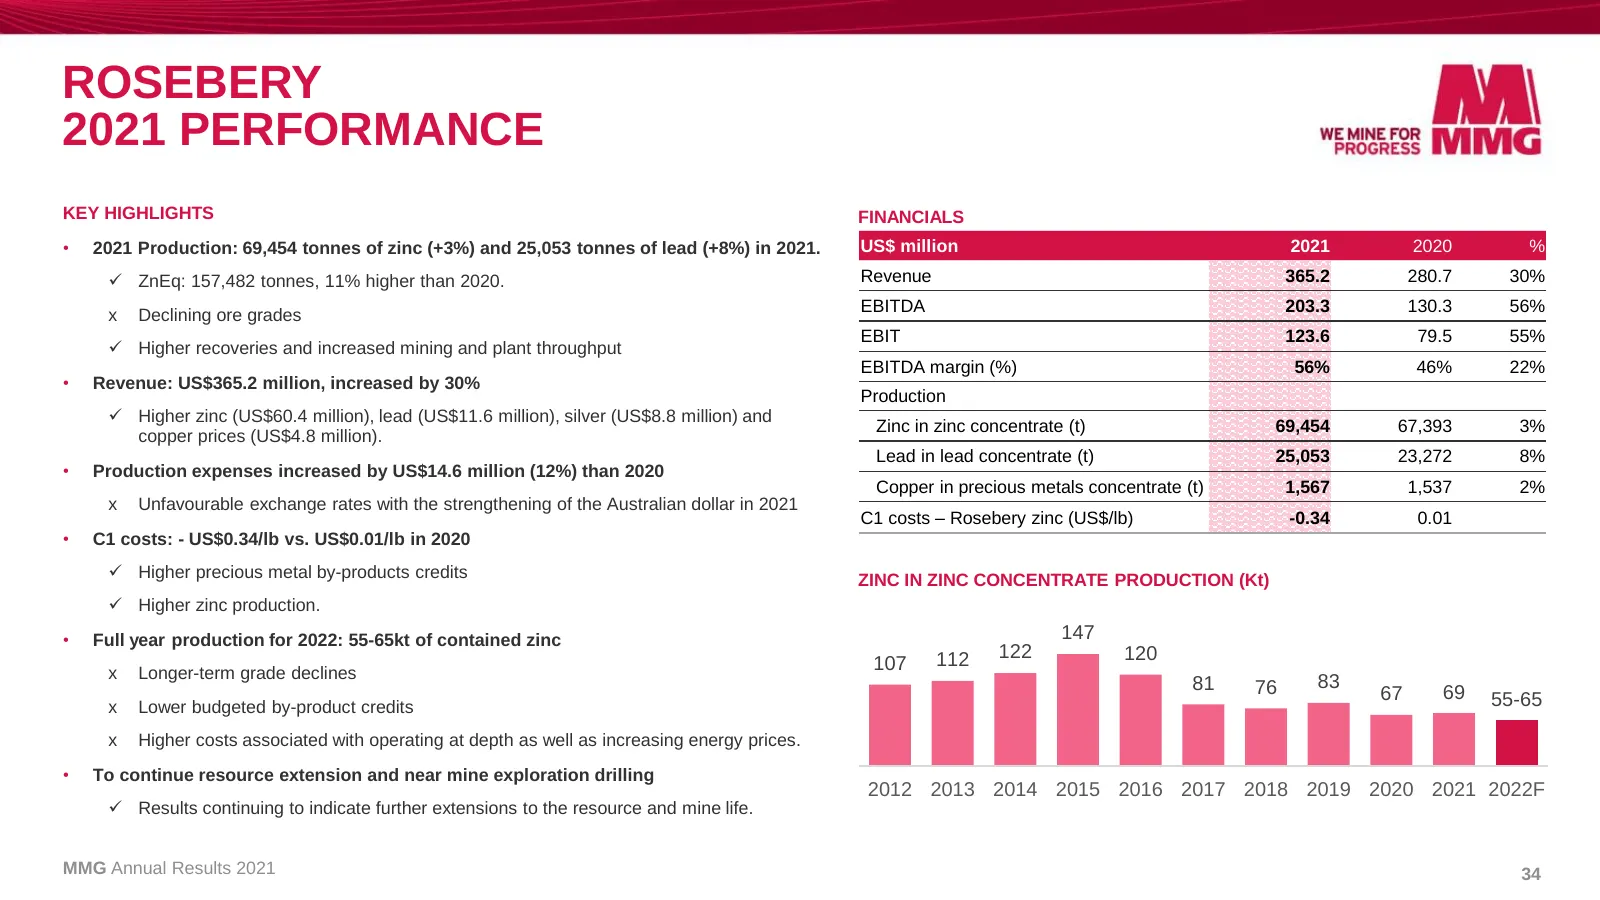
ROSEBERY 2021 PERFORMANCE KEY HIGHLIGHTS FINANCIALS • 2021 Production: 69,454 tonnes of zinc (+3%) and 25,053 tonnes of lead (+8%) in 2021. US$ million 2021 2020 % ✓ ZnEq: 157,482 tonnes, 11% higher than 2020. Revenue 365.2 280.7 30% x Declining ore grades EBITDA 203.3 130.3 56% EBIT 123.6 79.5 55%
Slide 35: Profit and Loss Statement
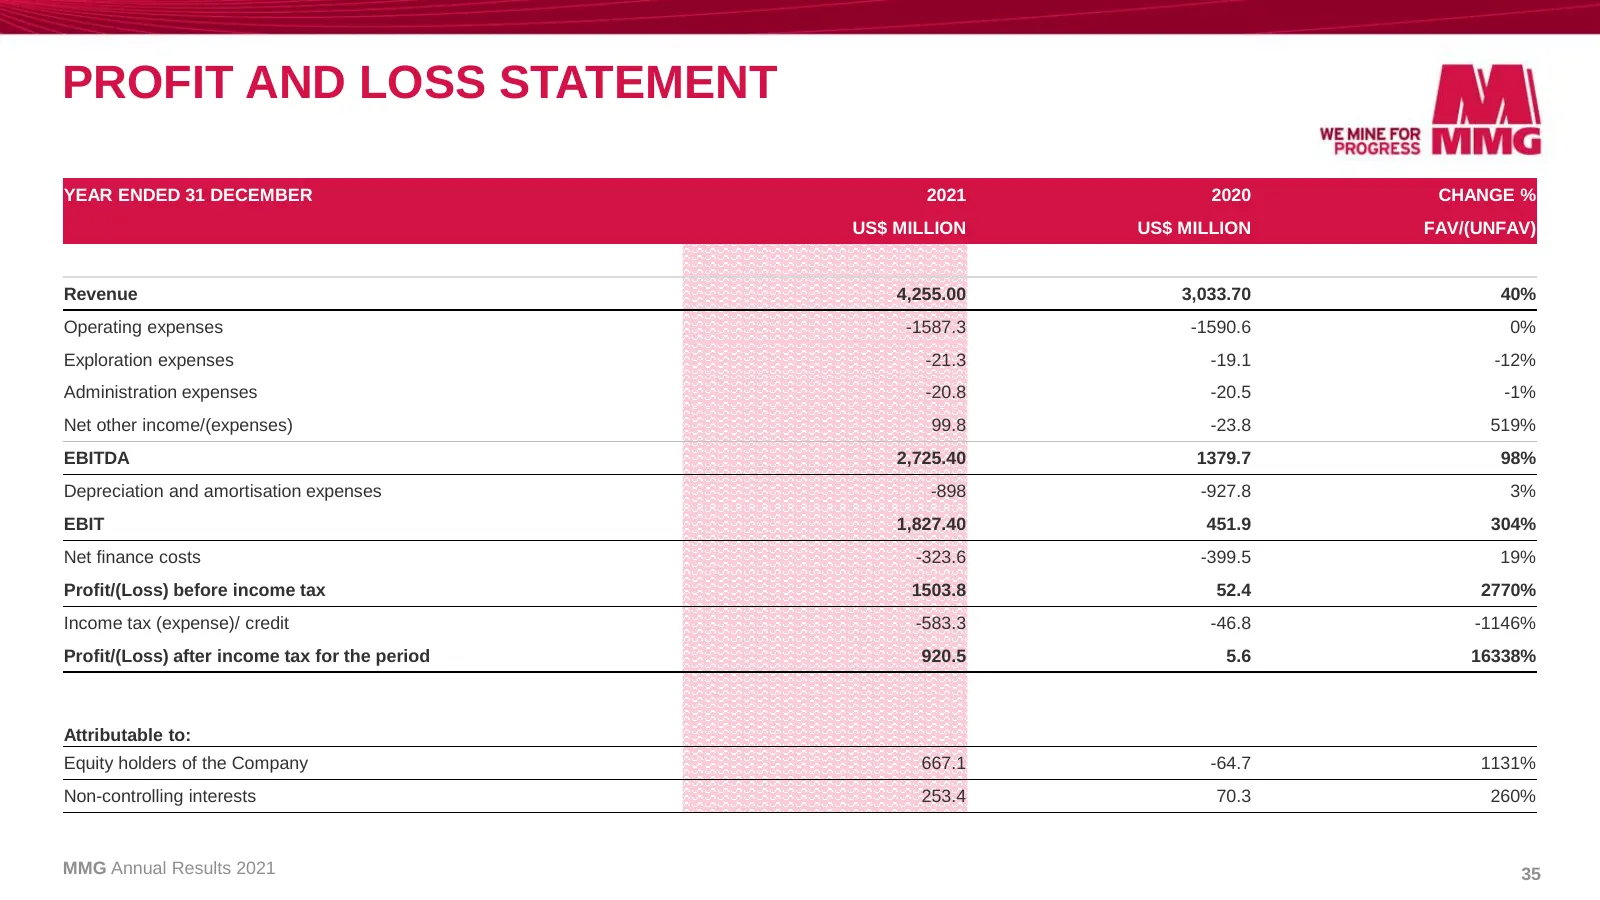
PROFIT AND LOSS STATEMENT YEAR ENDED 31 DECEMBER 2021 2020 CHANGE % US$ MILLION US$ MILLION FAV/(UNFAV) Revenue 4,255.00 3,033.70 40% Operating expenses -1587.3 -1590.6 0% Exploration expenses -21.3 -19.1 -12% Administration expenses -20.8 -20.5 -1% Net other income/(expenses) 99.8 -23.8 519% EBITDA
Slide 36: Balance Sheet
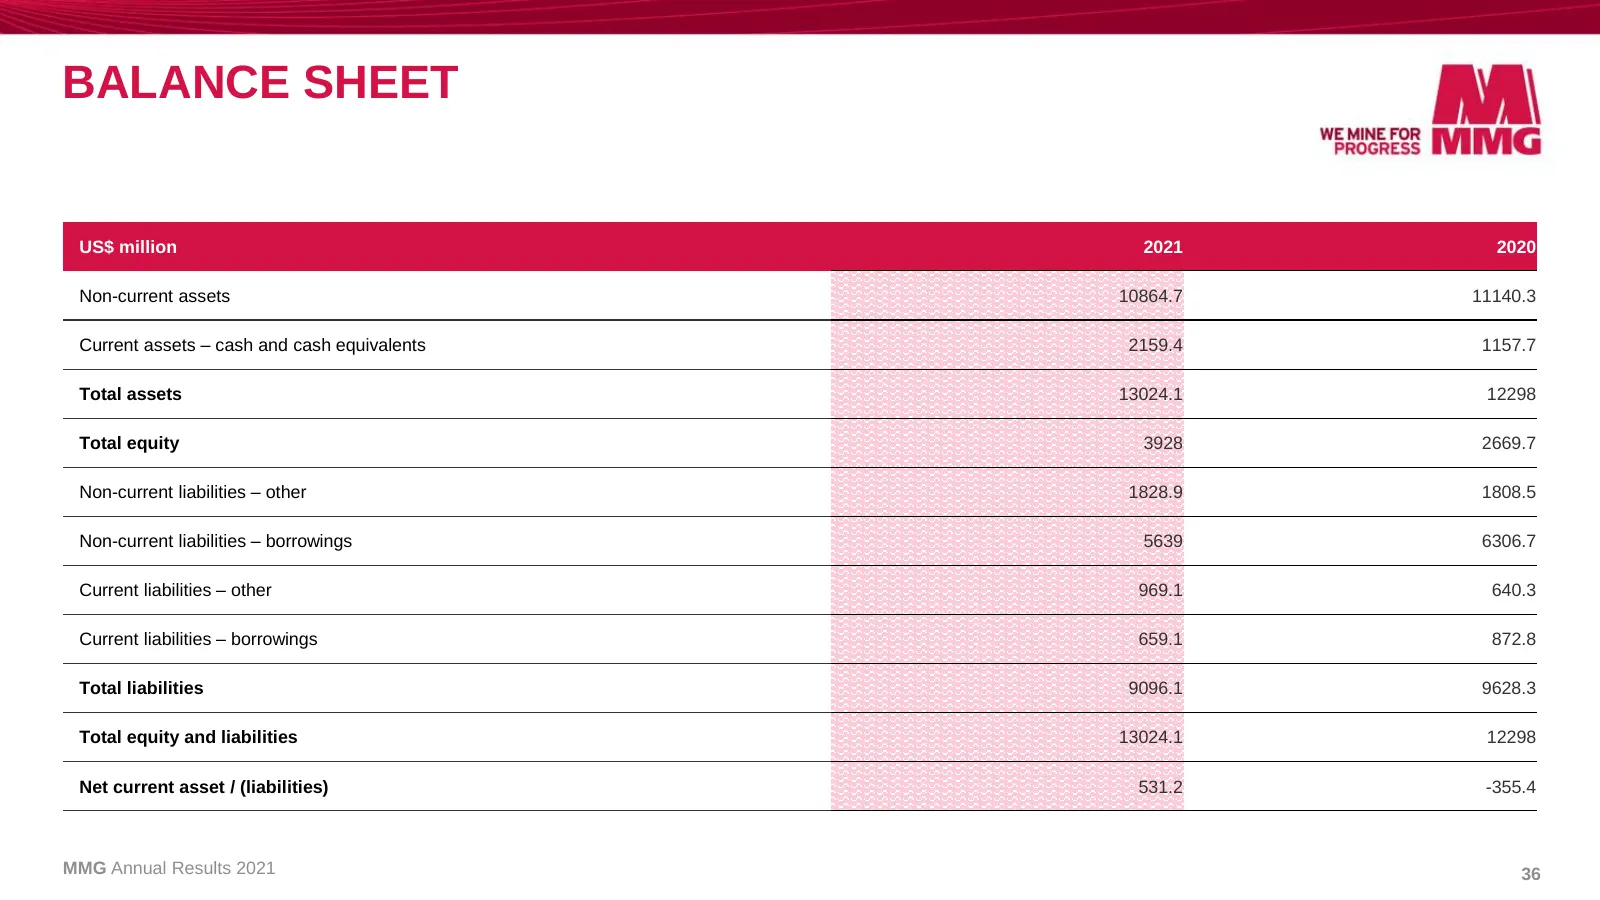
BALANCE SHEET US$ million 2021 2020 Non-current assets 10864.7 11140.3 Current assets – cash and cash equivalents 2159.4 1157.7 Total assets 13024.1 12298 Total equity 3928 2669.7 Non-current liabilities – other 1828.9 1808.5 Non-current liabilities – borrowings 5639 6306.7 Current liabilities – oth
Slide 37: Statement of Cash Flow
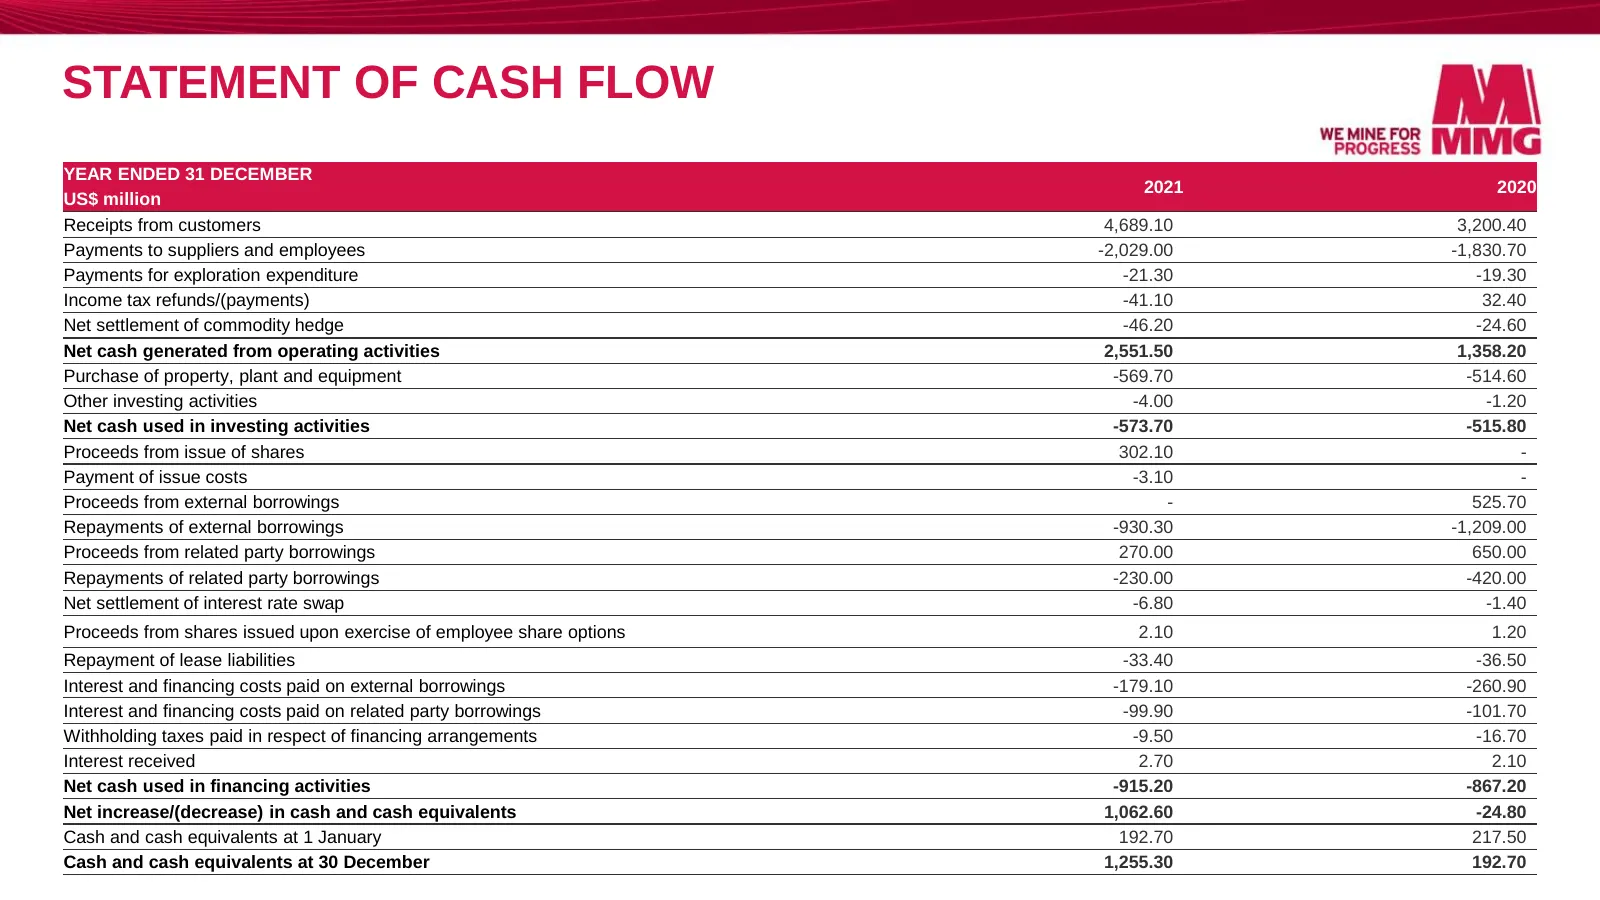
STATEMENT OF CASH FLOW YEAR ENDED 31 DECEMBER 2021 2020 US$ million Receipts from customers 4,689.10 3,200.40 Payments to suppliers and employees -2,029.00 -1,830.70 Payments for exploration expenditure -21.30 -19.30 Income tax refunds/(payments) -41.10 32.40 Net settlement of commodity hedge -46.20
Slide 38: MMG Overview
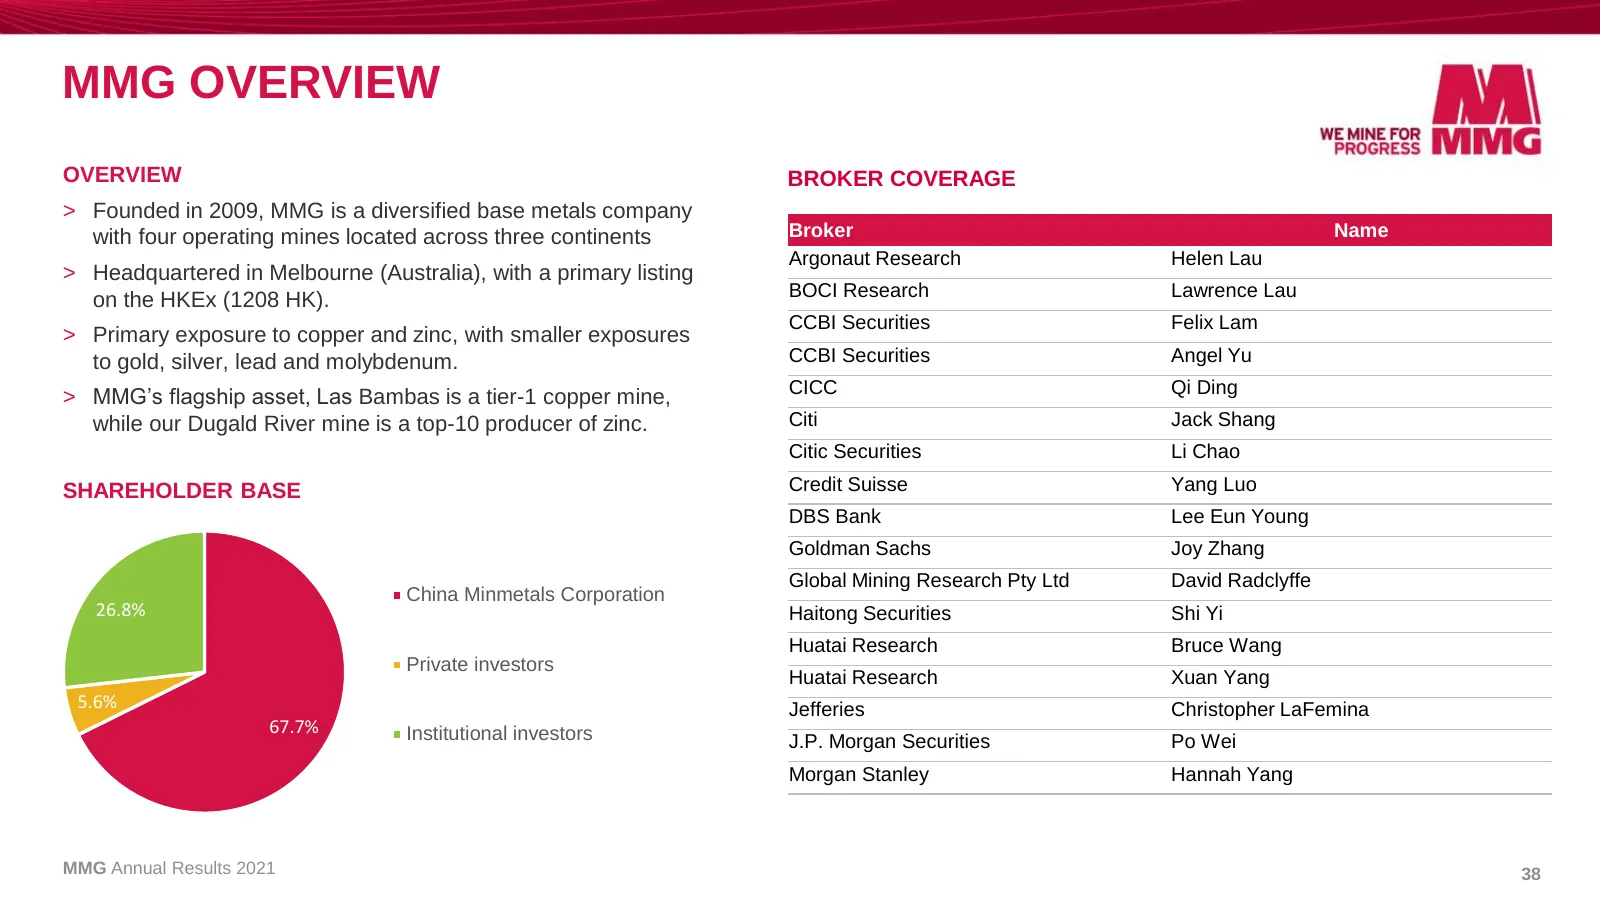
MMG OVERVIEW OVERVIEW BROKER COVERAGE > Founded in 2009, MMG is a diversified base metals company with four operating mines located across three continents Broker Name Argonaut Research Helen Lau > Headquartered in Melbourne (Australia), with a primary listing on the HKEx (1208 HK). BOCI Research La
Slide 39: Mineral Resources
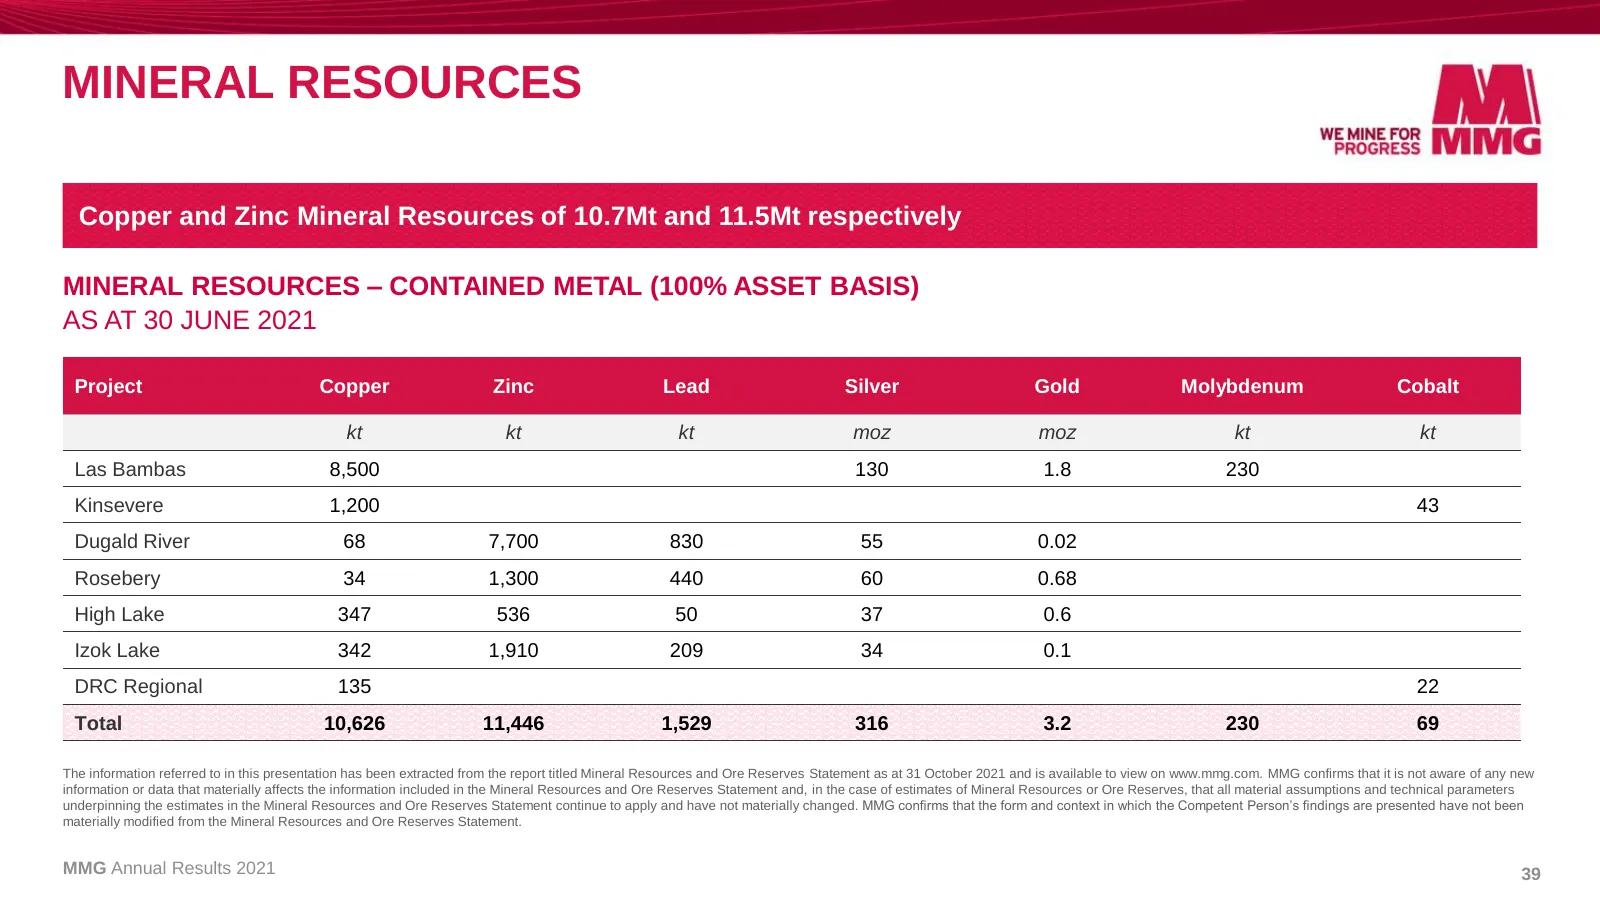
MINERAL RESOURCES Copper and Zinc Mineral Resources of 10.7Mt and 11.5Mt respectively MINERAL RESOURCES – CONTAINED METAL (100% ASSET BASIS) AS AT 30 JUNE 2021 Project Copper Zinc Lead Silver Gold Molybdenum Cobalt kt kt kt moz moz kt kt Las Bambas 8,500 130 1.8 230 Kinsevere 1,200 43 Dugald River 6
Slide 40: Ore Reserves
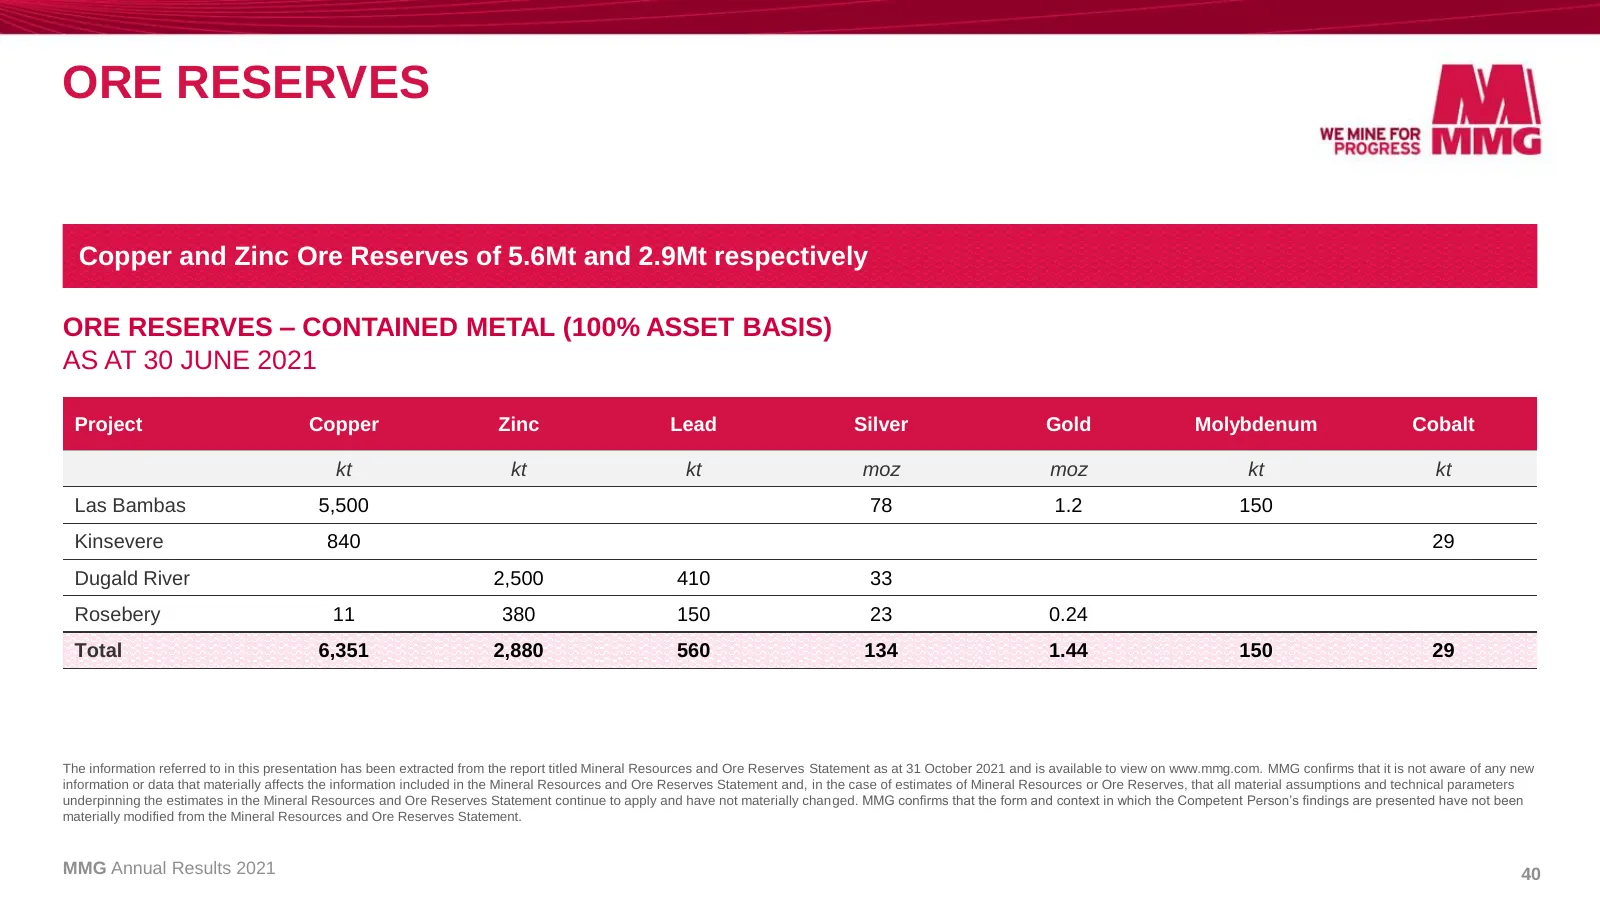
ORE RESERVES Copper and Zinc Ore Reserves of 5.6Mt and 2.9Mt respectively ORE RESERVES – CONTAINED METAL (100% ASSET BASIS) AS AT 30 JUNE 2021 Project Copper Zinc Lead Silver Gold Molybdenum Cobalt kt kt kt moz moz kt kt Las Bambas 5,500 78 1.2 150 Kinsevere 840 29 Dugald River 2,500 410 33 Rosebery
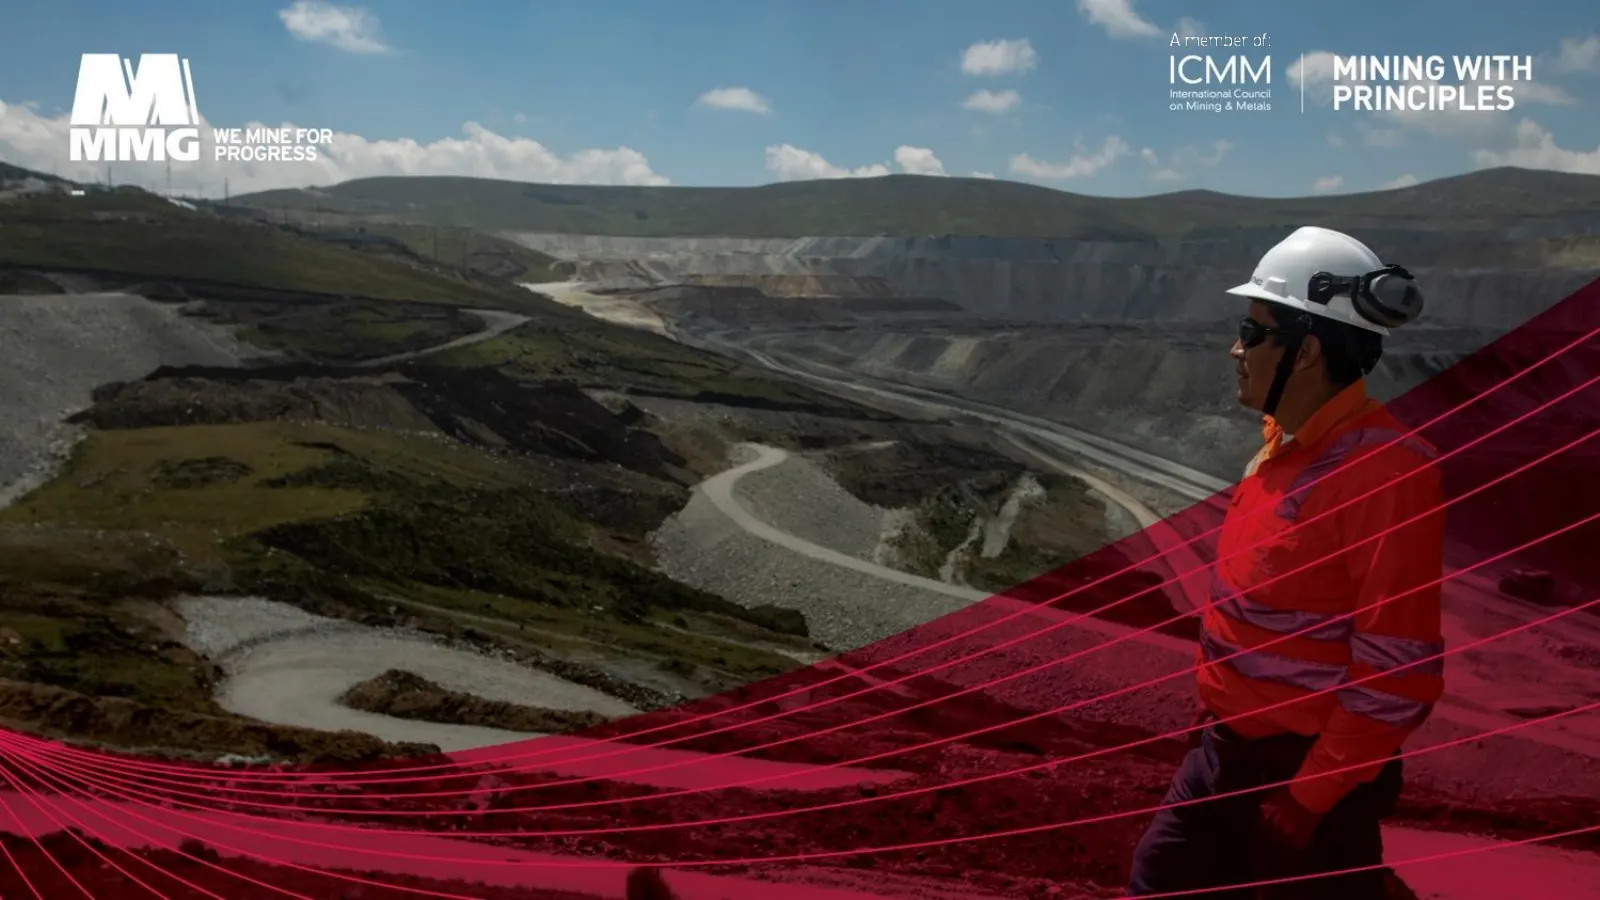
Slide 41
Source: Internet Archive copy of mmg.com
More decks from MMG Ltd.
 H1 2026 Earnings Presentation45 slides · Aug 12, 2026
 Investor Presentation (May 2026)40 slides · May 2026
 FY2025 Earnings Presentation48 slides · Mar 4, 2026
 Morgan Stanley Twenty Fourth APAC Summit 202531 slides · November 2025
 H1 2025 Earnings Presentation41 slides · Aug 13, 2025
 H1 2025 Earnings Presentation41 slides · August 2025