Furmanite — Q1 2012 Earnings Presentation
22 slides from Furmanite's earnings presentation, May 8, 2012

Slide 1: Furmanite Corporation Quarter Ended March 31, 2012
Furmanite Corporation QUARTER AND YEAR ENDED MARCH 31, 2012 Charles R. Cox, Chairman & CEO Joseph E. Milliron, President & COO Robert S. Muff, Principal Financial Officer Exhibit 99.2

Slide 2: Furmanite Corporation - Charles R. Cox, Chairman & CEO
Furmanite Corporation QUARTER AND YEAR ENDED MARCH 31, 2012 Charles R. Cox, Chairman & CEO

Slide 3: 1st Quarter Financial Overview
st Quarter • Disappointing Quarter with Revenues down $1.3 million; Net Income down $2.9 million, excluding relocation, restructuring and income tax related benefit • Revenue and Net Income miss related primarily to poor Central European markets and delayed turnaround season • Identified Central Eur

Slide 4: Business Conditions
• Significantly worse st quarter overall market conditions in Europe compared to 2009 through 2011 • Unclear future direction in European markets • Additional European restructuring taking place in nd quarter to address probable protracted poor market conditions • Late turnaround season impact expec

Slide 5: Strategic Update
• New Global “One Company” Matrix organizational concept now 50% in place • Service Line (“SL”) Strategies implementation underway • Investment to support SL Strategies still planned for 2012 and 2013 • Values, Culture Change and Overall Growth Strategies Unchanged • Completed Corporate HQ move to H

Slide 6: 2012 Priorities
• Re-balance European cost structure with deteriorating market conditions • Finalize implementation of Global Matrix Organization • Complete appointment of Service Line Teams to implement World Leader Vision • Assemble Senior Leadership Team in new Houston HQ • Embed “Orange Code” Culture, drive gro

Slide 7: Furmanite Vision
To safely and ethically establish Furmanite as the World leader in all our Service Lines by 2014, through Innovation, Global Teamwork, Market Dominance, Project Excellence and Customer Service Perfection. “The World Leader in All Service Lines by 2014” Furmanite Vision

Slide 8: Financial Review
Furmanite Corporation QUARTER AND YEAR ENDED MARCH 31, 2012 Financial Review Robert S. Muff, Principal Financial Officer

Slide 9: Condensed Consolidated Statements of Operations
Condensed Consolidated Statements of Operations ($ in 000s except percentages and per share amounts) (Unaudited) For the Three Months Ended March 31, % of Rev % of Rev Change Revenues $ 71,782 100.0% $ 73,054 100.0% $ (1,272) Operating costs 52,352 72.9% 50,402 69.0% 1,950 Depreciation and amortizat

Slide 10: Revenues Adjusted for Currency Rates
Revenues Adjusted for Currency Rates 2012 amounts at 2011 exchange rates ($ in 000s except percentages) (Unaudited) For the Three Months Ended March 31, Change % Change Revenues Americas $ 40,698 $ 40,227 $ 471 1% EMEA 23,027 24,673 (1,646) -7% Asia-Pacific 8,057 8,154 (97) -1% Total revenues $ 71,7

Slide 11: Segment operating results after allocation of headquarter costs
Segment operating results after allocation of headquarter costs ($ in 000s) (Unaudited) For the Three Months Ended March 31, 2012 Americas EMEA Asia-Pacific Corporate & Other Total Operating income (loss) $ 4,355 $ (1,196) $ 226 $ (4,136) $ (751) Allocation of headquarter costs (based on revenues) (

Slide 12: Segment operating result comparison after allocation of headquarter costs
Segment operating result comparison after allocation of headquarter costs 2012 amounts at 2011 exchange rates ($ in 000s) (Unaudited) For the Three Months Ended March 31, Change Operating income (loss) after allocation of headquarter costs: Americas $ 2,001 $ 4,033 $ (2,032) EMEA (2,513) (334) (2,17

Slide 13: Condensed Consolidated Balance Sheets
Condensed Consolidated Balance Sheets ($ in 000s) (Unaudited) March 31, December 31, Change Cash $ 29,517 $ 34,524 $ (5,007) Trade receivables, net 71,626 71,508 Inventories 29,342 26,557 2,785 Other current assets 13,409 13,171 Total current assets 143,894 145,760 (1,866) Property and equipment, ne

Slide 14: Condensed Consolidated Statements of Cash Flows
Condensed Consolidated Statements of Cash Flows ($ in 000s) (Unaudited) For the Three Months Ended March 31, Change Net income (loss) $ (830) $ 4,026 $ (4,856) Depreciation, amortization and other non-cash items 2,575 1,190 1,385 Working capital changes (2,273) (5,241) 2,968 Net cash used in operati

Slide 15: Operations Review
Furmanite Corporation QUARTER AND YEAR ENDED MARCH 31, 2012 Operations Review Joseph E. Milliron, President and Chief Operating Officer

Slide 16: Costs aligned with revenues
at March 31, 2012 • 1,659 total employees, including temporary technicians – 3 higher than March 31, 2011 • 1,212 technicians, including temporary technicians – 18 higher than March 31, 2011 • 447 selling, general and administrative (SG&A) personnel – 15 less than March 31, 2011 Costs aligned with r
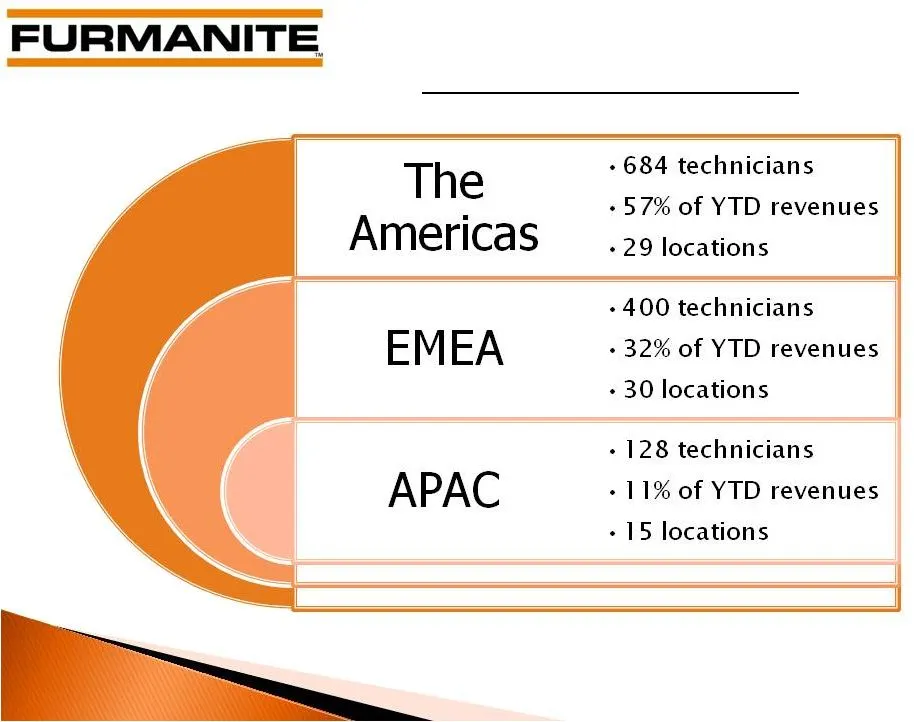
Slide 17: Global Service Network
As of March 31, 2012 Global Service Network
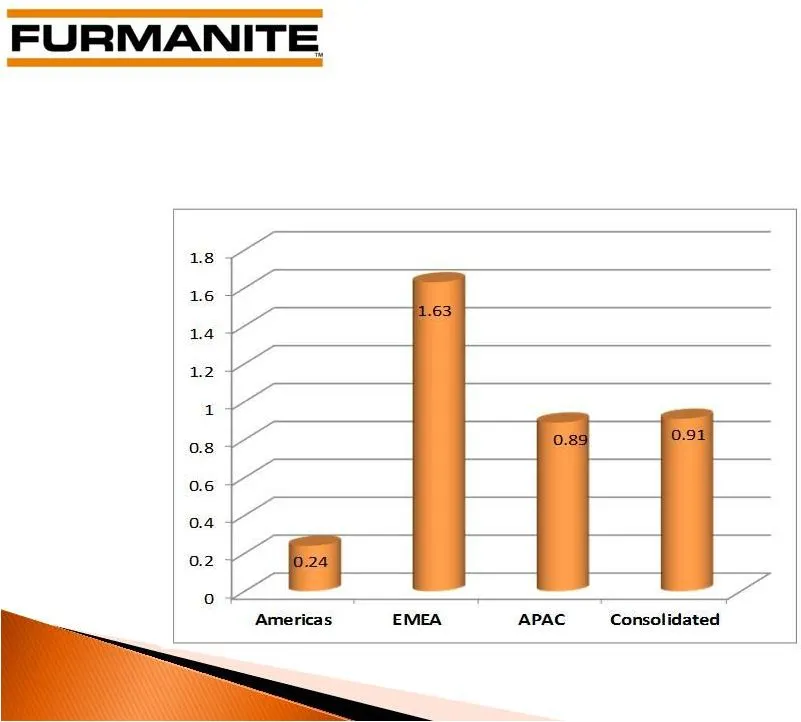
Slide 18: Safety: 2010 Around the World
TRIR TRIR SAFETY: 2010 Around the World
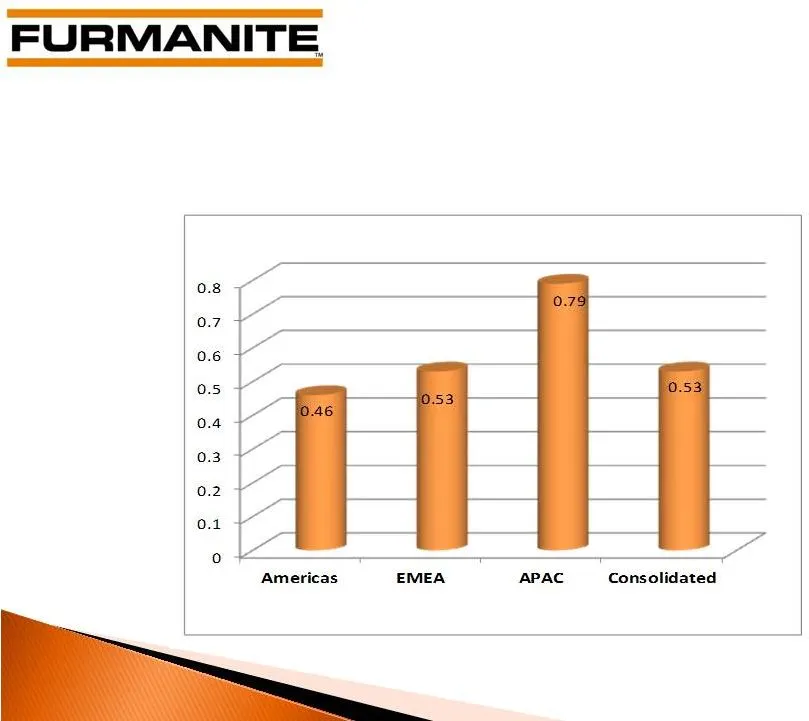
Slide 19: Safety: 2011 Around the World
TRIR TRIR SAFETY: 2011 Around the World

Slide 20: Business and Geographic Data - On-line Services Revenues
On-line Services YTD 2012 $ 124,836 $ 67,139 $ 43,909 $ 13,788 On-line Services YTD 2011 104,651 51,076 37,051 16,524 Variance $ 20,185 $ 16,063 $ 6,858 $ (2,736) Total Americas EMEA APAC On-line Services 1 Qtr. 2012 $ 30,145 $ 16,647 $ 9,302 $ 4,196 On-line Services 1 Qtr. 2011 27,924 15,945 9,470

Slide 21: Business and Geographic Data - Off-line Services Revenues
Off-line Services YTD 2012 $ ___,___ $ __,___ $ __,___ $ __,___ Off-line Services YTD 2011 __,___ __,___ __,___ __,___ Variance $ _,___ $ _,___ $ _,___ $ _,___ Business and Geographic Data – Off-line¹ Services Revenues ($ in 000’s) (Unaudited) Formerly referred to as turnaround services Total Americ

Slide 22: Furmanite Corporation Review of 1Q 2012
Furmanite Corporation Review of 1Q 2012 May 8, 2012 www.furmanite.com
Source: SEC EDGAR · 8-K filed May 8, 2012
More decks from Furmanite Corp
 Merger or Acquisition (November 2015)13 slides · Nov 2, 2015
 Q2 2015 Earnings Presentation19 slides · Aug 4, 2015
 Q1 2015 Earnings Presentation16 slides · May 11, 2015
 Proxy Contest (April 2015)40 slides · Apr 2, 2015
 Proxy Contest (April 2015)29 slides · Apr 2, 2015
 Proxy Contest (March 2015)39 slides · Mar 30, 2015