Furmanite — Q1 2015 Earnings Presentation
16 slides from Furmanite's earnings presentation, May 11, 2015
Slide 1: Furmanite Corporation Quarter Ended March 31, 2015
Furmanite Corporation QUARTER ENDED MARCH 31, 2015 Joseph E. Milliron, Chairman of the Board, Chief Executive Officer & President Robert S. Muff, Chief Financial Officer & Chief Administrative Officer

Slide 2: Forward-looking statements
Certain of the Company’s statements in this presentation are not purely historical, and as such are “forward-looking statements” within the meaning of the Private Securities Litigation Reform Act of 1995. These include statements regarding management’s plans, beliefs, expectations, intentions or pro
Slide 3: Financial Review
Furmanite Corporation QUARTER ENDED MARCH 31, 2015 Financial Review Robert S. Muff, Chief Financial Officer & Chief Administrative Officer 3
Slide 4: Condensed Consolidated Income Statements
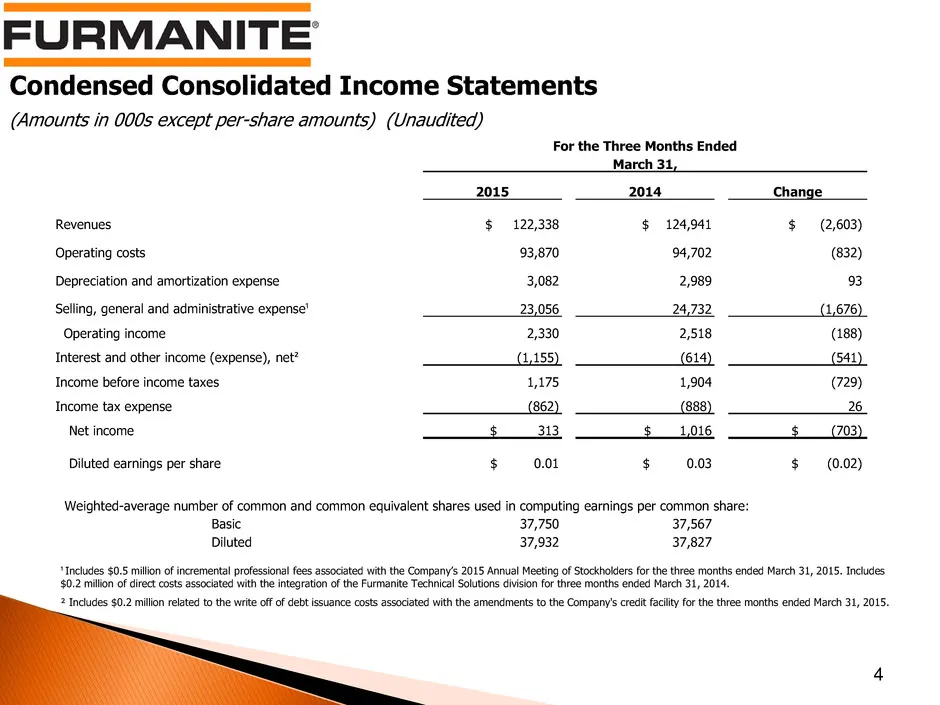
Condensed Consolidated Income Statements (Amounts in 000s except per-share amounts) (Unaudited) 4 For the Three Months Ended March 31, 2015 2014 Change Revenues $ 122,338 $ 124,941 $ (2,603) Operating costs 93,870 94,702 (832) Depreciation and amortization expense 3,082 2,989 93 Selling, general and
Slide 5: Consolidating Income Statements
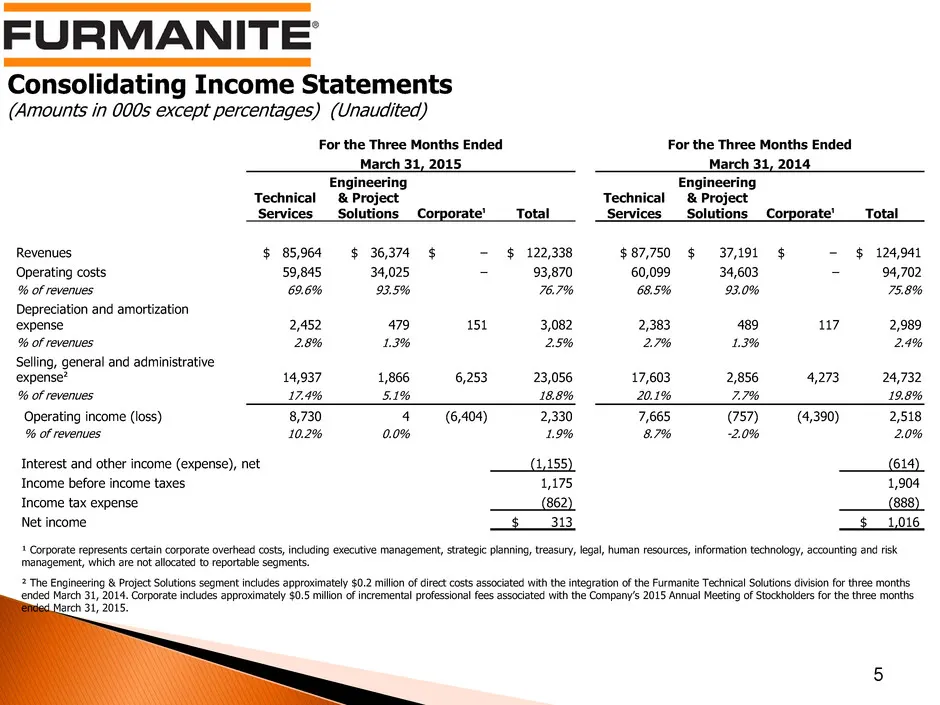
Consolidating Income Statements (Amounts in 000s except percentages) (Unaudited) 5 For the Three Months Ended For the Three Months Ended March 31, 2015 March 31, 2014 Technical Services Engineering & Project Solutions Corporate¹ Total Technical Services Engineering & Project Solutions Corporate¹ Tot
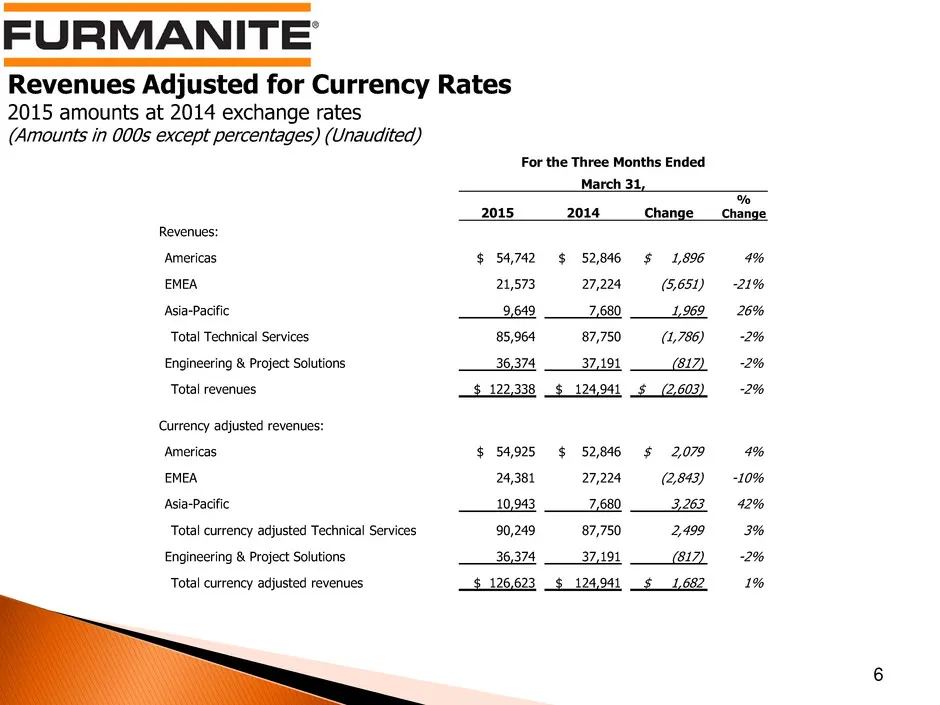
Slide 6: Revenues Adjusted for Currency Rates
Revenues Adjusted for Currency Rates 2015 amounts at 2014 exchange rates (Amounts in 000s except percentages) (Unaudited) 6 For the Three Months Ended March 31, 2015 2014 Change % Change Revenues: Americas $ 54,742 $ 52,846 $ 1,896 4% EMEA 21,573 27,224 (5,651) -21% Asia-Pacific 9,649 7,680 1,969 26
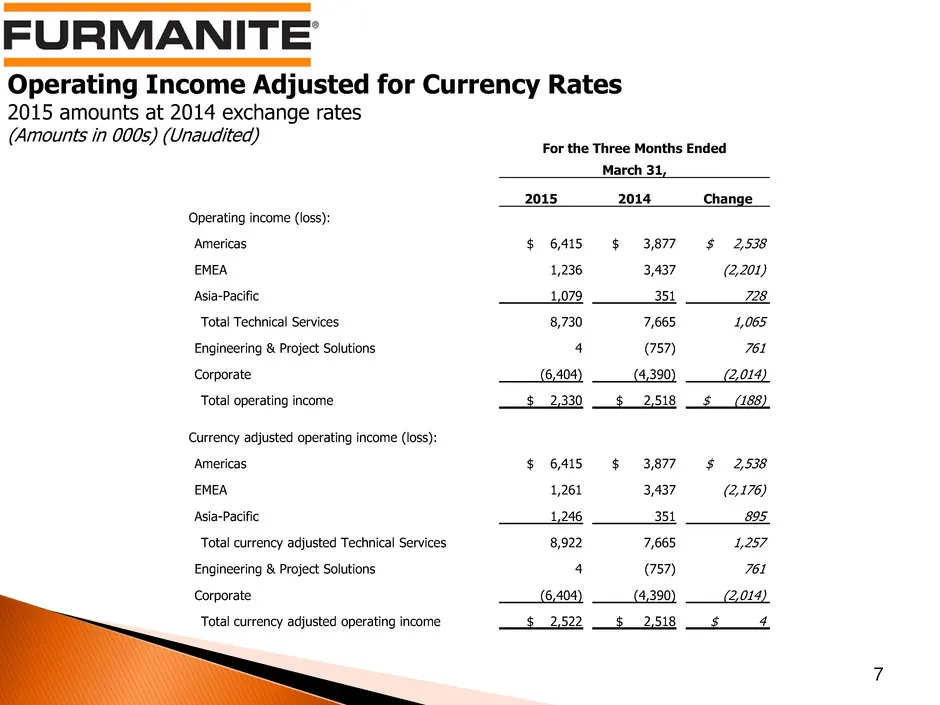
Slide 7: Operating Income Adjusted for Currency Rates
Operating Income Adjusted for Currency Rates 2015 amounts at 2014 exchange rates (Amounts in 000s) (Unaudited) 7 For the Three Months Ended March 31, 2015 2014 Change Operating income (loss): Americas $ 6,415 $ 3,877 $ 2,538 EMEA 1,236 3,437 (2,201) Asia-Pacific 1,079 351 728 Total Technical Service
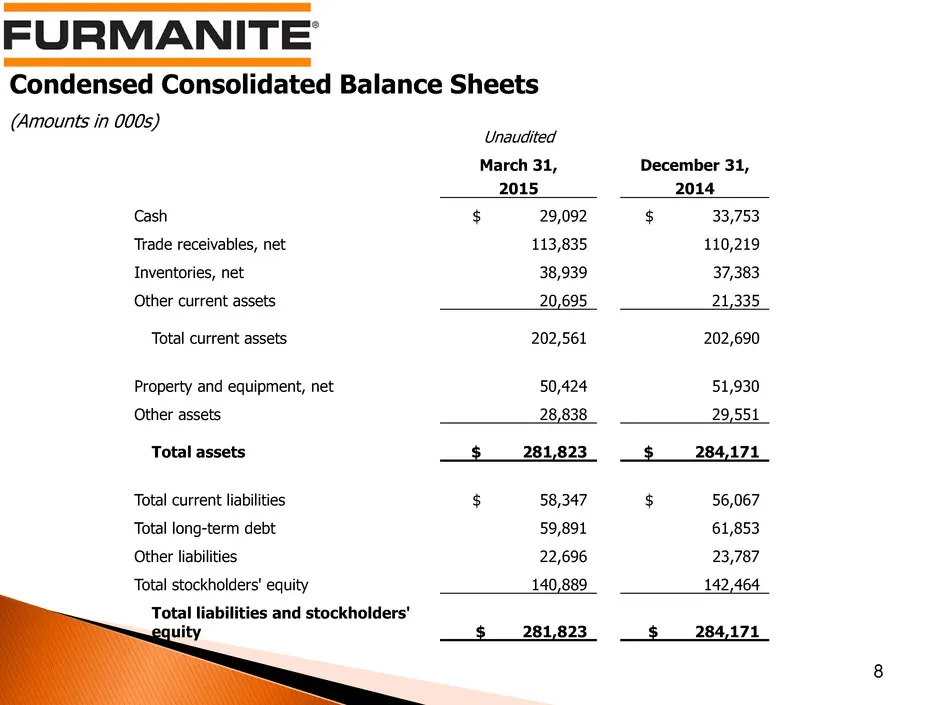
Slide 8: Condensed Consolidated Balance Sheets
Condensed Consolidated Balance Sheets (Amounts in 000s) 8 Unaudited March 31, December 31, 2015 2014 Cash $ 29,092 $ 33,753 Trade receivables, net 113,835 110,219 Inventories, net 38,939 37,383 Other current assets 20,695 21,335 Total current assets 202,561 202,690 Property and equipment, net 50,424
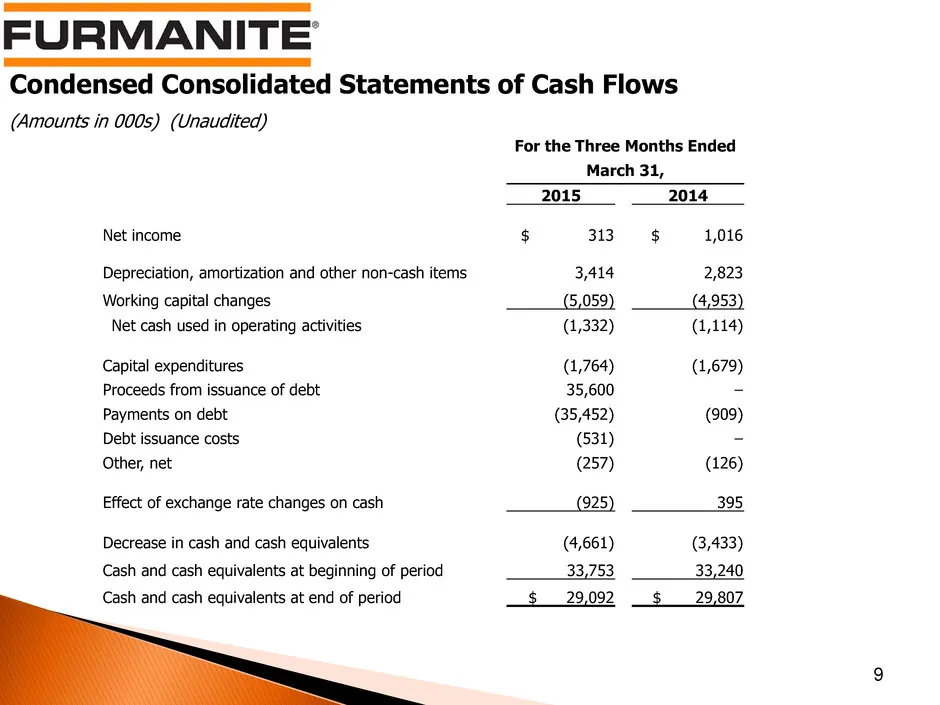
Slide 9: Condensed Consolidated Statements of Cash Flows
Condensed Consolidated Statements of Cash Flows (Amounts in 000s) (Unaudited) 9 For the Three Months Ended March 31, 2015 2014 Net income $ 313 $ 1,016 Depreciation, amortization and other non-cash items 3,414 2,823 Working capital changes (5,059) (4,953) Net cash used in operating activities (1,332
Slide 10: Operations Review
Furmanite Corporation QUARTER ENDED MARCH 31, 2015 Operations Review Joseph E. Milliron, Chairman of the Board, Chief Executive Officer & President 10
Slide 11: The Americas, EMEA, APAC
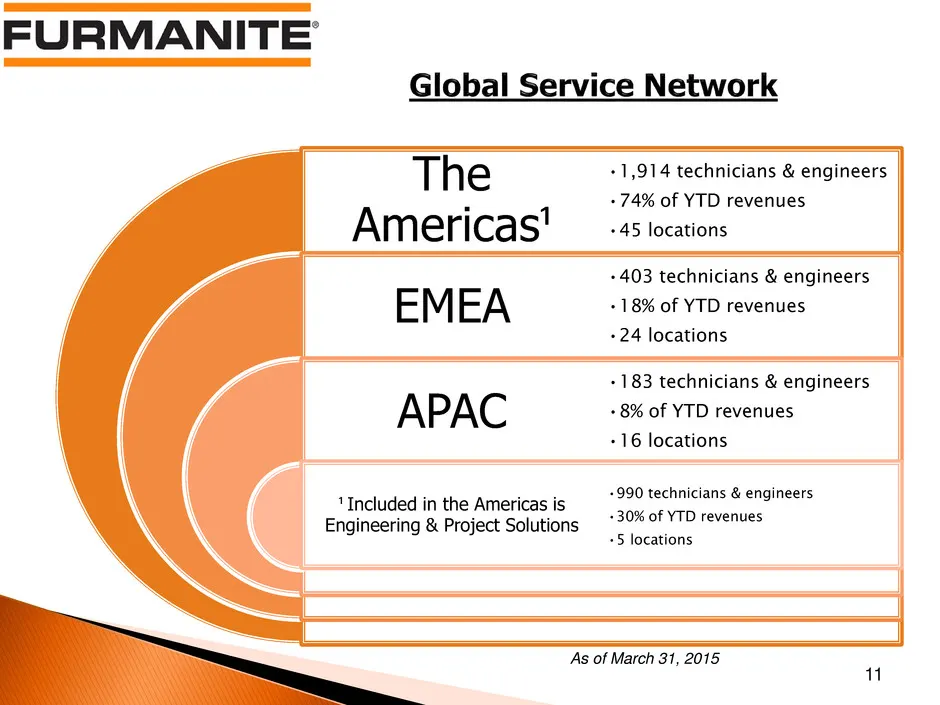
The Americas¹ EMEA APAC ¹ Included in the Americas is Engineering & Project Solutions •1,914 technicians & engineers •74% of YTD revenues •45 locations •403 technicians & engineers •18% of YTD revenues •24 locations •183 technicians & engineers •8% of YTD revenues •16 locations •990 technicians & en

Slide 12: Review of 1Q 2015
Furmanite Corporation Review of 1Q 2015 May 11, 2015 www.furmanite.com 12
Slide 13: Supplemental Information
Furmanite Corporation QUARTER ENDED MARCH 31, 2015 Supplemental Information 13
Slide 14: Geographic Data – On-line Technical Services Revenues
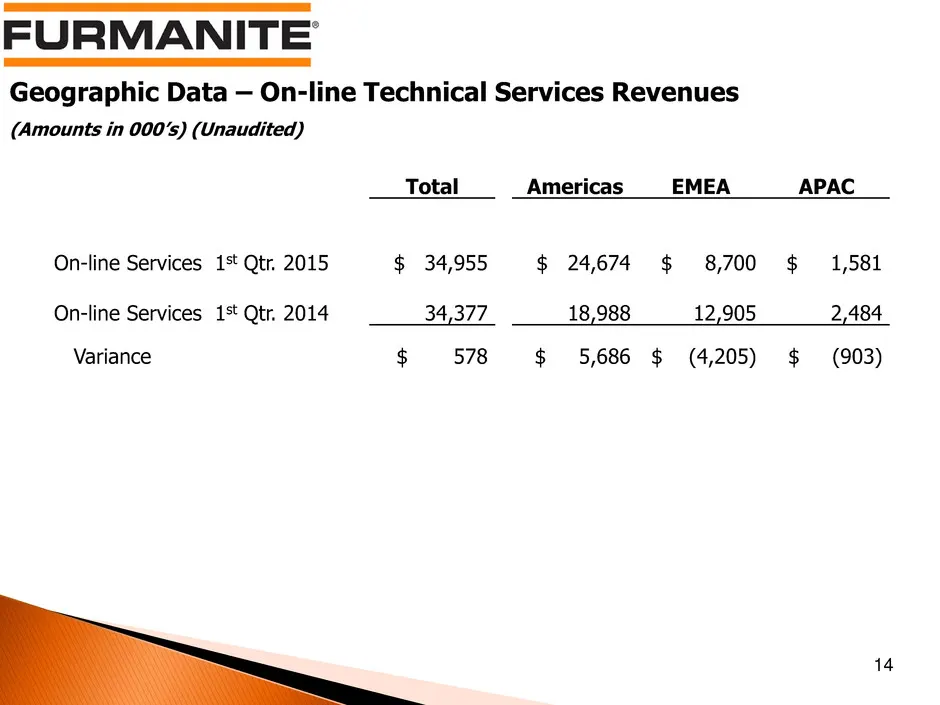
14 Geographic Data – On-line Technical Services Revenues (Amounts in 000’s) (Unaudited) Total Americas EMEA APAC On-line Services 1st Qtr. 2015 $ 34,955 $ 24,674 $ 8,700 $ 1,581 On-line Services 1st Qtr. 2014 34,377 18,988 12,905 2,484 Variance $ 578 $ 5,686 $ (4,205) $ (903)
Slide 15: Geographic Data – Off-line Technical Services Revenues
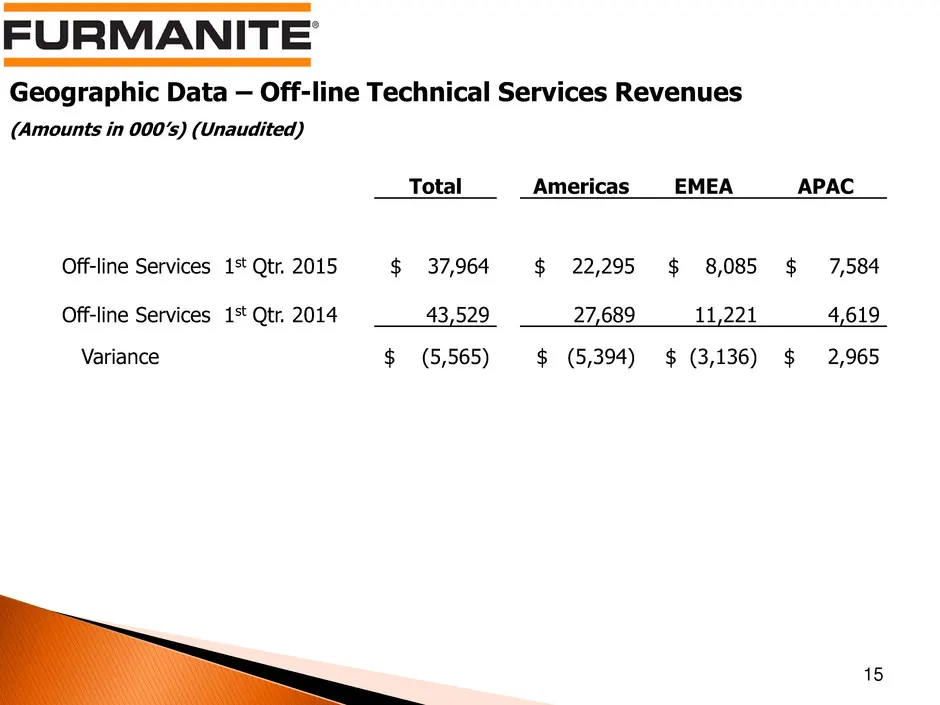
Geographic Data – Off-line Technical Services Revenues (Amounts in 000’s) (Unaudited) 15 Total Americas EMEA APAC Off-line Services 1st Qtr. 2015 $ 37,964 $ 22,295 $ 8,085 $ 7,584 Off-line Services 1st Qtr. 2014 43,529 27,689 11,221 4,619 Variance $ (5,565) $ (5,394) $ (3,136) $ 2,965
Slide 16: Geographic Data – Engineering & Project Solutions Revenues
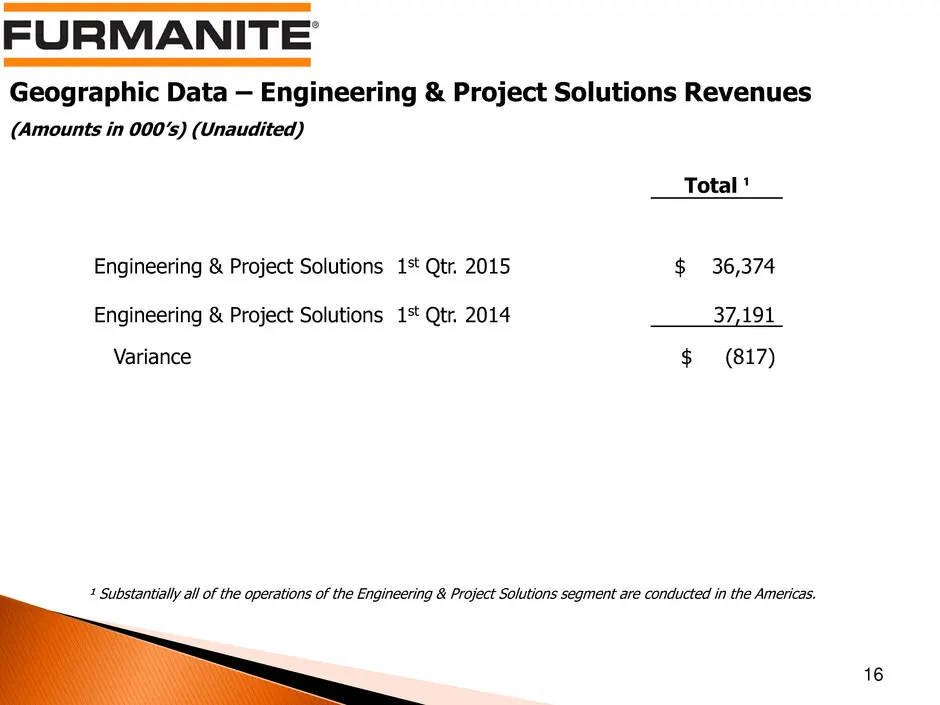
Geographic Data – Engineering & Project Solutions Revenues (Amounts in 000’s) (Unaudited) 16 Total ¹ Engineering & Project Solutions 1st Qtr. 2015 $ 36,374 Engineering & Project Solutions 1st Qtr. 2014 37,191 Variance $ (817) ¹ Substantially all of the operations of the Engineering & Project Solutio
Source: SEC EDGAR · 8-K filed May 11, 2015
More decks from Furmanite Corp
 Merger or Acquisition (November 2015)13 slides · Nov 2, 2015
 Q2 2015 Earnings Presentation19 slides · Aug 4, 2015
 Proxy Contest (April 2015)40 slides · Apr 2, 2015
 Proxy Contest (April 2015)29 slides · Apr 2, 2015
 Proxy Contest (March 2015)39 slides · Mar 30, 2015
 Q4 2014 Earnings Presentation16 slides · Mar 6, 2015