Furmanite — Q2 2015 Earnings Presentation
19 slides from Furmanite's earnings presentation, Aug 4, 2015
Slide 1: Furmanite Corporation Quarter and Six Months Ended June 30, 2015
Furmanite Corporation QUARTER AND SIX MONTHS ENDED June 30, 2015 Jeffery G. Davis, Interim Executive Chairman Joseph E. Milliron, Chief Executive Officer & President Robert S. Muff, Chief Financial Officer & Chief Administrative Officer

Slide 2: Forward-looking statements
Certain of the Company’s statements in this presentation are not purely historical, and as such are “forward-looking statements” within the meaning of the Private Securities Litigation Reform Act of 1995. These include statements regarding management’s plans, beliefs, expectations, intentions or pro
Slide 3: Financial Review
Furmanite Corporation QUARTER AND SIX MONTHS ENDED JUNE 30, 2015 Financial Review Robert S. Muff, Chief Financial Officer & Chief Administrative Officer 3
Slide 4: Condensed Consolidated Income Statements
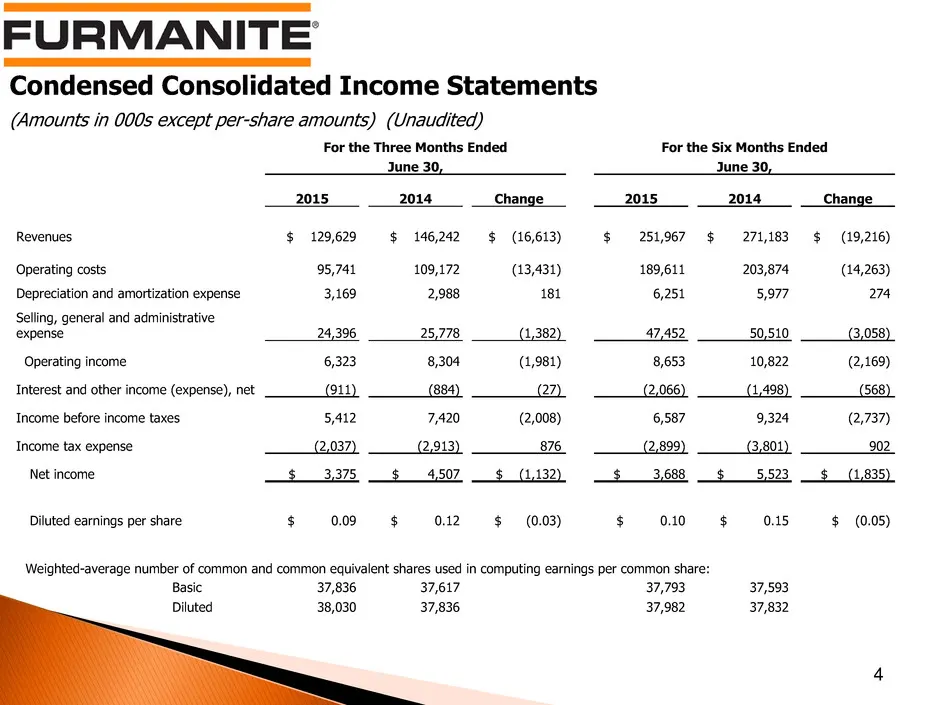
Condensed Consolidated Income Statements (Amounts in 000s except per-share amounts) (Unaudited) 4 For the Three Months Ended For the Six Months Ended June 30, June 30, 2015 2014 Change 2015 2014 Change Revenues $ 129,629 $ 146,242 $ (16,613) $ 251,967 $ 271,183 $ (19,216) Operating costs 95,741 109,
Slide 5: Consolidating Income Statements – Three Months
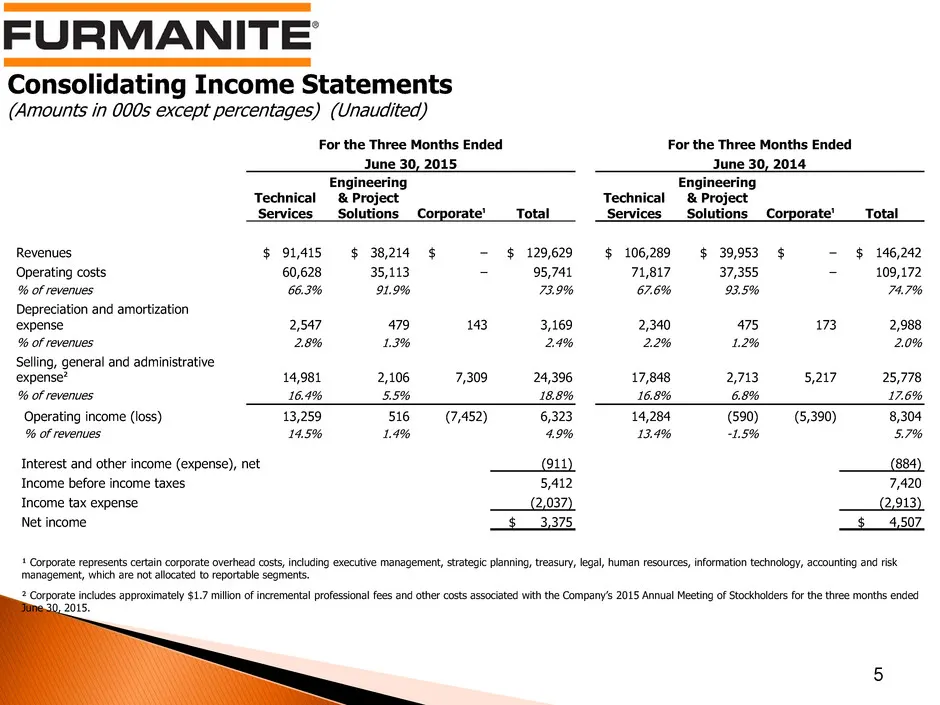
Consolidating Income Statements (Amounts in 000s except percentages) (Unaudited) 5 For the Three Months Ended For the Three Months Ended June 30, 2015 June 30, 2014 Technical Services Engineering & Project Solutions Corporate¹ Total Technical Services Engineering & Project Solutions Corporate¹ Total
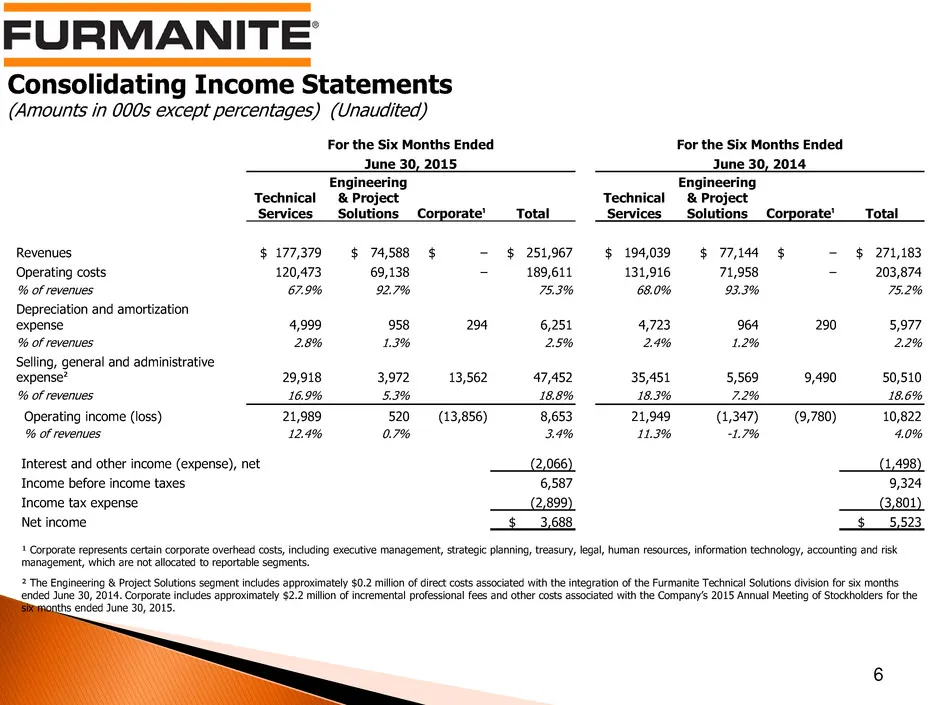
Slide 6: Consolidating Income Statements – Six Months
Consolidating Income Statements (Amounts in 000s except percentages) (Unaudited) 6 For the Six Months Ended For the Six Months Ended June 30, 2015 June 30, 2014 Technical Services Engineering & Project Solutions Corporate¹ Total Technical Services Engineering & Project Solutions Corporate¹ Total Rev
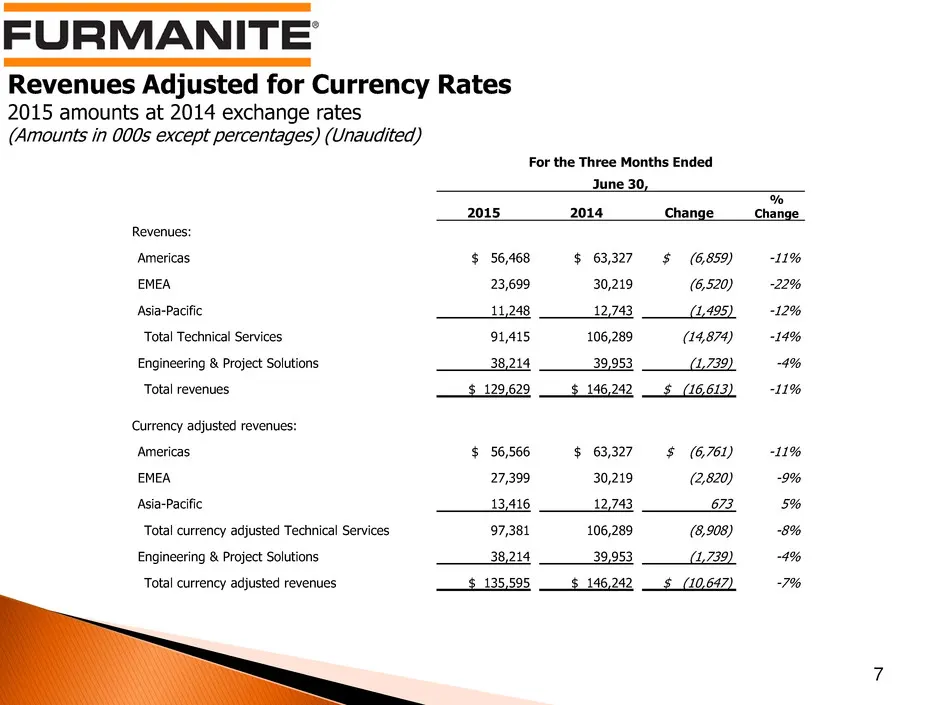
Slide 7: Revenues Adjusted for Currency Rates – Three Months
Revenues Adjusted for Currency Rates 2015 amounts at 2014 exchange rates (Amounts in 000s except percentages) (Unaudited) 7 For the Three Months Ended June 30, 2015 2014 Change % Change Revenues: Americas $ 56,468 $ 63,327 $ (6,859) -11% EMEA 23,699 30,219 (6,520) -22% Asia-Pacific 11,248 12,743 (1,
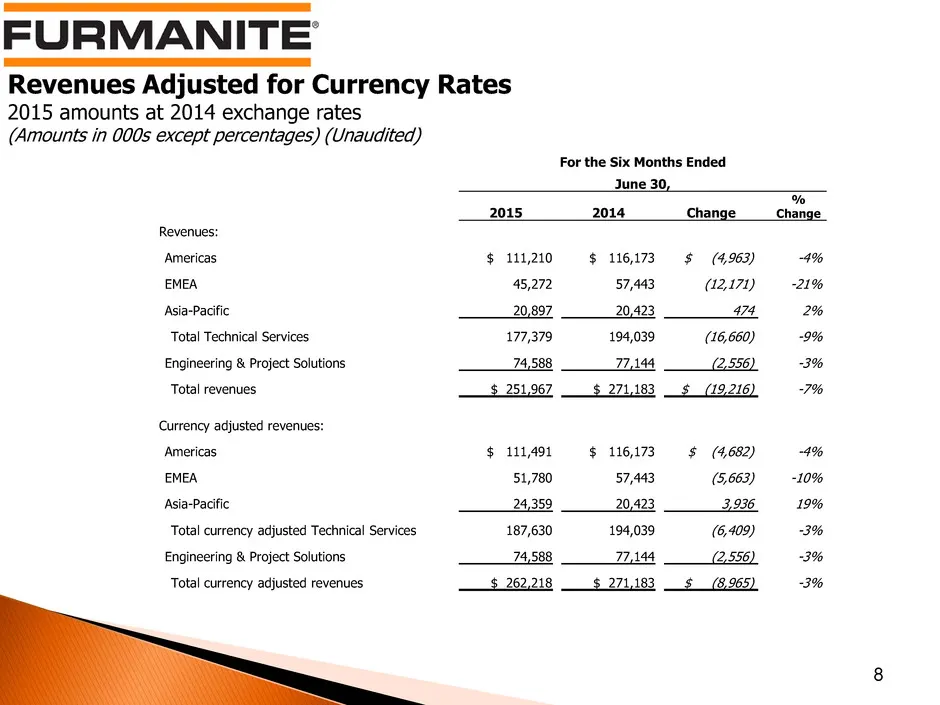
Slide 8: Revenues Adjusted for Currency Rates – Six Months
Revenues Adjusted for Currency Rates 2015 amounts at 2014 exchange rates (Amounts in 000s except percentages) (Unaudited) 8 For the Six Months Ended June 30, 2015 2014 Change % Change Revenues: Americas $ 111,210 $ 116,173 $ (4,963) -4% EMEA 45,272 57,443 (12,171) -21% Asia-Pacific 20,897 20,423 474
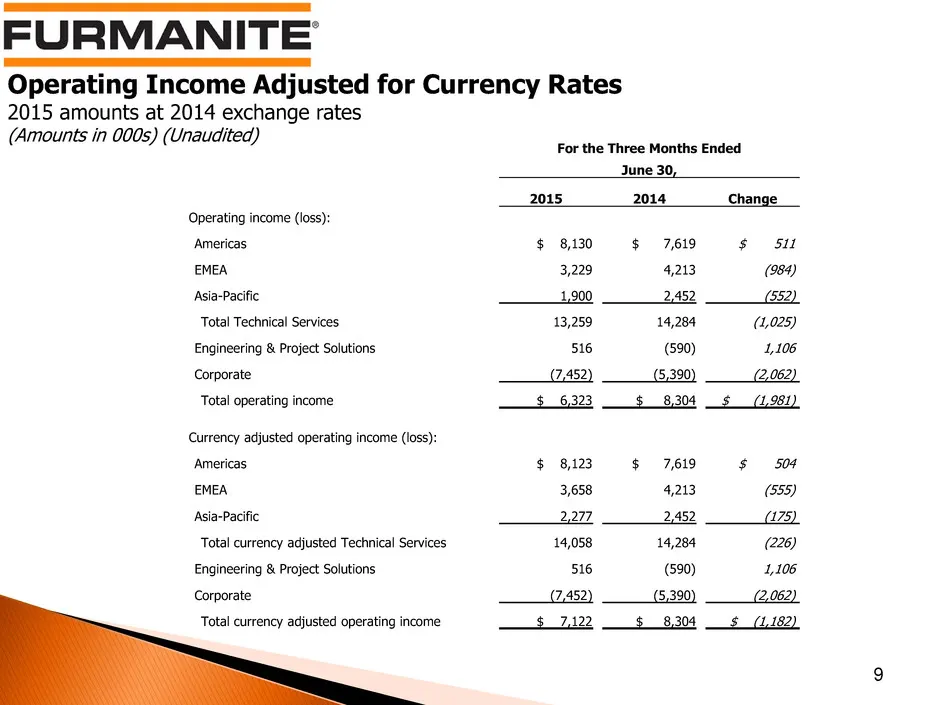
Slide 9: Operating Income Adjusted for Currency Rates – Three Months
Operating Income Adjusted for Currency Rates 2015 amounts at 2014 exchange rates (Amounts in 000s) (Unaudited) 9 For the Three Months Ended June 30, 2015 2014 Change Operating income (loss): Americas $ 8,130 $ 7,619 $ 511 EMEA 3,229 4,213 (984) Asia-Pacific 1,900 2,452 (552) Total Technical Services
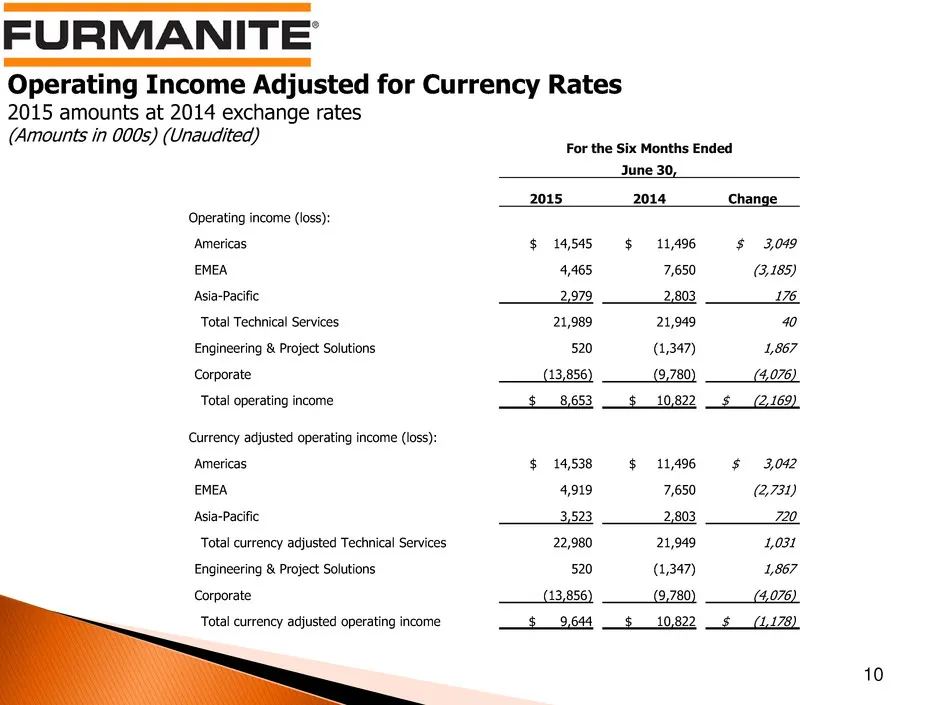
Slide 10: Operating Income Adjusted for Currency Rates – Six Months
Operating Income Adjusted for Currency Rates 2015 amounts at 2014 exchange rates (Amounts in 000s) (Unaudited) 10 For the Six Months Ended June 30, 2015 2014 Change Operating income (loss): Americas $ 14,545 $ 11,496 $ 3,049 EMEA 4,465 7,650 (3,185) Asia-Pacific 2,979 2,803 176 Total Technical Servi
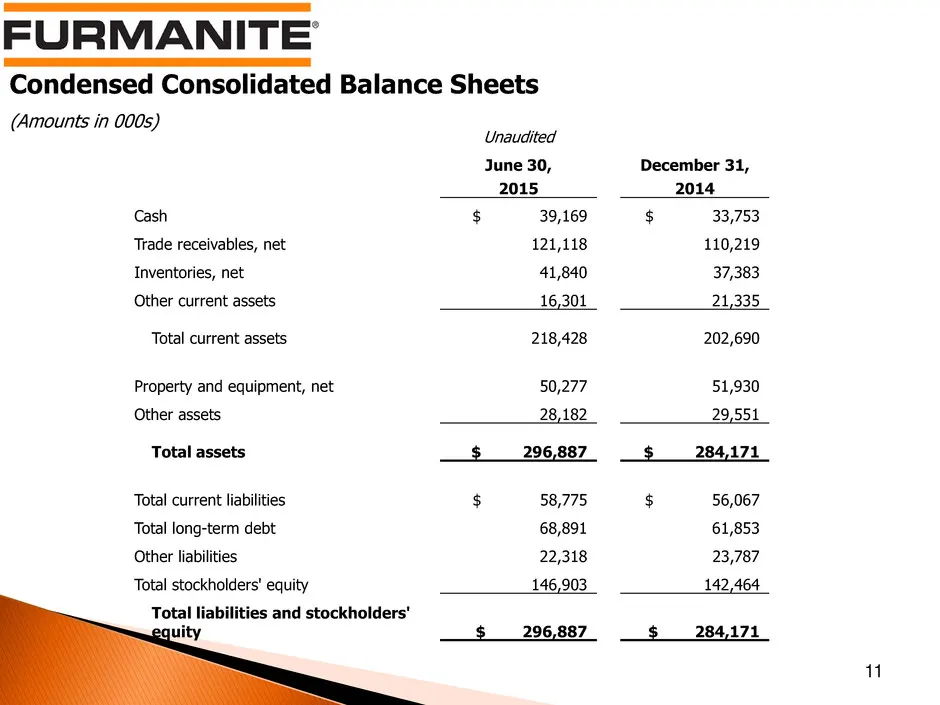
Slide 11: Condensed Consolidated Balance Sheets
Condensed Consolidated Balance Sheets (Amounts in 000s) 11 Unaudited June 30, December 31, 2015 2014 Cash $ 39,169 $ 33,753 Trade receivables, net 121,118 110,219 Inventories, net 41,840 37,383 Other current assets 16,301 21,335 Total current assets 218,428 202,690 Property and equipment, net 50,277
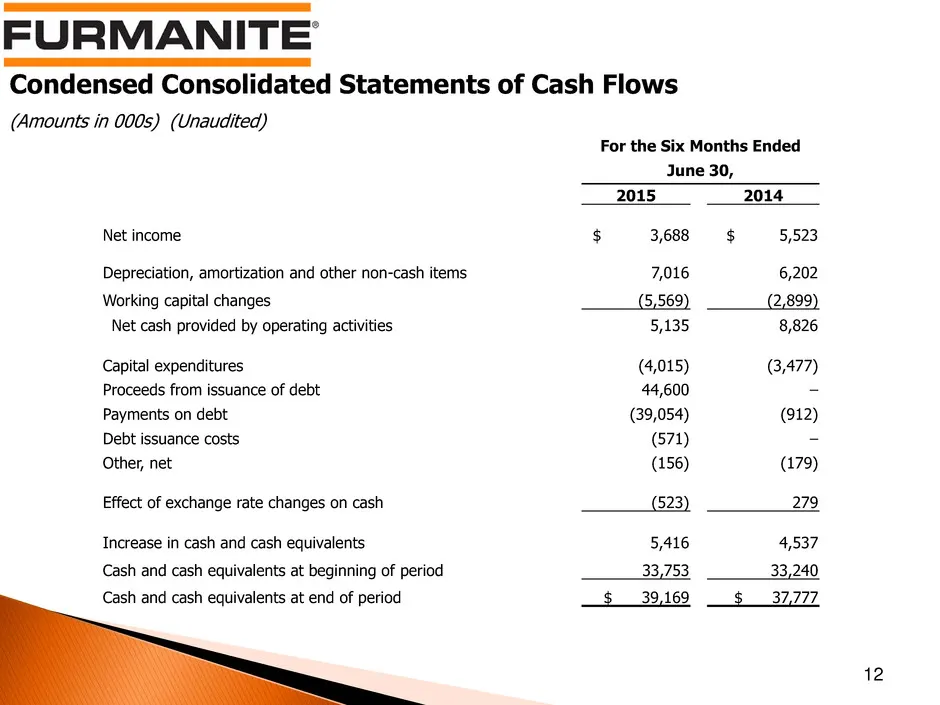
Slide 12: Condensed Consolidated Statements of Cash Flows
Condensed Consolidated Statements of Cash Flows (Amounts in 000s) (Unaudited) 12 For the Six Months Ended June 30, 2015 2014 Net income $ 3,688 $ 5,523 Depreciation, amortization and other non-cash items 7,016 6,202 Working capital changes (5,569) (2,899) Net cash provided by operating activities 5,
Slide 13: Operations Review
Furmanite Corporation QUARTER AND SIX MONTHS ENDED JUNE 30, 2015 Operations Review Joseph E. Milliron, Chief Executive Officer & President 13
Slide 14: The Americas, EMEA, APAC
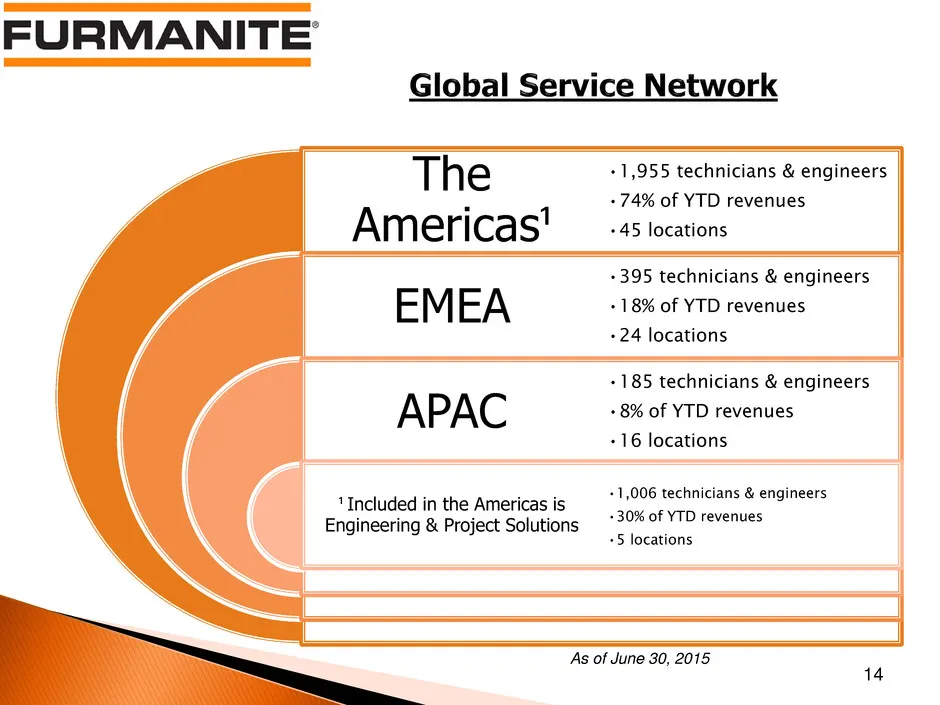
The Americas¹ EMEA APAC ¹ Included in the Americas is Engineering & Project Solutions •1,955 technicians & engineers •74% of YTD revenues •45 locations •395 technicians & engineers •18% of YTD revenues •24 locations •185 technicians & engineers •8% of YTD revenues •16 locations •1,006 technicians &

Slide 15: Review of 2Q 2015
Furmanite Corporation Review of 2Q 2015 August 4, 2015 www.furmanite.com 15
Slide 16: Supplemental Information
Furmanite Corporation QUARTER AND SIX MONTHS ENDED JUNE 30, 2015 Supplemental Information 16
Slide 17: Geographic Data – On-line Technical Services Revenues
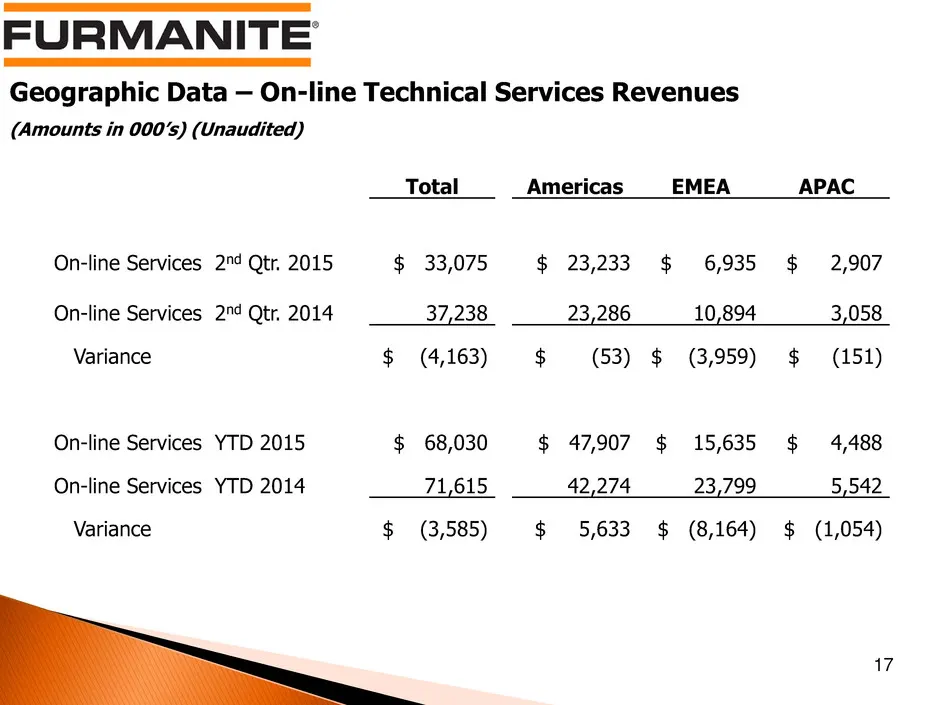
17 Geographic Data – On-line Technical Services Revenues (Amounts in 000’s) (Unaudited) Total Americas EMEA APAC On-line Services 2nd Qtr. 2015 $ 33,075 $ 23,233 $ 6,935 $ 2,907 On-line Services 2nd Qtr. 2014 37,238 23,286 10,894 3,058 Variance $ (4,163) $ (53) $ (3,959) $ (151) On-line Services YTD
Slide 18: Geographic Data – Off-line Technical Services Revenues
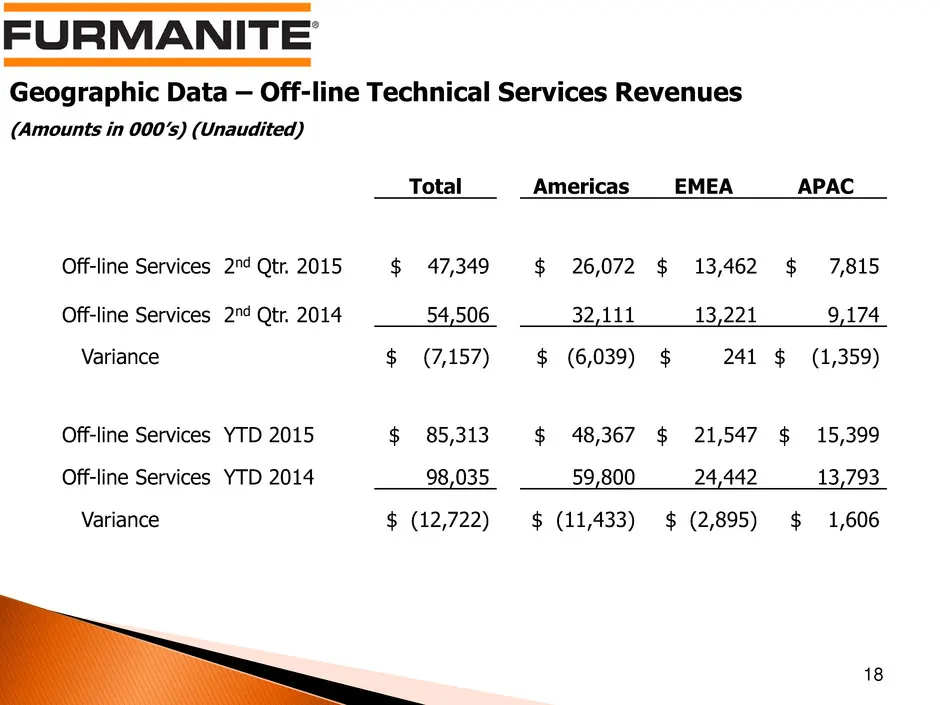
Geographic Data – Off-line Technical Services Revenues (Amounts in 000’s) (Unaudited) 18 Total Americas EMEA APAC Off-line Services 2nd Qtr. 2015 $ 47,349 $ 26,072 $ 13,462 $ 7,815 Off-line Services 2nd Qtr. 2014 54,506 32,111 13,221 9,174 Variance $ (7,157) $ (6,039) $ 241 $ (1,359) Off-line Servic
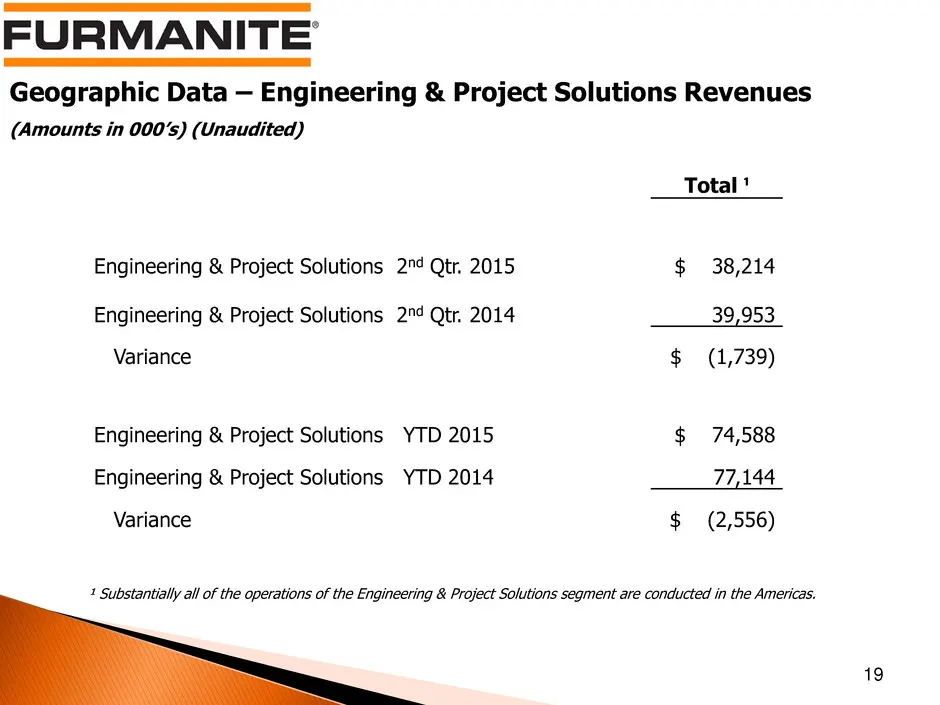
Slide 19: Geographic Data – Revenues
Geographic Data – Engineering & Project Solutions Revenues (Amounts in 000’s) (Unaudited) 19 ¹ Substantially all of the operations of the Engineering & Project Solutions segment are conducted in the Americas. Total ¹ Engineering & Project Solutions 2nd Qtr. 2015 $ 38,214 Engineering & Project Soluti
Source: SEC EDGAR · 8-K filed Aug 4, 2015
More decks from Furmanite Corp
 Merger or Acquisition (November 2015)13 slides · Nov 2, 2015
 Q1 2015 Earnings Presentation16 slides · May 11, 2015
 Proxy Contest (April 2015)40 slides · Apr 2, 2015
 Proxy Contest (April 2015)29 slides · Apr 2, 2015
 Proxy Contest (March 2015)39 slides · Mar 30, 2015
 Q4 2014 Earnings Presentation16 slides · Mar 6, 2015