INX — Q1 2007 Earnings Presentation
15 slides from INX's earnings presentation, May 3, 2007
Slide 1: INX Inc. Conference Call: Financial results for 1st Quarter ended March 31, 2007
INX Inc. Nasdaq: INXI www.INXI.com May 3, 2007 Conference Call Financial results for 1st Quarter ended March 31, 2007
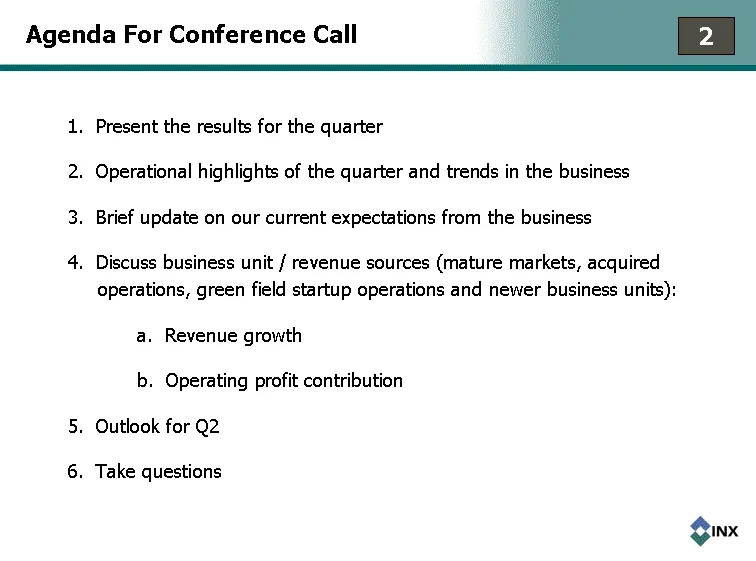
Slide 2: Agenda For Conference Call
Agenda For Conference Call 1. Present the results for the quarter 2. Operational highlights of the quarter and trends in the business 3. Brief update on our current expectations from the business 4. Discuss business unit / revenue sources (mature markets, acquired operations, green field startup ope
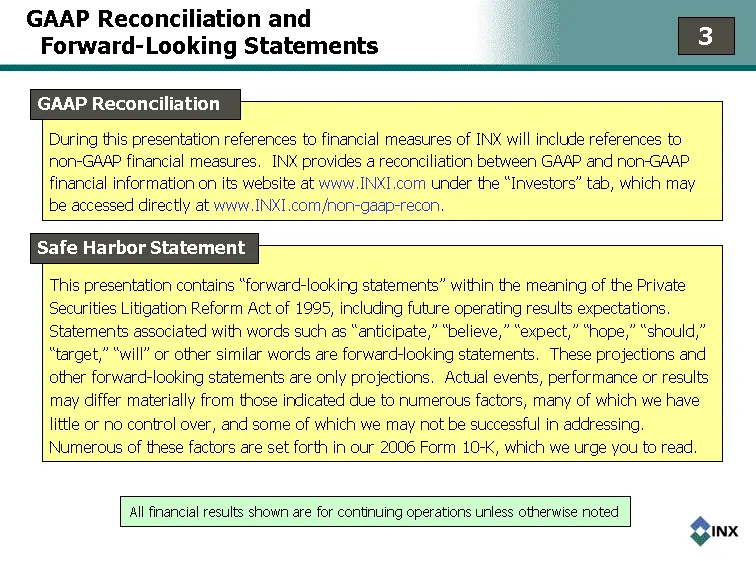
Slide 3: GAAP Reconciliation and Forward-Looking Statements
GAAP Reconciliation and Forward-Looking Statements This presentation contains "forward-looking statements" within the meaning of the Private Securities Litigation Reform Act of 1995, including future operating results expectations. Statements associated with words such as "anticipate," "believe," "e
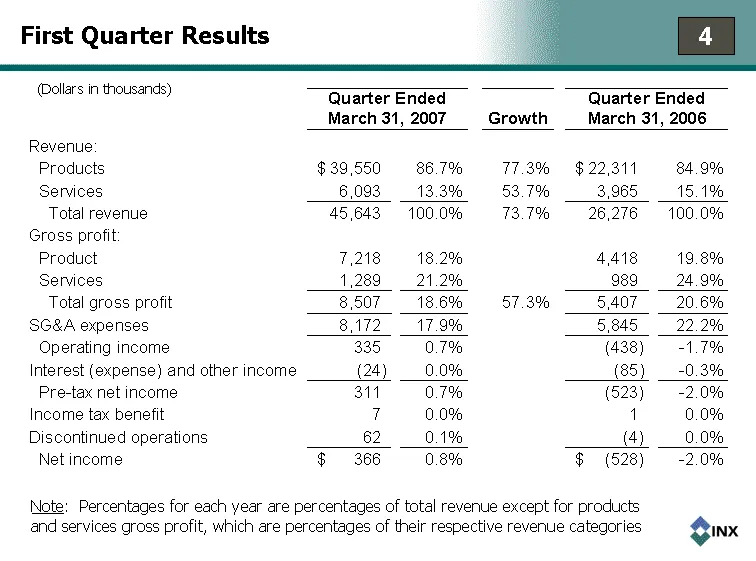
Slide 4: First Quarter Results
First Quarter Results Note: Percentages for each year are percentages of total revenue except for products and services gross profit, which are percentages of their respective revenue categories (Dollars in thousands)
Slide 5: Balance Sheet Data
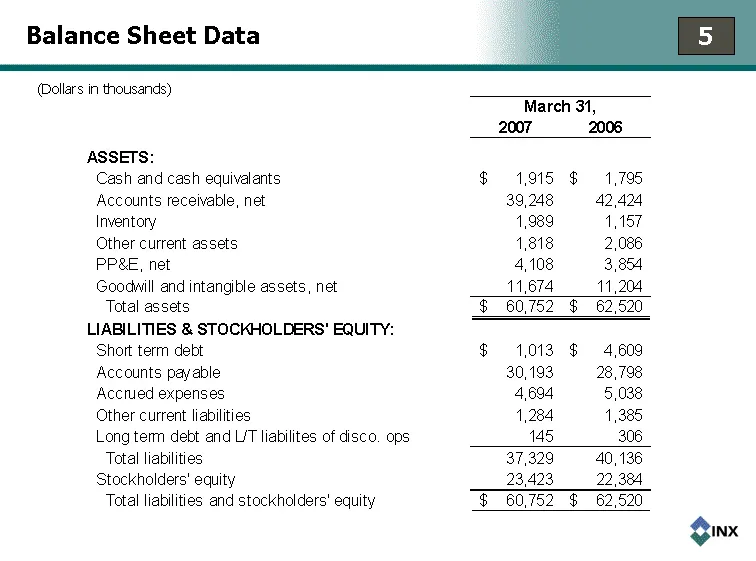
Balance Sheet Data (Dollars in thousands)
Slide 6: First Quarter Highlights
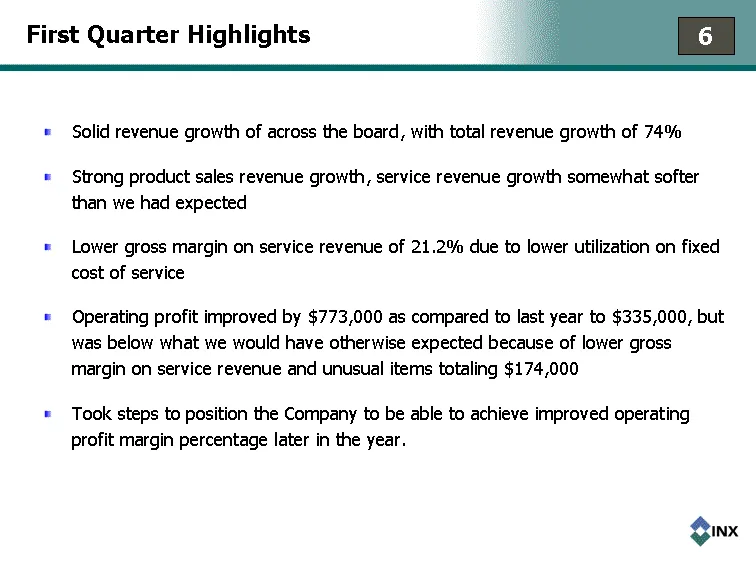
First Quarter Highlights Solid revenue growth of across the board, with total revenue growth of 74% Strong product sales revenue growth, service revenue growth somewhat softer than we had expected Lower gross margin on service revenue of 21.2% due to lower utilization on fixed cost of service Operat
Slide 7: Recent Trends and Events
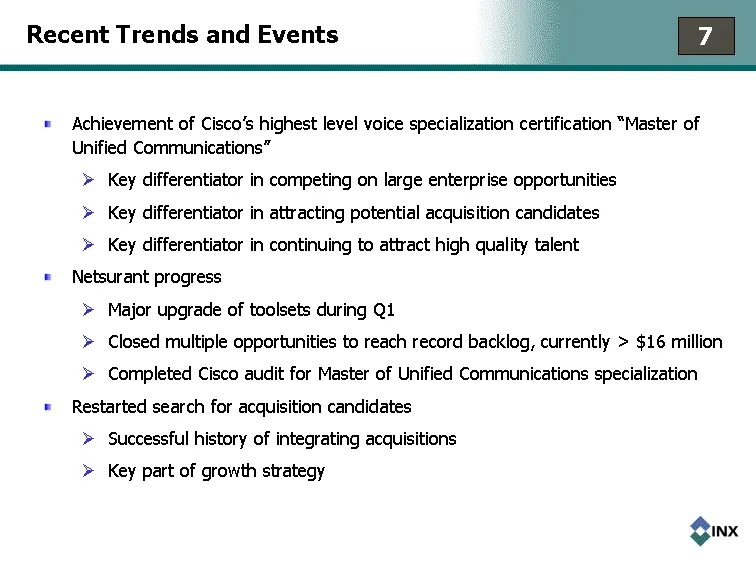
Recent Trends and Events Achievement of Cisco's highest level voice specialization certification "Master of Unified Communications" Key differentiator in competing on large enterprise opportunities Key differentiator in attracting potential acquisition candidates Key differentiator in continuing to
Slide 8: Our Longer-Term Financial Expectations
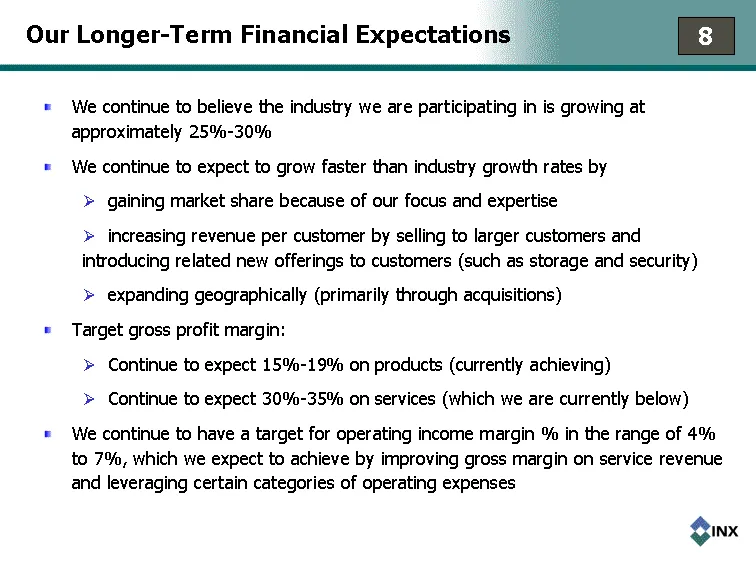
Our Longer-Term Financial Expectations We continue to believe the industry we are participating in is growing at approximately 25%-30% We continue to expect to grow faster than industry growth rates by gaining market share because of our focus and expertise increasing revenue per customer by selling
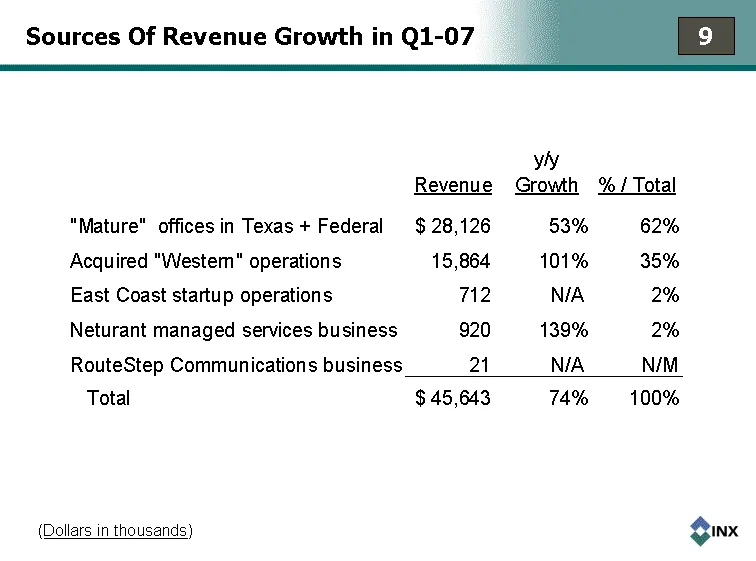
Slide 9: Sources Of Revenue Growth in Q1-07
Sources Of Revenue Growth in Q1-07 (Dollars in thousands)
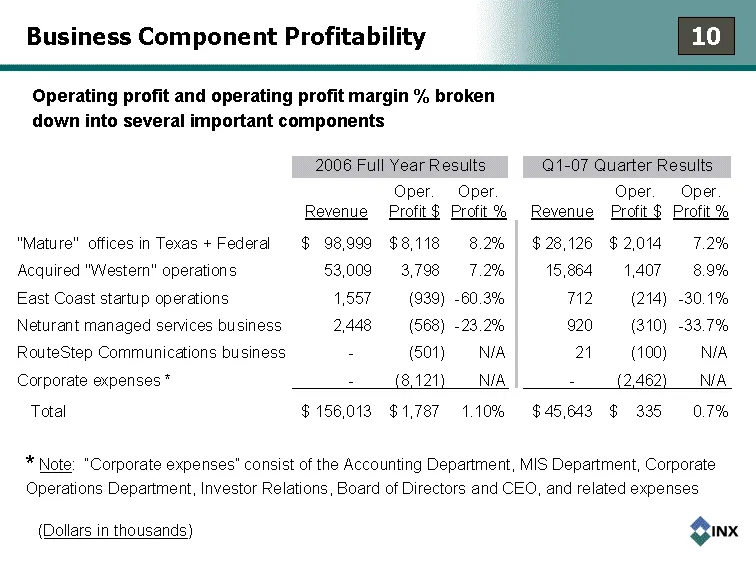
Slide 10: Business Component Profitability
Business Component Profitability * Note: "Corporate expenses" consist of the Accounting Department, MIS Department, Corporate Operations Department, Investor Relations, Board of Directors and CEO, and related expenses (Dollars in thousands) Operating profit and operating profit margin % broken down
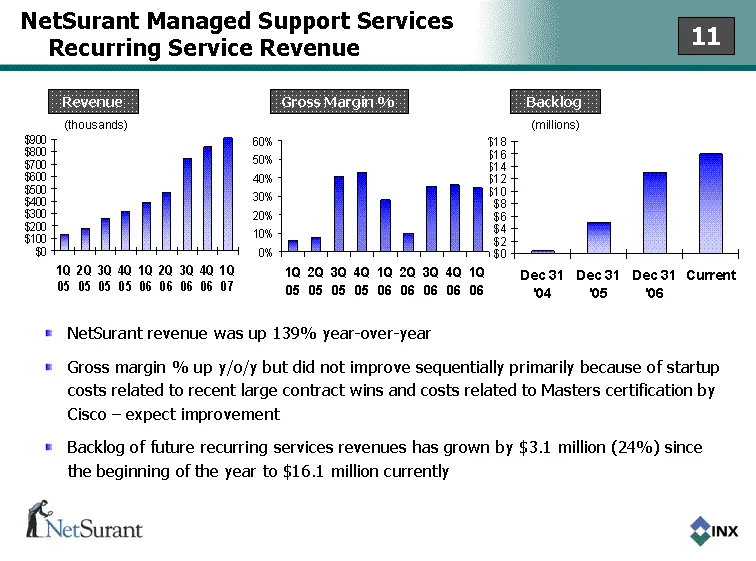
Slide 11: NetSurant Managed Support Services Recurring Service Revenue
NetSurant Managed Support Services Recurring Service Revenue Recurring Service Revenue Recurring Service Revenue 1Q 05 2Q 05 3Q 05 4Q 05 1Q 06 2Q 06 3Q 06 4Q 06 1Q 07 Quarterly Revenue (,000) 134 180 265 318 385 472 747 839 920 Dec 31 '04 Dec 31 '05 Dec 31 '06 Current Contract Value 0.445 5.025 13 1
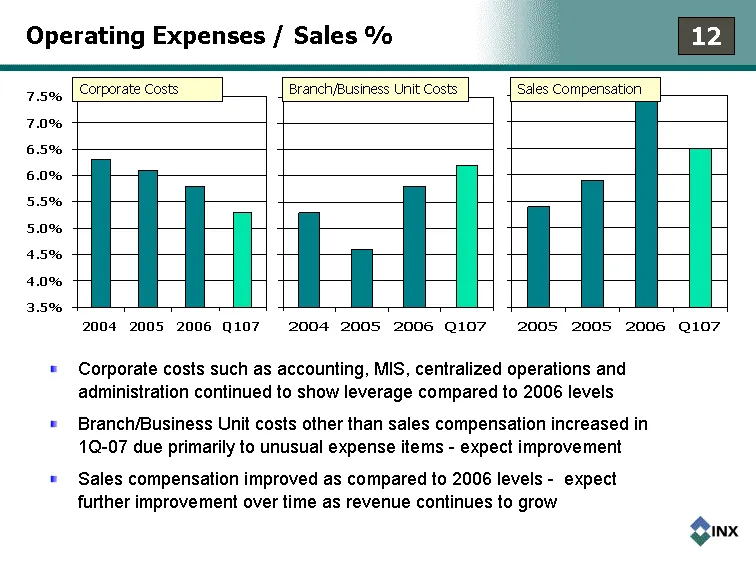
Slide 12: Operating Expenses / Sales %
2005 2005 2006 Q107 Sales compensation 0.054 0.059 0.074 0.065 Operating Expenses / Sales % 2004 2005 2006 Q107 0.053 0.046 0.058 0.062 Sales Compensation Corporate costs such as accounting, MIS, centralized operations and administration continued to show leverage compared to 2006 levels Branch/Busi
Slide 13: Q2 Outlook
Q2 Outlook We currently expect revenue in the range of $46-$48 million for our 2nd quarter ending June 30, 2007 - a y/o/y increase of 16% to 24% While we continue to maintain our long-term target for gross margin on service revenue of 30%-35%, we do not expect to achieve target levels by Q2. We anti
Slide 14: The Path to Target Operating Profit Margin %
The Path to Target Operating Profit Margin % Achieving our target operating profit margin percentage of 4%-7% will require: Material increase in revenue from branch office operations, including a combination of organic growth and acquisitions, while leveraging corporate costs Improve performance of
Slide 15: Highlights
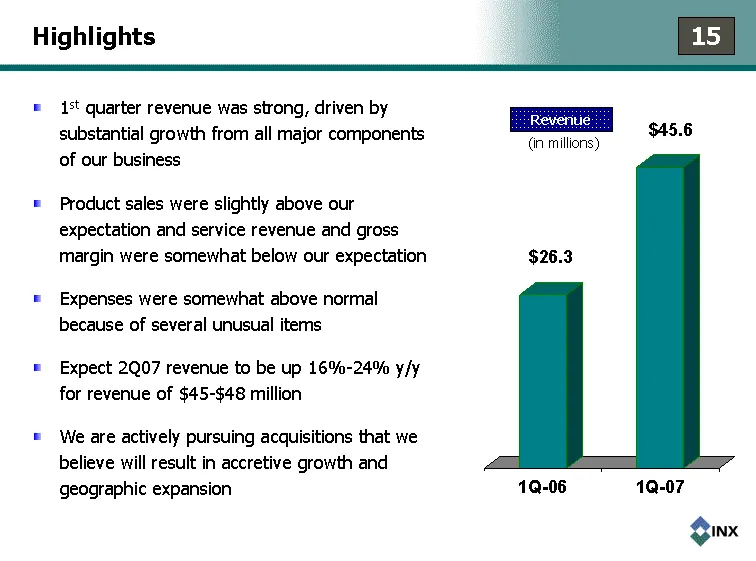
Highlights 1st quarter revenue was strong, driven by substantial growth from all major components of our business Product sales were slightly above our expectation and service revenue and gross margin were somewhat below our expectation Expenses were somewhat above normal because of several unusual
Source: SEC EDGAR · 8-K filed May 3, 2007
More decks from INX Inc
 Merger or Acquisition (November 2011)10 slides · Nov 1, 2011
 Rodman & Renshaw Global Investment Conference 201120 slides · Sep 13, 2011
 Shareholder Meeting (July 2011)15 slides · Jul 19, 2011
 Q1 2011 Earnings Presentation15 slides · Jul 13, 2011
 FY2010 Earnings Presentation28 slides · Jun 6, 2011
 Corporate Update (November 2010)24 slides · Nov 10, 2010