INX — FY2010 Earnings Presentation
28 slides from INX's earnings presentation, Jun 6, 2011
Slide 1: Financial Restatement & Financial Results Investor Conference Call
Financial Restatement & Financial Results Investor Conference Call June 6, 2011 ‘ Jim Long, Executive Chairman Mark Hilz, President & CEO Philip Rydzewski, Sr. VP & CFO
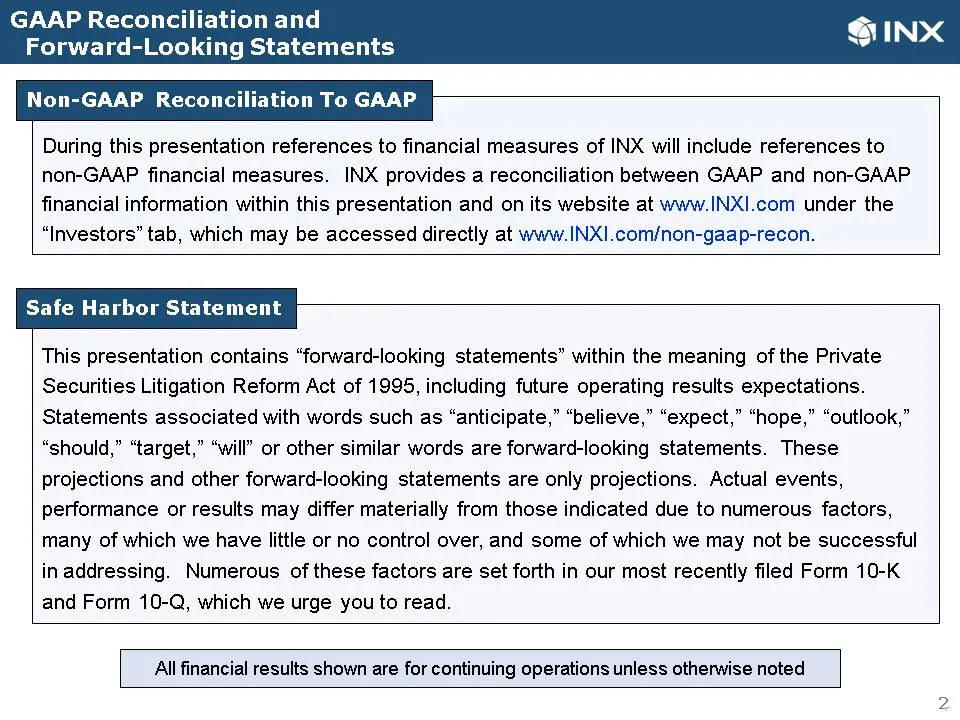
Slide 2: Forward-Looking Statements; Non-GAAP Reconciliation To GAAP
@INX Forward-Looking Statements Non-GAAP Reconciliation To GAAP During this presentation references to financial measures of INX will include references to non-GAAP financial measures. INX provides a reconciliation between GAAP and non-GAAP. financial information within this presentation and on its
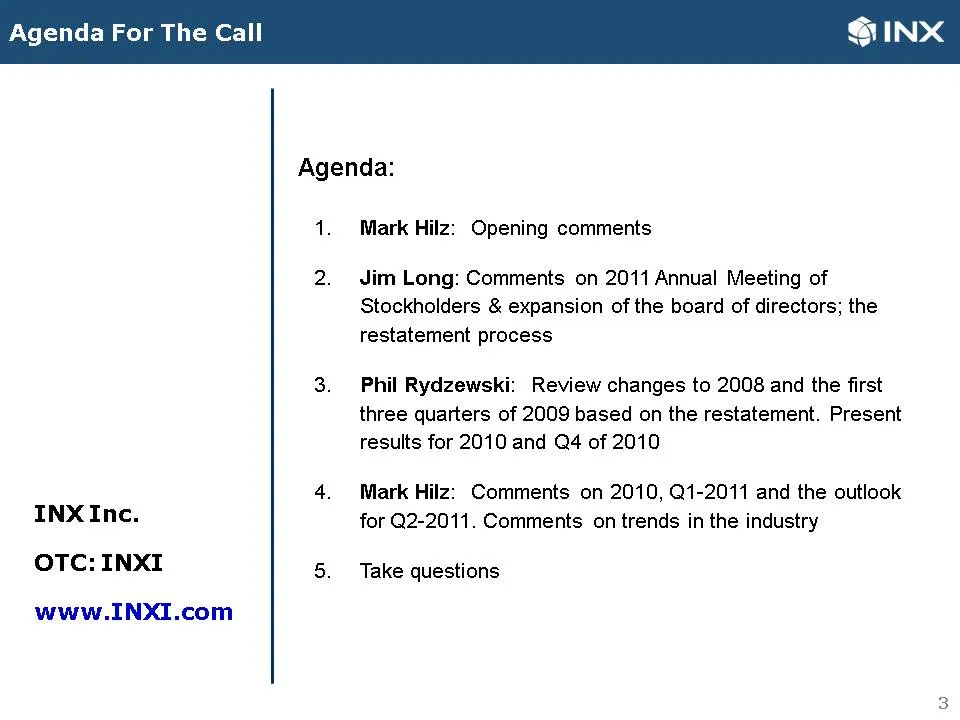
Slide 3: Agenda For The Call
Agenda For The Call SINX Agenda: 1. Mark Hilz: Opening comments 2. Jim Long: Comments on 2011 Annual Meeting of Stockholders & expansion of the board of directors; the restatement process 3. Phil Rydzewski: Review changes to 2008 and the first three quarters of 2009 based on the restatement. Present
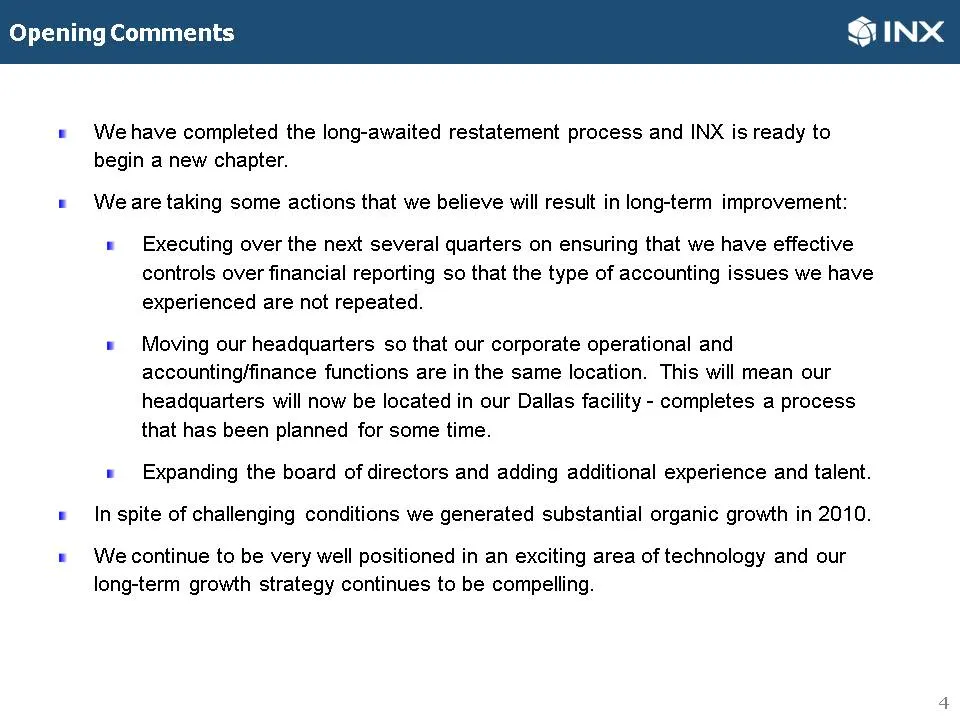
Slide 4: Opening Comments
Opening Comments SINX ® Wehave completed the long-awaited restatement process and INX is ready to begin a new chapter. ® Weare taking some actions that we believe will result in long-term improvement: ® Executing over the next several quarters on ensuring that we have effective controls over financi
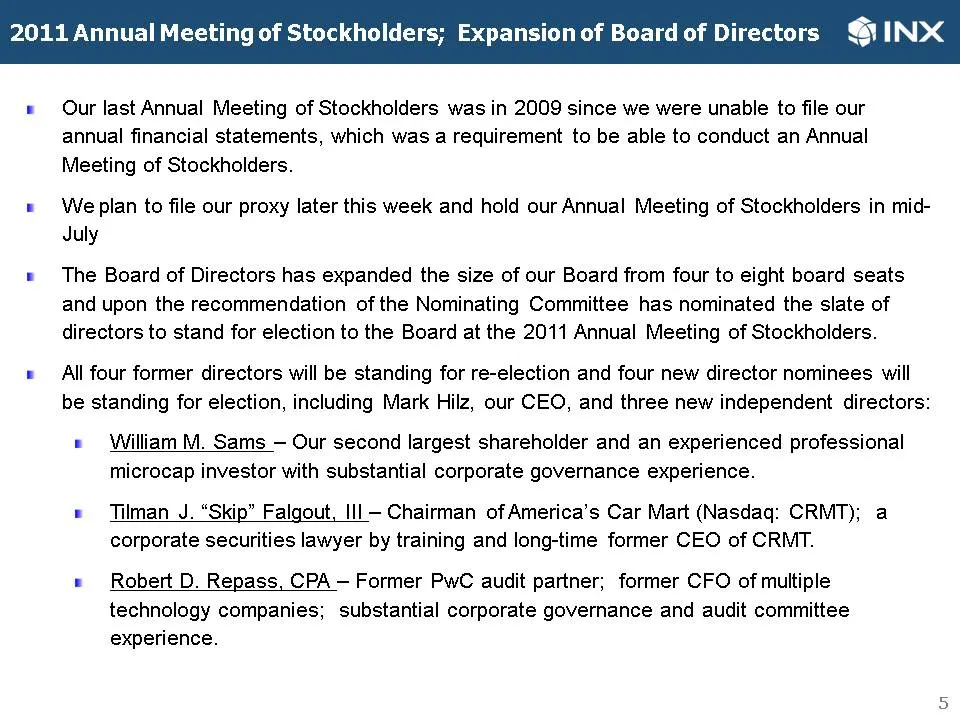
Slide 5: Annual Meeting of Stockholders; Expansion of Board of Directors
dof Directors &INX f Stockholders; Expansion of B e Our last Annual Meeting of Stockholders was in 2009 since we were unable to file our annual financial statements, which was a requirement to be able to conduct an Annual Meeting of Stockholders. «® Weplan to file our proxy later this week and hold
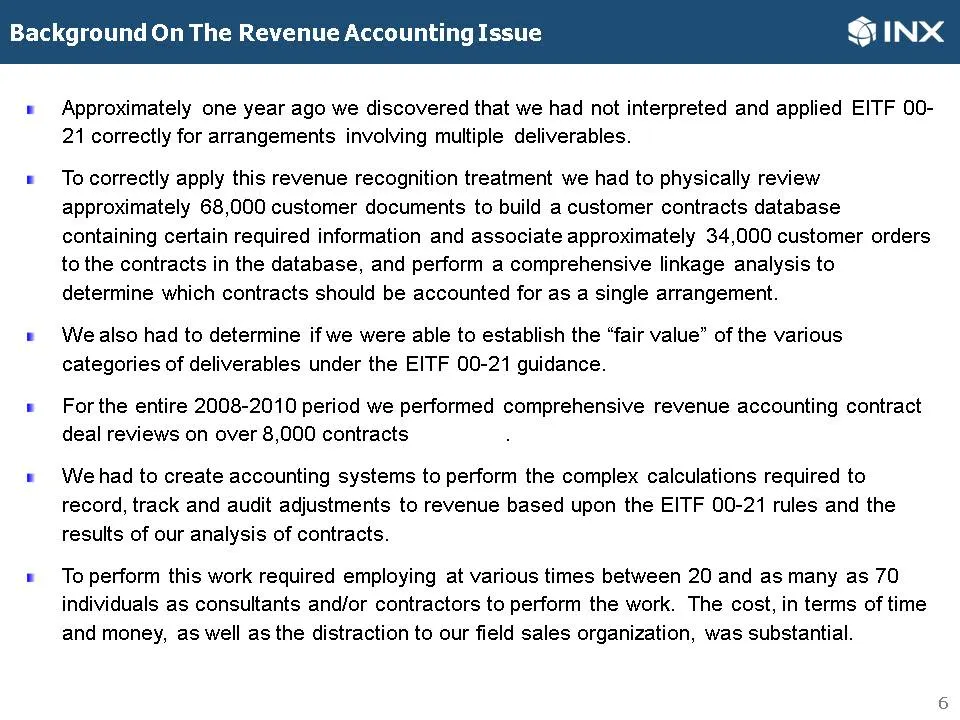
Slide 6: Background On The Revenue Accounting Issue
Background On The Revenue Accounting Issue SINX ® Approximately one year ago we discovered that we had not interpreted and applied EITF 00- 21 correctly for arrangements involving multiple deliverables. ® ‘Tocorrectly apply this revenue recognition treatment we had to physically review approximately
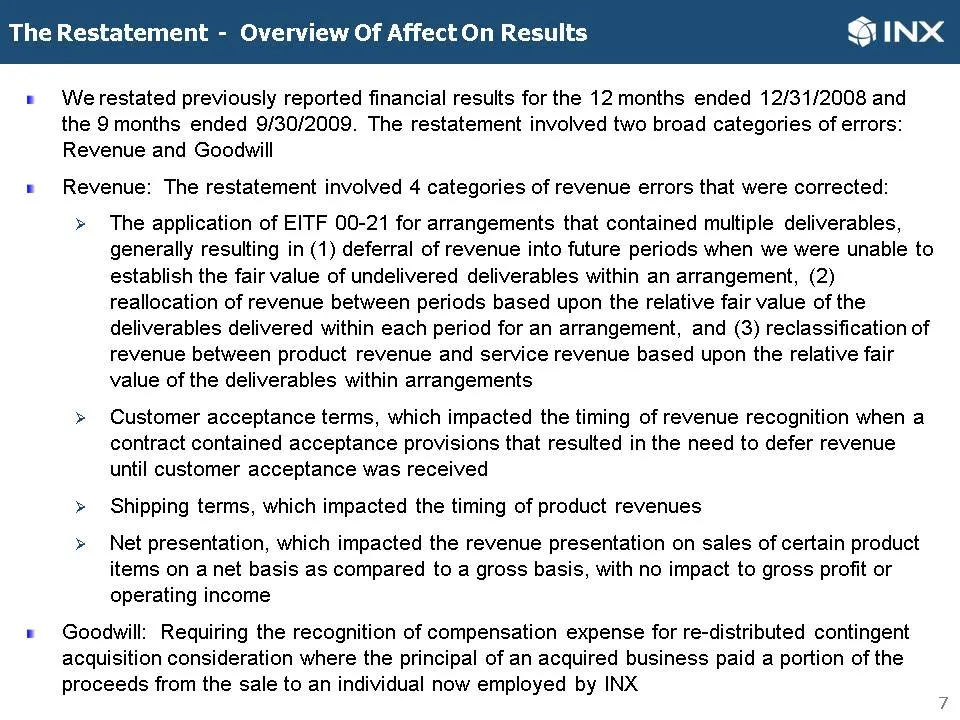
Slide 7: The Restatement — Overview Of Affect On Results
The Restateme! Overview Of Affect On Results SINX « Werestated previously reported financial results for the 12 months ended 12/31/2008 and the 9 months ended 9/30/2009. The restatement involved two broad categories of errors: Revenue and Goodwill ® Revenue: The restatement involved 4 categories of
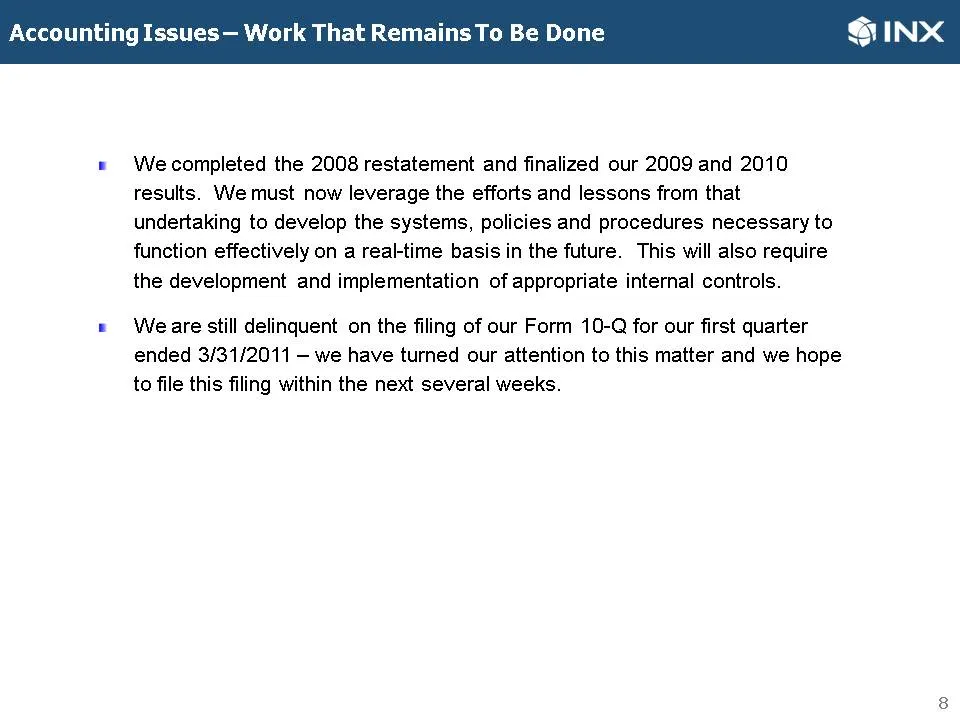
Slide 8: Accounting Issues — Work That Remains To Be Done
Accounting Issues— Work That Remains To Be Done SINX « Wecompleted the 2008 restatement and finalized our 2009 and 2010 results. Wemust now leverage the efforts and lessons from that undertaking to develop the systems, policies and procedures necessary to function effectively on a real-time basis in
Slide 9: Review of Financial Results Including Affect of Restatement
Review of Financial Results Including Affect of Restatement for 2008 and 9 months ended 9/30/2009 Philip Rydzewski Sr. Vice President & CFO
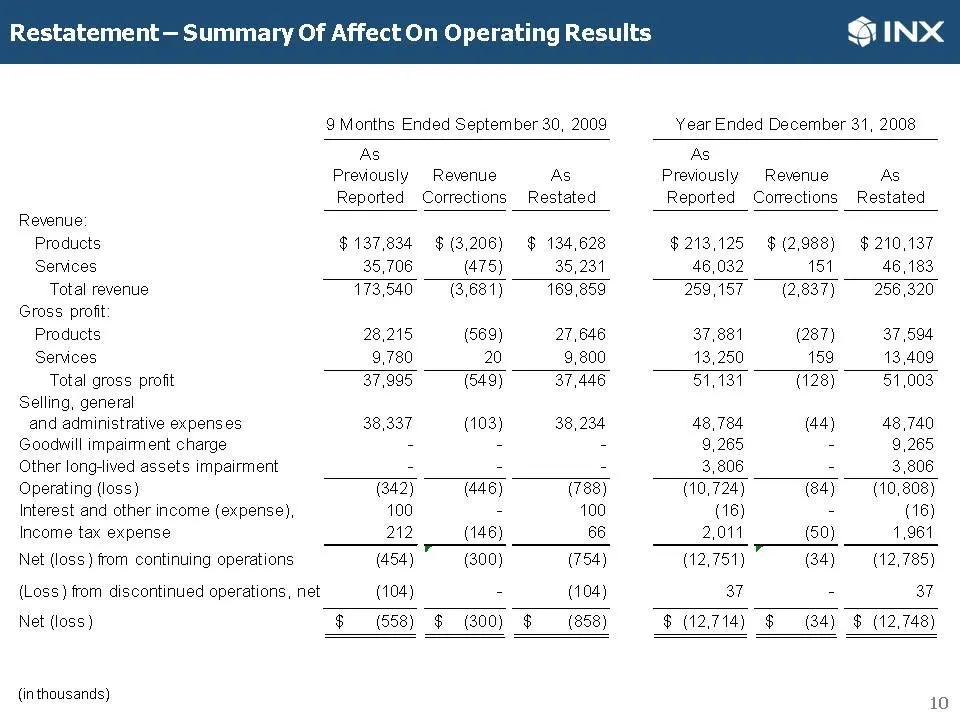
Slide 10: Restatement — Summary Of Affect On Operating Results
Restatement— Summary Of Affect On Operating Results SINX 9 Months Ended September 30, 2009 ‘Year Ended December 31, 2008 AS AS Previously Revenue As Previously Revenue As Reported Corrections Restated Reported Corrections Restated Revenue. Products $ 137,834 $ (3,206) $ 134,628 $213,125 $ (2,988) $2
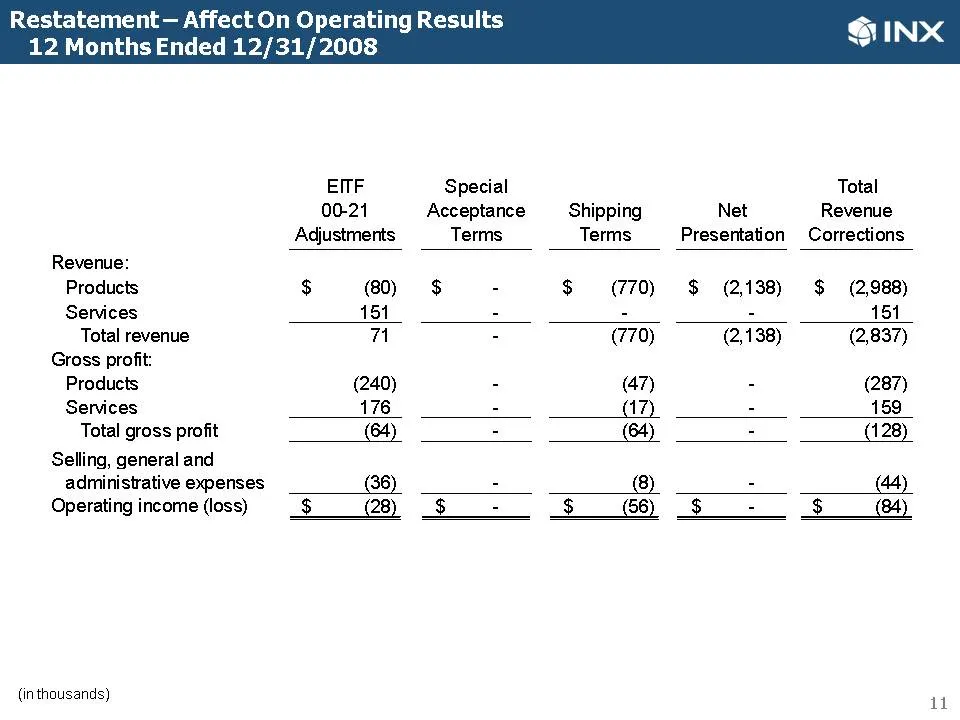
Slide 11: Restatement — Affect On Operating Results, Year Ended 12/31/2008
Restatement — Affect On Operating Results 12 Months Ended 12/31/2008 @INX ETF Special Total 00-21 Acceptance Shipping Net Revenue Adjustments Terms Terms Presentation Corrections Revenue: Products $ (80) $ s $ (770) $ (2,138) $ (2,988) Services 154 : - : 151 Total revenue 71 - (770) (2,138) (2,837)
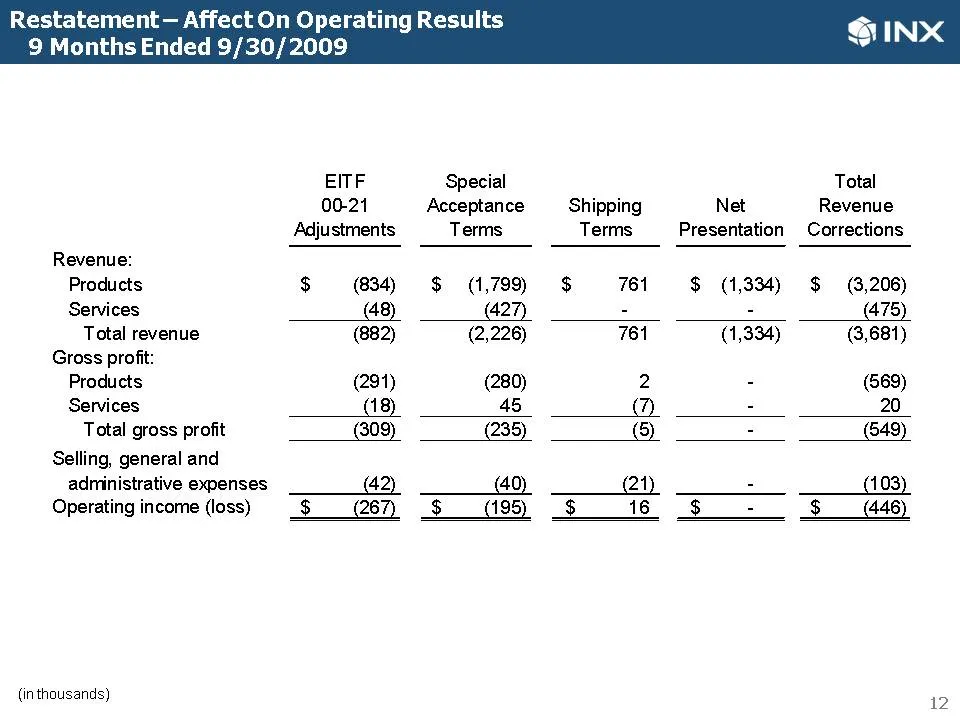
Slide 12: Restatement — Affect On Operating Results, Nine Months Ended 9/30/2009
Restatement — Affect On Operating Results s Ended 9/30/2009 SINX EITF Special Total 00-21 Acceptance Shipping Net Revenue Adjustments Terms Terms Presentation Corrections Revenue: Products $ (834) $ (1,799 $ 761 $ (1,334) $ (3,206) Services (48) (427) : : (475) Total revenue (882) (2,226) 761 (1,334
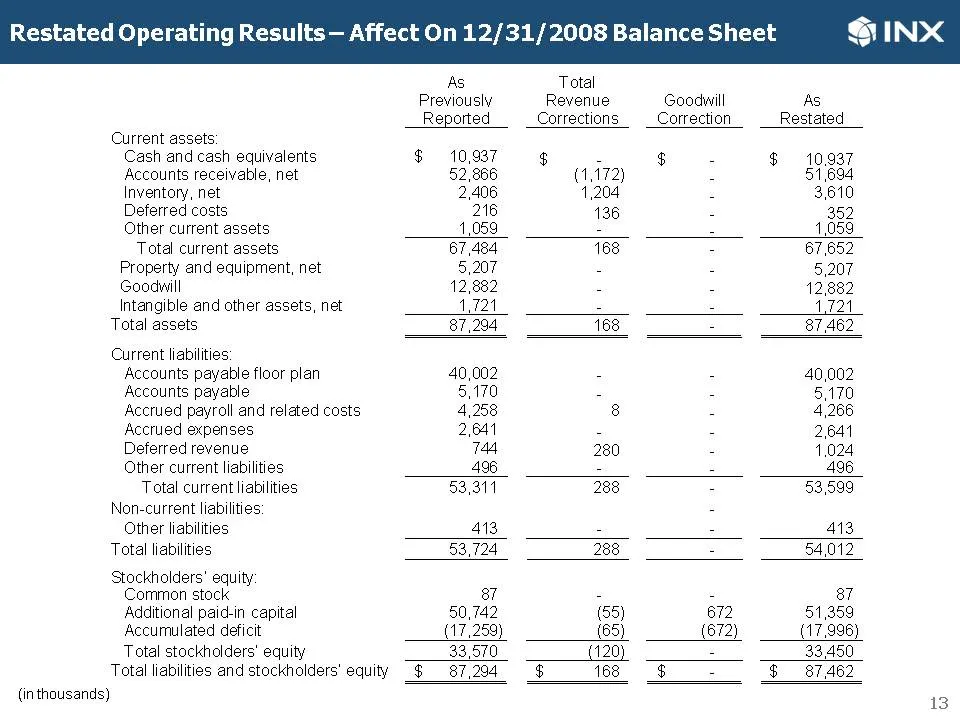
Slide 13: Restated Operating Results — Affect On 12/31/2008 Balance Sheet
Restated Operating Results — Affect On 12/31/2008 Balance Sheet SINX As Total Previously Revenue Goodwill As Reported Corrections _Correction Restated Current assets: Cash and cash equivalents $ 10.987 - $e $ 10.937 Accounts receivable, net 52,866 (1,472) : 51,694 Inventory, net 2,406 1,204 2 3.610
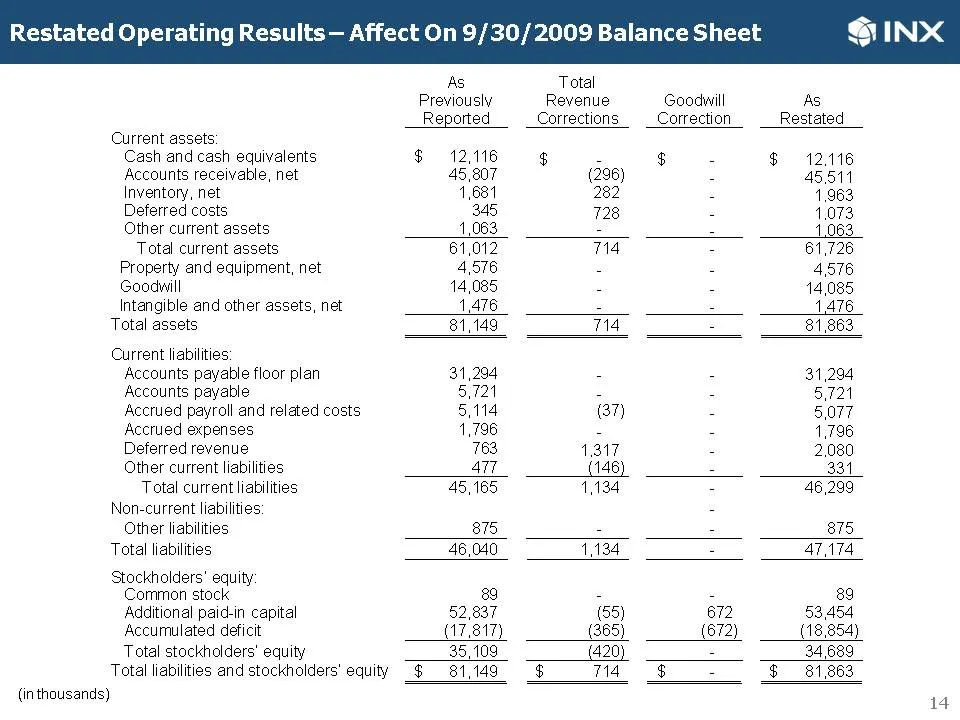
Slide 14: Restated Operating Results — Affect On 9/30/2009 Balance Sheet
Restated Operating Results — Affect On 9/30/2009 Balance Sheet SINX As Total Previously Revenue Goodwill As Reported Corrections _Correction Restated Current assets: Cash and cash equivalents $ 12116 ¢ - $e $ 12,116 Accounts receivable, net 45,807 (296) : 45541 Inventory, net 1,681 282 2 1.963 Defer
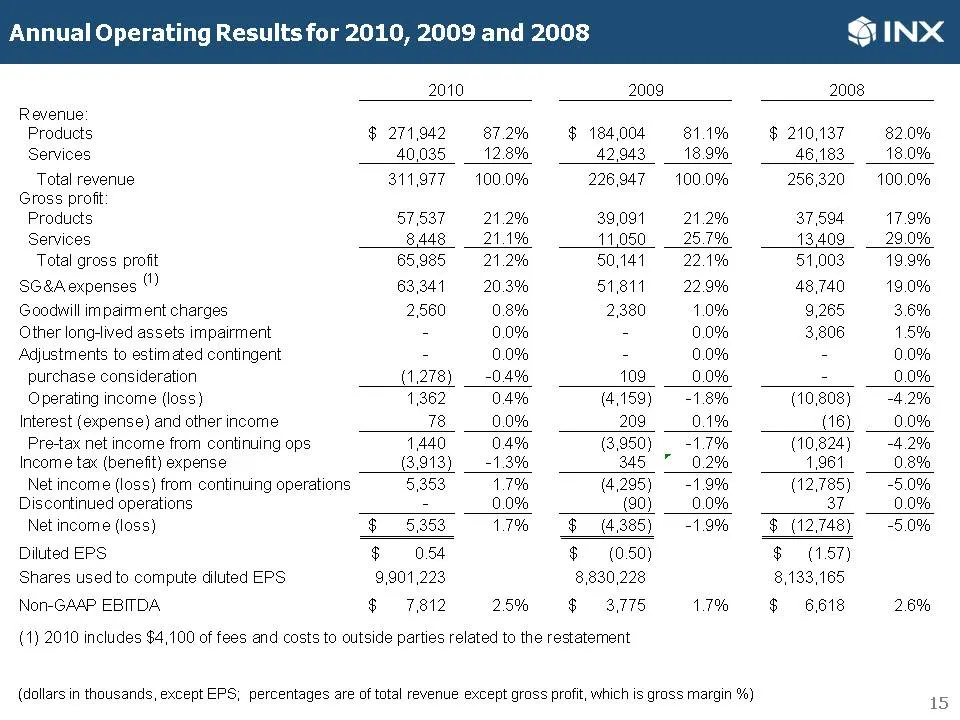
Slide 15: Annual Operating Results for 2010, 2009 and 2008
Annual Operating Results for 2010, 2009 and 2008 2010 2009 2008 Revenue Products $ 271.942 87.2% $ 184,004 81.1% = 210,137 82.0% Services 40,035 _ 128% 42943 _ 18.9% 46,183 __ 18.0% Total revenue 311977 100.0% 226,947 100.0% 256,320 100.0% Gross profit Products 57537 21.2% 39091 21.2% 37,594 17.9% S
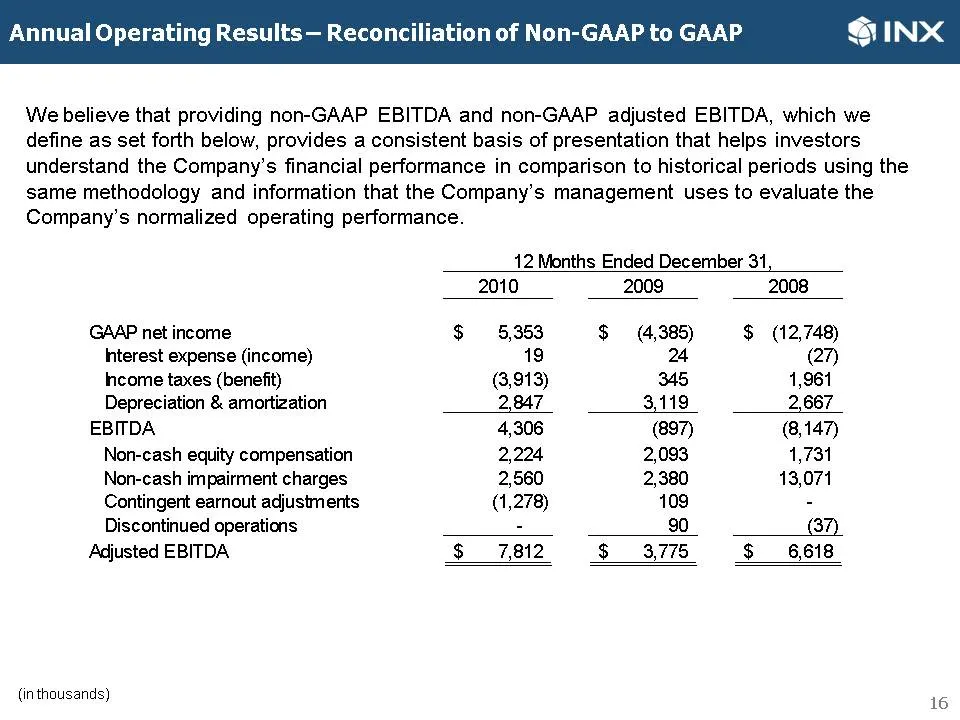
Slide 16: Annual Operating Results — Reconciliation of Non-GAAP to GAAP
Annual Operating Results — Reconciliation of No JAAP to GAAP SINX We believe that providing non-GAAP EBITDA and non-GAAP adjusted EBITDA, which we define as set forth below, provides a consistent basis of presentation that helps investors understand the Company’s financial performance in comparison
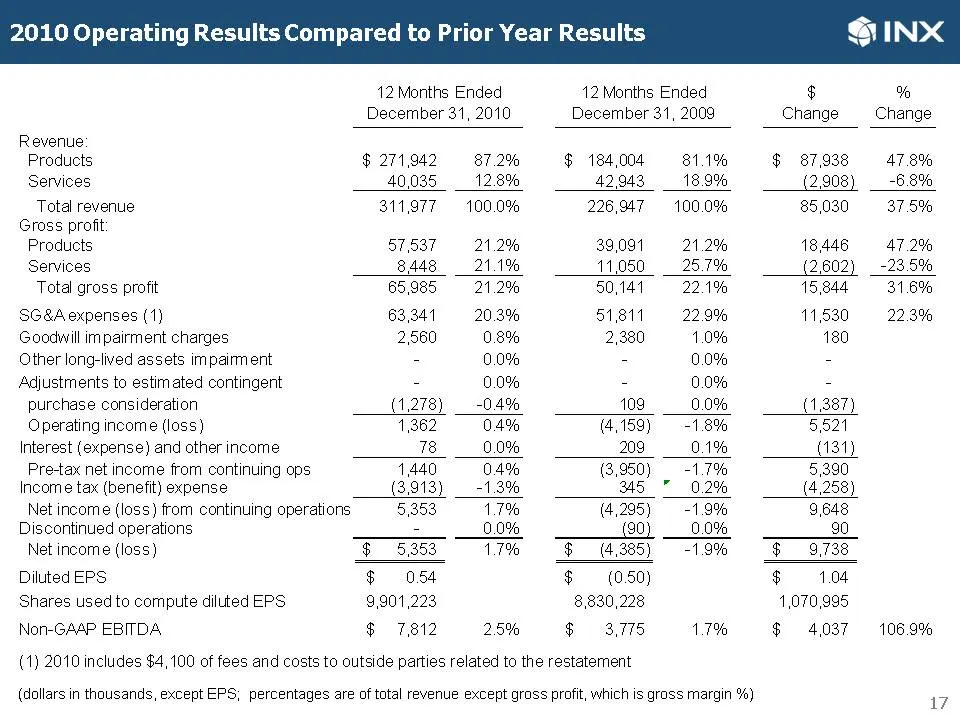
Slide 17: 2010 Operating Results Compared to Prior Year Results
2010 Operating Results Compared to Prior Year Results 12 Months Ended 12 Months Ended $ % December 31, 2010 December 31, 2009 Change Change Revenue Products $ 271942 87.2% § 184,004 81.1% § 87,938 478% Services 40,035. _ 12.8% 42,943 18.9% (2,908) _ -6.8% Total revenue 311,977 100.0% 226,47 100.0% 8
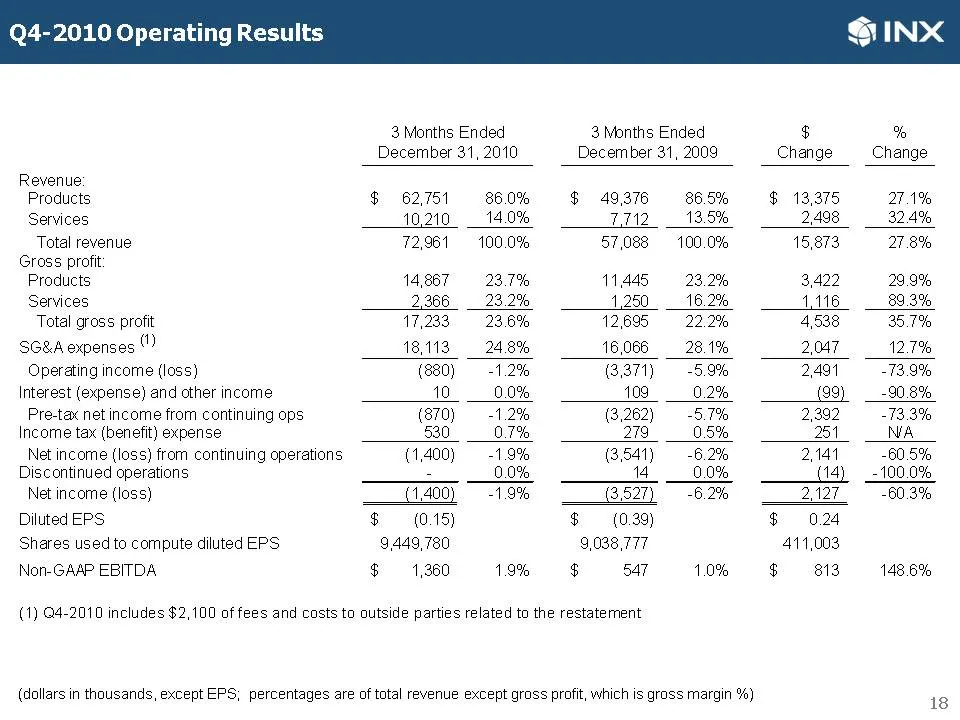
Slide 18: Q4-2010 Operating Results
Q4-2010 Operating Results 3 Months Ended 3 Months Ended $ % December 31, 2010 December 31, 2009 Change Change Revenue Products $ 62751 86.0% $ 49376 865% $ 13375 2.1% Services 10.210 _ 14.0% TI _ 13.5% 2498 __ 32.4% Total revenue 72,961 100.0% 57,088 100.0% 16873 8% Gross profit Products 14867 23.7%
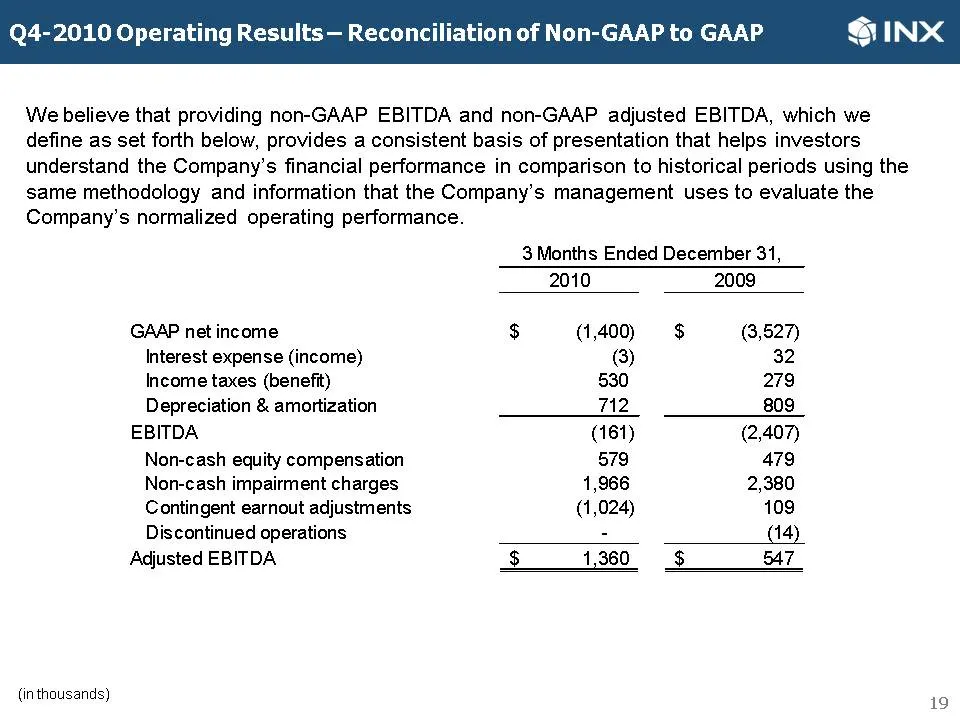
Slide 19: Q4-2010 Operating Results — Non-GAAP Reconciliation
Q4-2010 Operating Results @INX We believe that providing non-GAAP EBITDA and non-GAAP adjusted EBITDA, which we define as set forth below, provides a consistent basis of presentation that helps investors understand the Company’s financial performance in comparison to historical periods using the sam
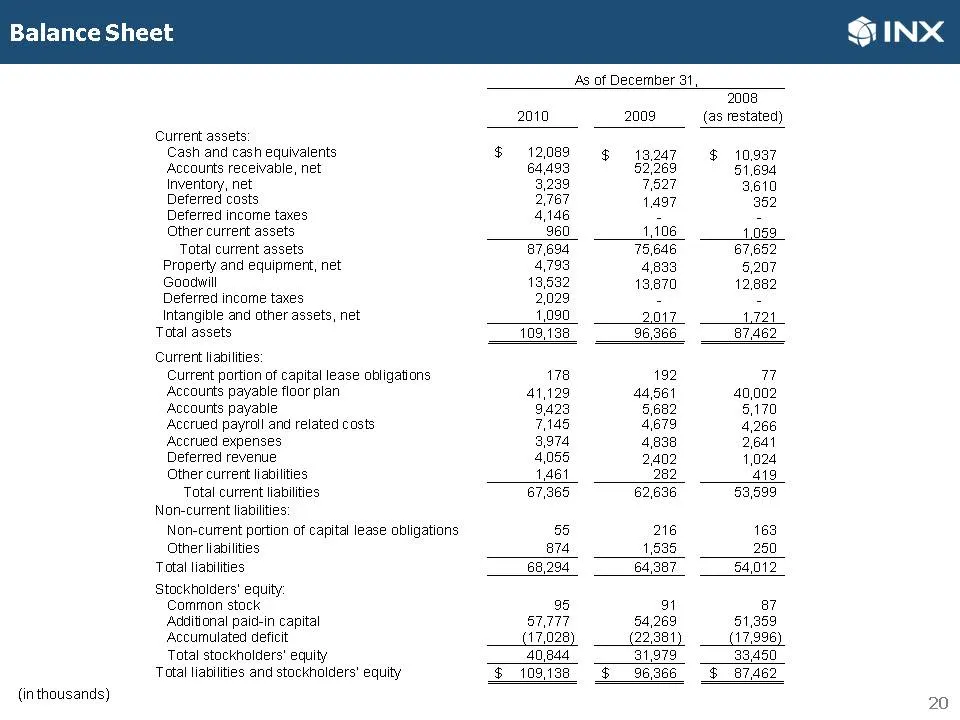
Slide 20: Balance Sheet
Balance Sheet As of December 31, 2008 2010 2008 (as restated) Current assets Cash and cash equivalents $ 12089 § 13247 § 10,937 Accounts recelvable, net 64,493 82,269 51,694 Inventory, net 3,239 7,527 3.610 Deferred costs 2.767 1497 352 Deferred income taxes 4146 - - Other current assets 960 1,106 1
Slide 21: Review of 2010, Industry Trends and the Near Term Outlook
Review of 2010, Industry Trends and the Near Term Outlook Mark Hilz President & CEO
Slide 22: 2010 Highlights and Recent Awards
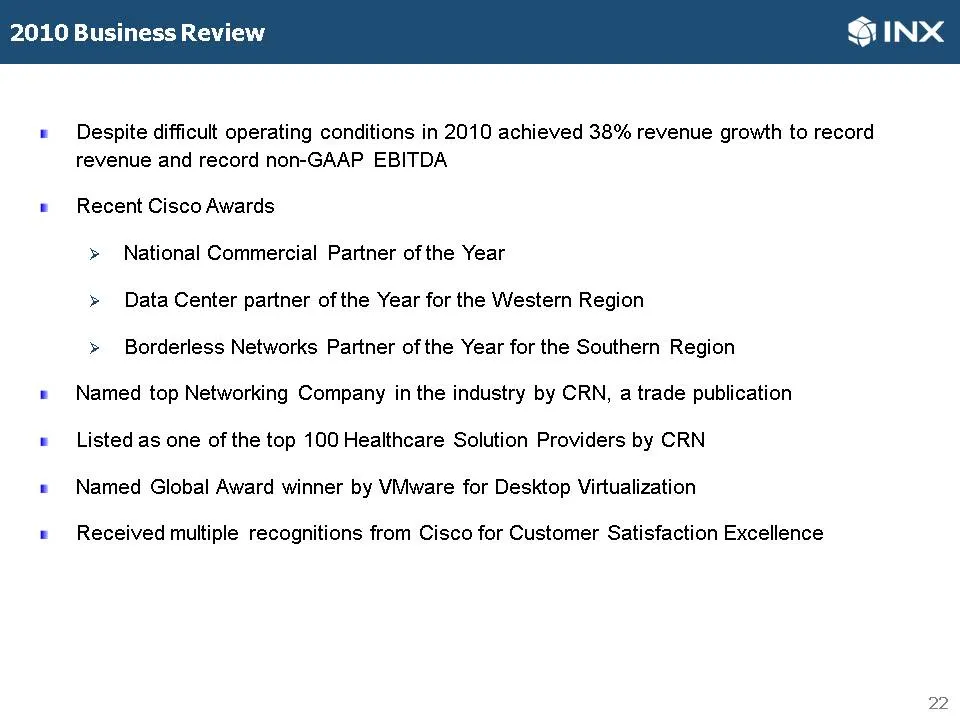
@INX Despite difficult operating conditions in 2010 achieved 38% revenue growth to record revenue and record non-GAAP EBITDA Recent Cisco Awards >» National Commercial Partner of the Year >» Data Center partner of the Year for the Western Region » Borderless Networks Partner of the Year for the Sout
Slide 23: Customer Billings For Top Technology Segments
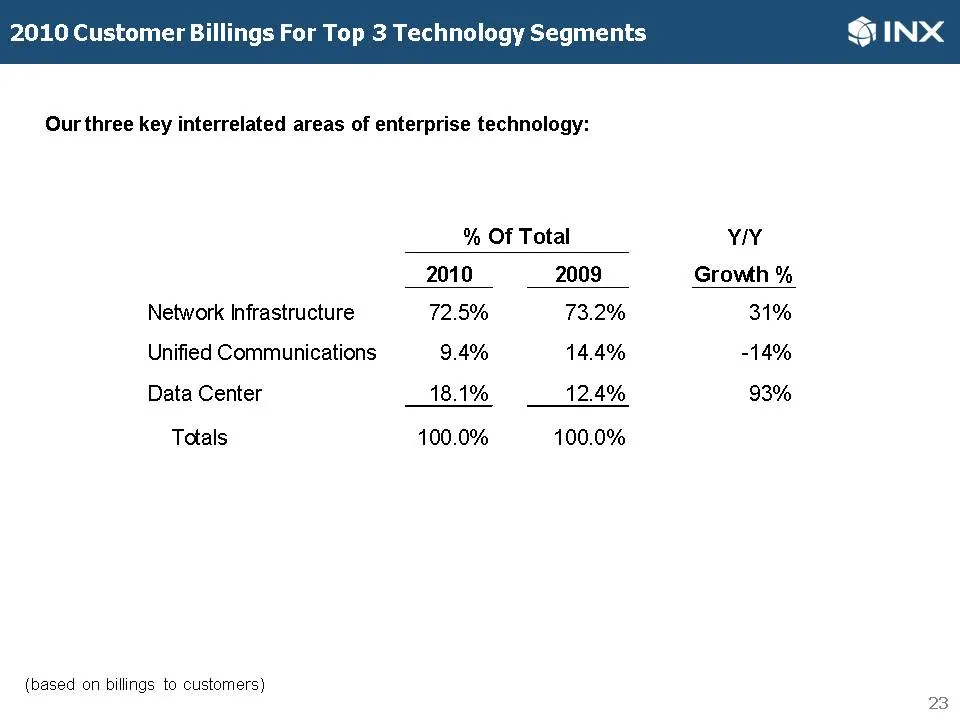
201 stomer Billings For Top 3 Technology Segments Our three key interrelated areas of enterprise technology: Network Infrastructure Unified Communications Data Center Totals (based on billings to custorners) % Of Total YIY 2010 2009 Growth % 72.5% 73.2% 31% 9.4% 14.4% -14% 18.1% 12.4% 93% 100.0% 100
Slide 24: 2010 Customer Billings By Verticals
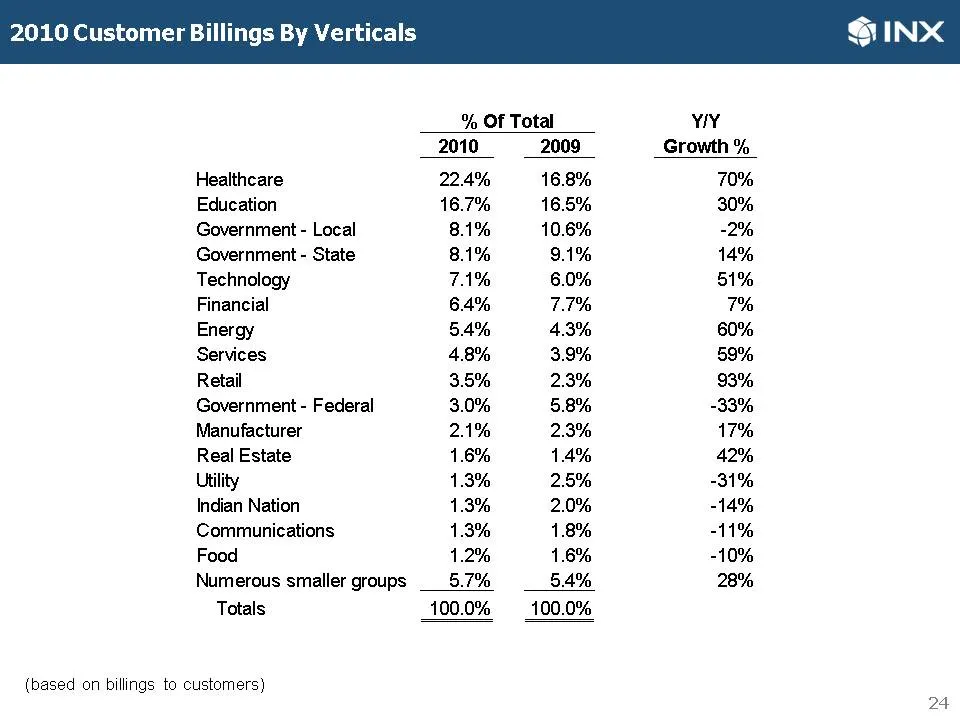
2010 Customer Billings By Verticals SINX % Of Total YY 2010 2009 Growth % Healthcare 22.4% 16.8% 70% Education 16.7% 16.5% 30% Government - Local 8.1% 10.6% -2% Government - State 8.1% 9.1% 14% Technology 7.1% 6.0% 51% Financial 64% 7.7% 7% Energy 54% 43% 60% Services 48% 3.9% 59% Retail 3.5% 2.3% 9
Slide 25: Update On Industry Trends
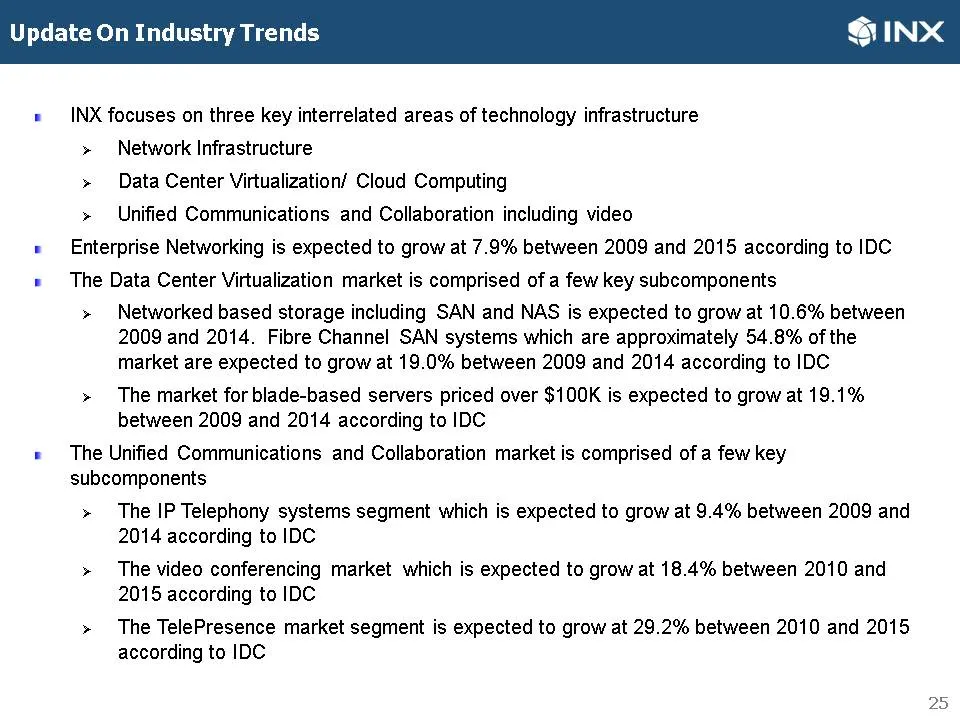
Update On Industry Trends SINX INX focuses on three key interrelated areas of technology infrastructure » Network Infrastructure >» Data Center Virtualization’ Cloud Computing » Unified Communications and Collaboration including video « Enterprise Networking is expected to grow at 7.9% between 2009
Slide 26: Strategic Delivery Framework and Differentiators
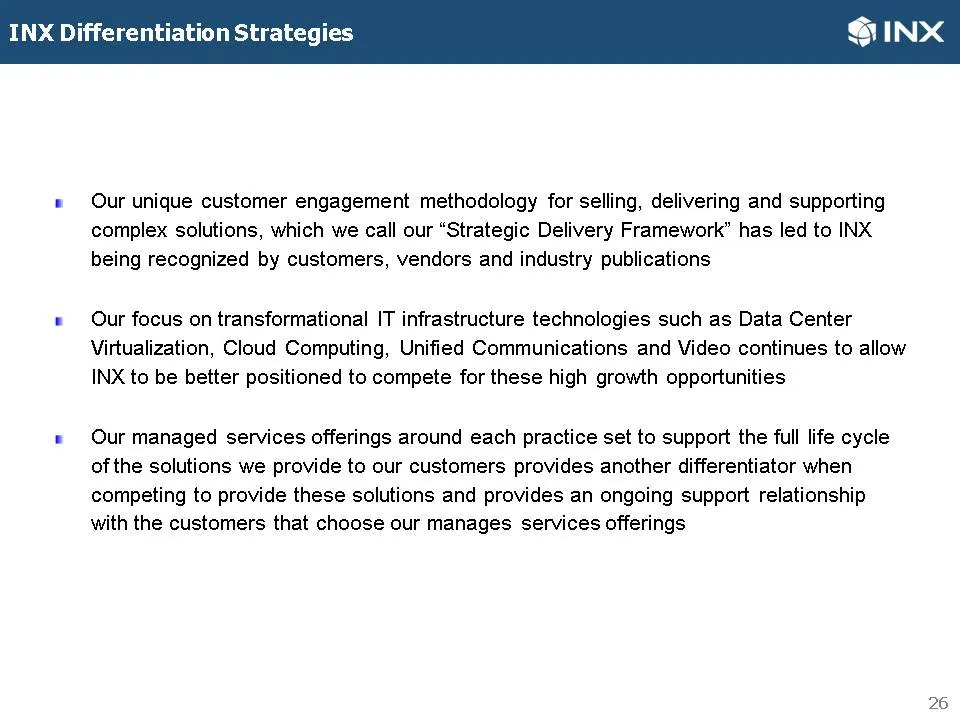
@INX Our unique customer engagement methodology for selling, delivering and supporting complex solutions, which we call our “Strategic Delivery Framework” has led to INX being recognized by customers, vendors and industry publications Our focus on transformational IT infrastructure technologies such
Slide 27: Outlook — Near-Term Expectations
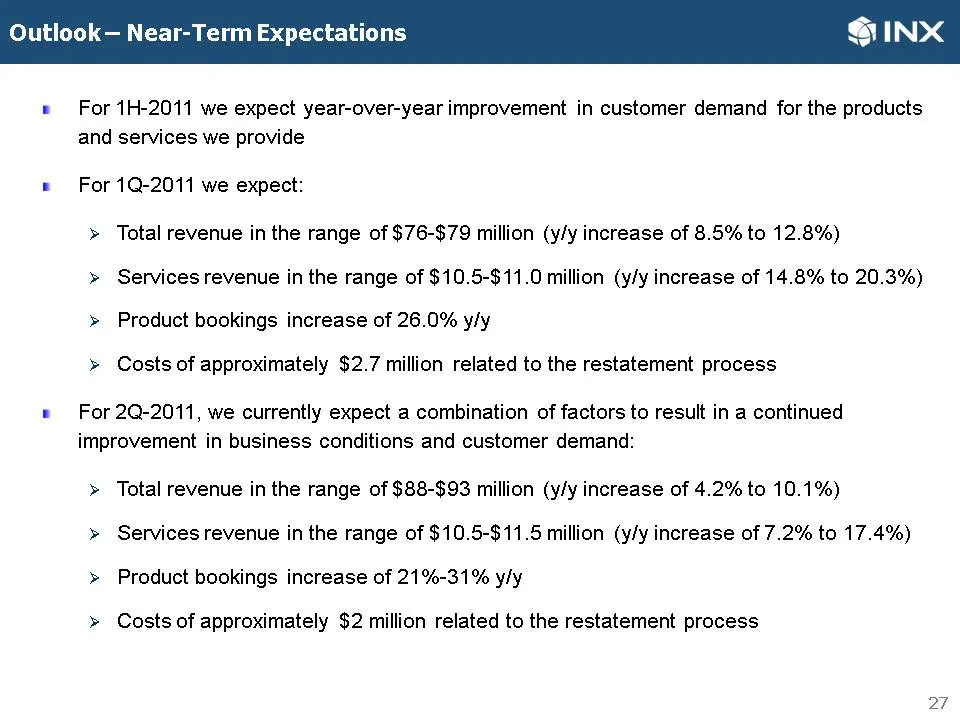
@INX Outlook — Near-Term Expecta ® For 1H-2011 we expect year-over-year improvement in customer demand for the products and services we provide ® For 1Q-2011 we expect: > Total revenue in the range of $76-$79 million (y/y increase of 8.5% to 12.8%) >» Services revenue in the range of $10.5-$11.0 mil
Slide 28: Summary / Highlights
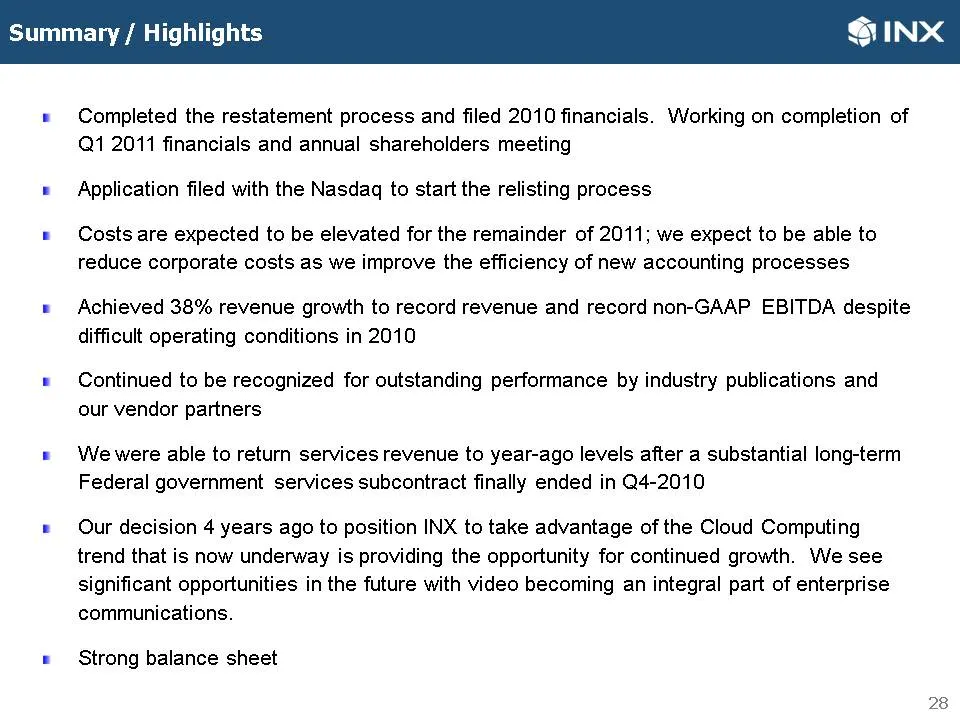
@INX Summary / High! ® Completed the restatement process and filed 2010 financials. Working on completion of Q1 2011 financials and annual shareholders meeting ® Application filed with the Nasdaq to start the relisting process ® Costs are expected to be elevated for the remainder of 2011; we expect
Source: SEC EDGAR · 8-K filed Jun 6, 2011
More decks from INX Inc
 Merger or Acquisition (November 2011)10 slides · Nov 1, 2011
 Rodman & Renshaw Global Investment Conference 201120 slides · Sep 13, 2011
 Shareholder Meeting (July 2011)15 slides · Jul 19, 2011
 Q1 2011 Earnings Presentation15 slides · Jul 13, 2011
 Corporate Update (November 2010)24 slides · Nov 10, 2010
 Q3 2009 Earnings Presentation20 slides · Nov 10, 2009