INX — Q1 2011 Earnings Presentation
15 slides from INX's earnings presentation, Jul 13, 2011
Slide 1: Q1 2011 Investor Conference Call
\ Qi 2011 Investor Conference Call — «J July 13, 2011 Jim Long, Executive Chairman Mark Hilz, President & CEO
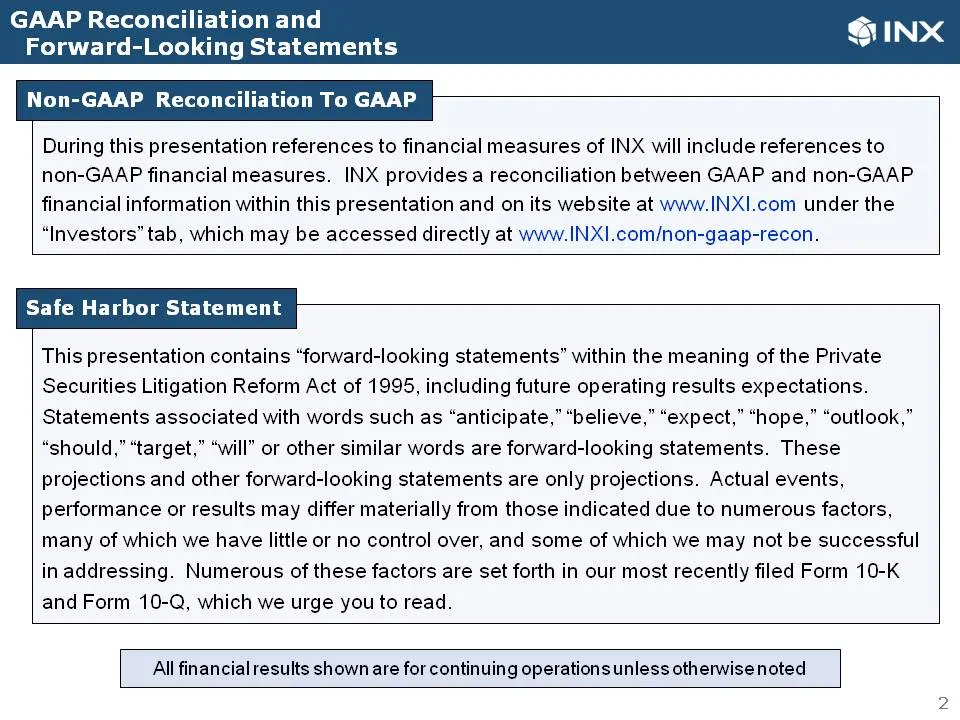
Slide 2: Forward-Looking Statements / Non-GAAP Reconciliation To GAAP
@INX Forward-Looking Statements Non-GAAP Reconciliation To GAAP During this presentation references to financial measures of INX will include references to non-GAAP financial measures. INX provides a reconciliation between GAAP and non-GAAP financial information within this presentation and on its w
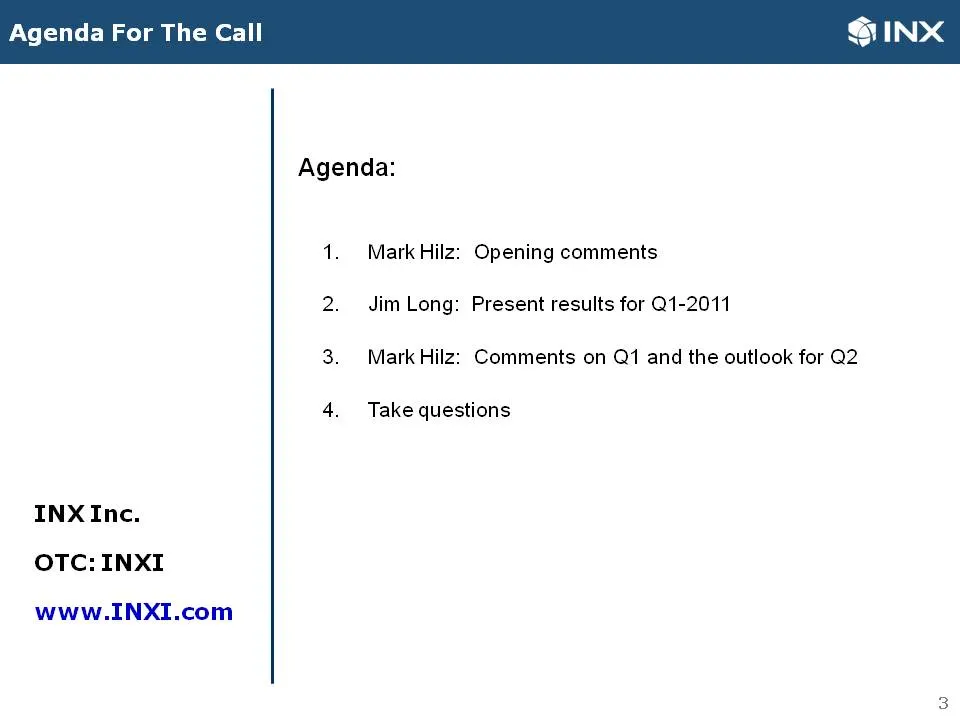
Slide 3: Agenda For The Call
Agenda For The Call SINX Agenda: 1. Mark Hilz: Opening comments 2. Jim Long: Present results for Q1-2011 3. Mark Hilz: Comments on Q1 and the outlook for Q2 4. Take questions INX Inc. oTCc: INXI www.INXI.com
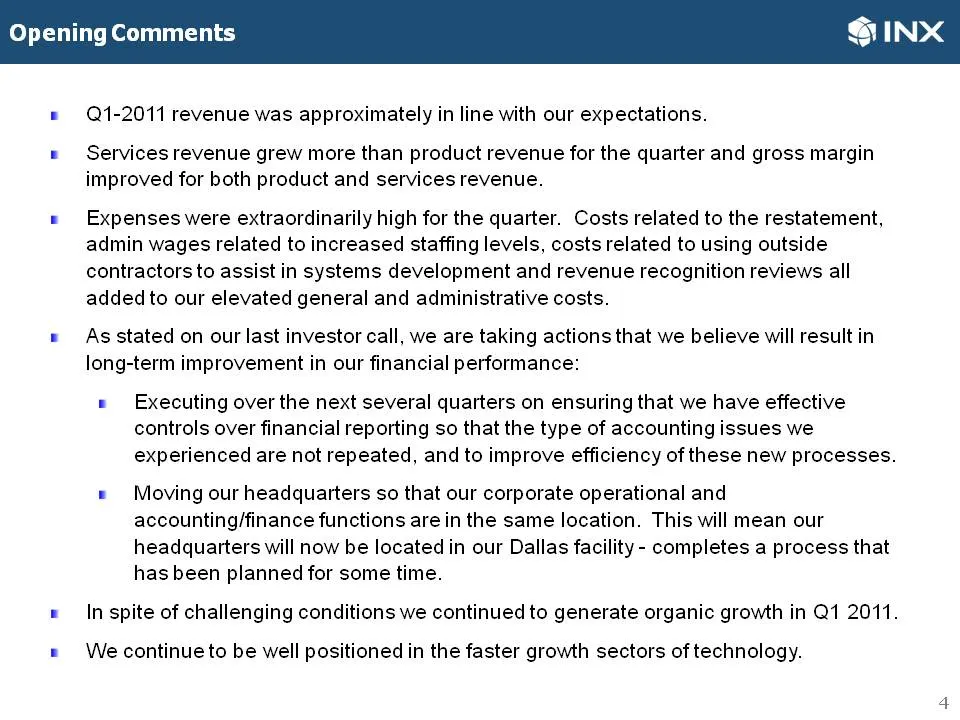
Slide 4: Opening Comments
Opening Comments SINX ® Q1-2011 revenue was approximately in line with our expectations. ® Services revenue grew more than product revenue for the quarter and gross margin improved for both product and services revenue. « Expenses were extraordinarily high for the quarter. Costs related to the resta
Slide 5: Review of Q1-2011 Financial Results
Review of Q1-2011 Financial Results Jim Long Executive Chairman
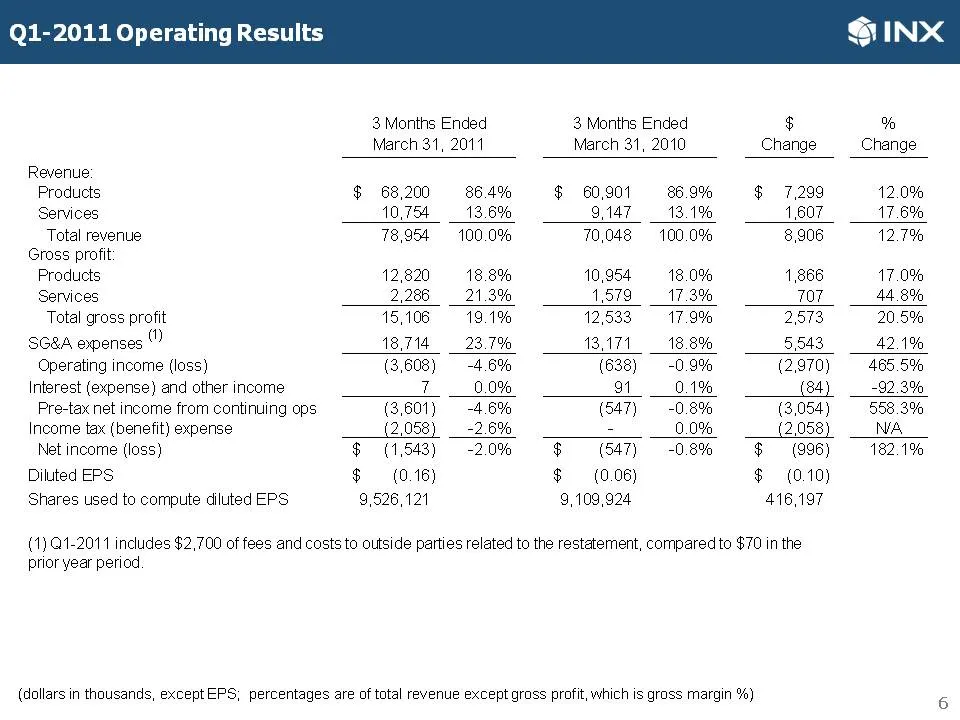
Slide 6: Q1-2011 Operating Results
Q1-2011 Operating Results 3 Months Ended 3 Months Ended $ % March 31, 2011 March 31, 2010 Change _ Change Revenue Products $ 68,200 86.4% $ 60,901 86.9% $ 7,299 12.0% Services 10,754 _ 13.6% 9147 _ 13.1% 11607 17.8% Total revenue 78,954 100.0% 70,048 100.0% 8,906 127% Gross profit Products 12820 18.
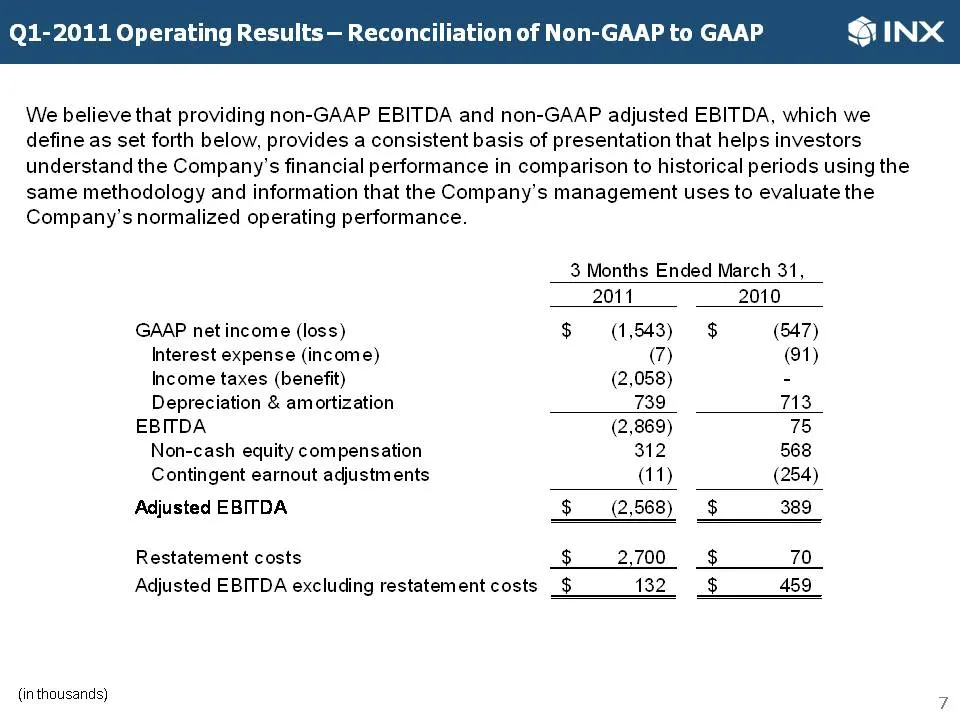
Slide 7: 2011 Operating Results of Non-GAAP to GAAP
2011 Operating Results of Non-GAAP to GAAP SINX We believe that providing non-GAAP EBITDA and non-GAAP adjusted EBITDA, which we define as set forth below, provides a consistent basis of presentation that helps investors understand the Company’s financial performance in comparison to historical peri
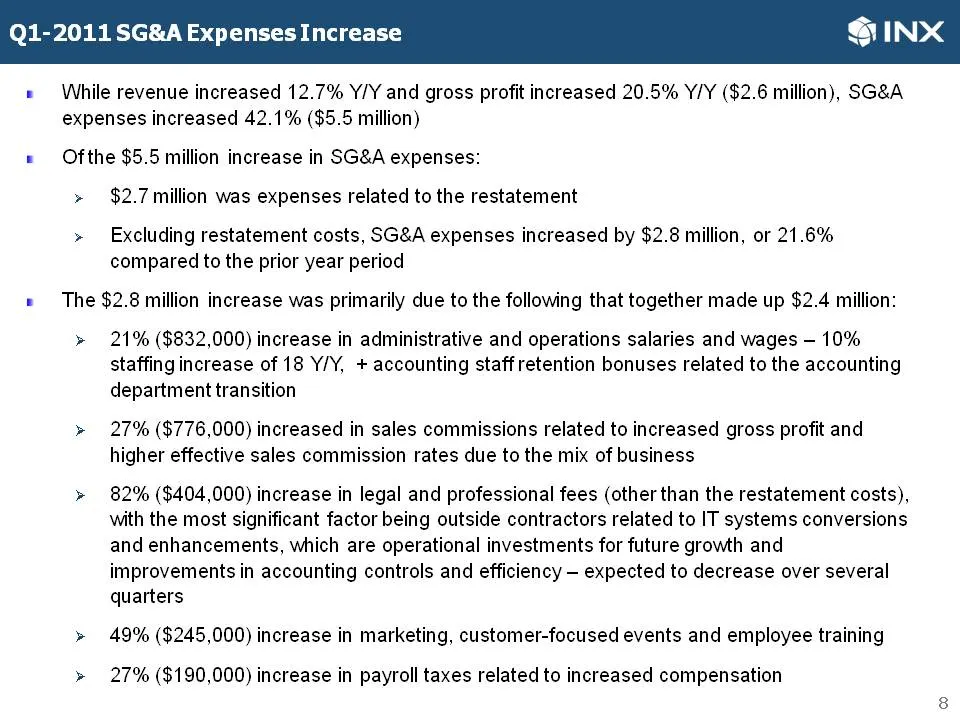
Slide 8: 2011 SG&A Expenses Increase
2011 SG&A Expenses Increase SINX s While revenue increased 12.7% Y/Y and gross profit increased 20.5% Y/Y ($2.6 million), SG&A expenses increased 42.1% ($5.5 million) « Ofthe $5.5 million increase in SG&A expenses: > $2.7 million was expenses related to the restatement » Excluding restatement costs,
Slide 9: Expectation of Q2 Goodwill Impairment
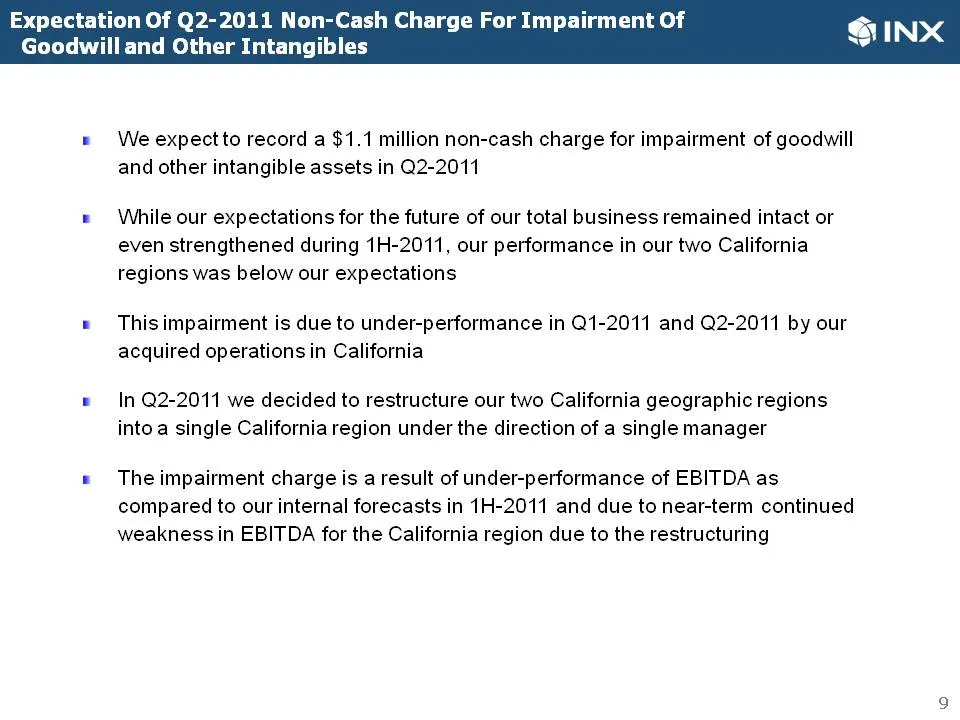
Expectation Of Q e We expectto record a $1.1 million non-cash charge for impairment of goodwill and other intangible assets in Q2-2011 « While our expectations for the future of our total business remained intact or even strengthened during 1H-2011, our performance in our two California regions was
Slide 10: Balance Sheet
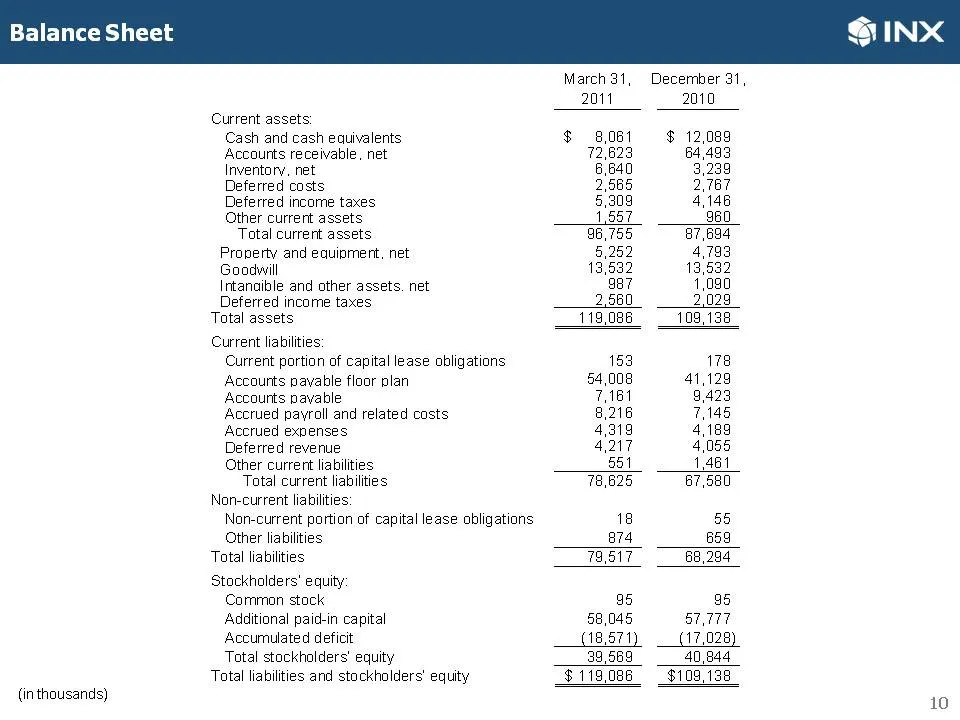
Balance Sheet Current assets: Cash and cash equivalents Accounts receivable, net Inventory, net Deferred costs Deferred income taxes Other current assets Total current assets Property and equipment, net Goodwill Intanaibble and other assets. net Deferred income taxes Total assets Current liabilities
Slide 11: Review of Q1-2011 Near Term Outlook
Review of Q1-2011 Near Term Outlook Mark Hilz President & CEO
Slide 12: Q1 Review
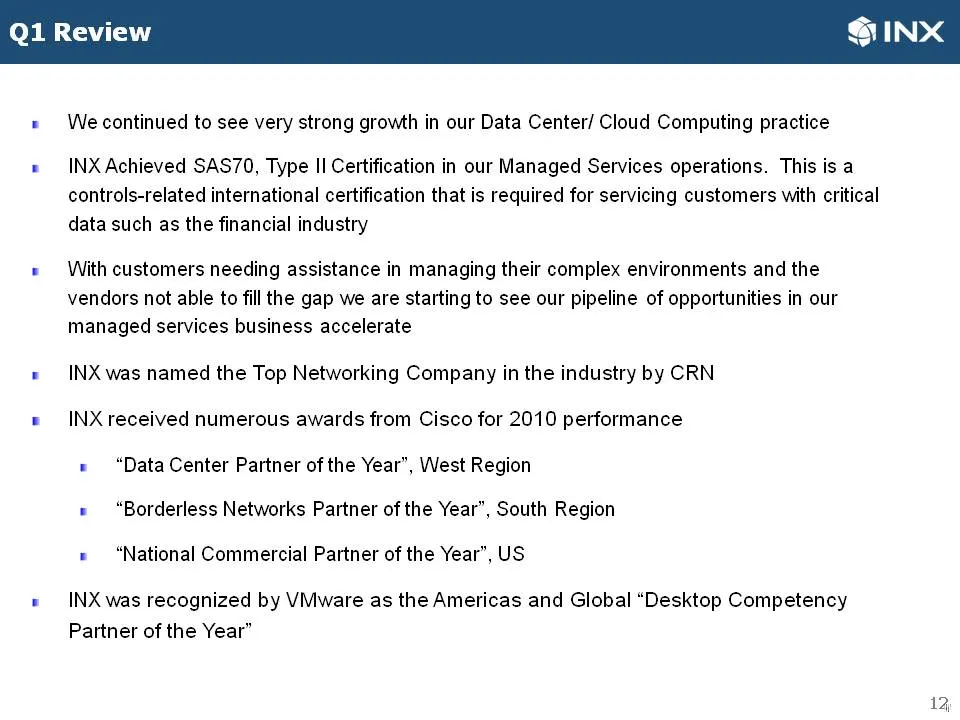
Q1Re @INX We continued to see very strong growth in our Data Center/ Cloud Computing practice INX Achieved SAS70, Type II Certification in our Managed Services operations. This is a controls-related international certification that is required for servicing customers with critical data such as the f
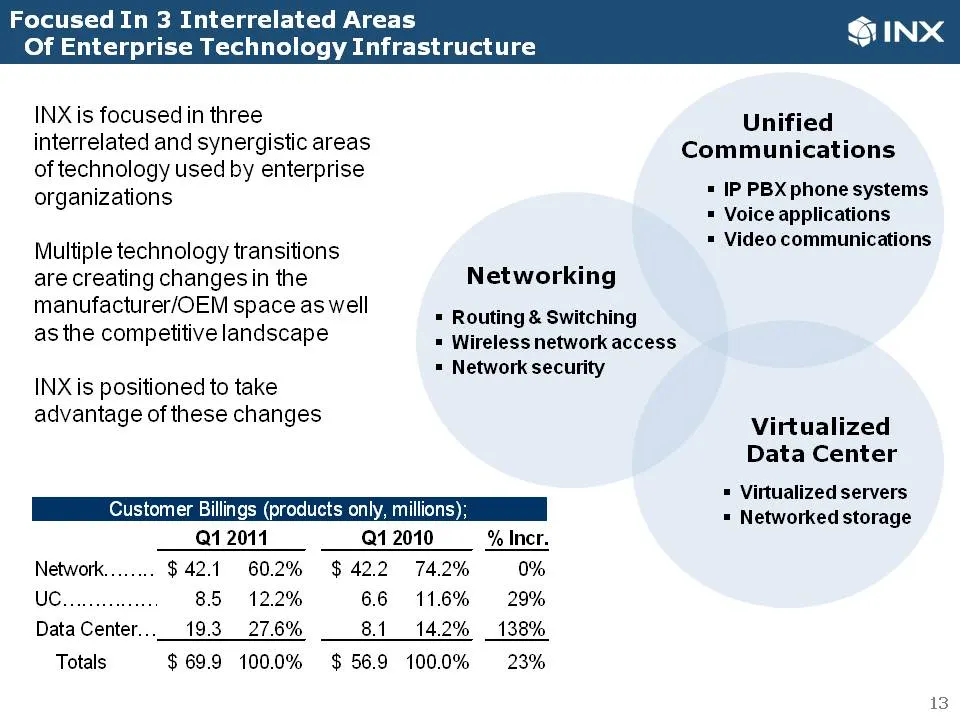
Slide 13: Focused In Interrelated Areas Of Enterprise Technology Infrastructure
Focused In 3 Interrelated Areas 6 INX Of Enterprise Technology Infrastructure - INX is focused in three interrelated and synergistic areas Communioations of technology used by enterprise organizations = IP PBX phone systems = Voice applications Multiple technology transitions peice COmTUn ator are c
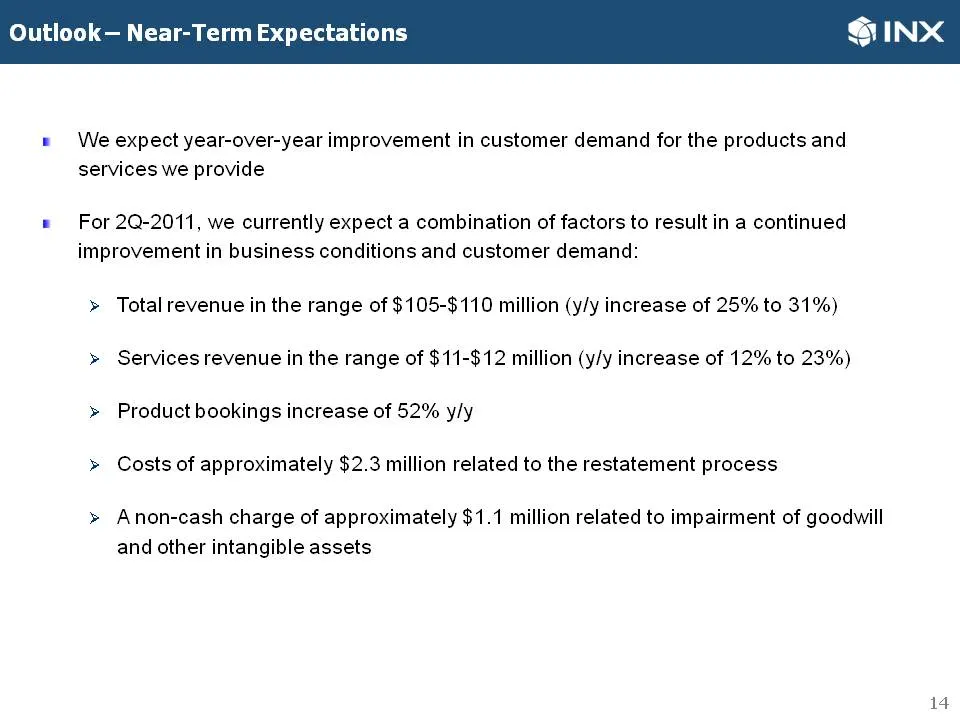
Slide 14: Near-Term Expectations
Near-Term Expectations SINX We expect year-over-year improvement in customer demand for the products and services we provide For 2Q-2011, we currently expect a combination of factors to result in a continued improvement in business conditions and customer demand: > Total revenue in the range of $105
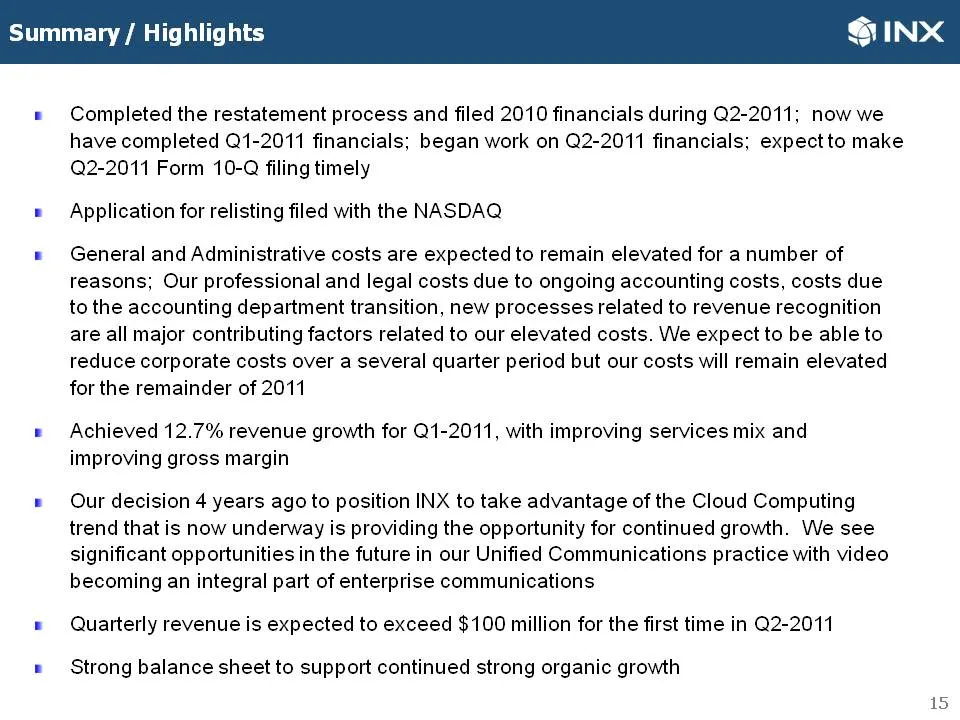
Slide 15: Summary / Highlights
Summary / High SINX ® Completed the restatement process and filed 2010 financials during Q2-2011; now we have completed Q1-2011 financials; began work on Q2-2011 financials; expectto make Q2-2011 Form 10-Q filing timely ® Application for relisting filed with the NASDAQ ® General and Administrative c
Source: SEC EDGAR · 8-K filed Jul 13, 2011
More decks from INX Inc
 Merger or Acquisition (November 2011)10 slides · Nov 1, 2011
 Rodman & Renshaw Global Investment Conference 201120 slides · Sep 13, 2011
 Shareholder Meeting (July 2011)15 slides · Jul 19, 2011
 FY2010 Earnings Presentation28 slides · Jun 6, 2011
 Corporate Update (November 2010)24 slides · Nov 10, 2010
 Q3 2009 Earnings Presentation20 slides · Nov 10, 2009