Gtech — Q3 FY2006 Earnings Presentation
17 slides from Gtech's earnings presentation, Dec 16, 2005

Slide 1: GTECH Holdings Corporation
GTECH Holdings Corporation W. Bruce Turner President & Chief Executive Officer Jaymin B. Patel Sr. Vice President & Chief Financial Officer Fiscal Year 2006 Third Quarter Earnings Conference Call December 16, 2005 8:30 AM

Slide 2: Safe Harbor Act
2 Safe Harbor Act. . . Comments made during this presentation may contain forward- looking statements, including, without limitation, statements relating to the future operations and financial performance of the Company and the Company’s future strategies. Such forward-looking statements reflect man

Slide 3: Agenda
3 Agenda. . . W. Bruce Turner, Chief Executive Officer Welcome Q3 Performance Review Strategy Update Jaymin B. Patel, Chief Financial Officer Review of Q3 and Year to Date Financial Results Financial Outlook
Slide 4: Q3 FY'06 Strategic Progress
4 Q3 FY’06 Strategic Progress. . . Arizona California – POS expansion New Jersey Jamaica Dresser Wayne * “KING KONG” is copyrighted by Universal Studios and licensed to GTECH Corporation by Universal Studios Licensing LLLP. All Rights Reserved. Financial results at high end of our expectations Key w

Slide 5: Q3 FY'06 Strategic Progress
5 Q3 FY’06 Strategic Progress. . . Gaming Solutions NASPL – WinWave TM G2E – Dynamic Floor Management system Atronic 12 new games eMillions TM Harmony TM video slot machine Rhode Island expansion Licensing activity continues 82 Commercial Gaming licenses issued 13 pending
Slide 6: Q3 FY'06 Strategic Progress
6 Q3 FY’06 Strategic Progress. . . Responding to RFPs New contract opportunities Greece Taiwan Virginia North Carolina – RFP expected Gaming Solutions opportunities Rhode Island expansion Acqueduct and Yonkers Florida (Broward County) and Pennsylvania Potential gaming in Indiana, Kentucky, Maryland
Slide 7: Service Revenue Analysis
7 (1) All percentage points are rounded to the nearest percent (2) Reflects impact of contract wins/losses, jackpot activity, contractual rate changes, foreign exchange changes, the impact of acquisitions, and the net change of revenue withholdings and new contract terms in Brazil. 27.2 +19% 2.6 +12

Slide 8: Key Financial Highlights
8 Key Financial Highlights. . . Q3 FY’06 Service Revenue +$19M Product Sales $29M Gross Profit Margins 39% Service Margins 39% Product Margins 41% Operating Expenses $45M Operating Expense Ratio 15% Net Income $48M Diluted Earnings Per Share $0.37
Slide 9: Cash Flow
$30M 9 (1) For a calculation, explanation, and reconciliation to the GAAP measure, see Supplemental Financial Data in the Investor Presentation section of our Website www.gtech.com Cash Flow. . . Q3 FY’06 Cash from Operations Maintenance Capital (1) Investing for Growth (1) Recurring Free Cash Flow
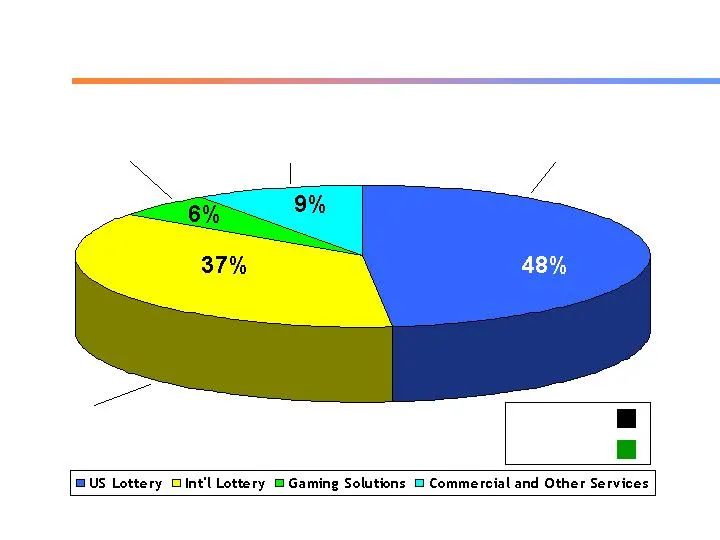
Slide 10: Total Revenue
10 Total Revenue. . . FY’06 YTD $88M $64M $53M $54M $453M $397M $342M $404M FY’06 YTD FY’05 YTD
Slide 11: Cash Flow
$85M 11 (1) For a calculation, explanation, and reconciliation to the GAAP measure, see Supplemental Financial Data in the Investor Presentation section of our Website www.gtech.com Cash Flow. . . FY’06 YTD Cash from Operations Maintenance Capital (1) Investing for Growth (1) Recurring Free Cash Flo

Slide 12: Return on Capital Employed
12 Return on Capital Employed. . . FY’06 YTD vs. FY’05 For a calculation and an explanation of ROCE, see Supplemental Financial Data in the Investor Presentation section of our Website www.gtech.com Average Capital Employed +$161M +12% year over year ROCE 15.0% Excluding cash balances +330bps 18.3%
Slide 13: Q4 FY'06 Guidance
13 Q4 FY’06 (1) Based on Diluted Share Estimate of 131M Shares Q4 FY’06 Guidance. . . As of December 16, 2005 Service Revenue Growth 5% - 7% Product Sales $85M - $95M Service Margins 39% - 41% Product Margins 41% - 43% Tax Rate 34% - 35% Earnings per Share (1) $0.45 - $0.48
Slide 14: FY'06 Guidance
14 FY’06 (1) Based on a diluted share estimate of 131M shares FY’06 Guidance. . . As of December 16, 2005 Service Revenue Growth 9% - 10% Product Sales $190M - $200M Service Margins 40% - 41% Product Margins 40% - 42% Full-Year Effective Tax Rate ~34% Earnings per Share (1); Excluding impact of SFAS
Slide 15: Cash Flow: FY'06 Guidance
$410M - $420M 15 Cash from Operations Capital Expenditures $190M - $200M $210M - $230M Free Cash Flow Cash Flow. . . FY’06 Guidance
Slide 16: Q&A
16 Q&A. . .

Slide 17: Summary
17 Summary. . . Business growth continues Long-term strategy remains on track Confident in our ability to meet objectives for FY’06 and beyond
Source: SEC EDGAR · 8-K filed Dec 16, 2005
More decks from Gtech Holdings Corp
 Merger or Acquisition (April 2006)20 slides · Apr 26, 2006
 FY2006 Earnings Presentation12 slides · Apr 12, 2006
 Merger or Acquisition (February 2006)8 slides · Feb 28, 2006
 Q2 FY2006 Earnings Presentation19 slides · Sep 23, 2005
 Q1 FY2006 Earnings Presentation17 slides · Jun 22, 2005
 Q4 FY2005 Earnings Presentation22 slides · Apr 14, 2005