Gtech — Q4 FY2005 Earnings Presentation
22 slides from Gtech's earnings presentation, Apr 14, 2005
Slide 1: Q4 and FY'05 Results Presentation
W. Bruce Turner President & Chief Executive Officer Jaymin B. Patel Senior Vice President & Chief Financial Officer April 14, 2005 8:30 AM

Slide 2: Safe Harbor Act
2 Comments made during this presentation may contain forward-looking statements, including, without limitation, statements relating to the future operations and financial performance of the Company and the Company’s future strategies. Such forward-looking statements reflect management’s assessment b
Slide 3: Agenda
3 W. Bruce Turner, Chief Executive Officer Welcome Q4 and FY’05 Performance Review Strategy Update Brazil Update Jaymin B. Patel, Chief Financial Officer Review of Q4 and FY’05 Financial Results Guidance for FY’06 and Q1 FY’06 Agenda. . .
Slide 4: Q4 & FY'05 Business Review
4 Q4 & FY’05 Business Review. . . Financial Performance Strength in same store sales and strong product sales FY’05 32 new contracts – total revenue $635M - $690M ( over contract lives) Recent Successes Finland Germany - Thuringen New Mexico Pennsylvania Missouri New Zealand Arizona MUSL New Win Ext

Slide 5: FY'05 Strategic Progress
5 Successful acquisitions in all three verticals Lottery: LILHCo Commercial Services: BillBird Gaming Solutions: Spielo & *Atronic Approximately $800M available for incremental investment Additional debt capacity – still maintain investment-grade credit FY’05 Strategic Progress. . . * GTECH will acq
Slide 6: Returning Value to Shareholders
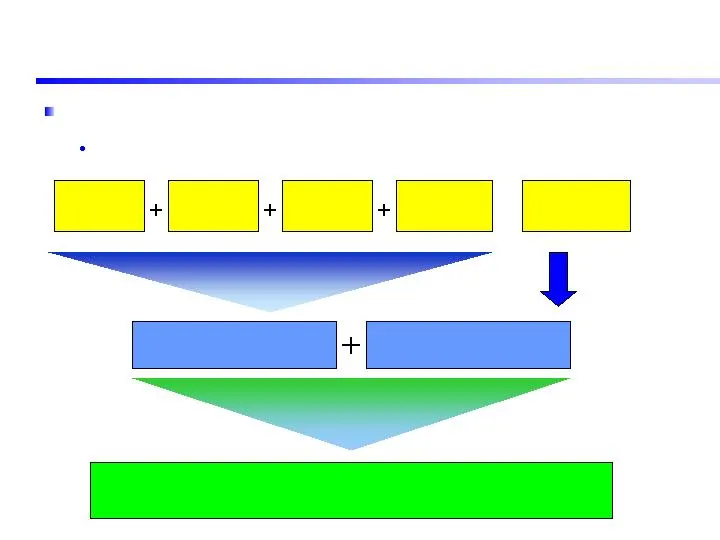
6 Share Repurchase Program Authorization increased by $100M in Q3 FY’05 Returning Value to Shareholders. . . FY’05 5.3M shares for $121M Q1 FY’05 1.0M shares $28M Q2 FY’05 2.6M shares $55M Q3 FY’05 0.8M shares $18M FY’05 Dividends of $40M Total Value Returned to Shareholders in FY’05 $161M $10M in d
Slide 7: FY'06 Outlook
7 New contract opportunities – next 24 months Greenfield – North Carolina & Oklahoma Competitor contracts – Maryland, West Virginia, Germany, Greece, Hamburg, Lower Saxony, Malaysia and Shanghai Continue to drive same store sales growth with new content Monopoly-themed game – 1 st branded game in U.
Slide 8: Brazil Update
8 Elected not to participate in new procurement process Complex solutions not adequately evaluated in commodity auction process Revenue withholding restricts ability to generate value for shareholders Committed to supporting Caixa’s migration to new business model Extension negotiations ongoing Civi
Slide 9: Service Revenue Analysis Q4 FY'05 vs. FY'04
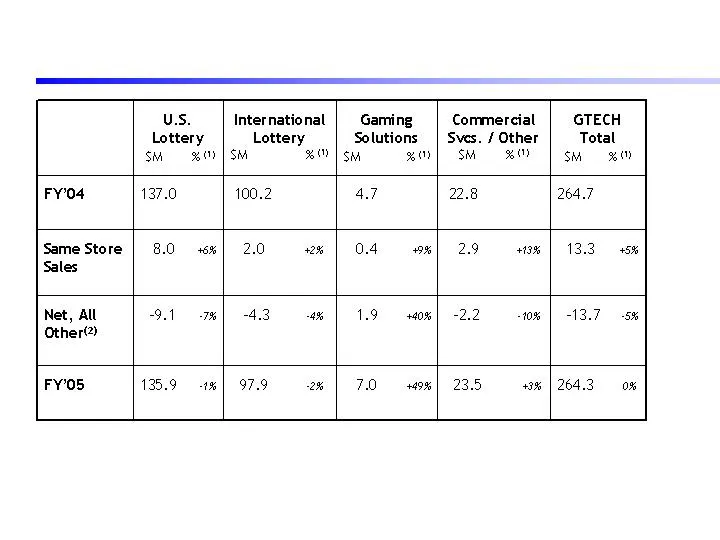
9 (1) All percentage points are rounded to the nearest percent (2) Reflects impact of 53 rd week in FY’04, contract wins/losses, jackpot activity, contractual rate changes, foreign exchange changes, the impact of acquisitions, and revenue withheld in Brazil. Service Revenue Analysis. . . Q4 FY’05 vs

Slide 10: Key Financial Highlights
10 Total Revenue +21% Service Revenues In line with Q4 FY’04 Same Store Sales +5% Operating Expense Ratio 13% 300+ BP Improvement Diluted Earnings Per Share Ahead of Expectations Free Cash Flow $37M Stock Repurchases 0.9M Shares, $20M Key Financial Highlights. . . Q4 FY’05 vs. FY’04
Slide 11: Cash Flow Q4 FY'05
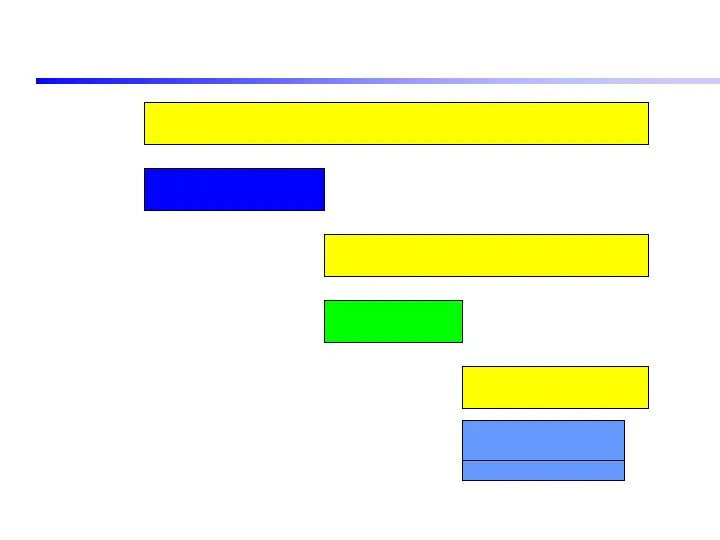
$33.5M 11 (1) For a calculation, explanation, and reconciliation to GAAP measure, see Supplemental Financial Data in the Investor Presentation section of our Website www.gtech.com Cash Flow. . . Q4 FY’05 Cash from Operations Maintenance Capital (1) Investing for Growth (1) Recurring Free Cash Flow F
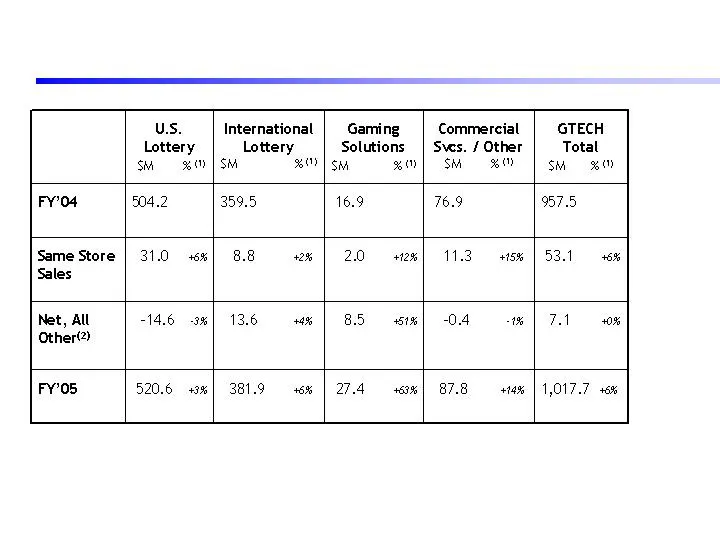
Slide 12: Service Revenue Analysis FY'05 vs. FY'04
12 (1) All percentage points are rounded to the nearest percent (2) Reflects impact of 53 rd week in FY’04, contract wins/losses, jackpot activity, contractual rate changes, foreign exchange changes, the impact of acquisitions, and revenue withheld in Brazil. Service Revenue Analysis. . . FY’05 vs.
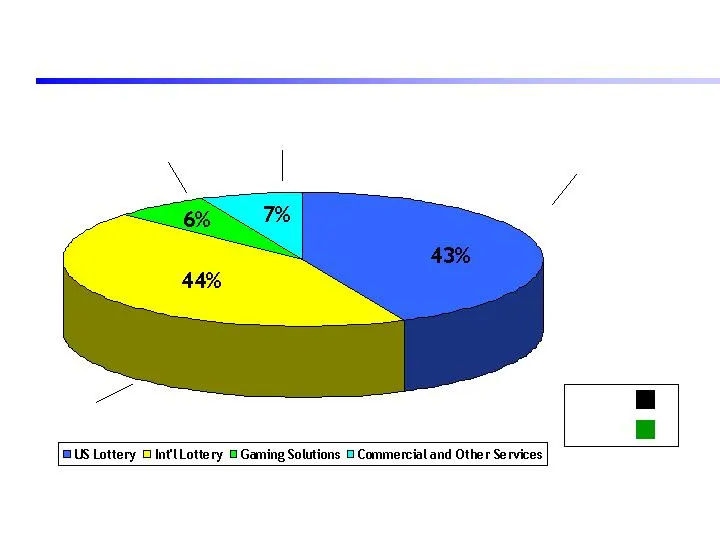
Slide 13: Total Revenue
13 Total Revenue. . . FY’05 $88M $77M $81M $18M $540M $513M $548M $443M FY’05 FY’04
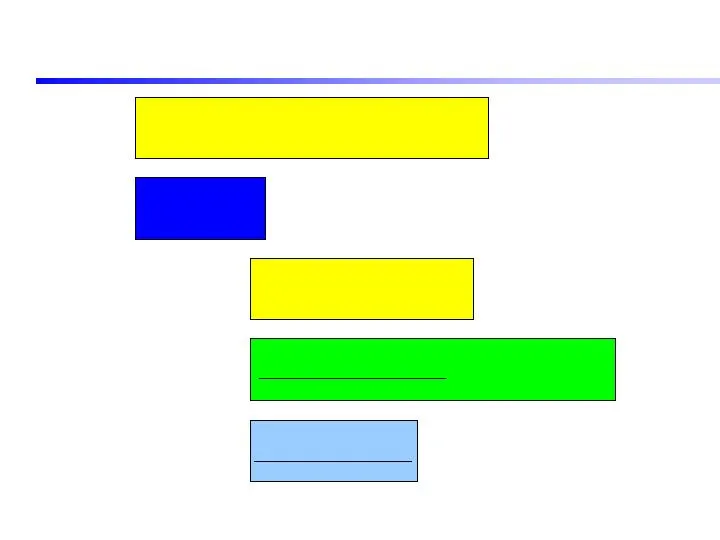
Slide 14: Cash Flow FY'05
$135M 14 (1) For a calculation, explanation, and reconciliation to GAAP measure, see Supplemental Financial Data in the Investor Presentation section of our Website www.gtech.com Cash Flow. . . FY’05 Cash from Operations Maintenance Capital (1) Investing for Growth (1) Recurring Free Cash Flow $375M
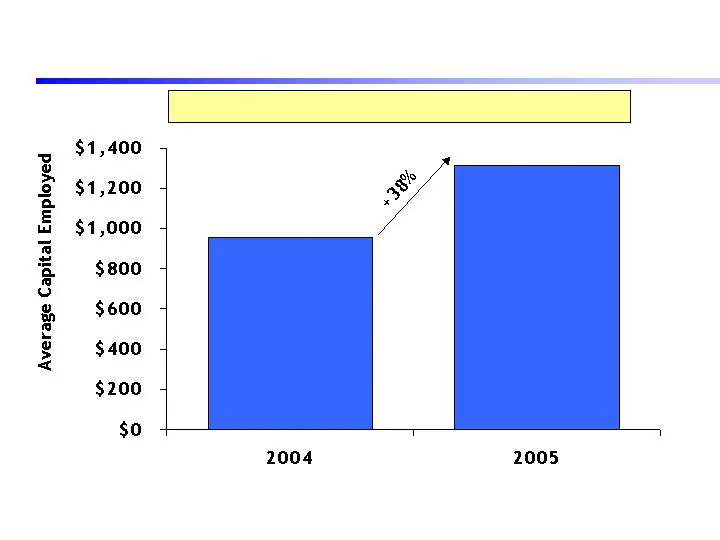
Slide 15: Return on Capital Employed
15 For a calculation and an explanation of ROCE, see Supplemental Financial Data in the Investor Presentation section of our Website www.gtech.com Return on Capital Employed. . . FY’05 vs. FY’04 $M ROCE 19.9% 15.9%
Slide 16: FY'06 Guidance
16 FY’06 (1) FY’06 Guidance. . . As of April 14, 2005 Service Revenue Growth 8% - 10% Same store sales growth 5% - 6% Net effect of contract wins and contractual rate changes Impact of recent acquisitions

Slide 17: Brazil Assumptions
17 Contract extension through May 2006 Forecast full year of revenues with ramp down beginning in third quarter FY’06 30% withholding continues Average exchange rate for FY’06 - 2.9BRR to 1USD Revenues from Brazil FY’06 ~$80M - $85M FY’05 $93M Brazil Assumptions. . .

Slide 18: FY'06 Guidance Continued
18 FY’06 (1) (1) Assumes full year of revenue from Brazil with 30% hold back (2) Based on a diluted share estimate of 132M shares FY’06 Guidance Continued. . . As of April 14, 2005 Service Revenue Growth 8% - 10% Product Sales $180M - $210M Service Margins ~40% Product Margins 38% - 40% Full-Year Ef
Slide 19: Net Potential Upside
19 Revenue $15M - - $20M $25M - $35M Earnings per Share (1) $0.06 - - $0.08 $0.07 - $0.12 Reflects or includes impact of Collection of 100% of Caixa revenues Release of $14M from escrow ($11M relating to FY’05; $3M to FY’06) Accelerated de-installation schedule Potential incremental (Non-Brazil) inv
Slide 20: Cash Flow: FY'06 Preliminary Guidance
$410M - $420M 20 Cash Flow. . . FY’06 Preliminary Guidance Cash from Operations Capital Expenditures Free Cash Flow Cash returned to shareholders $40M in dividends Ongoing share repurchase program $240M - $250M $160M - $180M

Slide 21: Q1 FY'06 Guidance
21 Q1 FY’06 (1) Based on Diluted Share Estimate of 131M Shares Q1 FY’06 Guidance. . . As of April 14, 2005 Service Revenue Growth 5% - 7% Product Sales $30M - $35M Service Margins 38% - 40% Product Margins 38% - 40% Effective Tax Rate 36% Earnings per Share (1) $0.33 - $0.36
Slide 22: Closing
22 Closing. . .
Source: SEC EDGAR · 8-K filed Apr 14, 2005
More decks from Gtech Holdings Corp
 Merger or Acquisition (April 2006)20 slides · Apr 26, 2006
 FY2006 Earnings Presentation12 slides · Apr 12, 2006
 Merger or Acquisition (February 2006)8 slides · Feb 28, 2006
 Q3 FY2006 Earnings Presentation17 slides · Dec 16, 2005
 Q2 FY2006 Earnings Presentation19 slides · Sep 23, 2005
 Q1 FY2006 Earnings Presentation17 slides · Jun 22, 2005