Gtech — FY2006 Earnings Presentation
12 slides from Gtech's earnings presentation, Apr 12, 2006
Slide 1: Fiscal Year 2006 Fourth Quarter and Full Year Financial Highlights
GTECH Holdings Corporation Fiscal Year 2006 Fourth Quarter and Full Year Financial Highlights April 12, 2006
Slide 2: FY'06 Highlights
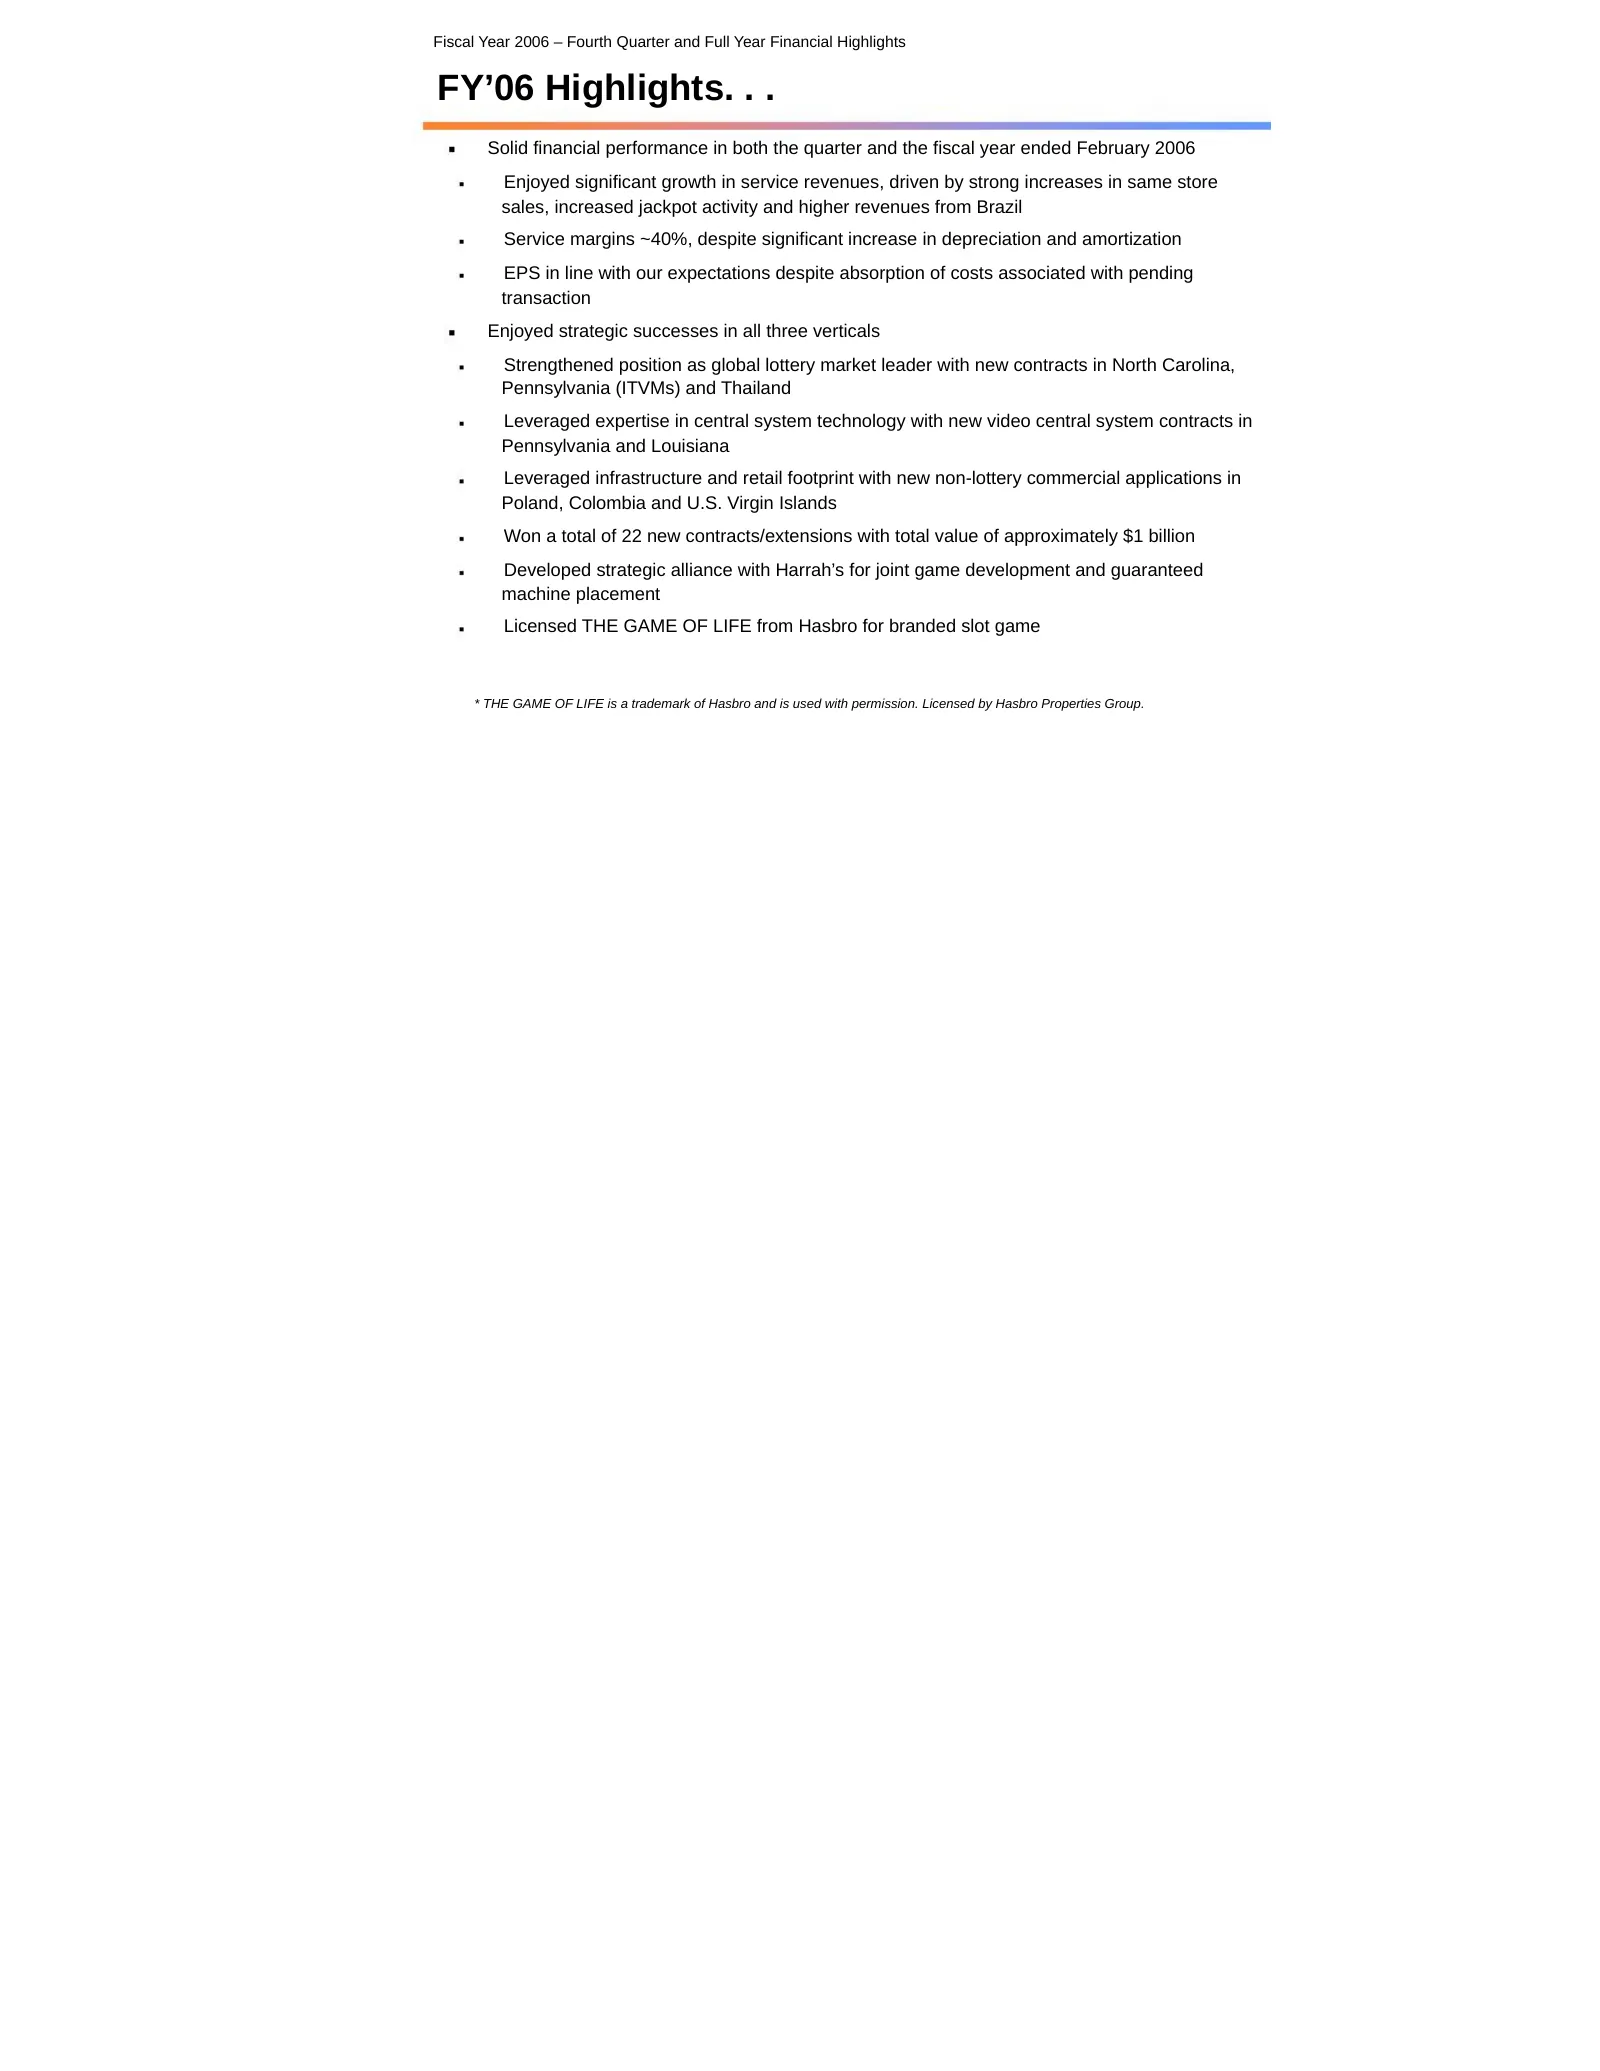
Fiscal Year 2006 – Fourth Quarter and Full Year Financial Highlights FY’06 Highlights. . . Solid financial performance in both the quarter and the fiscal year ended February 2006 Enjoyed significant growth in service revenues, driven by strong increases in same store sales, increased jackpot activit
Slide 3: FY'06 Highlights
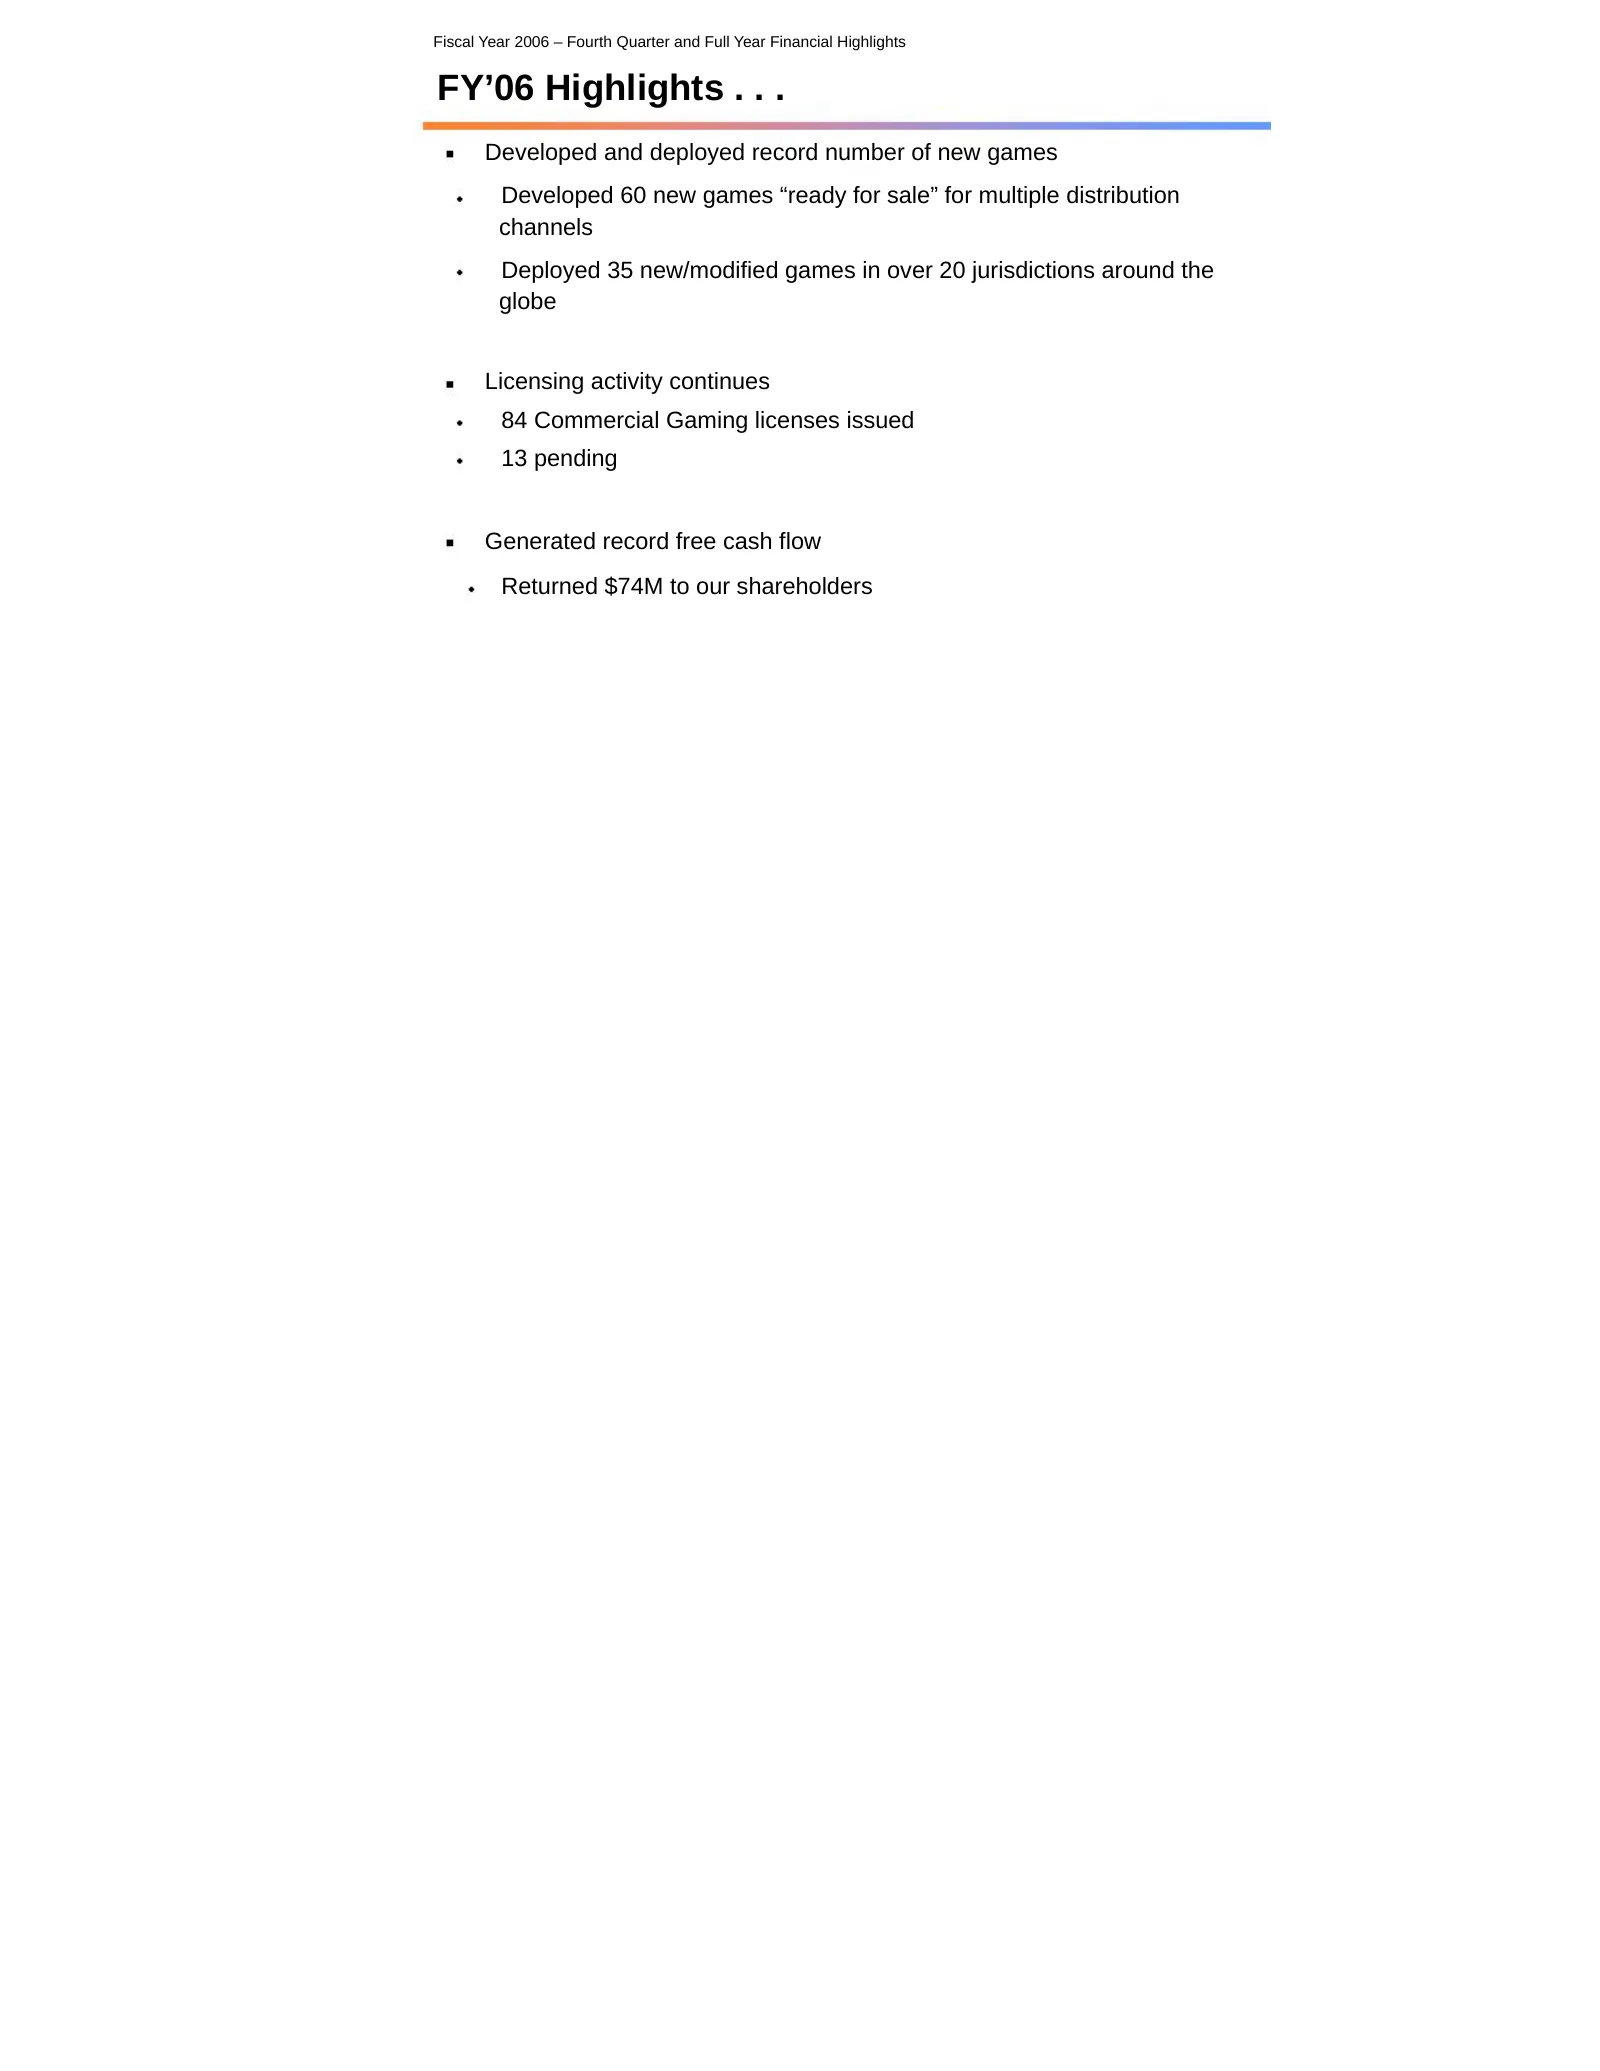
Fiscal Year 2006 – Fourth Quarter and Full Year Financial Highlights FY’06 Highlights . . . Developed and deployed record number of new games Developed 60 new games “ready for sale” for multiple distribution channels Deployed 35 new/modified games in over 20 jurisdictions around the globe Licensing
Slide 4: Proposed Transaction Summary
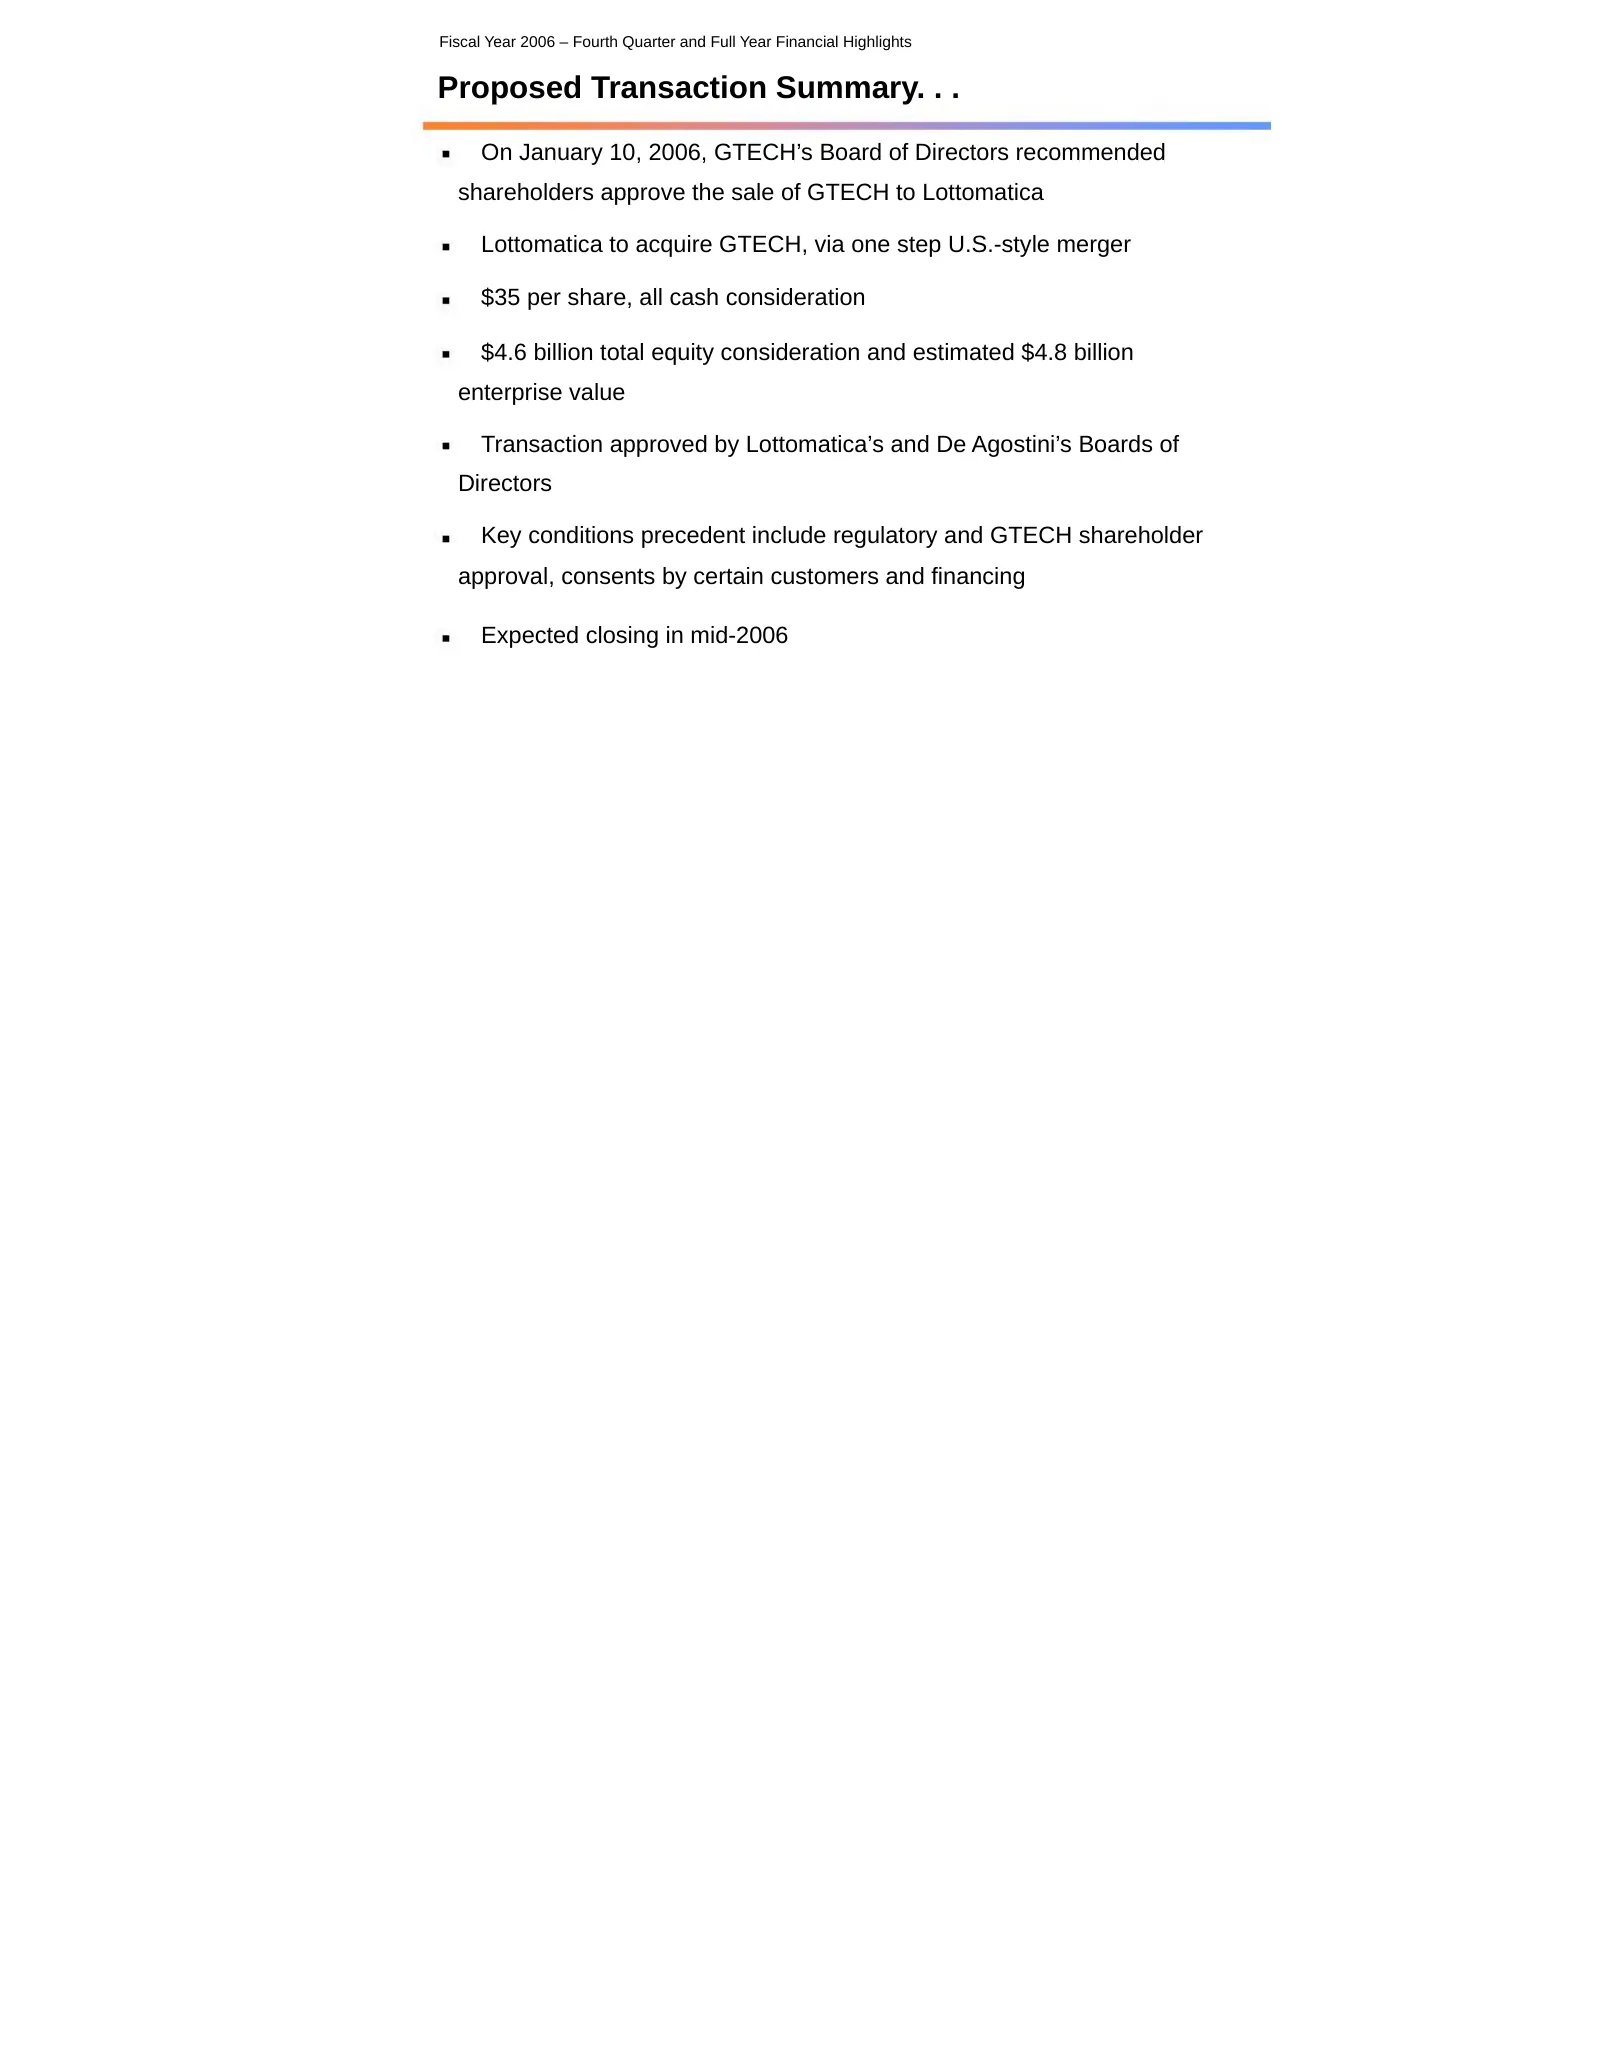
Fiscal Year 2006 – Fourth Quarter and Full Year Financial Highlights Proposed Transaction Summary. . . On January 10, 2006, GTECH’s Board of Directors recommended shareholders approve the sale of GTECH to Lottomatica Lottomatica to acquire GTECH, via one step U.S.-style merger $35 per share, all cas
Slide 5: Service Revenue Analysis: Q4 FY'06 vs. Q4 FY'05
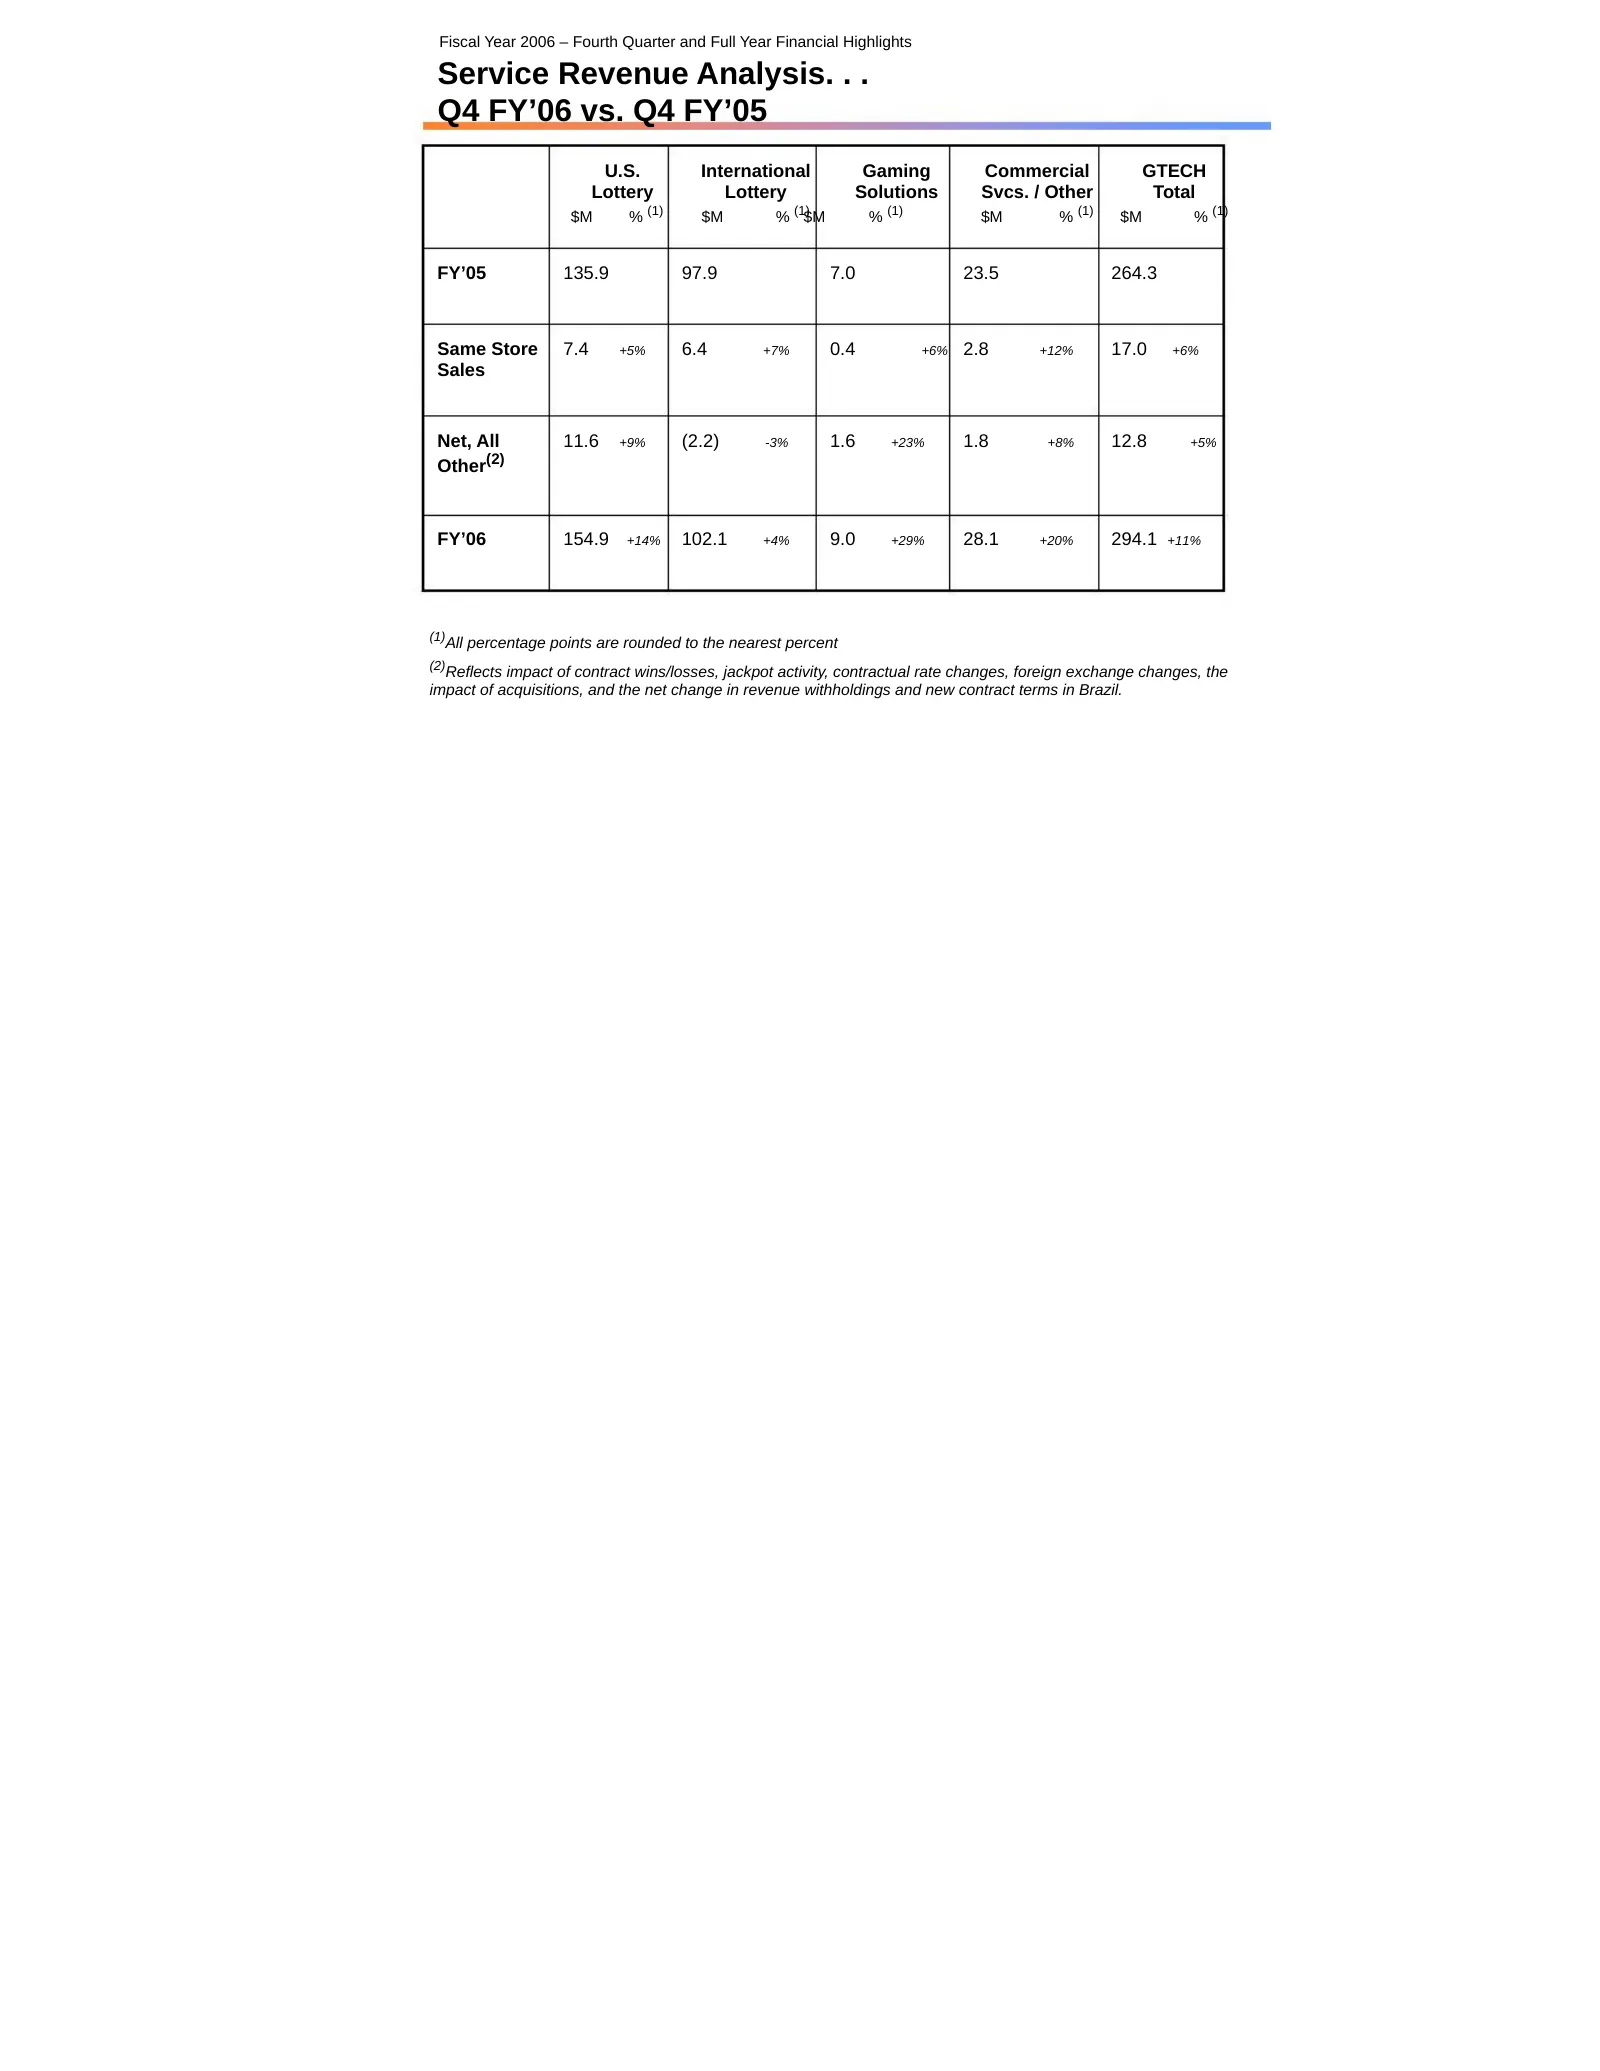
Fiscal Year 2006 – Fourth Quarter and Full Year Financial Highlights Service Revenue Analysis. . . Q4 FY’06 vs. Q4 FY’05 U.S. International Gaming Commercial GTECH Lottery Lottery Solutions Svcs. / Other Total (1) (1) (1) (1) $M % $M % $M % $M % $M % (1) FY’05 135.9 97.9 7.0 23.5 264.3 Same Store 7.
Slide 6: Key Financial Highlights: Q4 FY'06
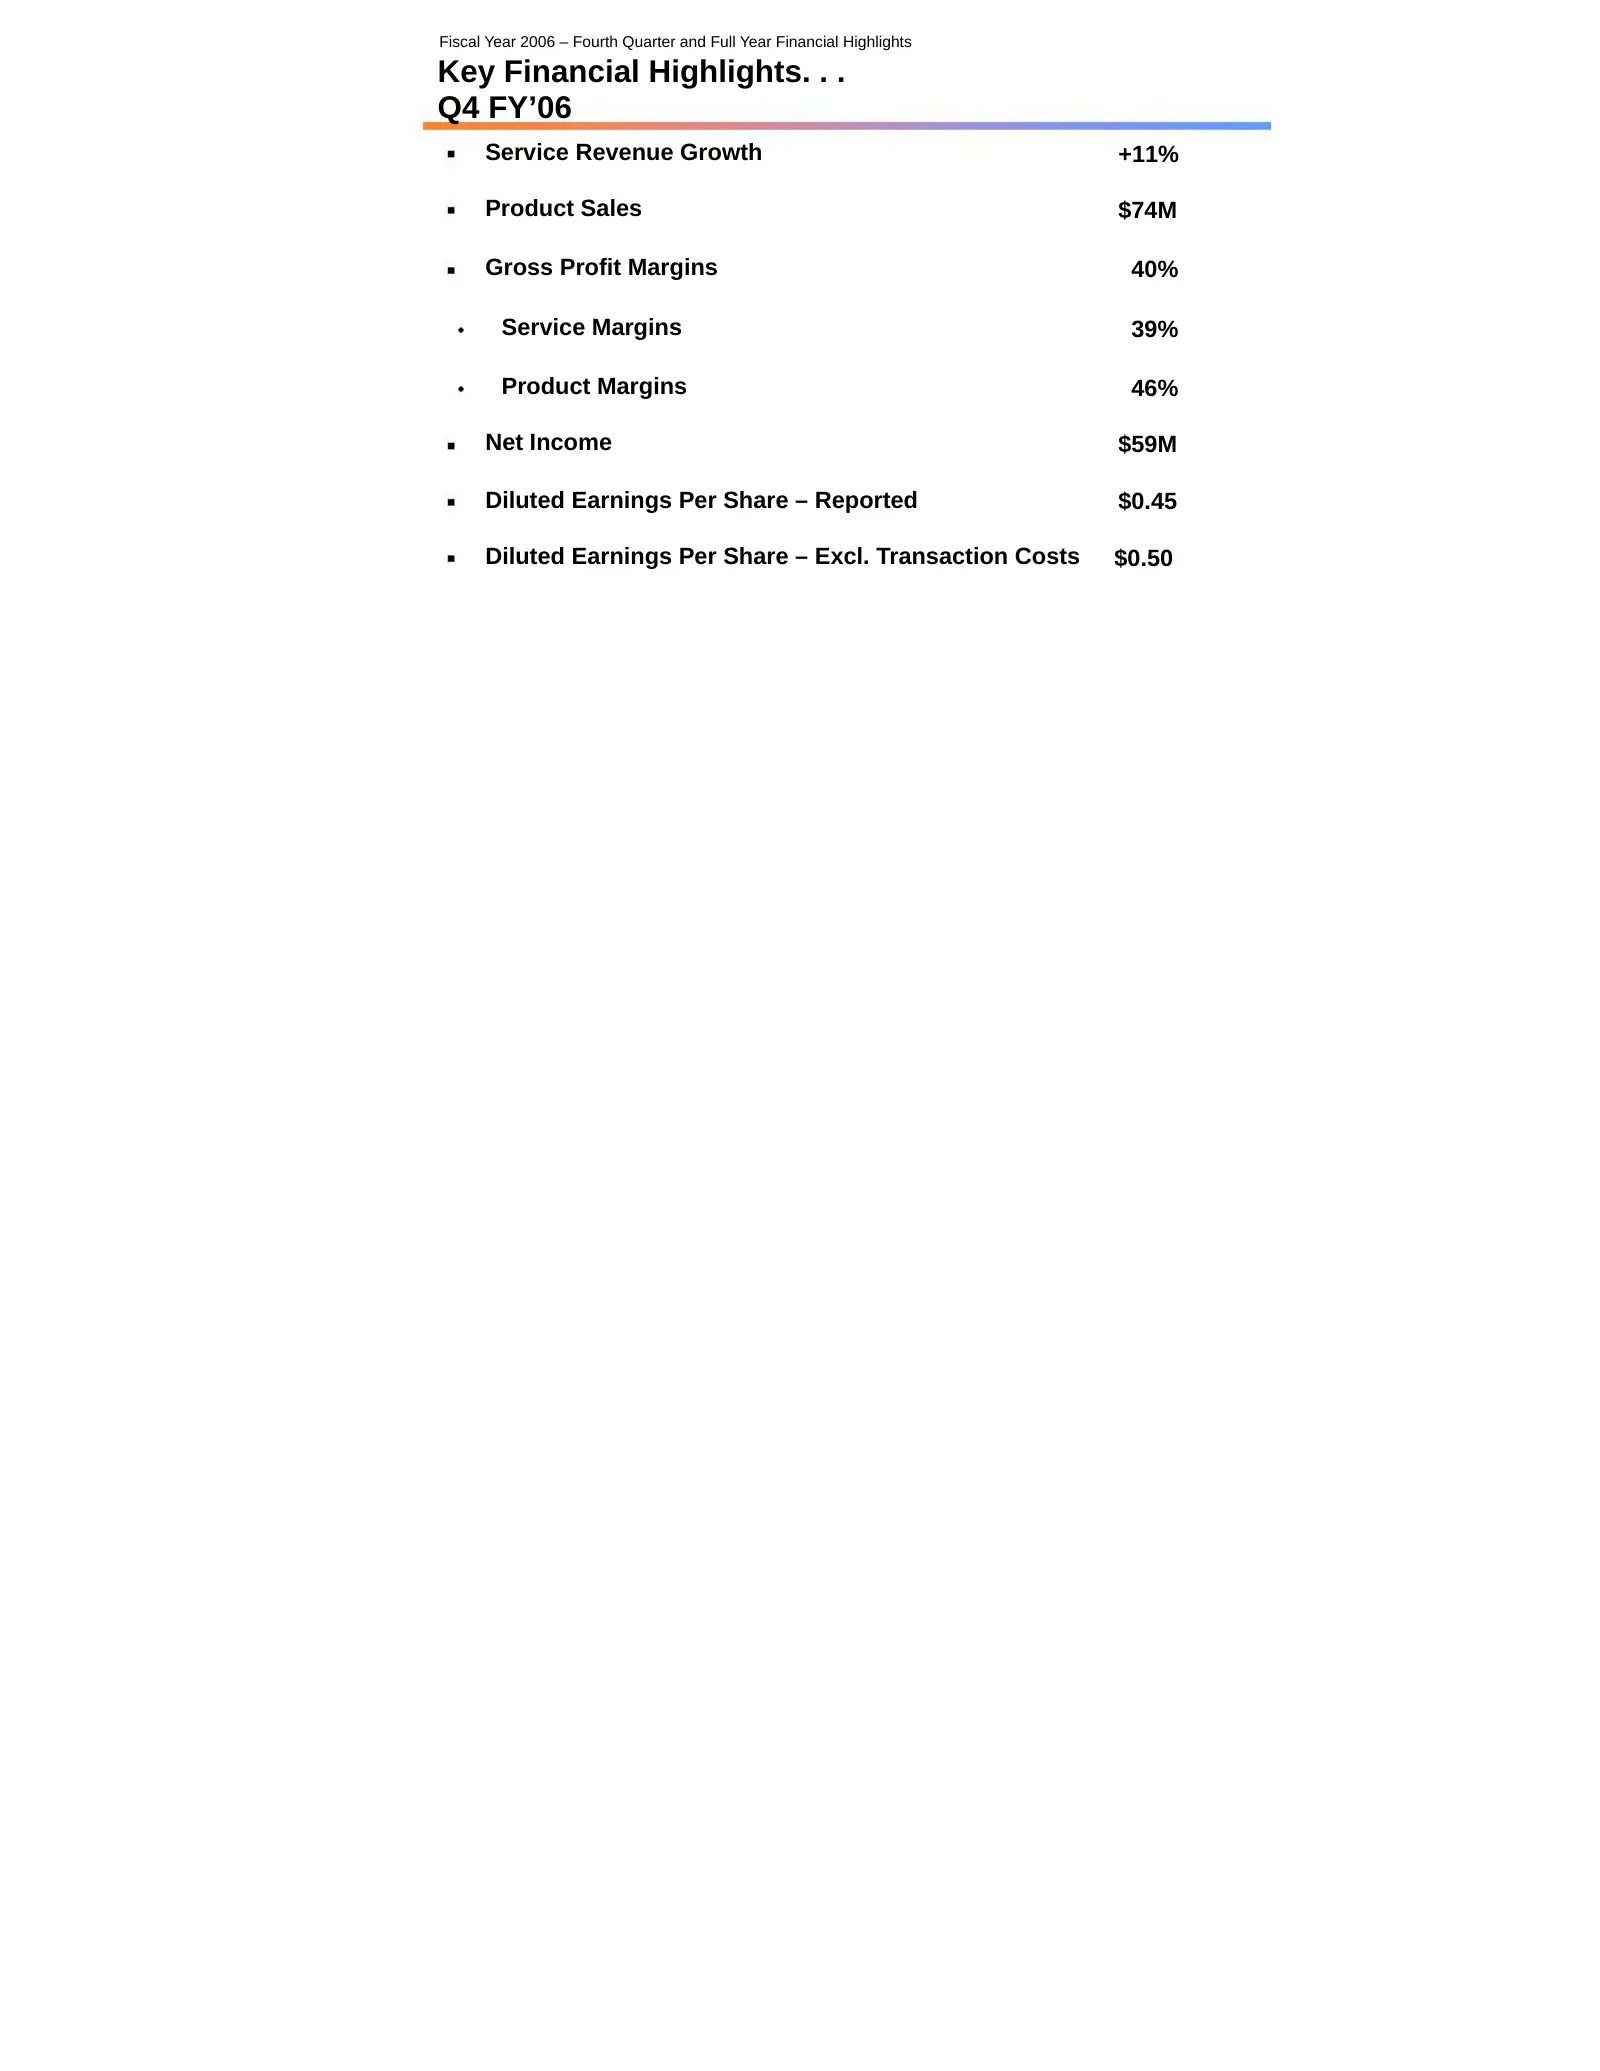
Fiscal Year 2006 – Fourth Quarter and Full Year Financial Highlights Key Financial Highlights. . . Q4 FY’06 Service Revenue Growth +11% Product Sales $74M Gross Profit Margins 40% Service Margins 39% Product Margins 46% Net Income $59M Diluted Earnings Per Share – Reported $0.45 Diluted Earnings Per
Slide 7: Cash Flow: Q4 FY'06
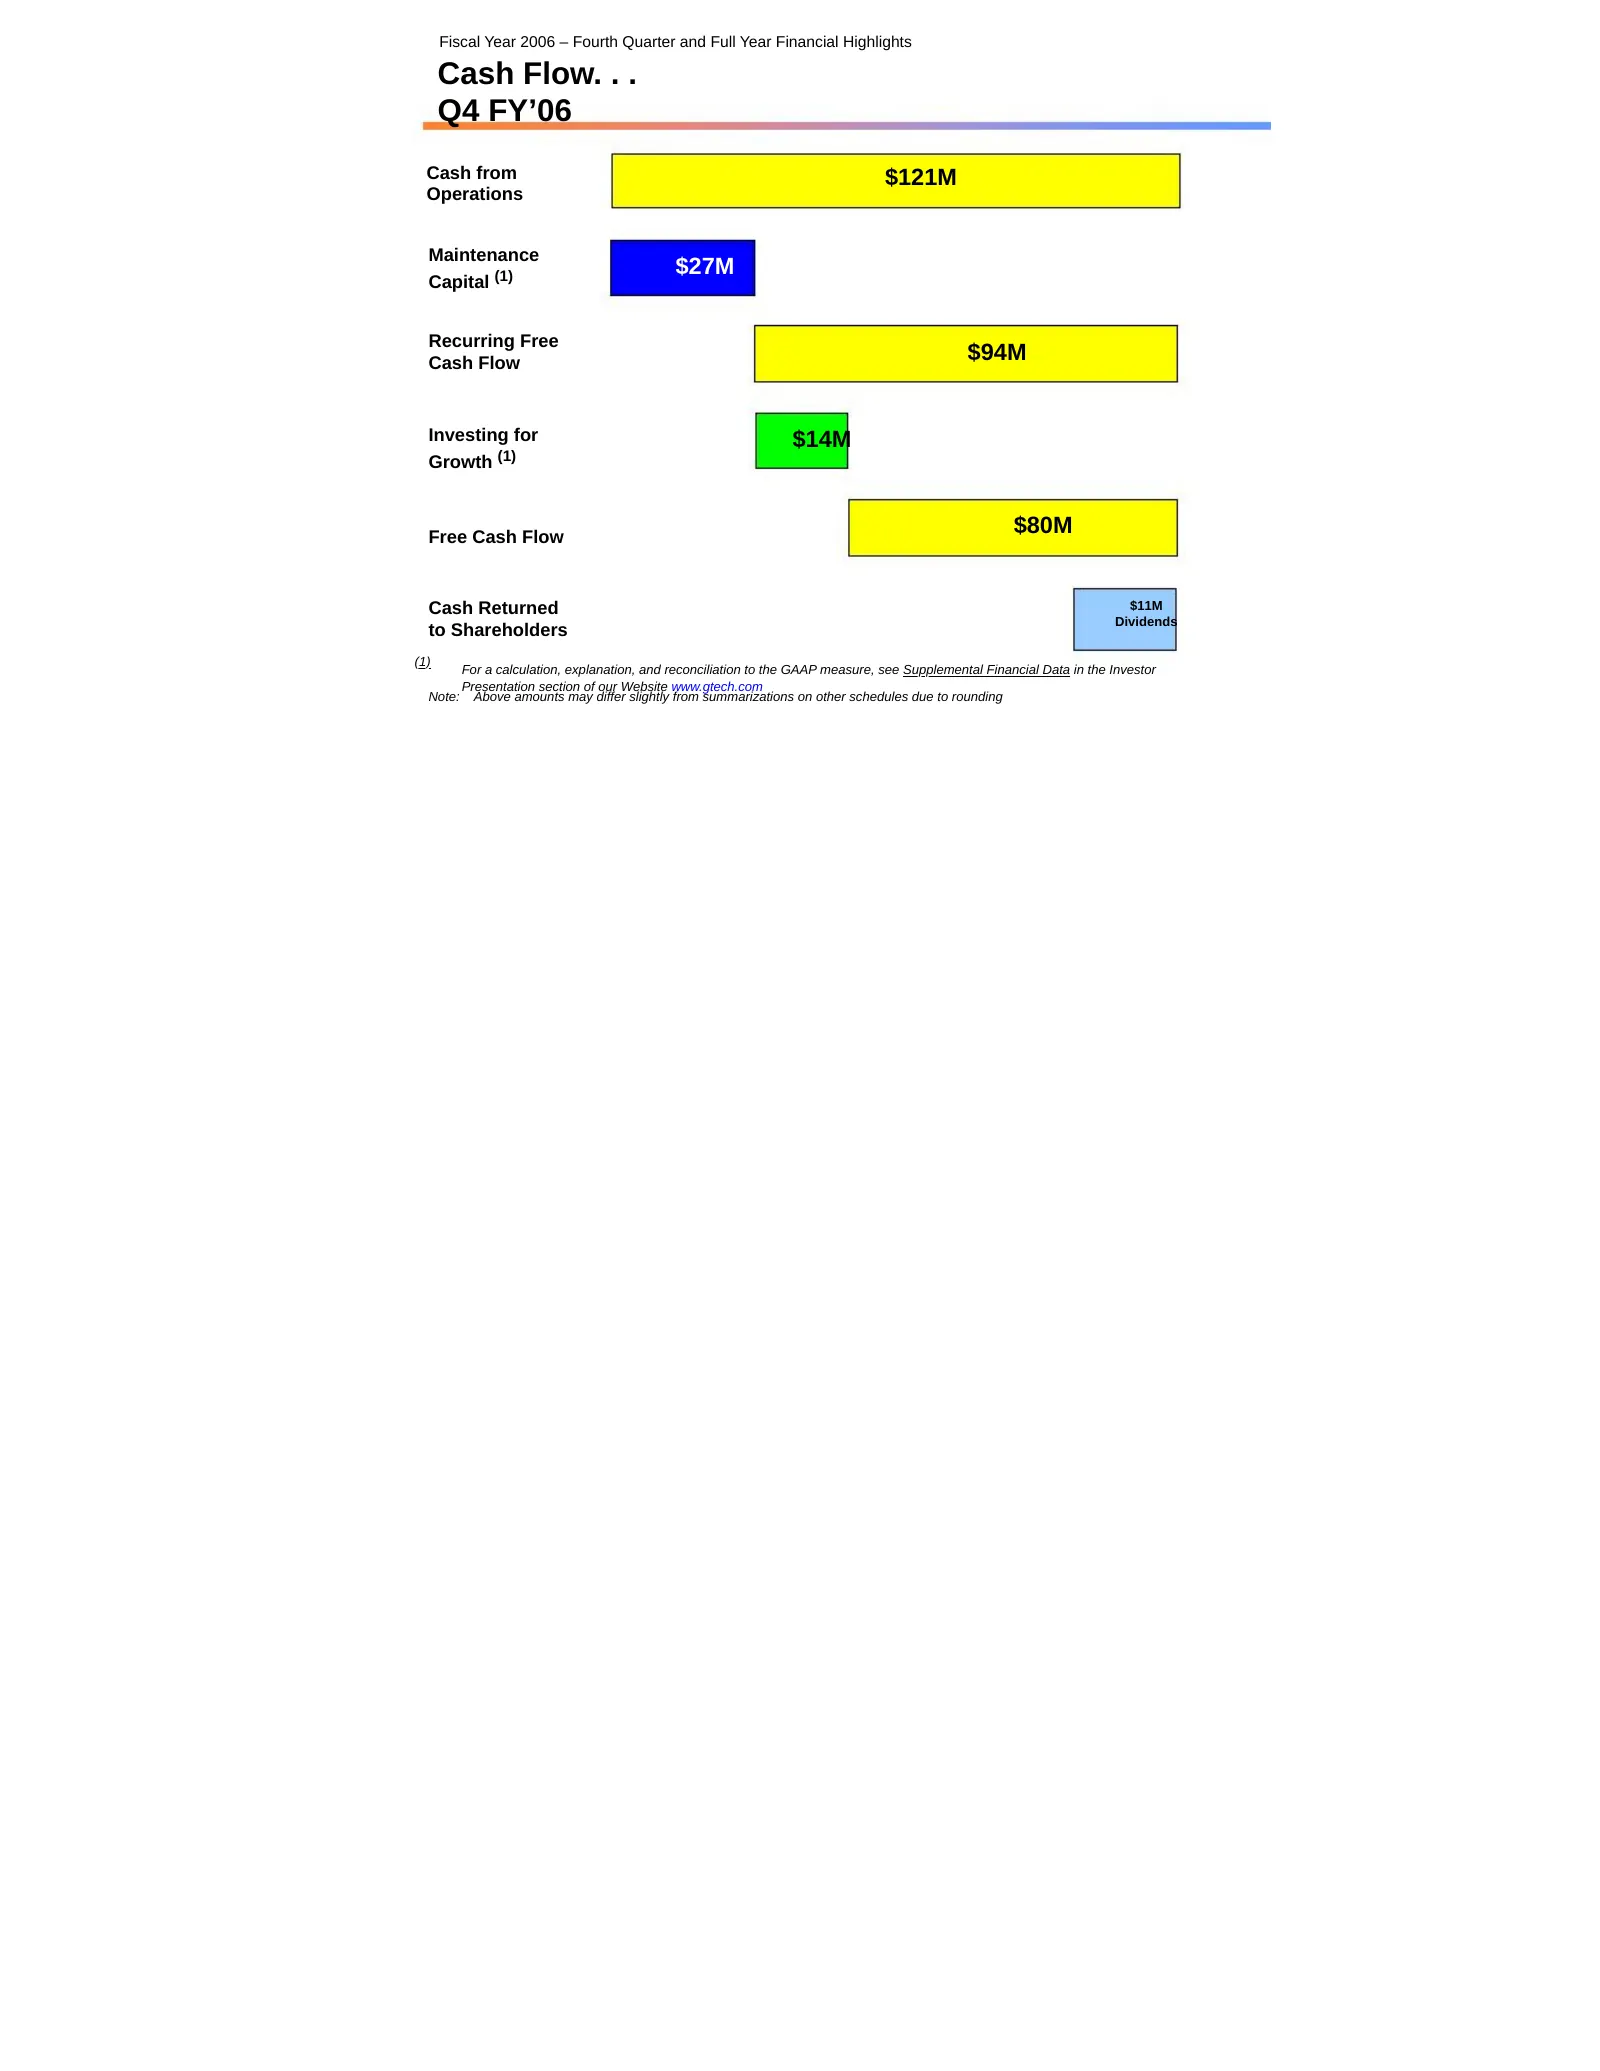
Fiscal Year 2006 – Fourth Quarter and Full Year Financial Highlights Cash Flow. . . Q4 FY’06 Cash from $121M Operations Maintenance $27M Capital (1) Recurring Free Cash Flow $94M Investing for $14M Growth (1) Free Cash Flow $80M Cash Returned $11M Dividends to Shareholders (1) For a calculation, exp
Slide 8: Service Revenue Analysis: FY'06 vs. FY'05
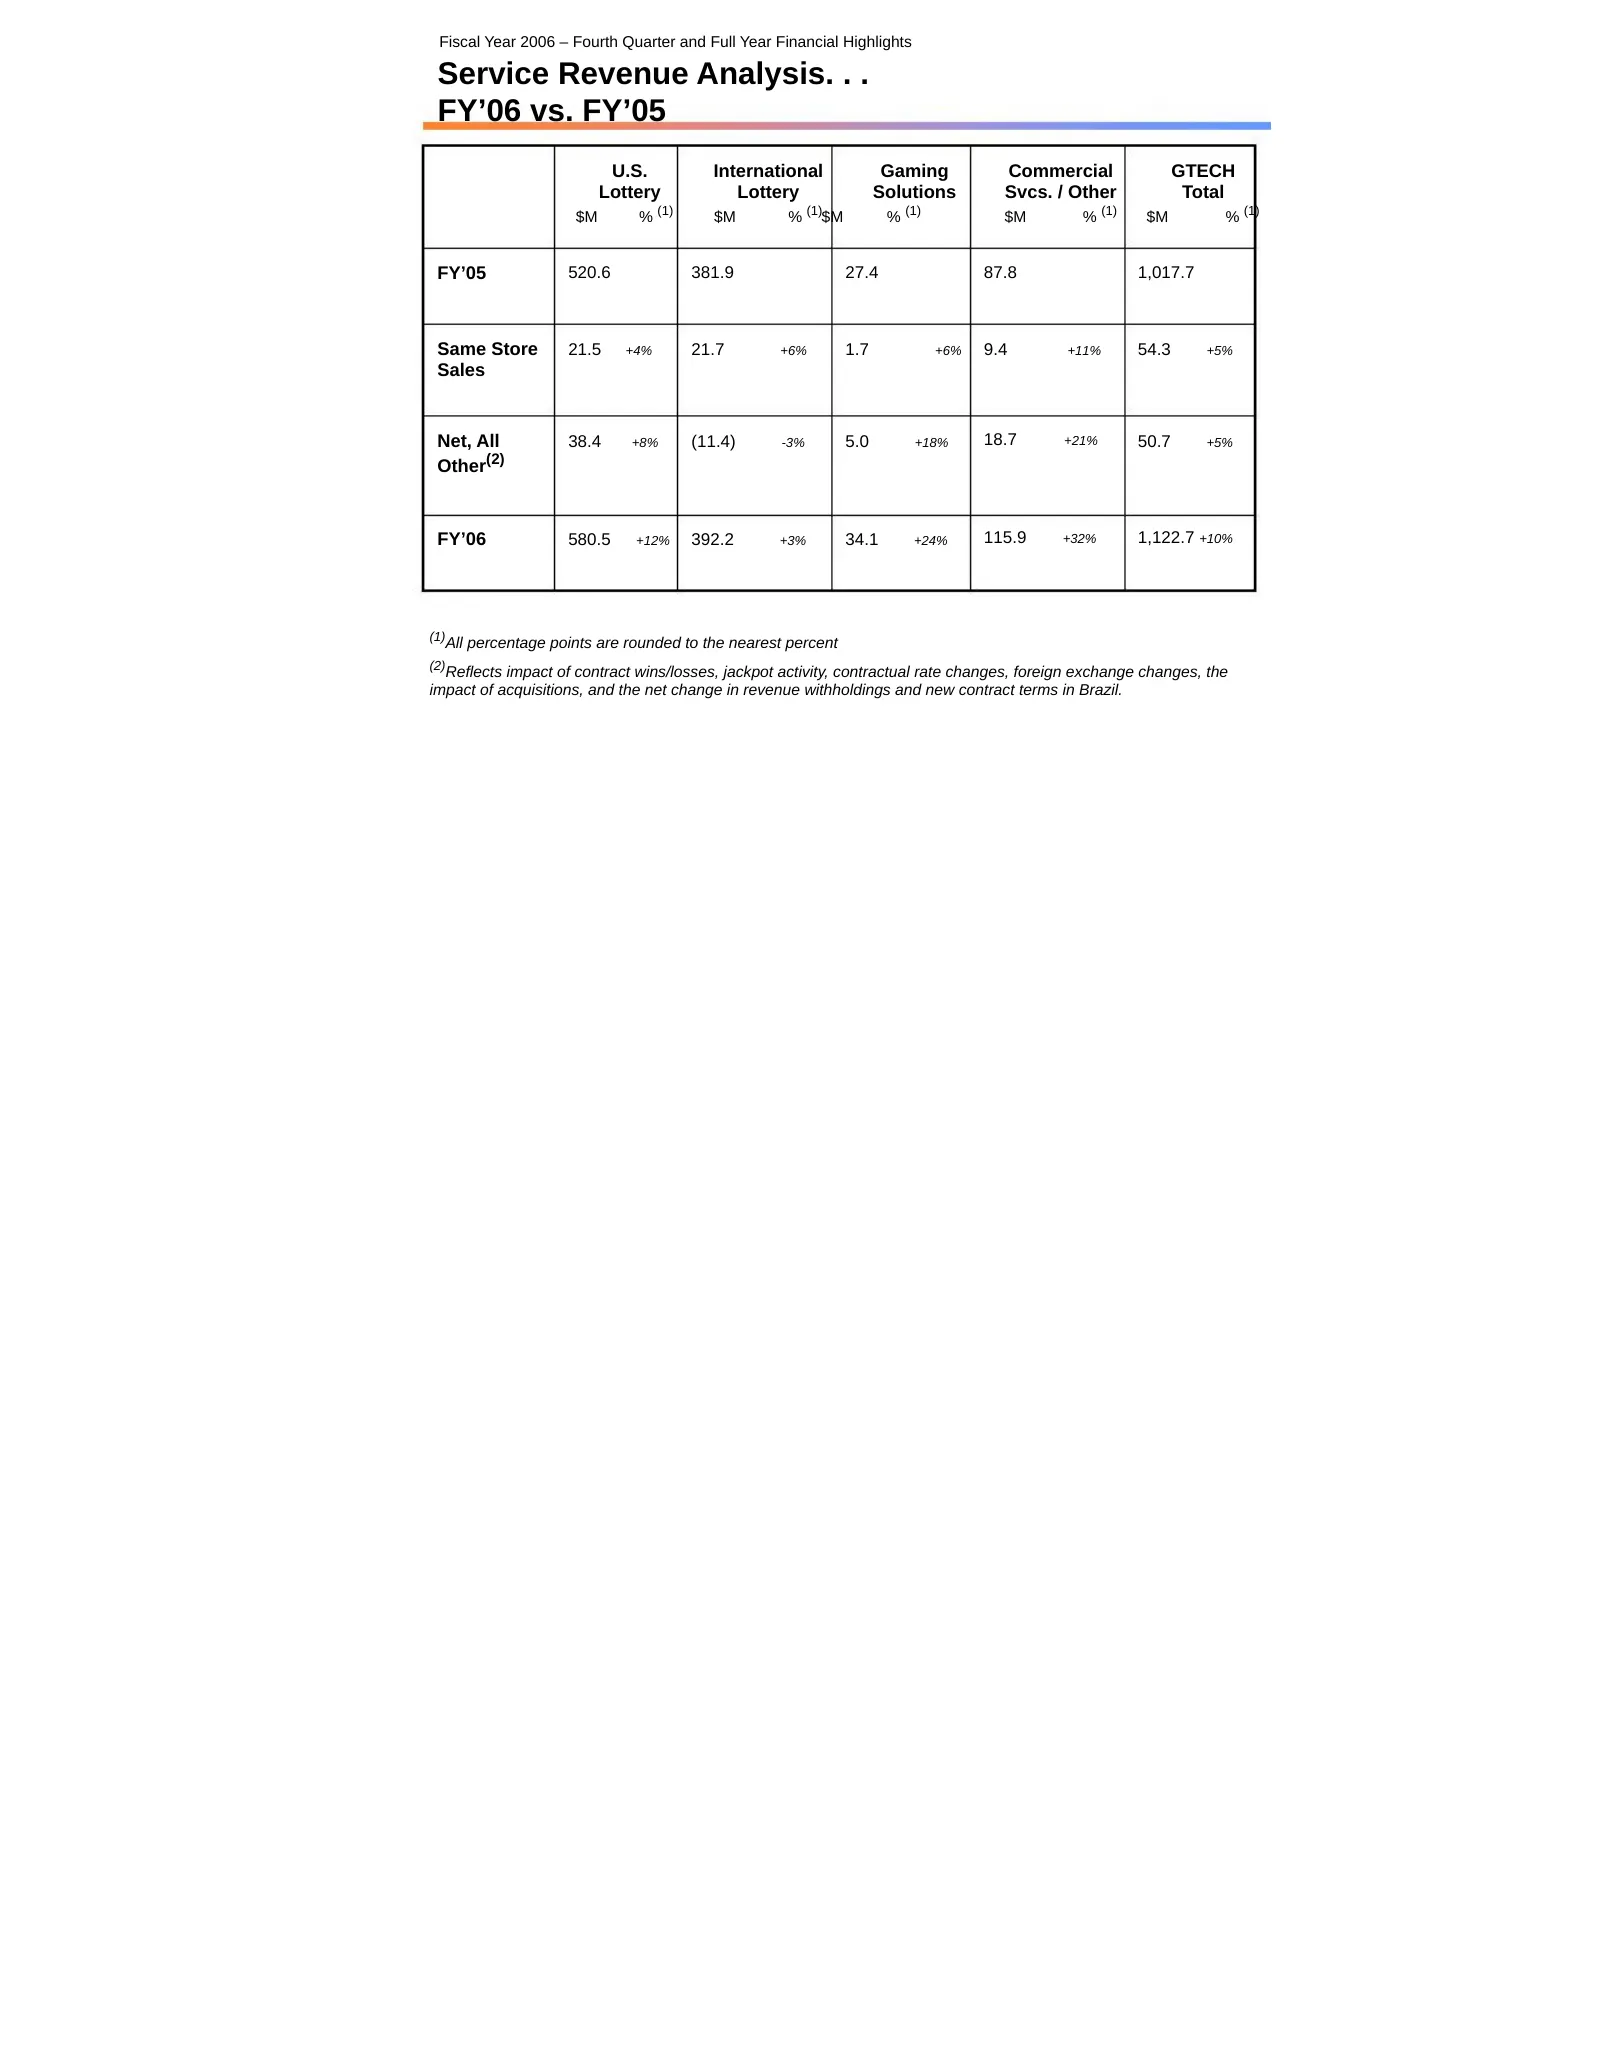
Fiscal Year 2006 – Fourth Quarter and Full Year Financial Highlights Service Revenue Analysis. . . FY’06 vs. FY’05 U.S. International Gaming Commercial GTECH Lottery Lottery Solutions Svcs. / Other Total (1) (1) (1) (1) $M % $M % $M % $M % $M % (1) FY’05 520.6 381.9 27.4 87.8 1,017.7 Same Store 21.5
Slide 9: Key Financial Highlights: FY'06
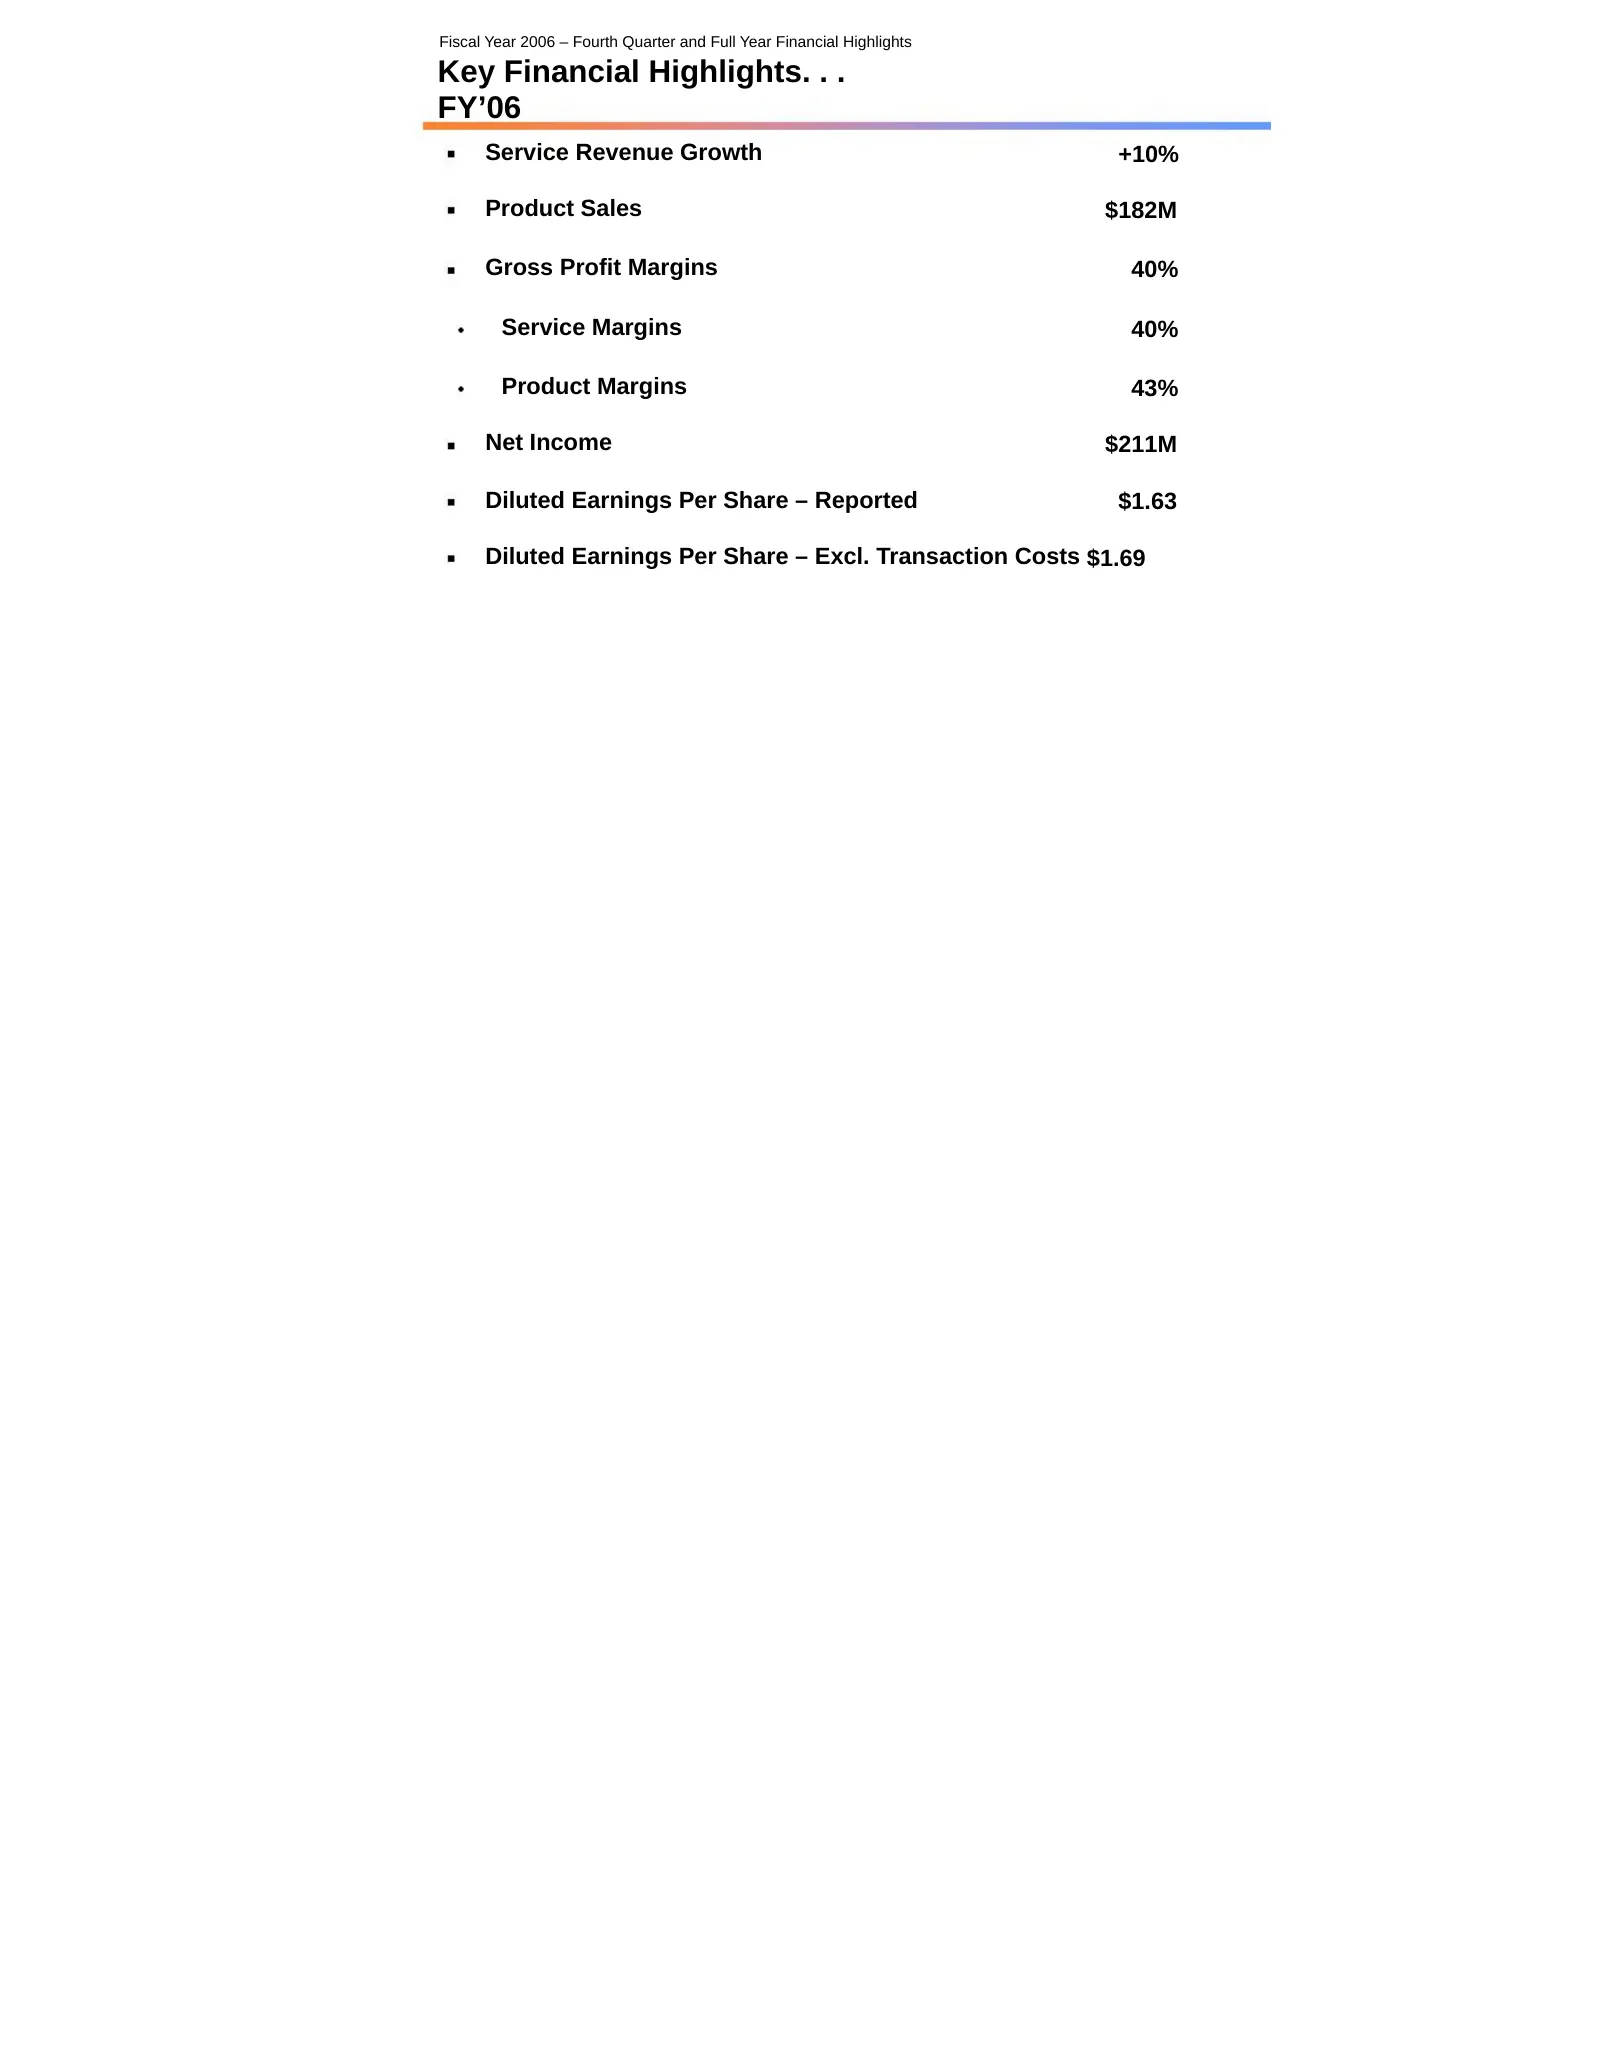
Fiscal Year 2006 – Fourth Quarter and Full Year Financial Highlights Key Financial Highlights. . . FY’06 Service Revenue Growth +10% Product Sales $182M Gross Profit Margins 40% Service Margins 40% Product Margins 43% Net Income $211M Diluted Earnings Per Share – Reported $1.63 Diluted Earnings Per
Slide 10: Total Revenue: FY'06
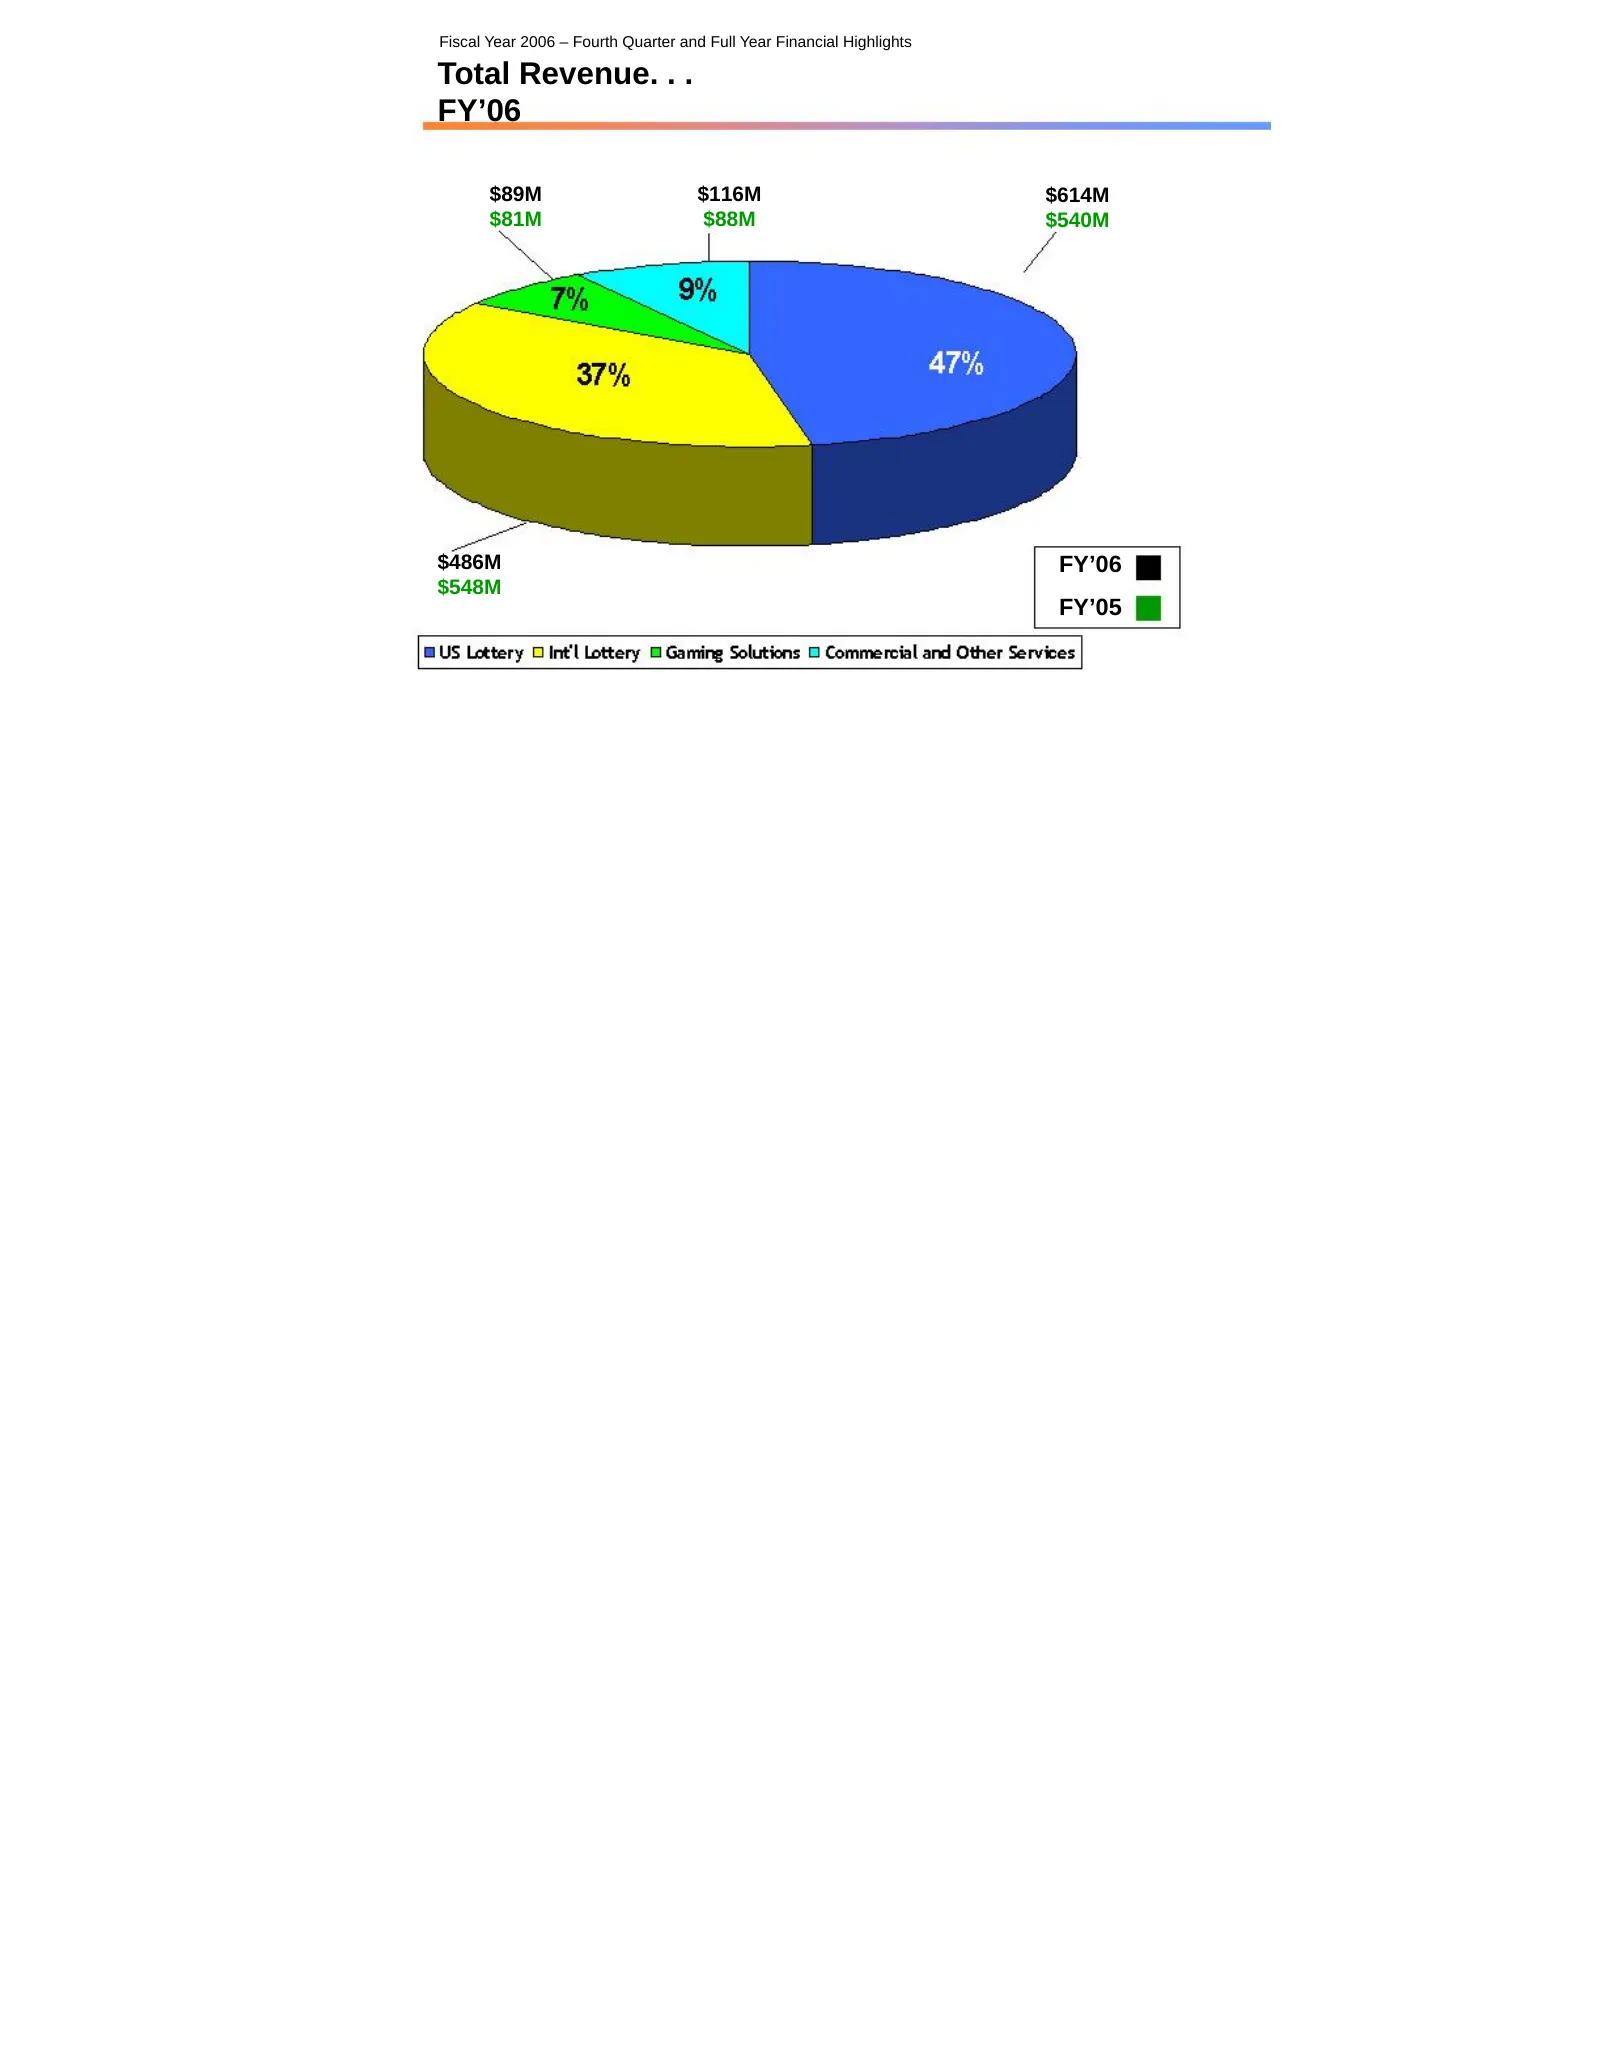
Fiscal Year 2006 – Fourth Quarter and Full Year Financial Highlights Total Revenue. . . FY’06 $89M $116M $614M $81M $88M $540M $486M FY’06 $548M FY’05 10
Slide 11: Cash Flow: FY'06
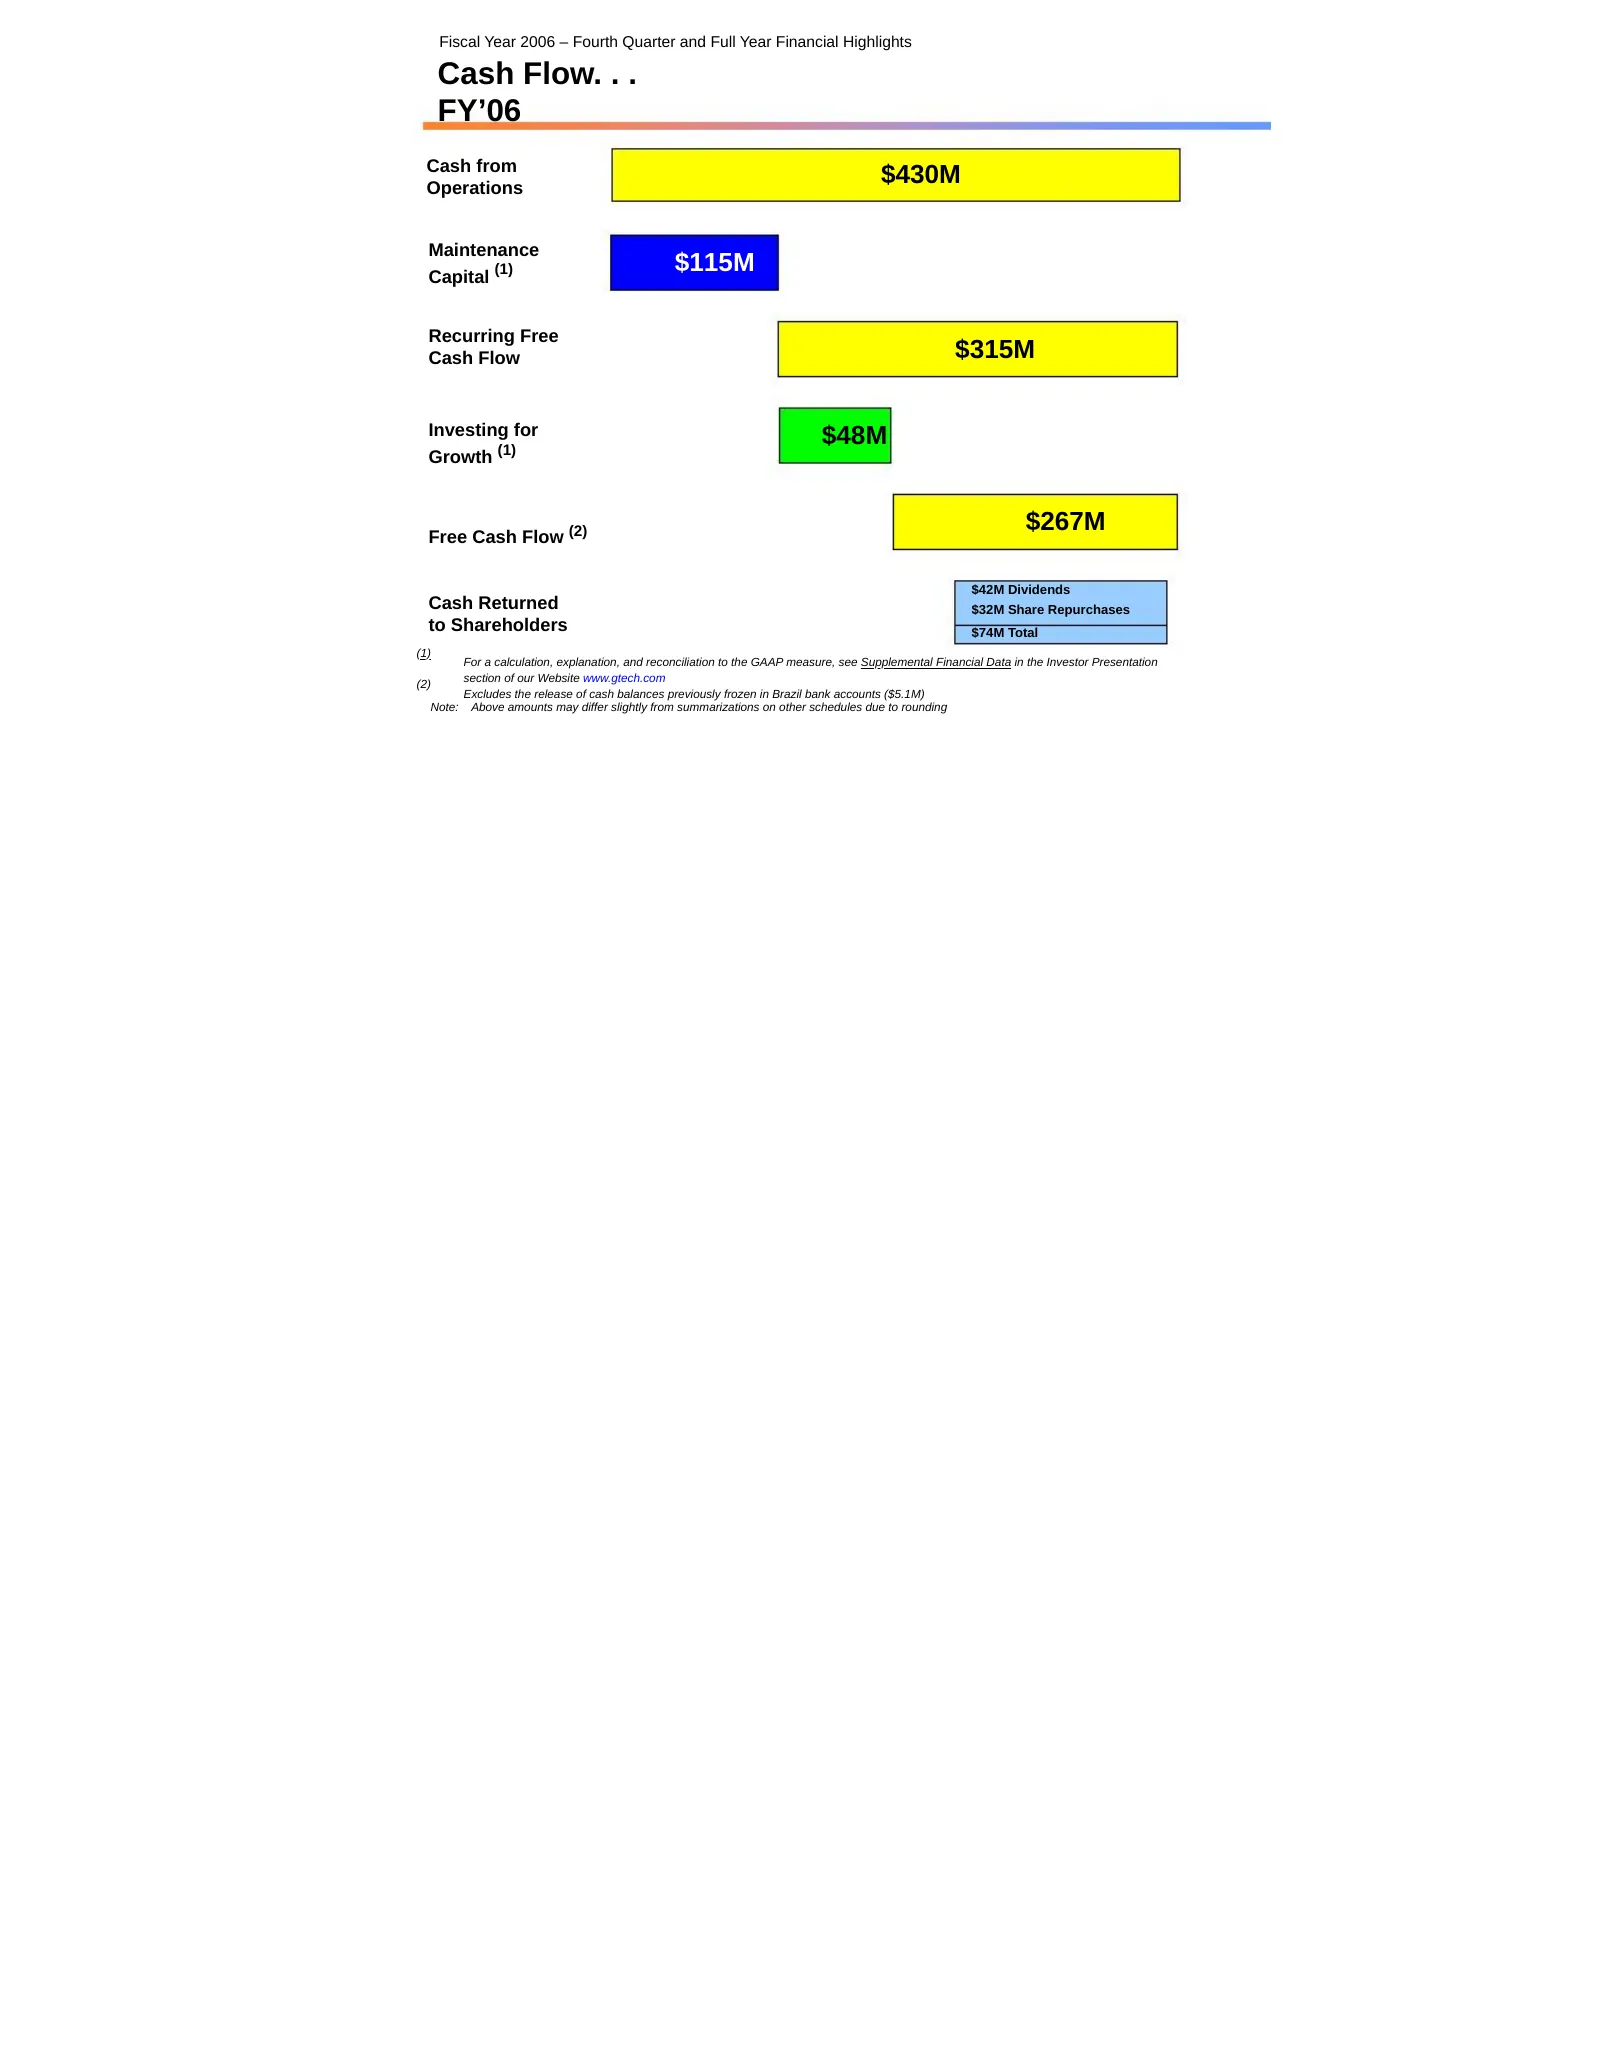
Fiscal Year 2006 – Fourth Quarter and Full Year Financial Highlights Cash Flow. . . FY’06 Cash from Operations $430M Maintenance Capital (1) $115M Recurring Free Cash Flow $315M Investing for $48M Growth (1) Free Cash Flow (2) $267M $42M Dividends Cash Returned $32M Share Repurchases to Shareholders
Slide 12: Return on Capital Employed: FY'06 vs. FY'05
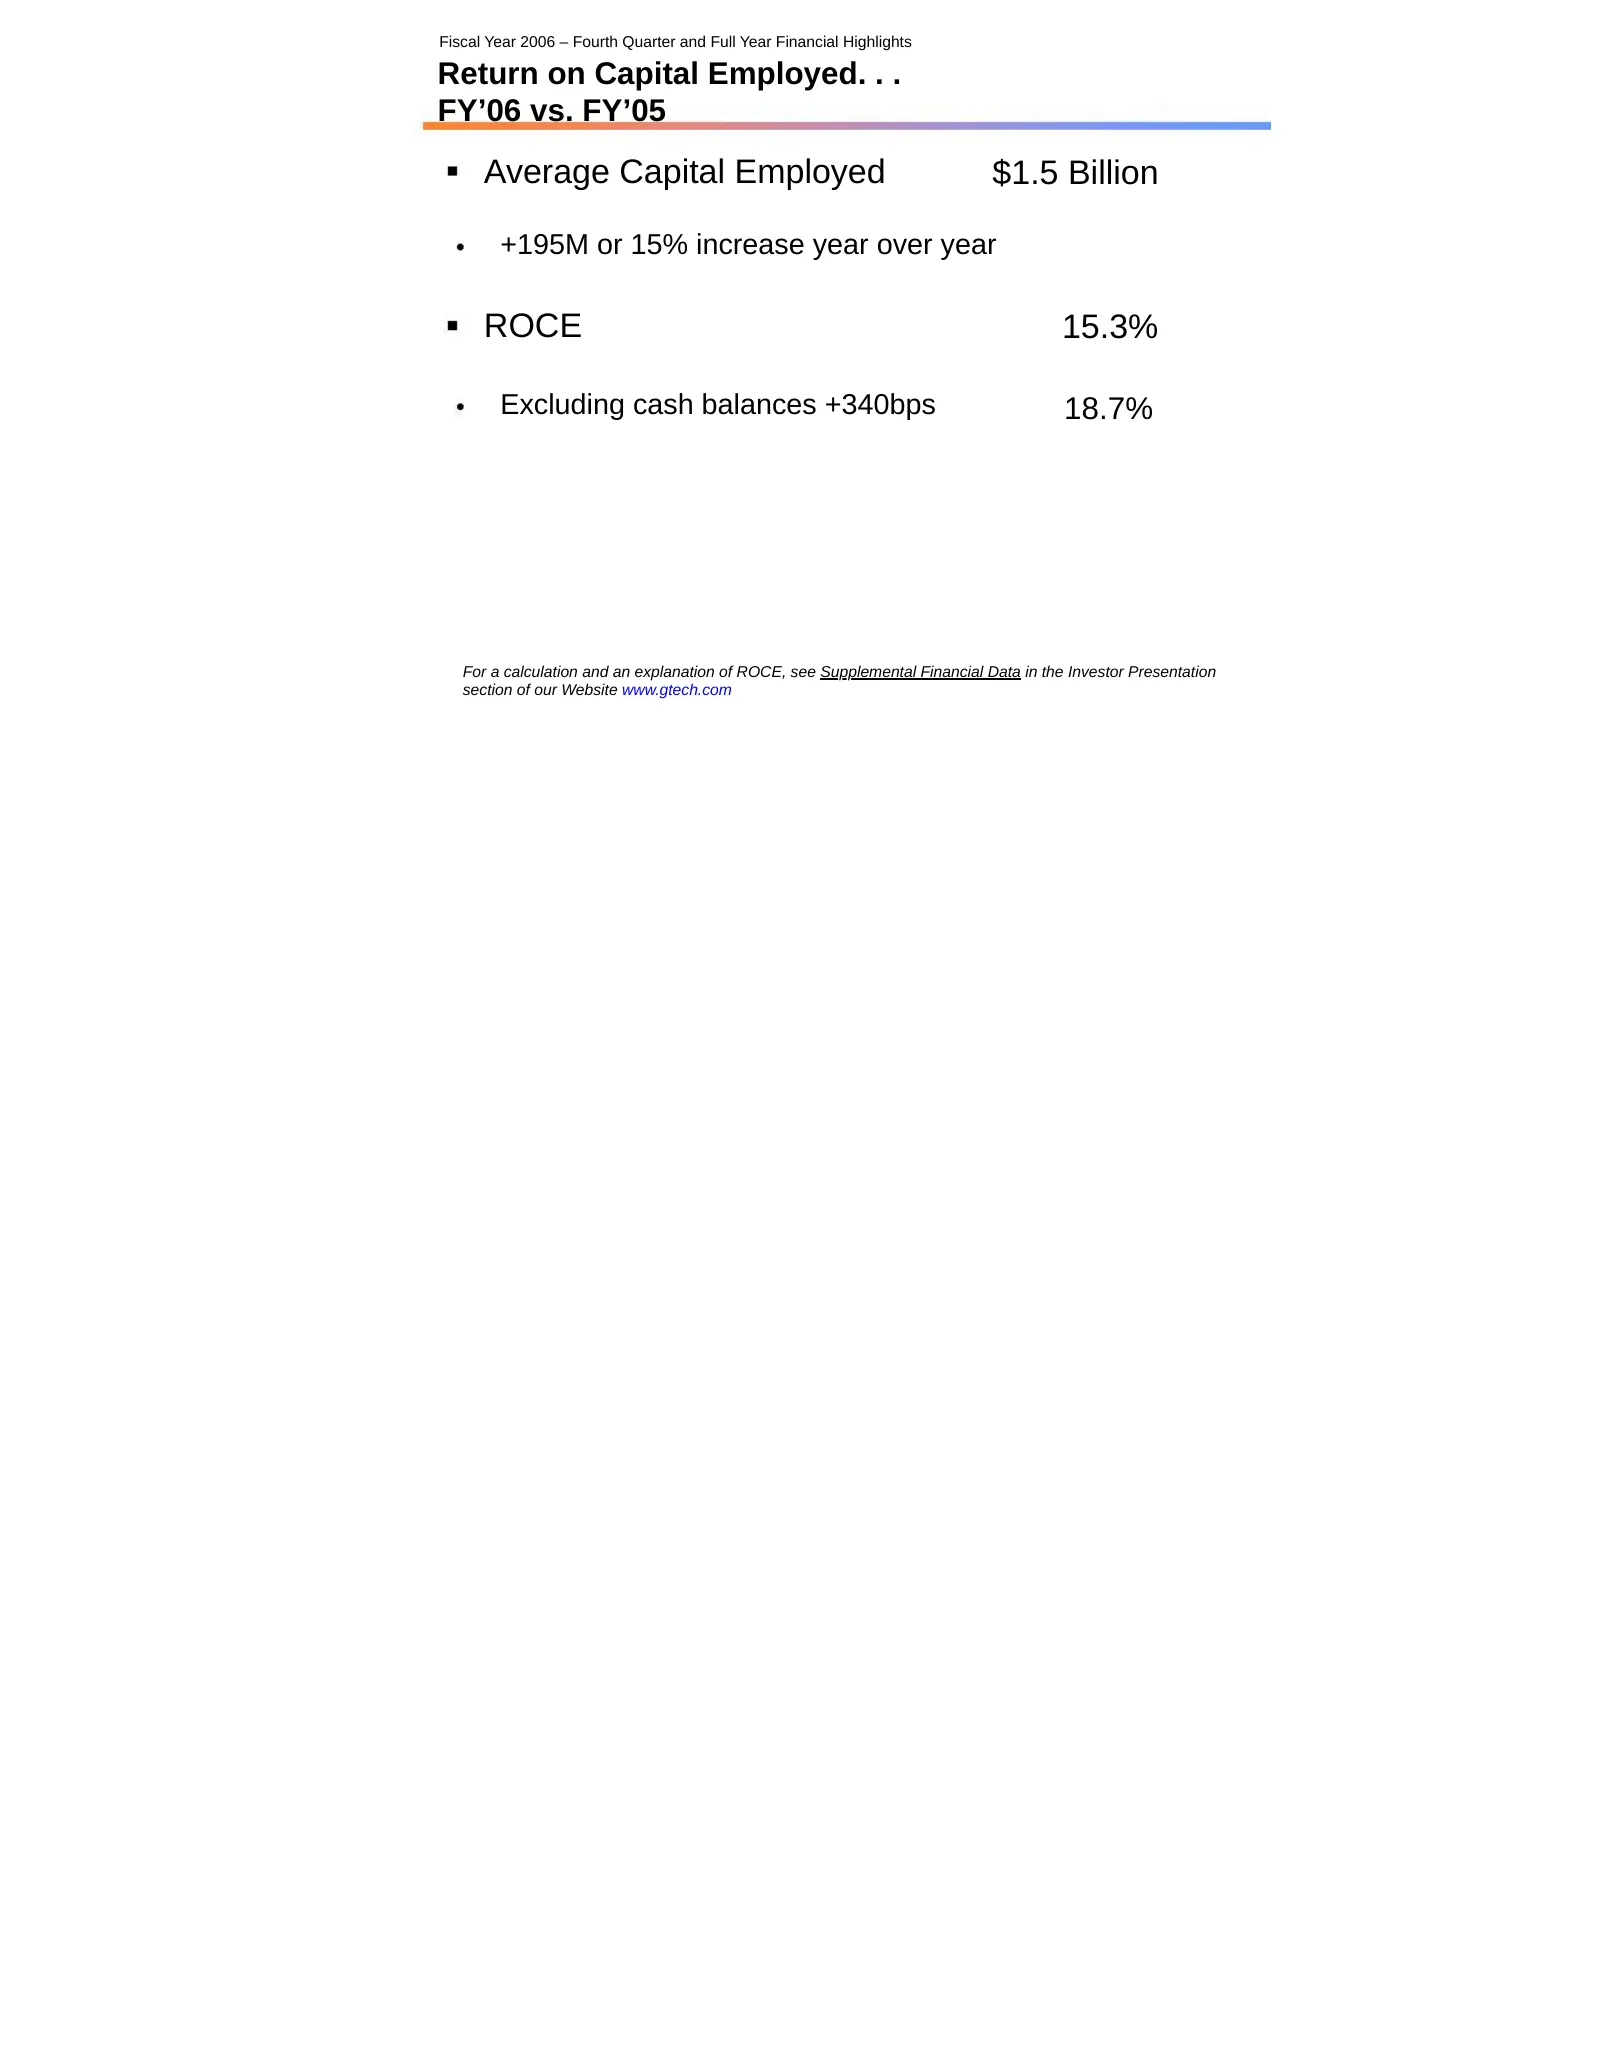
Fiscal Year 2006 – Fourth Quarter and Full Year Financial Highlights Return on Capital Employed. . . FY’06 vs. FY’05 Average Capital Employed $1.5 Billion +195M or 15% increase year over year ROCE 15.3% Excluding cash balances +340bps 18.7% For a calculation and an explanation of ROCE, see Supplemen
Source: SEC EDGAR · 8-K filed Apr 12, 2006
More decks from Gtech Holdings Corp
 Merger or Acquisition (April 2006)20 slides · Apr 26, 2006
 Merger or Acquisition (February 2006)8 slides · Feb 28, 2006
 Q3 FY2006 Earnings Presentation17 slides · Dec 16, 2005
 Q2 FY2006 Earnings Presentation19 slides · Sep 23, 2005
 Q1 FY2006 Earnings Presentation17 slides · Jun 22, 2005
 Q4 FY2005 Earnings Presentation22 slides · Apr 14, 2005