Enghouse Systems Limited · TSX:ENGH
Enghouse Systems — Q2 FY2014 Earnings Presentation
24 slides from Enghouse Systems's earnings presentation, Sep 15, 2014
Slide 1: Corporate Overview
Corporate Overview
Slide 2: Forward-Looking Statements Disclaimer
Enghouse Systems Forward-Looking Statements Disclaimer Certain statements made in this presentation and the related materials may contain forward-looking statements, which are not historical facts, but are based on certain assumptions and reflect Enghouse’s current expectations. These forward-lookin
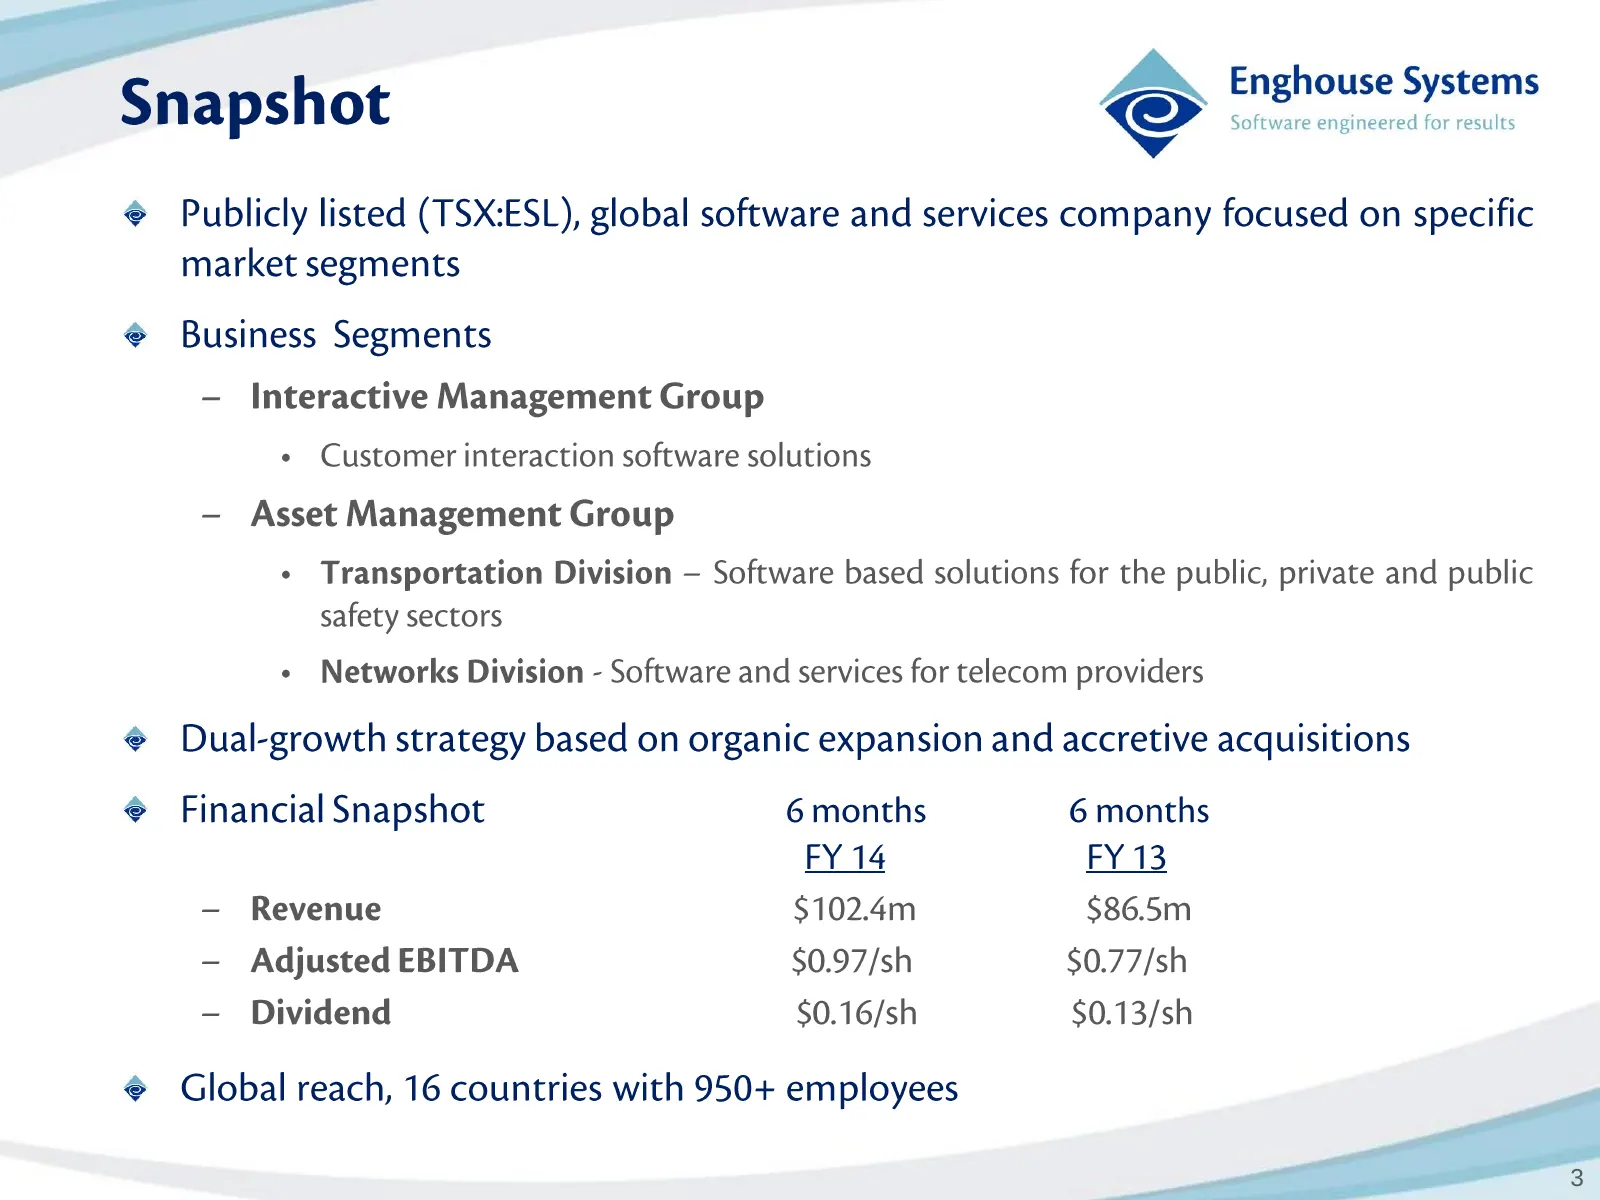
Slide 3: Snapshot
Software engineered for results Snapshot cos Enghouse Systems @ Publicly listed (TSX:ESL), global software and services company focused on specific market segments @ Business Segments - Interactive Management Group « Customer interaction software solutions - Asset Management Group ¢ Transportation D
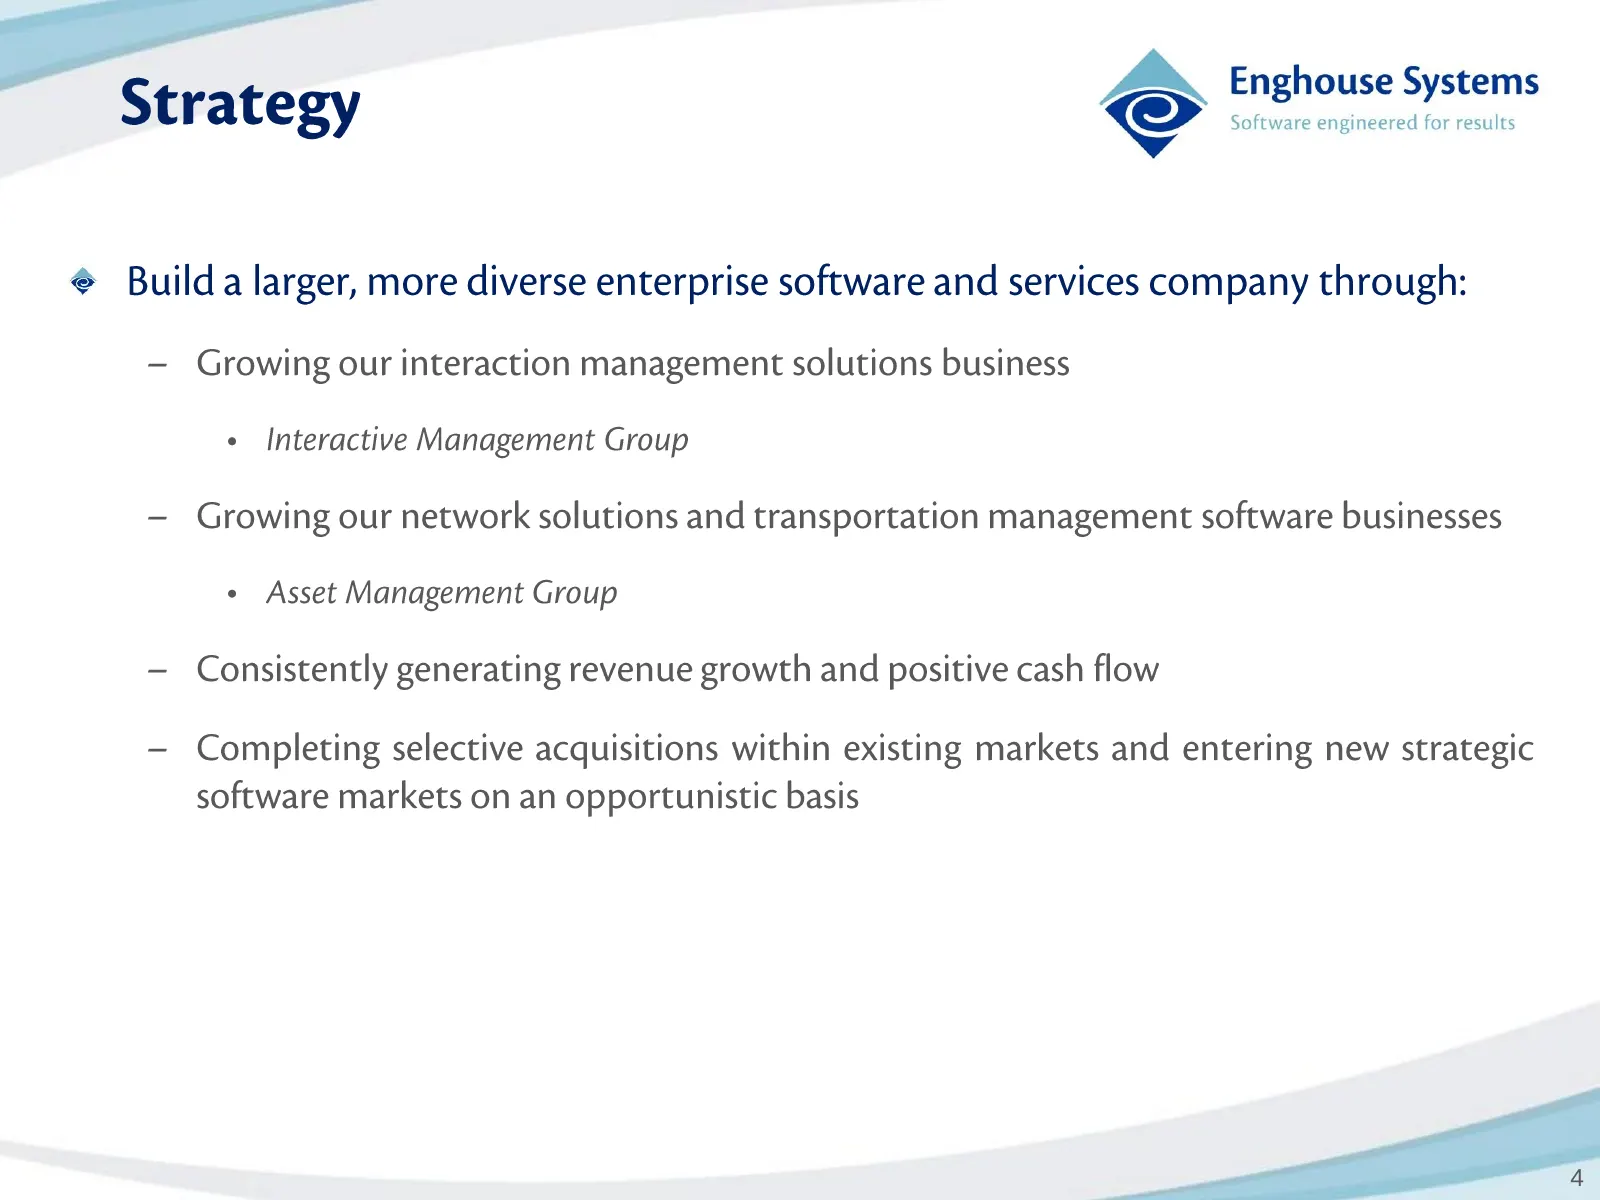
Slide 4: Strategy
= Enghouse Systems Strategy cos sotdkemmens Gowns @ Builda larger, more diverse enterprise software and services company through: Growing our interaction management solutions business * Interactive Management Group Growing our network solutions and transportation management software businesses ° Ass
Slide 5: Interactive - Sector Dynamics
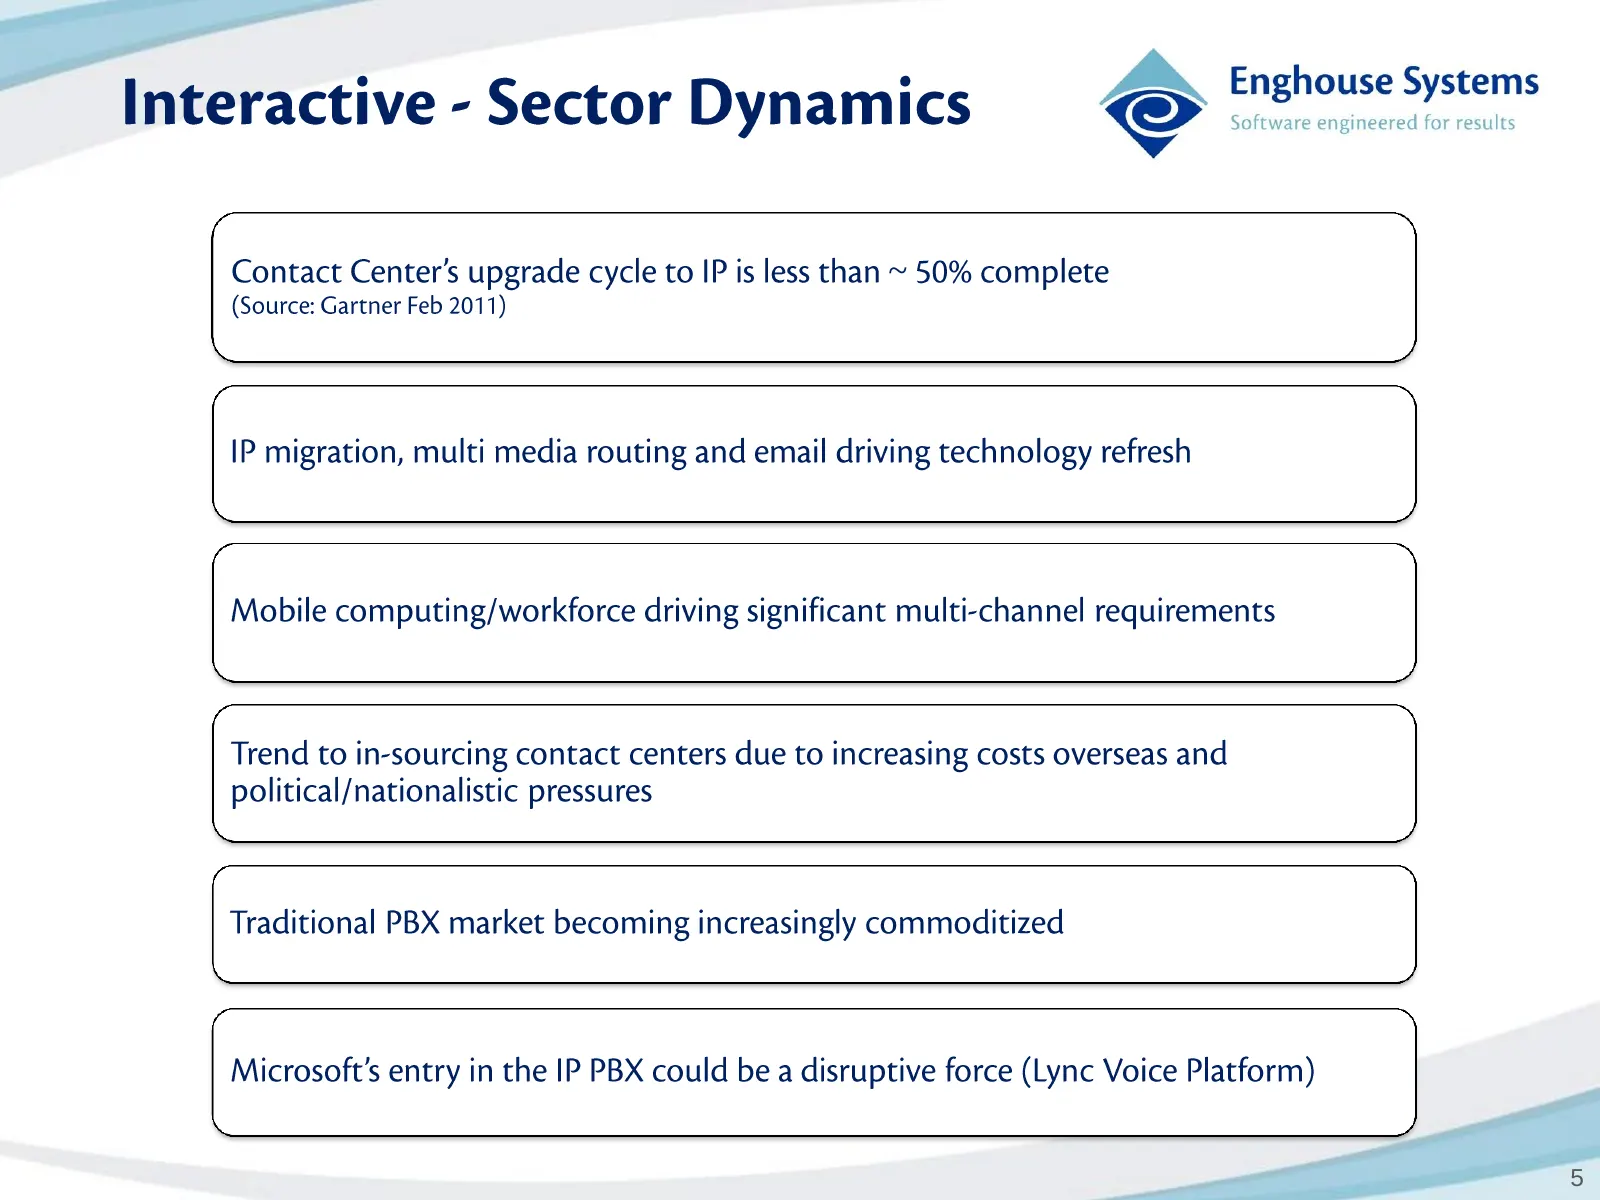
Interactive - Sector Dynamics © enifoline Syste ftwa igineered for result Contact Center’s upgrade cycle to IP is less than ~ 50% complete (Source: Gartner Feb 2011) \ / IP migration, multi media routing and email driving technology refresh XN S Va Mobile computing/workforce driving significant mult
Slide 6: Interactive Portfolio
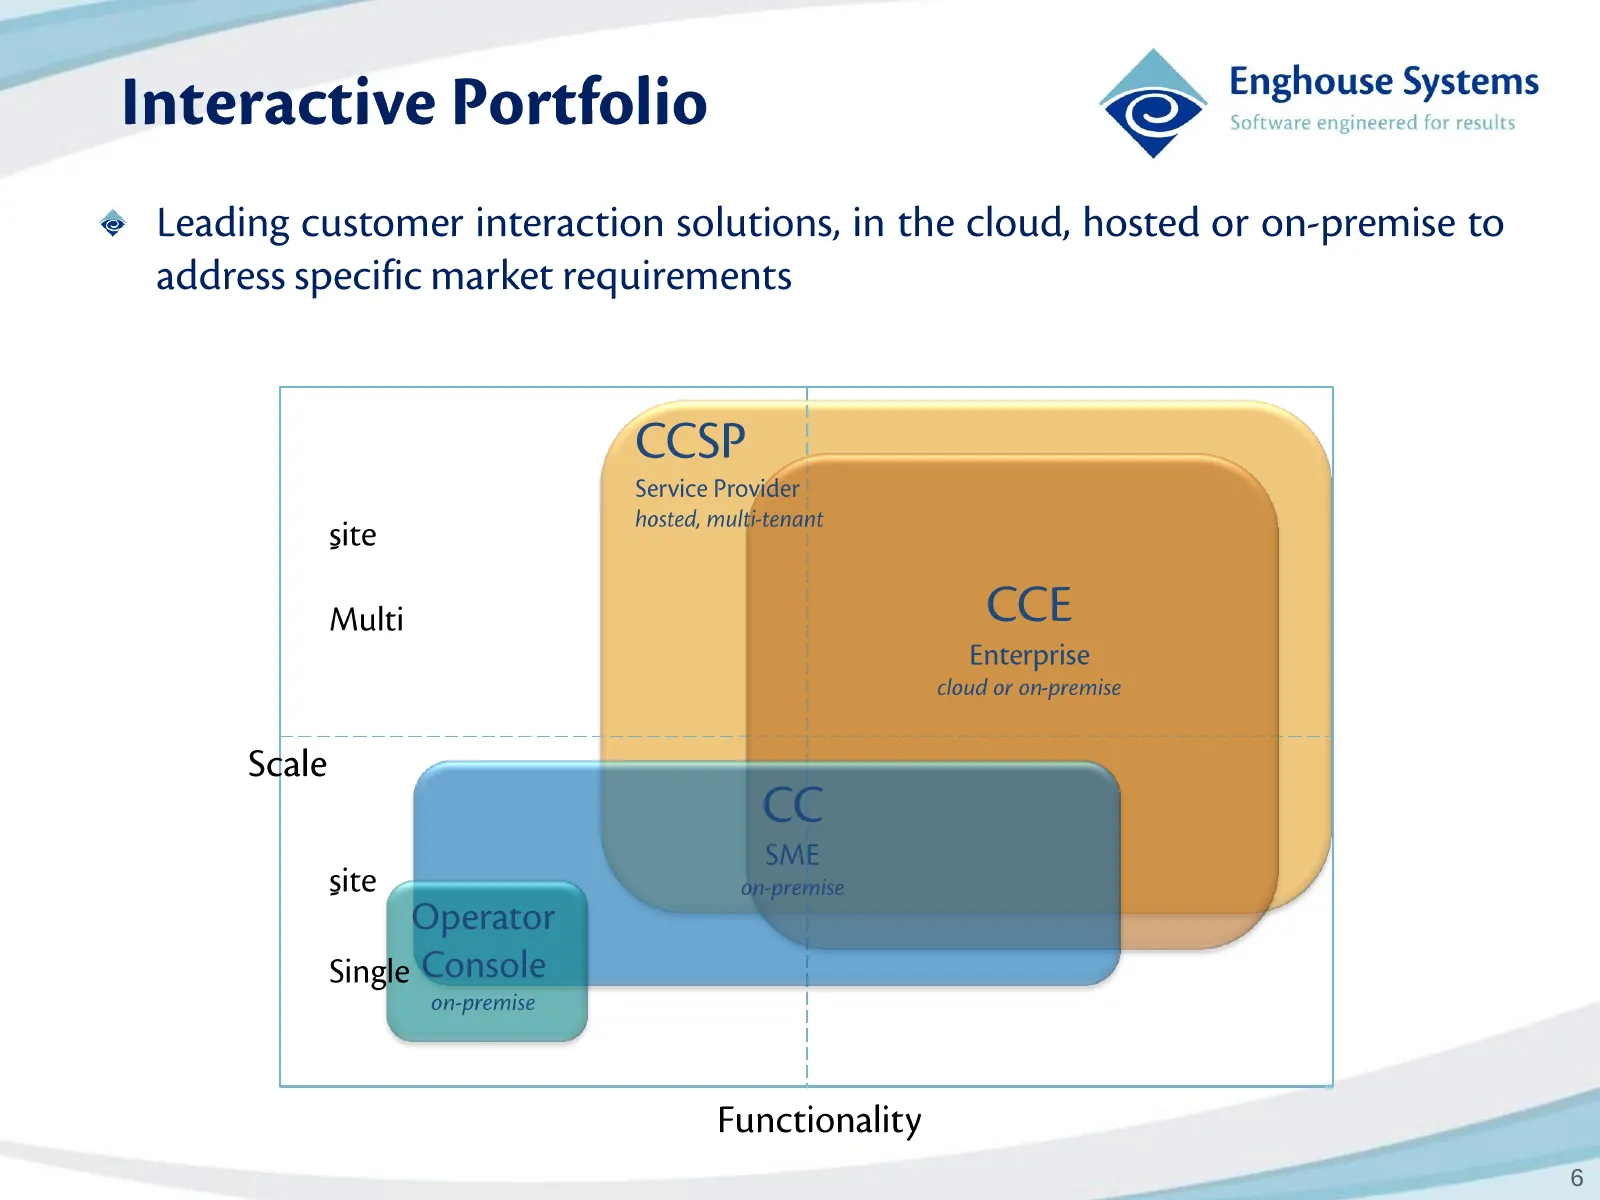
Interactive Portfolio © pe do a @ Leading customer interaction solutions, in the cloud, hosted or on-premise to address specific market requirements Functionality __e—,é
Slide 7: Interactive Portfolio
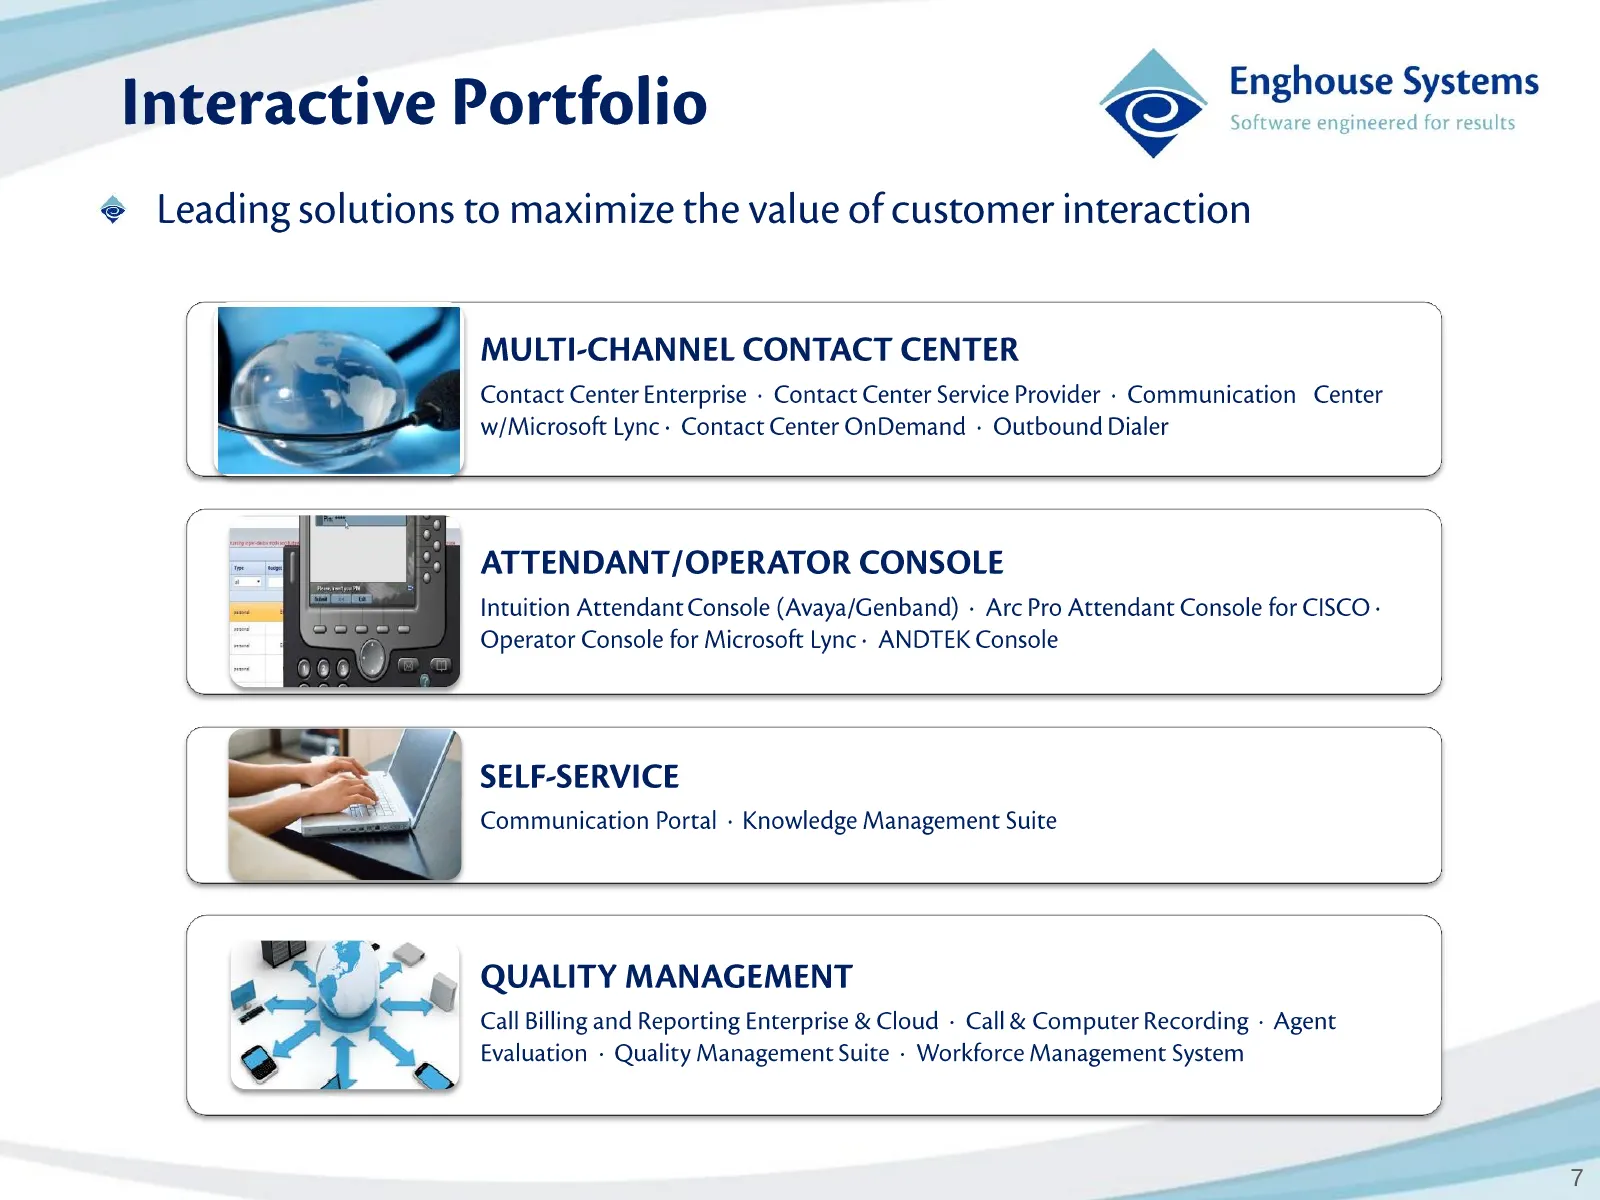
— —— Enghouse Systems Interactive Portfolio © rica ame @ Leading solutions to maximize the value of customer interaction MULTI-CHANNEL CONTACT CENTER Contact Center Enterprise - Contact Center Service Provider - Communication Center w/Microsoft Lync- Contact Center OnDemand - Outbound Dialer ATTENDA
Slide 8: Transportation - Sector Dynamics
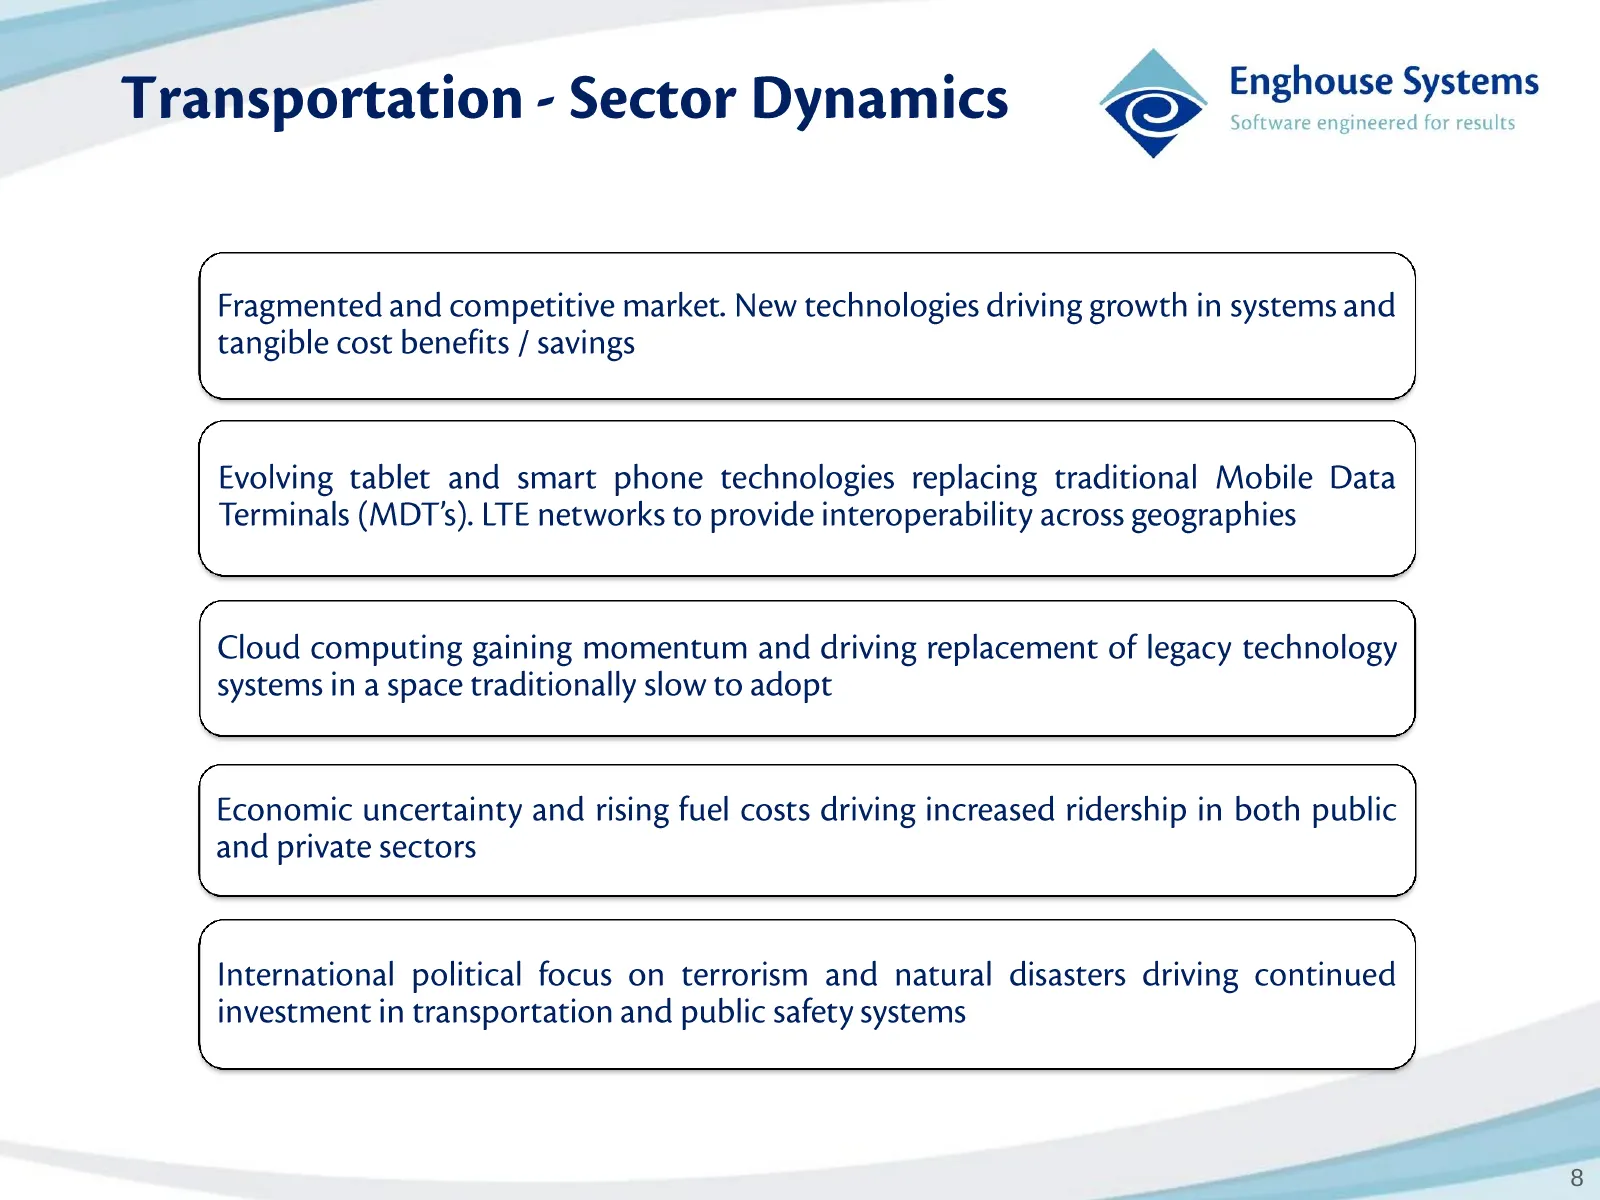
ftware engineered for results Transportation - Sector Dynamics cos Enghouse Systems Fragmented and competitive market. New technologies driving growth in systems and tangible cost benefits / savings \ / Evolving tablet and smart phone technologies replacing traditional Mobile Data Terminals (MDT’s).
Slide 9: Transportation Portfolio
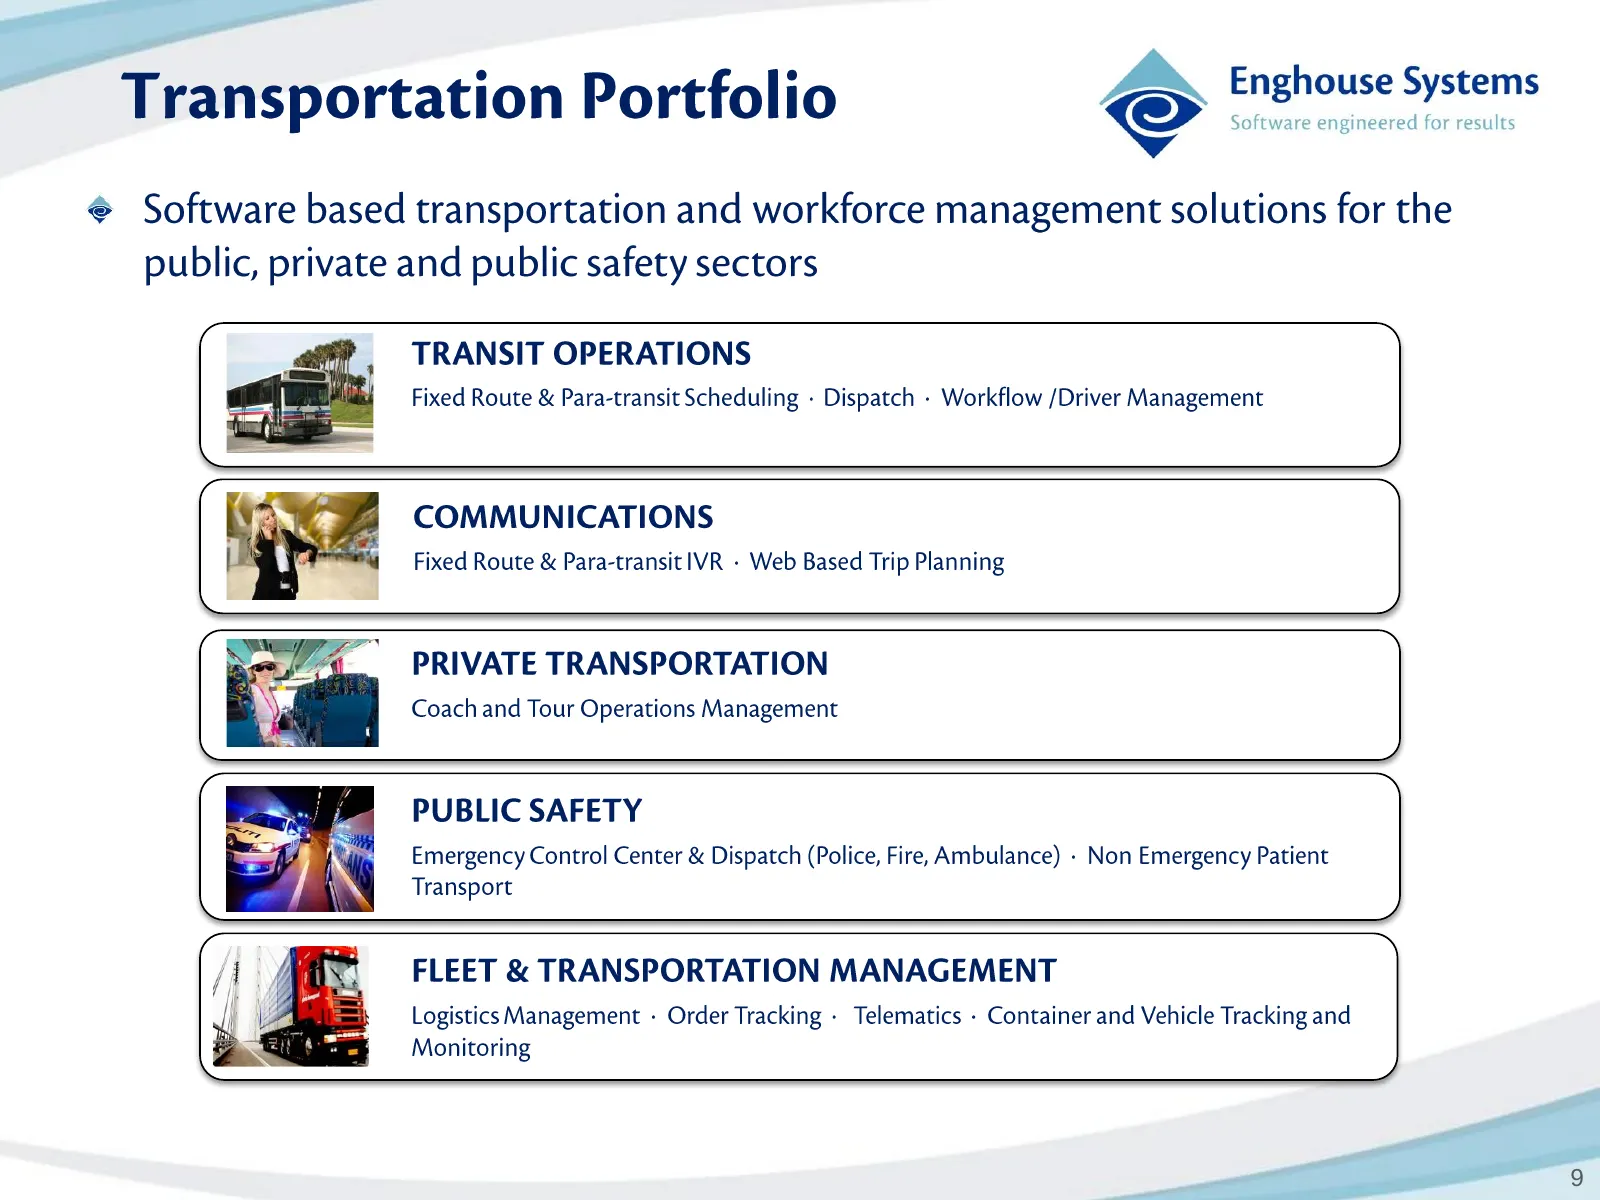
Enghouse Systems Transportation Portfolio cos aera ents @ Software based transportation and workforce management solutions for the public, private and public safety sectors (— >) , TRANSIT OPERATIONS Fixed Route & Para-transit Scheduling - Dispatch - Workflow /Driver Management we S a COMMUNICATIONS
Slide 10: Networks - Sector Dynamics
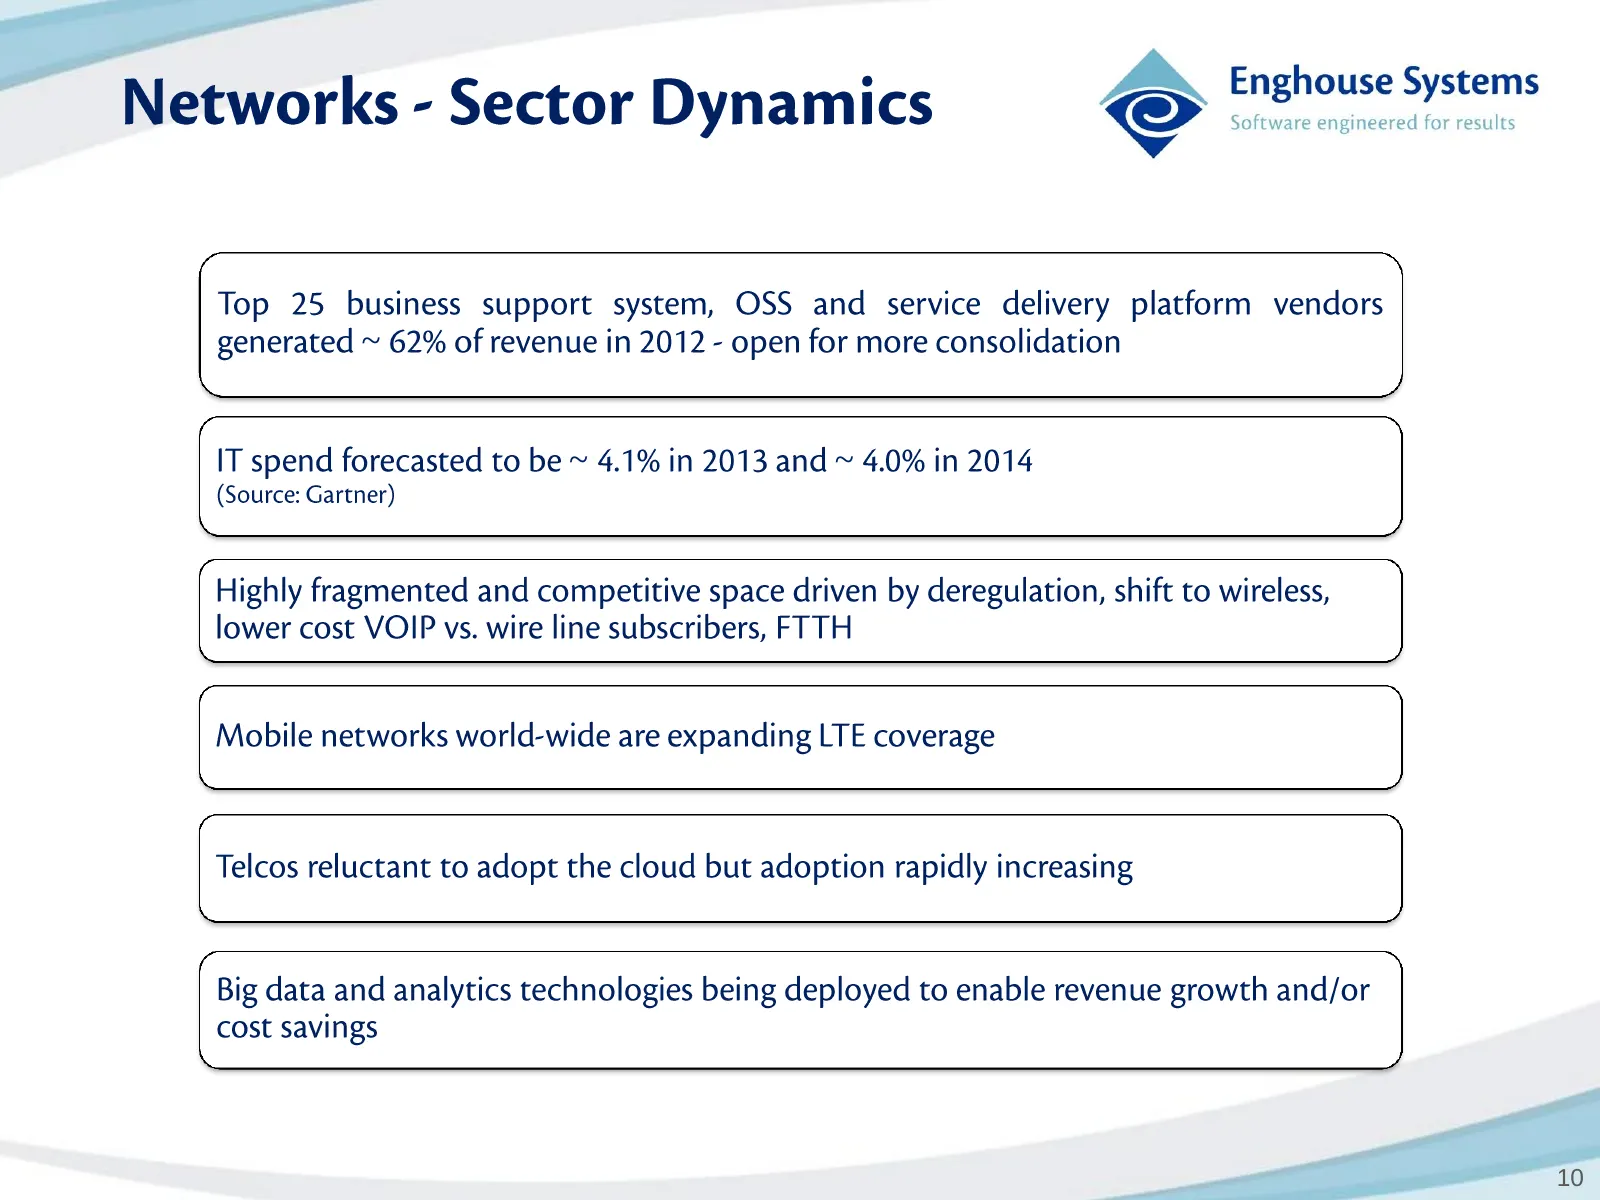
Networks - Sector Dynamics © pi iheoitn abe Top 25 business support system, OSS and service delivery platform vendors generated ~ 62% of revenue in 2012 - open for more consolidation XX / IT spend forecasted to be ~ 4.1% in 2013 and ~ 4.0% in 2014 (Source: Gartner) Ne / , Highly fragmented and compe
Slide 11: Networks Portfolio
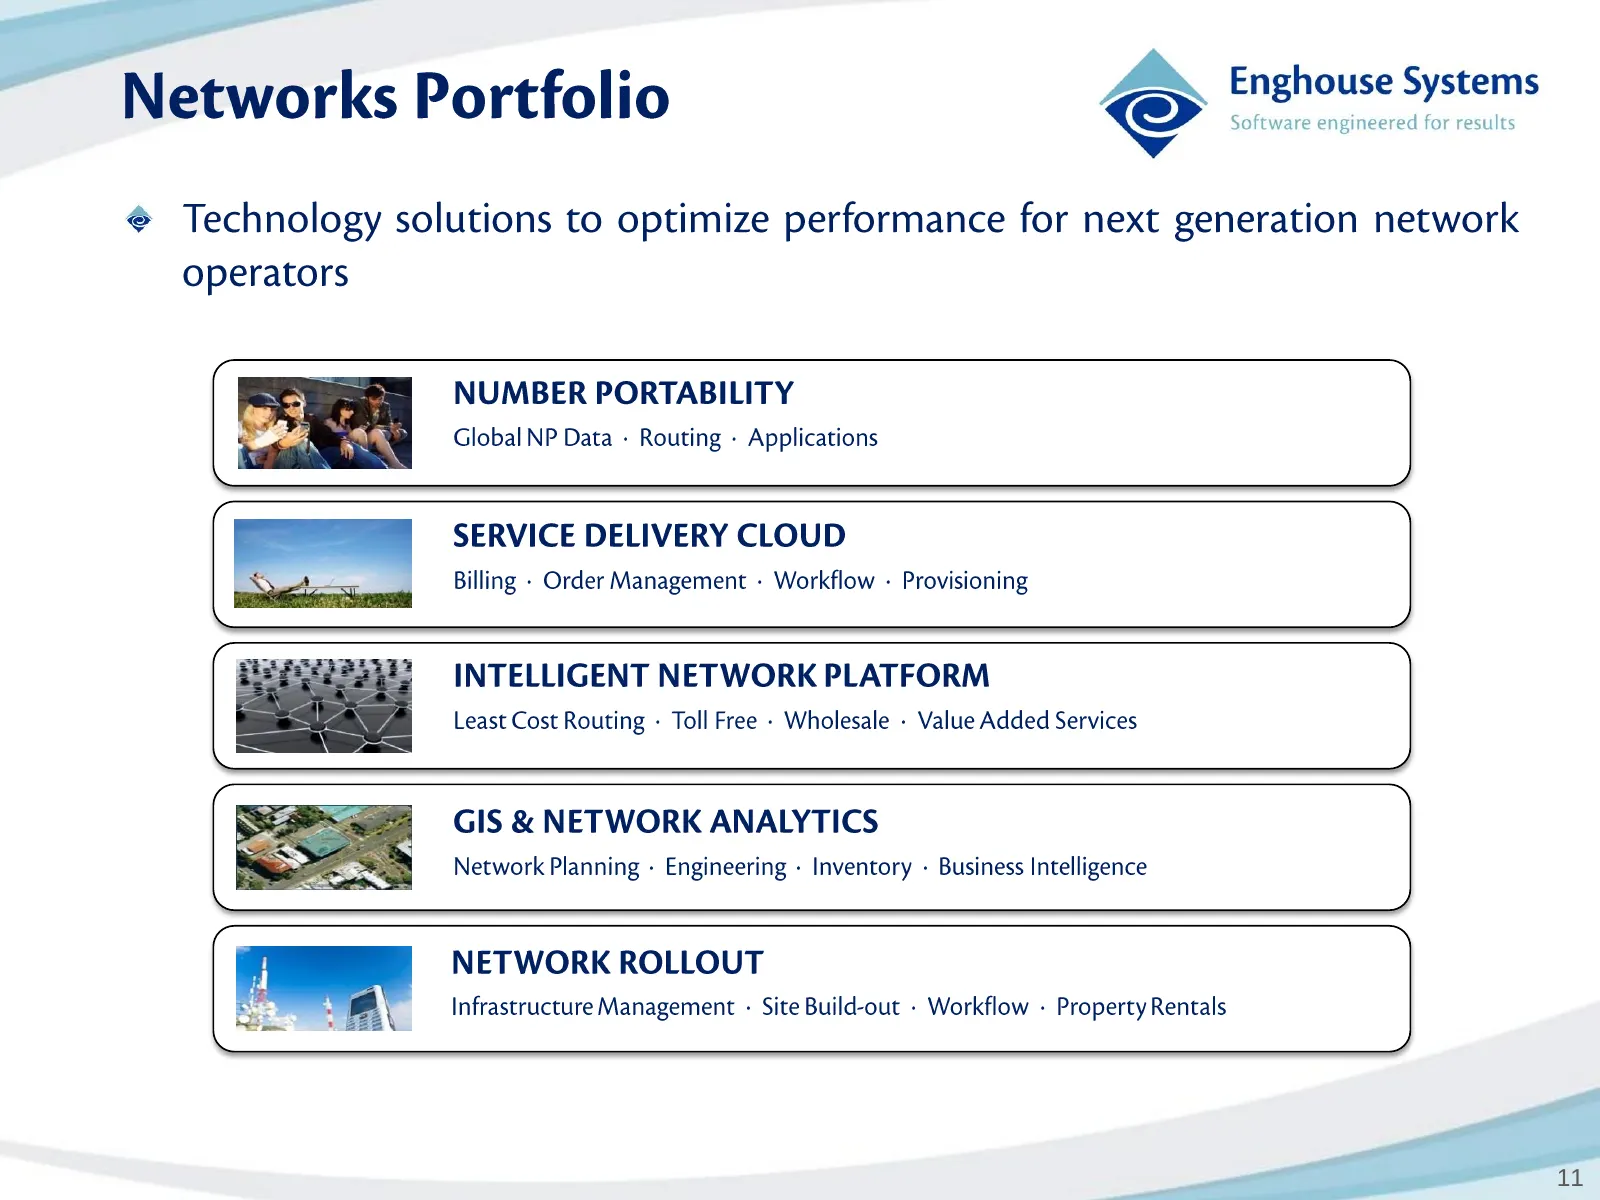
~ Networks Portfolio © Enghouse Systems Software engineered for results @ Technology solutions to optimize performance for next generation network operators NUMBER PORTABILITY Global NP Data - Routing - Applications S SERVICE DELIVERY CLOUD Billing - Order Management - Workflow - Provisioning J INTE
Slide 12: Annual Results
= 2& Enghouse Systems © Software engineered for results ANNUAL RESULTS
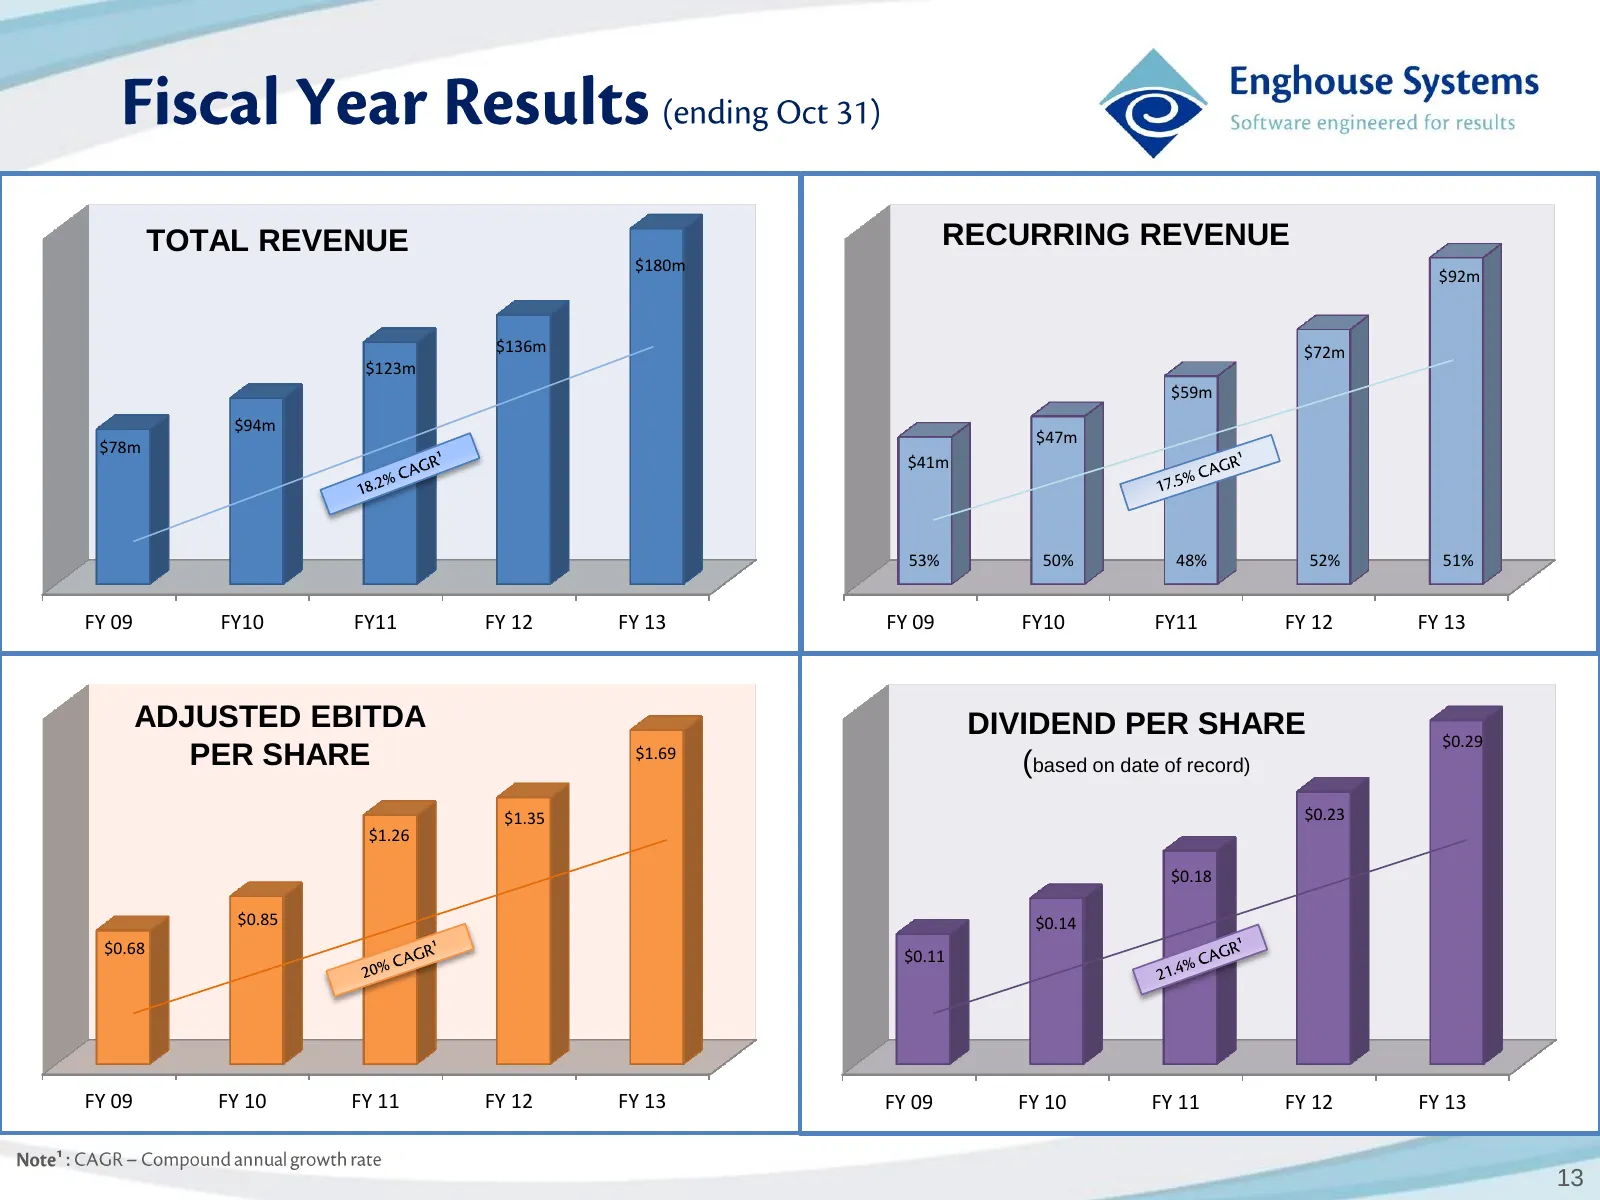
Slide 13: Revenue, Adjusted EBITDA and Dividend per Share FY09-FY13
TOTAL REVENUE RECURRING REVENUE $180m $92m $136m $72m $123m $59m $94m $47m $78m $41m 53% 50% 48% 52% 51% FY 09 FY10 FY11 FY 12 FY 13 FY 09 FY10 FY11 FY 12 FY 13 ADJUSTED EBITDA DIVIDEND PER SHARE $0.29 PER SHARE $1.69 (based on date of record) $1.35 $0.23 $1.26 $0.18 $0.85 $0.14 $0.68 $0.11 FY 09 FY
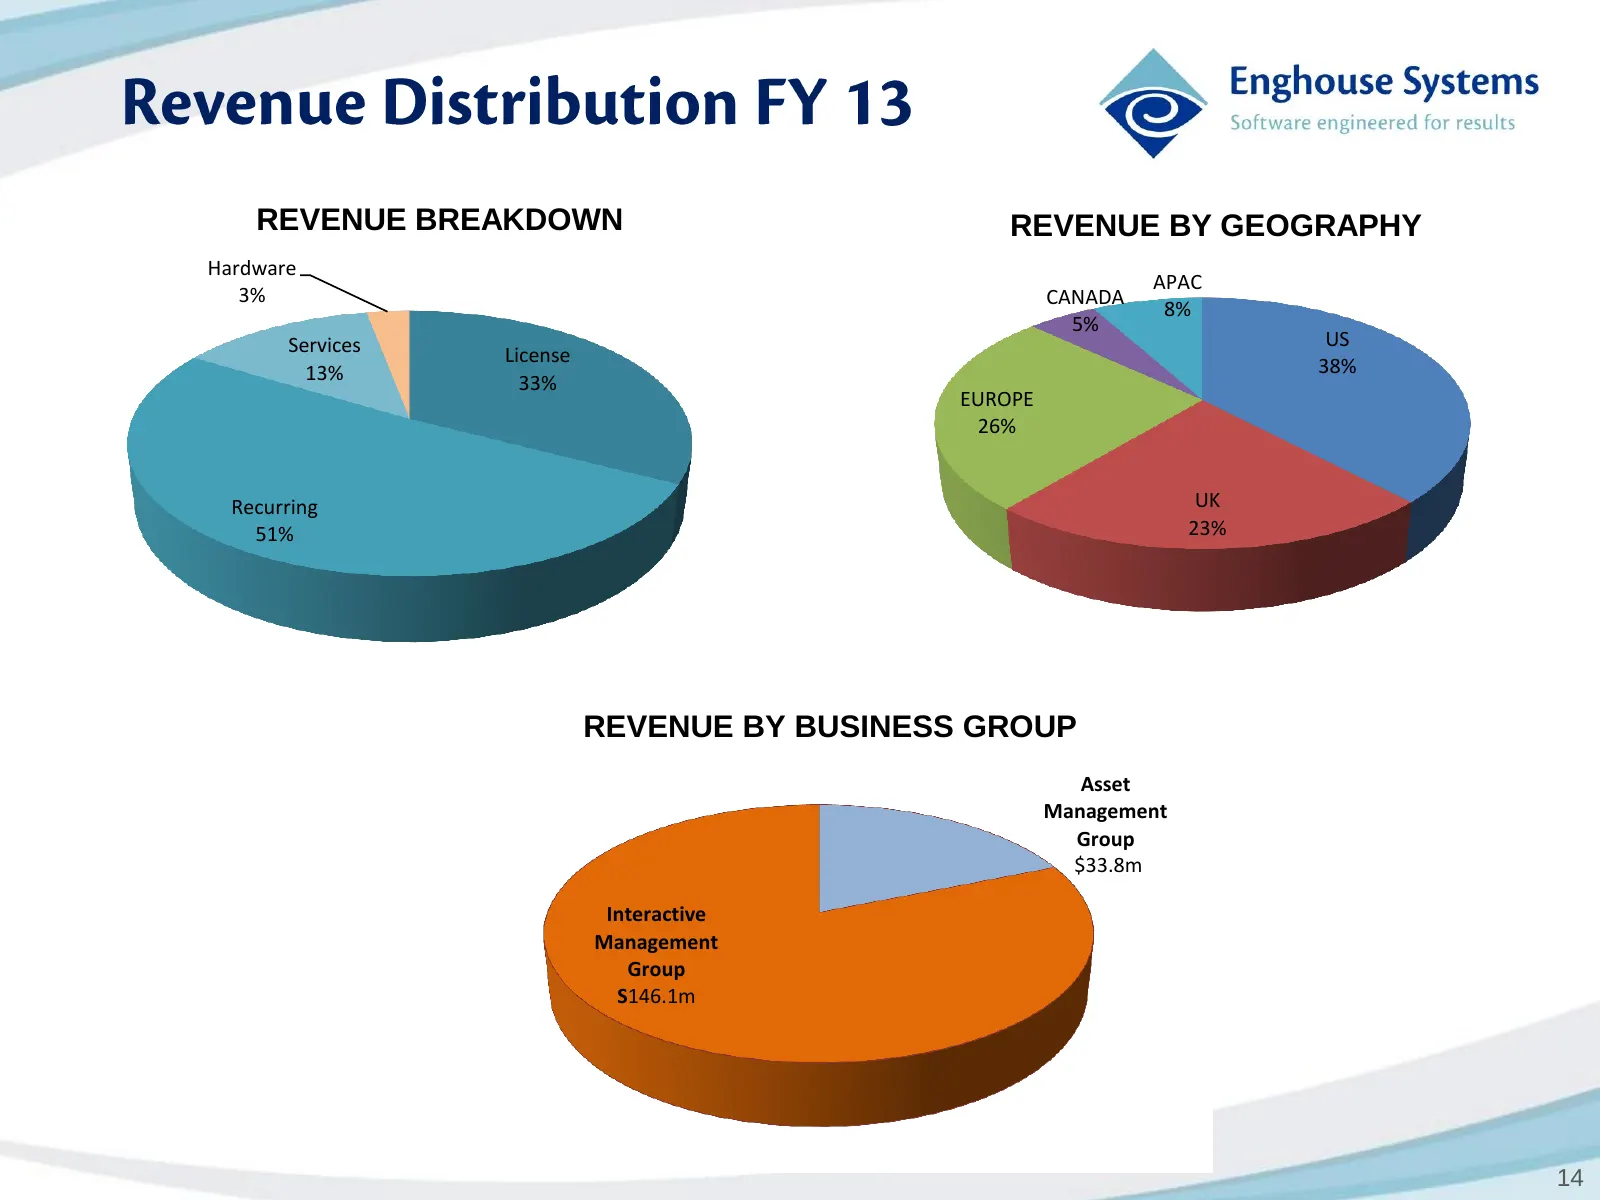
Slide 14: Revenue Breakdown by Geography and Business Group
REVENUE BREAKDOWN REVENUE BY GEOGRAPHY Hardware APAC 3% CANADA 8% 5% Services US License 38% 13% 33% EUROPE 26% Recurring UK 51% 23% REVENUE BY BUSINESS GROUP Asset Management Group $33.8m Interactive Management Group S146.1m 14
Slide 15: 6 Months Results - FY 14
= aX Enghouse Systems © Software engineered for results 6 MONTHS RESULTS - FY 14
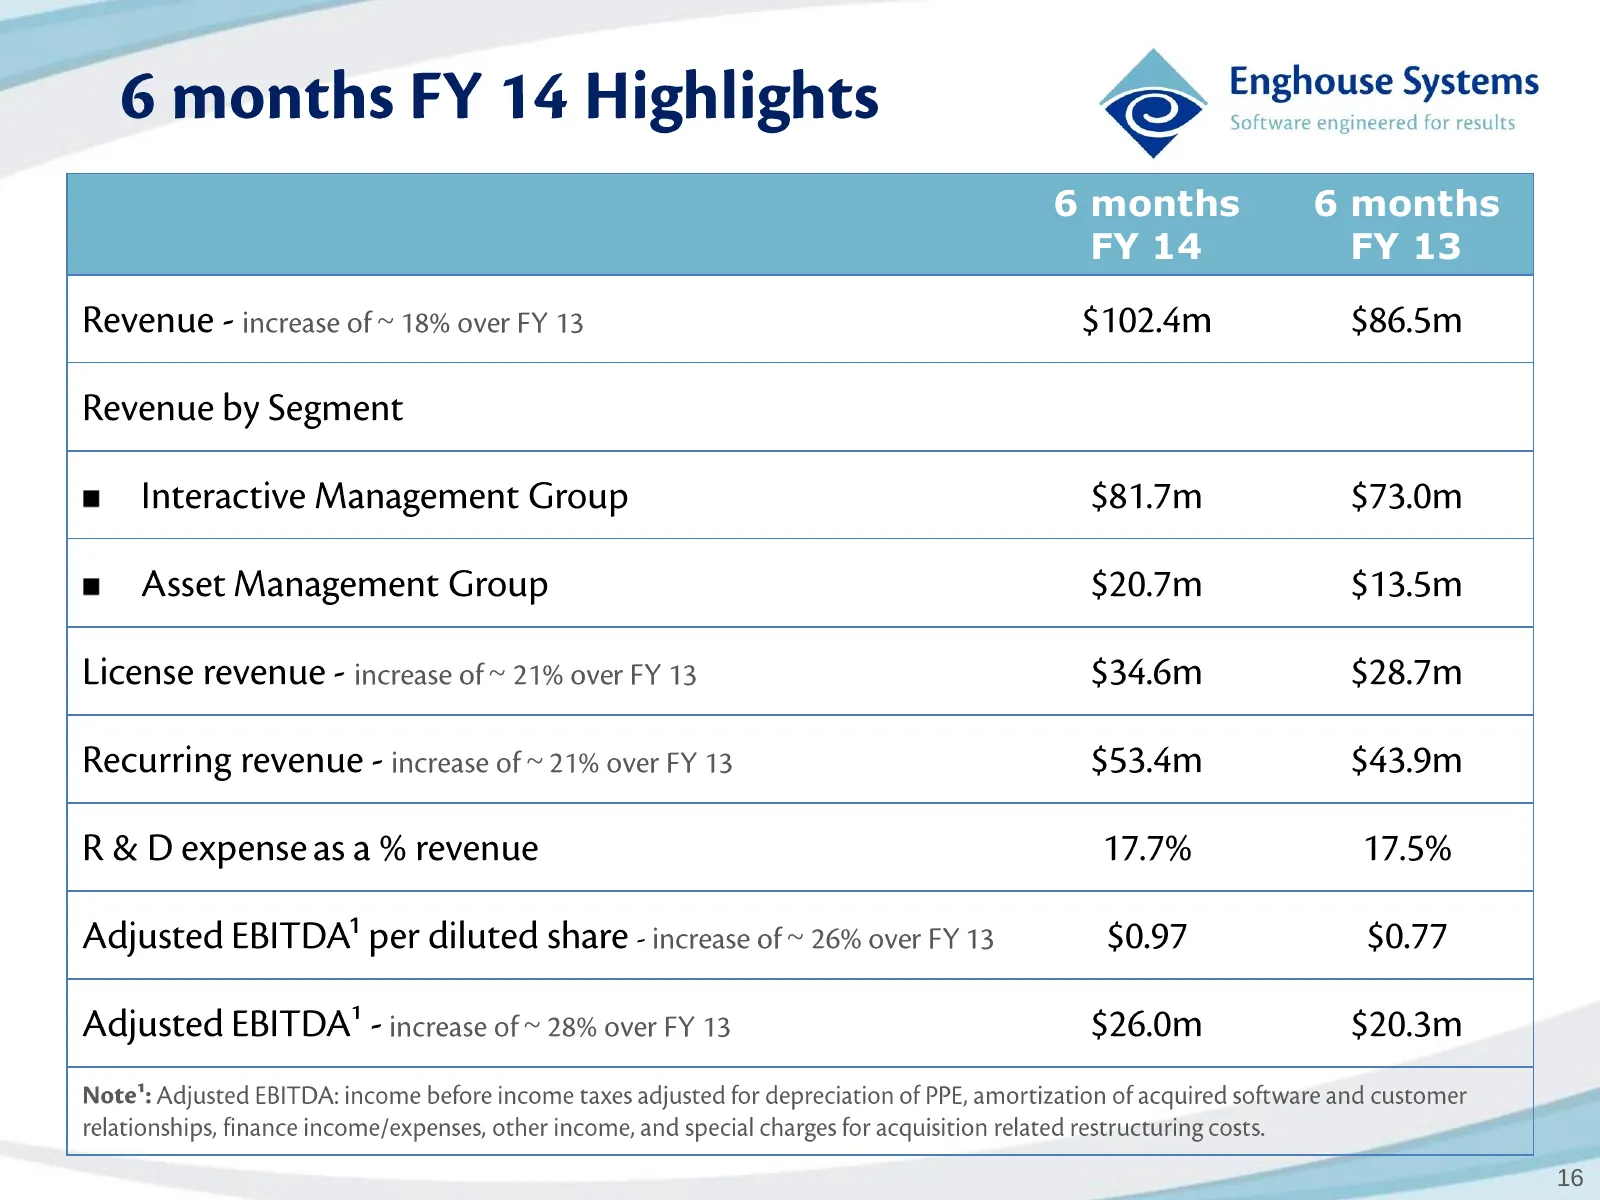
Slide 16: 6 Months FY 14 Highlights
6 months 6 months FY 14 FY 13 ~ ~ ~ ¹ ~ ~ 16
Slide 17: 6 Months FY 14 Highlights
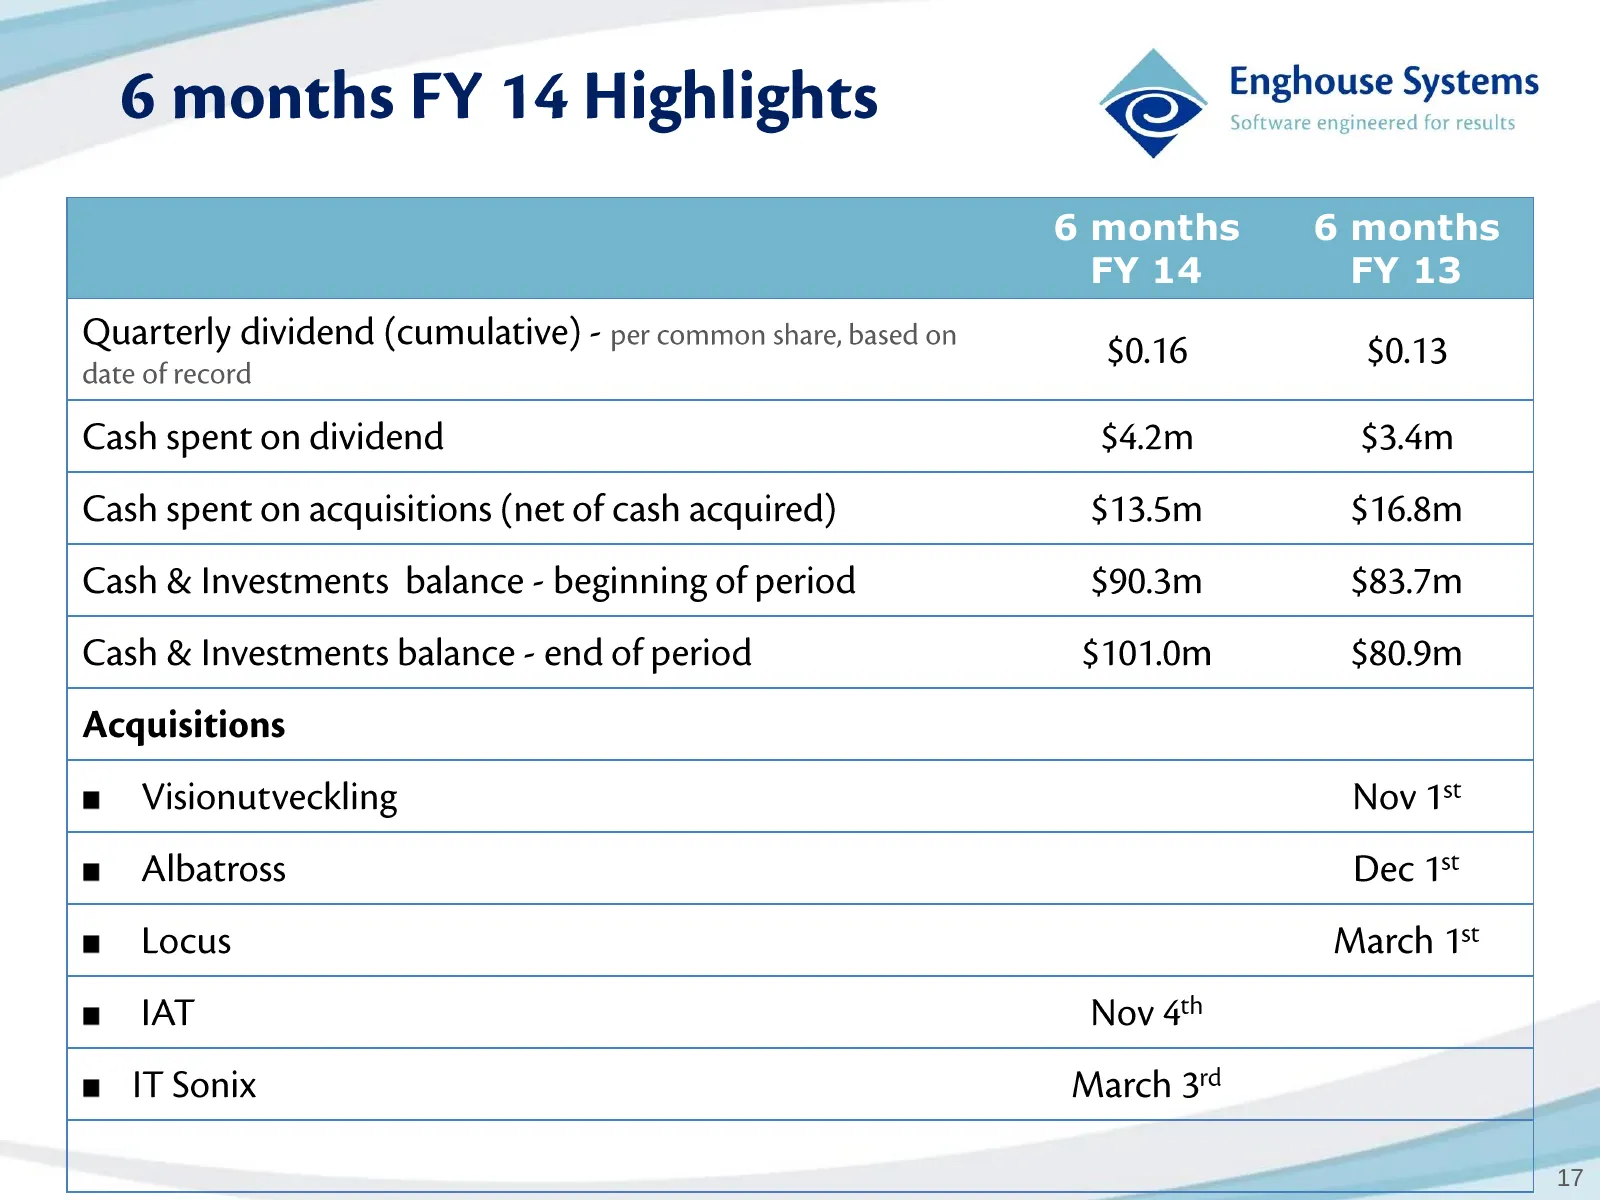
- 6 months FY 14 Highlights oe pineal omni 6 months 6 months FY 14 FY 13 Quarterly dividend (cumulative) - per common share, based on $0.16 $0.13 date of record Cash spent on dividend $4.2m $3.4m Cash spent on acquisitions (net of cash acquired) $13.5m $16.8m Cash & Investments balance - beginning o
Slide 18: Quarterly Results - Q2 FY 14
Enghouse Systems © Software engineered for results QUARTERLY RESULTS - Q2 FY 14
Slide 19: Q2 FY14 Highlights
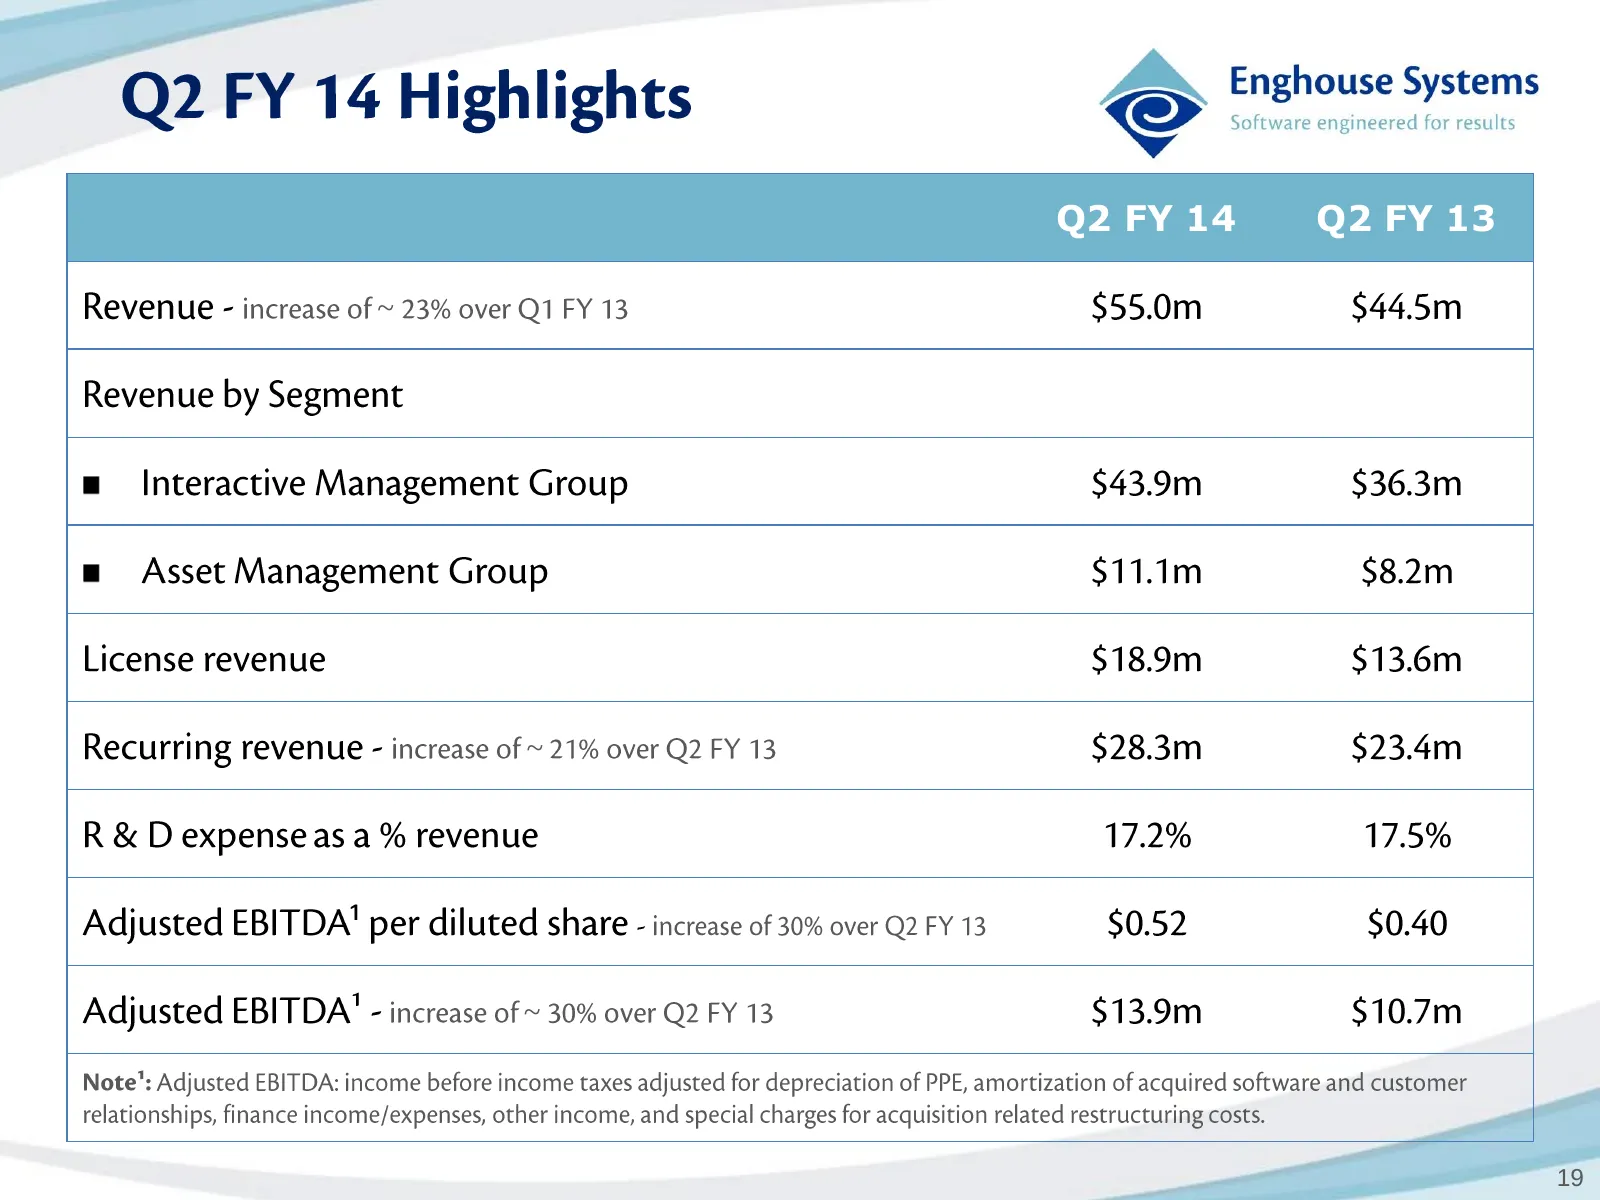
Qa FY 14 Highlights @ inshowse stems Q2FY14 Q2FY13 Revenue - increase of ~ 23% over Q1 FY 13 $55.0m $44.5m Revenue by Segment m Interactive Management Group $43.9m $36.3m m Asset Management Group $11.1m $8.2m License revenue $18.9m $13.6m Recurring revenue - increase of ~ 21% over Q2 FY 13 $28.3m $2
Slide 20: Q2 FY14 Highlights
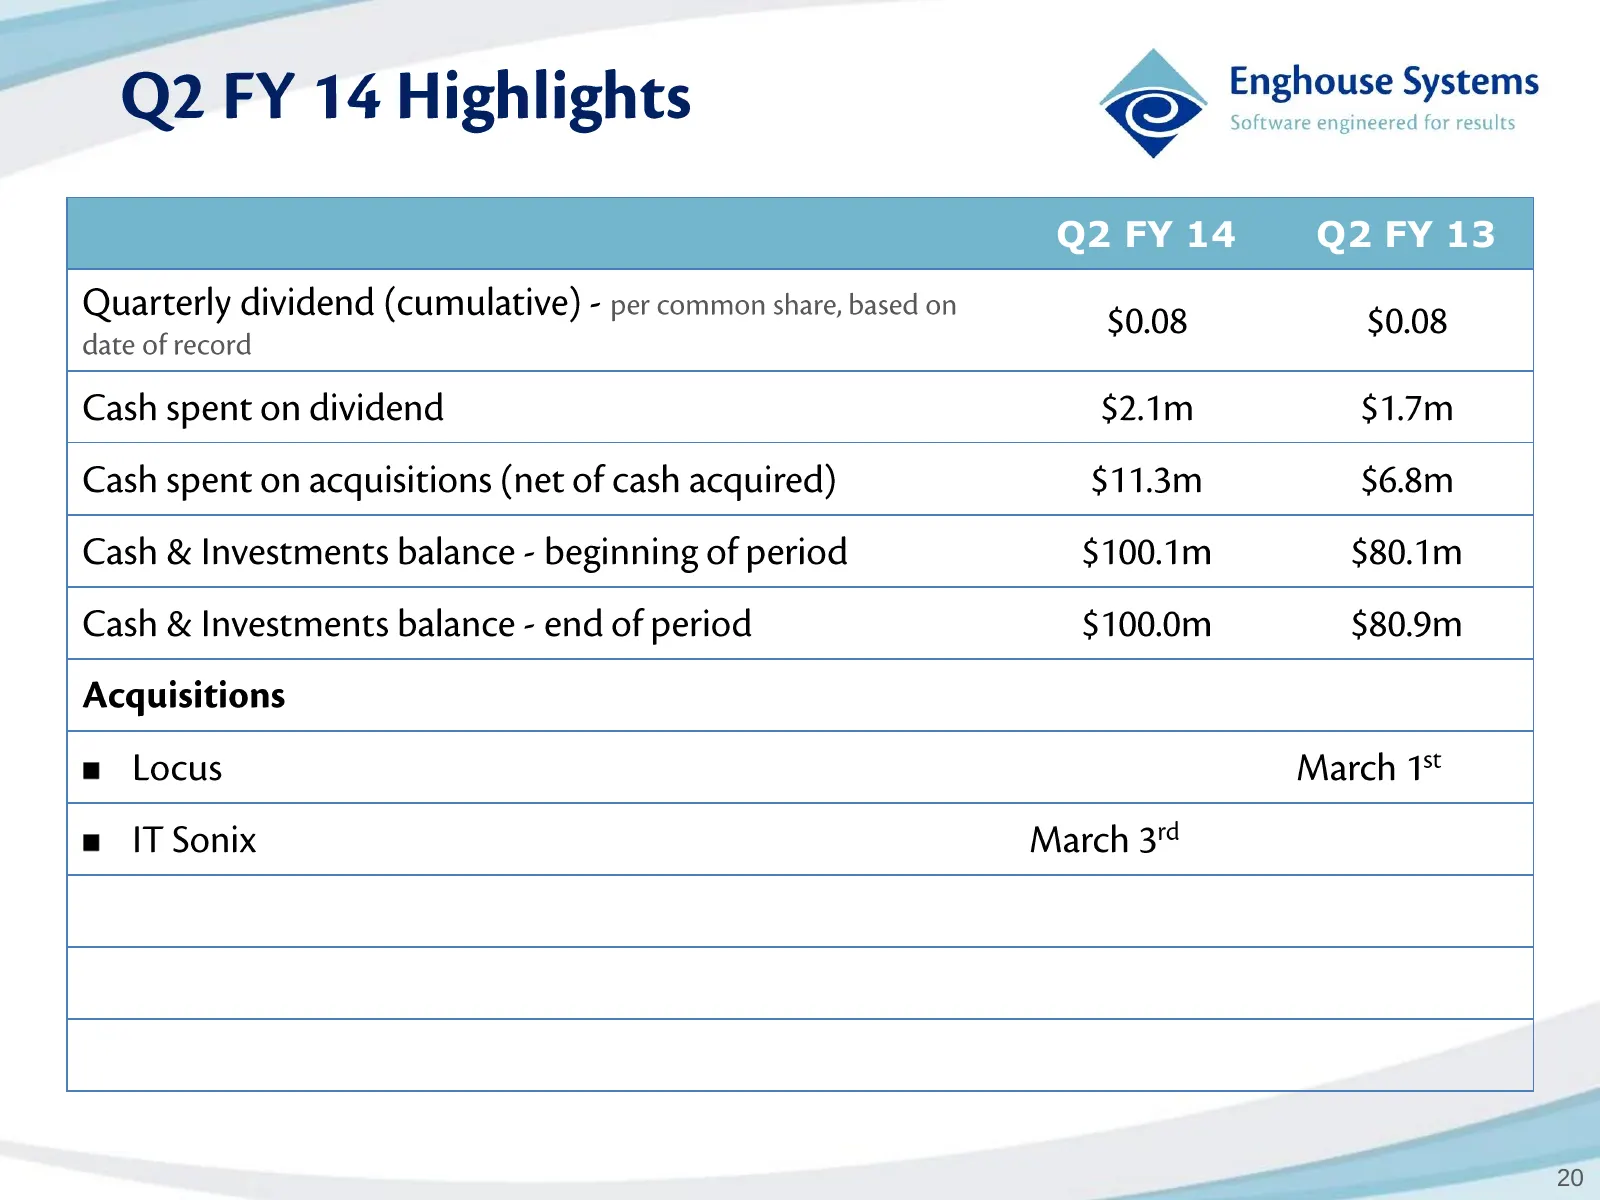
~~ Qa FY 14 Highlights @ inshowse stems Q2FY14 Q2FY13 Quarterly dividend (cumulative) - per common share, based on $0.08 $0.08 date of record Cash spent on dividend $2.1m $1.7m Cash spent on acquisitions (net of cash acquired) $11.3m $6.8m Cash & Investments balance - beginning of period $100.1m $80
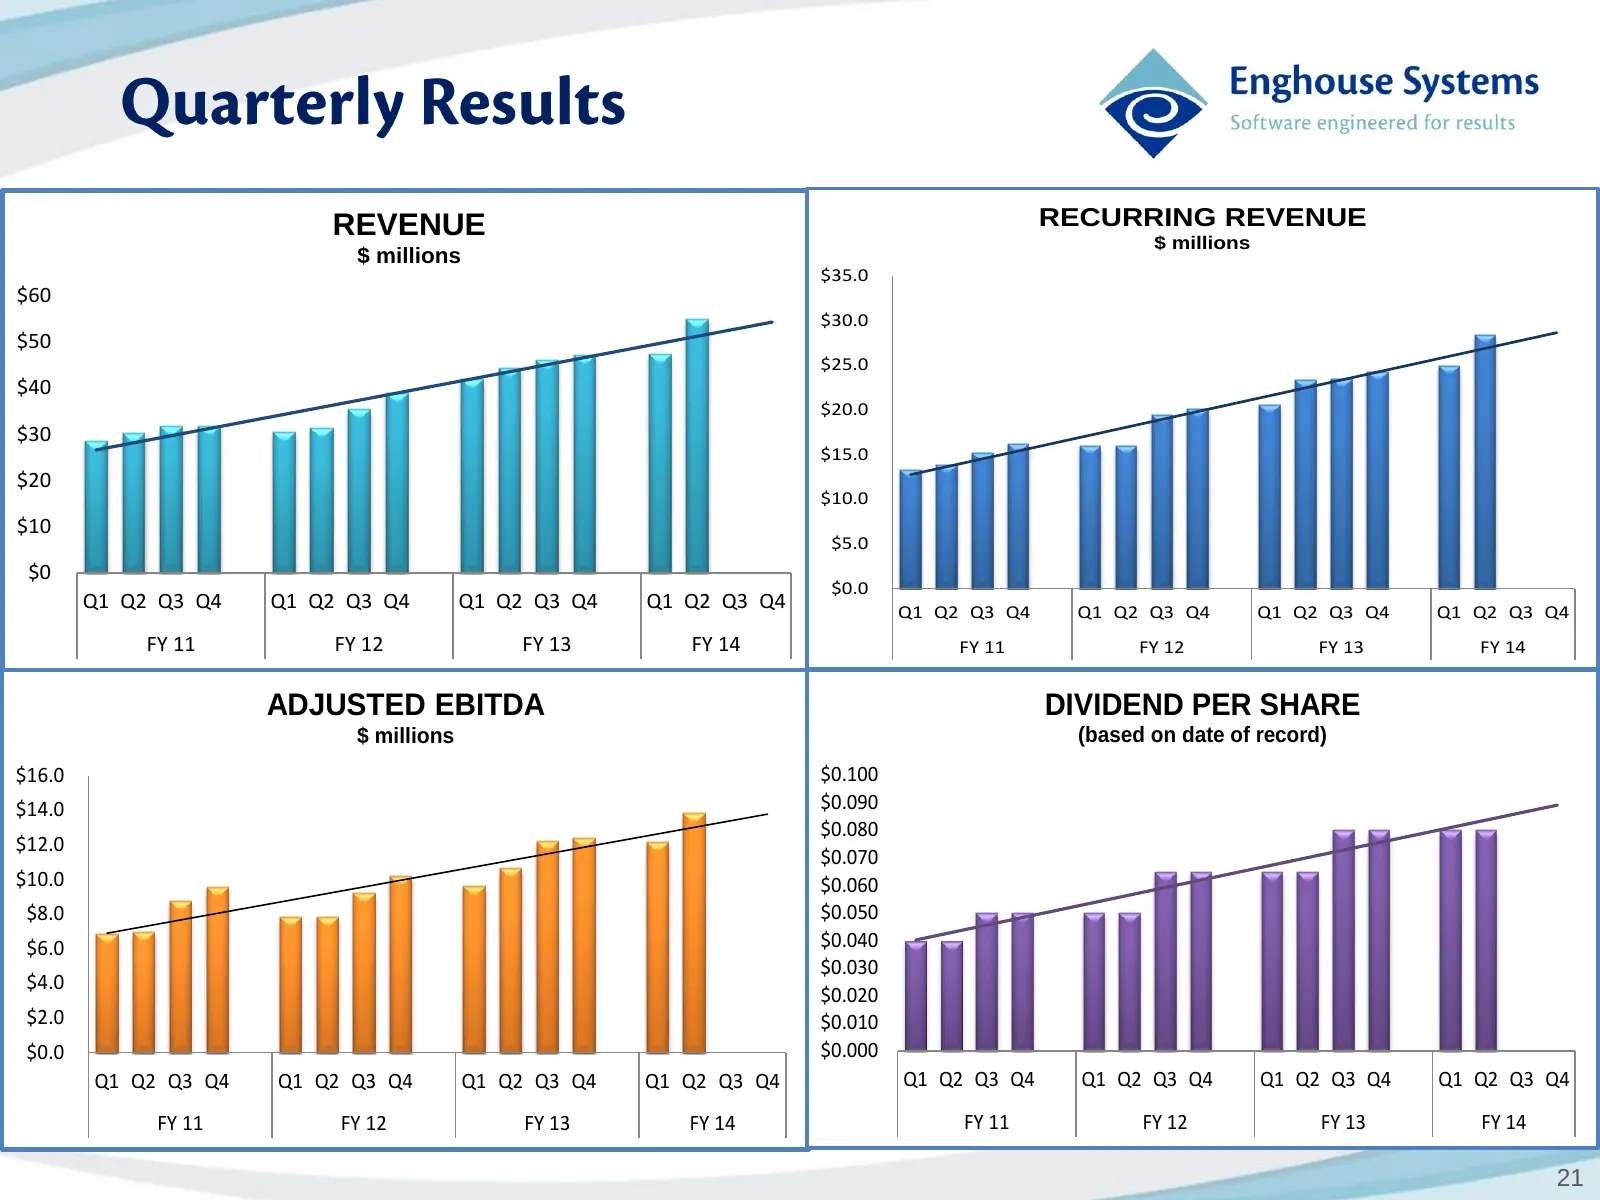
Slide 21: Quarterly Revenue, Adjusted EBITDA and Dividend per Share
REVENUE RECURRING REVENUE $ millions $ millions $35.0 $60 $30.0 $50 $25.0 $40 $20.0 $30 $15.0 $20 $10.0 $10 $5.0 $0 $0.0 Q1 Q2 Q3 Q4 Q1 Q2 Q3 Q4 Q1 Q2 Q3 Q4 Q1 Q2 Q3 Q4 Q1 Q2 Q3 Q4 Q1 Q2 Q3 Q4 Q1 Q2 Q3 Q4 Q1 Q2 Q3 Q4 FY 11 FY 12 FY 13 FY 14 FY 11 FY 12 FY 13 FY 14 ADJUSTED EBITDA DIVIDEND PER SHARE
Slide 22: Acquisition Strategy
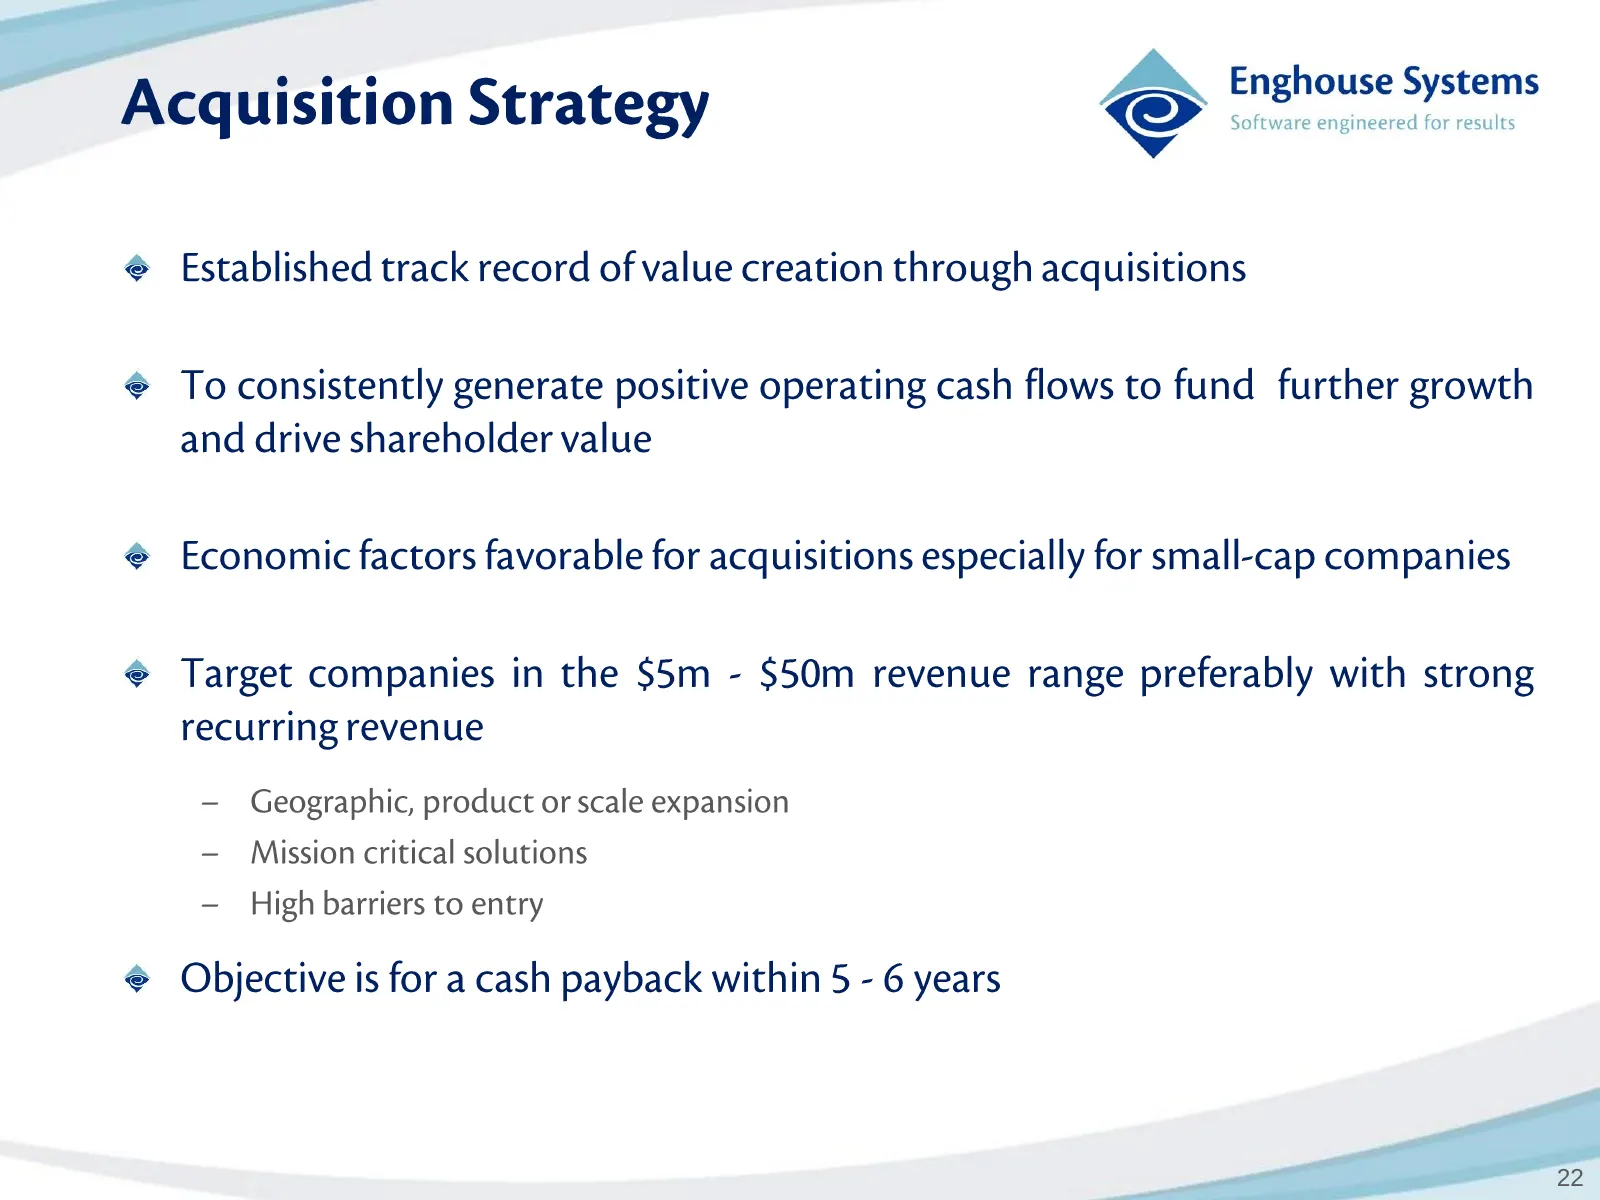
Software engineered for results Acquisition Strategy cos Enghouse Systems @ Established track record of value creation through acquisitions @ To consistently generate positive operating cash flows to fund further growth and drive shareholder value @ Economic factors favorable for acquisitions especi
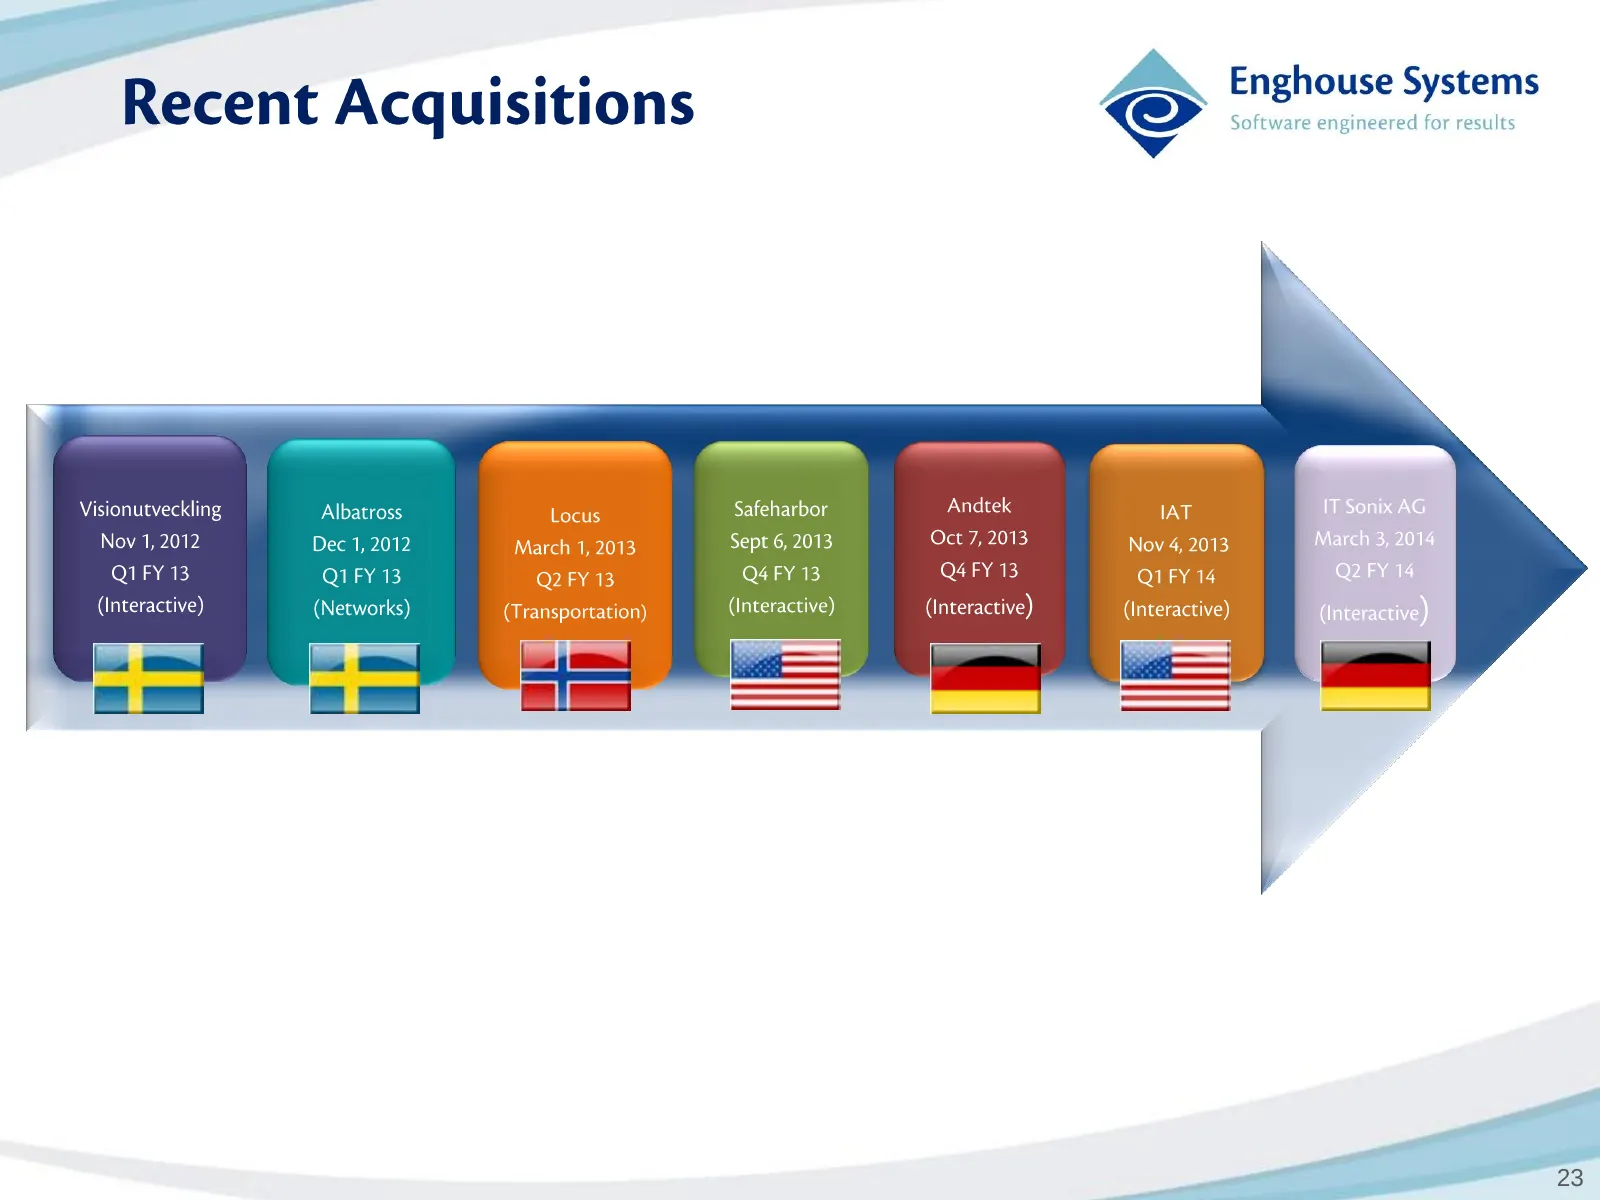
Slide 23: Recent Acquisitions
SS Enghouse Systems Recent Acquisitions © Seaeiioanginea RTS Visionutveckling Albatross Loans Safeharbor Andtek IAT Nov 1, 2012 Dec 1, 2012 March 1, 2013 Sept 6, 2013 Oct 7, 2013 Nov 4, 2013 QUFY 13 QUFY 13 Q2 FY 13, Q4FY 13 Q4 FY 13 QUFY 14 (Interactive) (Networks) (Transportation) (Interactive) (I
Slide 24: Thank You!
Enghouse Systems © Software engineered for results THANK You!
Source: Internet Archive copy of enghouse.com
More decks from Enghouse Systems Limited
 Q3 FY2026 Earnings Presentation16 slides · Sep 11, 2026
 Q1 2026 Earnings Presentation16 slides · Mar 13, 2026
 Q1 2025 Earnings Presentation16 slides · Mar 11, 2025
 Q3 2024 Earnings Presentation16 slides · Sep 6, 2024
 Q1 2024 Earnings Presentation15 slides · Mar 14, 2024
 Q4 FY2023 Earnings Presentation15 slides · Dec 15, 2023