Petrus Resources Ltd. · TSX:PRQ
Petrus Resources — Investor Presentation (March 2016)
21 slides from Petrus Resources's investor presentation, Mar 23, 2016
Slide 1: Corporate Update
TSX: PRQ FOCUS ON MAXIMUM RETURN… BUILD Corporate Update HIGH QUALITY ASSETS… ACHIEVE March 23, 2016 GROWTH WITH SUSTAINABILITY 1
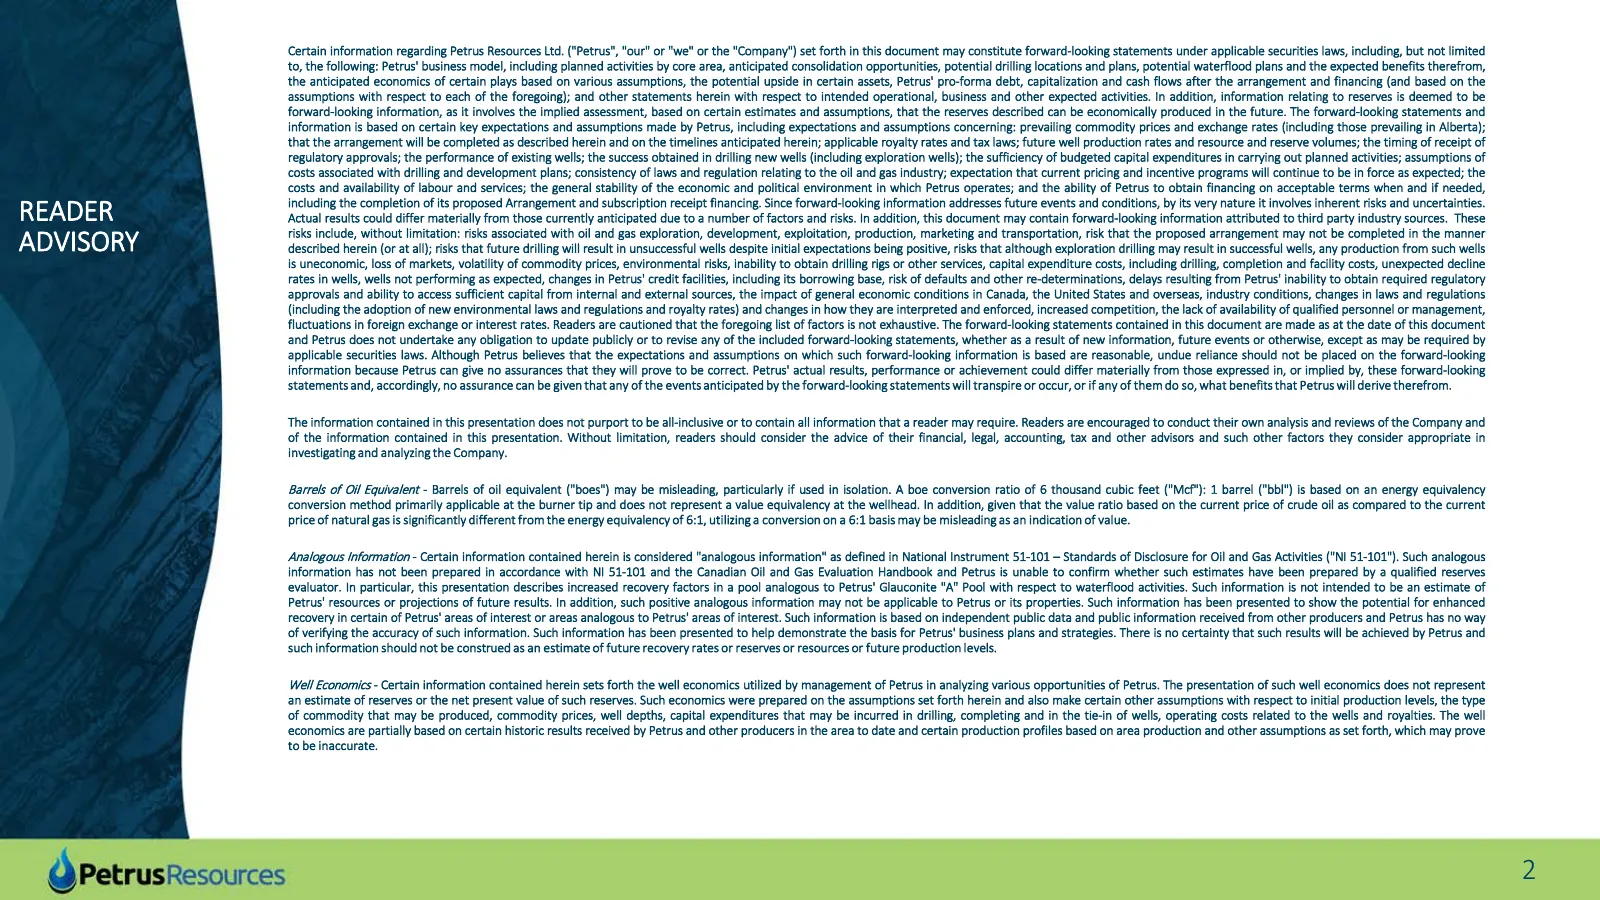
Slide 2: Reader Advisory
Certain information regarding Petrus Resources Ltd. ("Petrus", "our" or "we" or the "Company") set forth in this document may constitute forward-looking statements under applicable securities laws, including, but not limited to, the following: Petrus' business model, including planned activities by
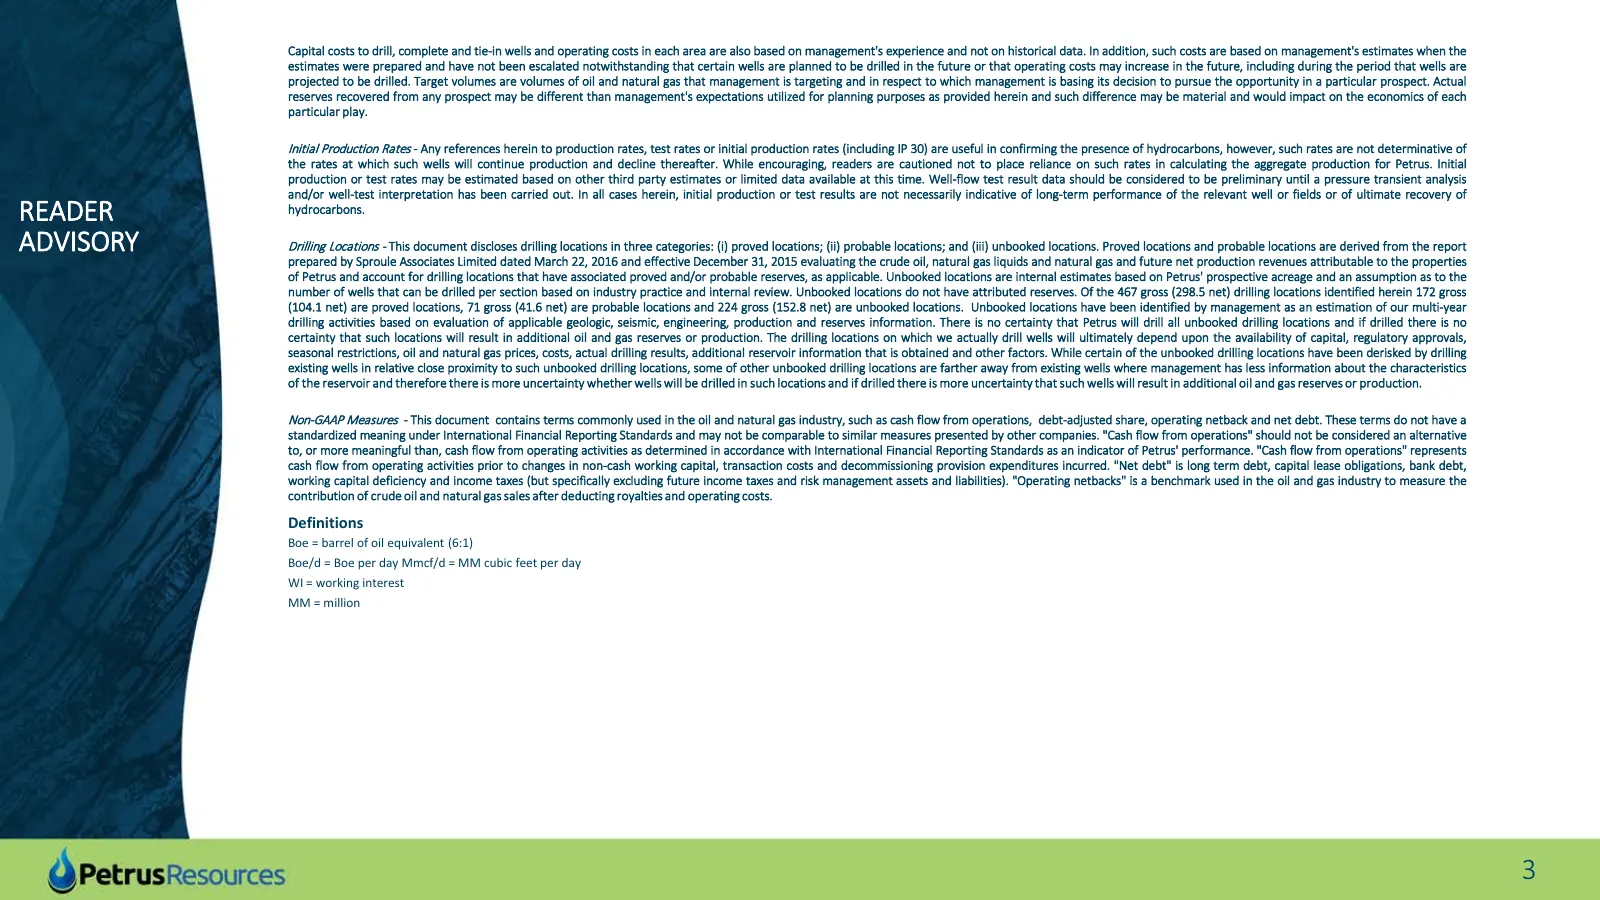
Slide 3: Reader Advisory
Capital costs to drill, complete and tie-in wells and operating costs in each area are also based on management's experience and not on historical data. In addition, such costs are based on management's estimates when the estimates were prepared and have not been escalated notwithstanding that certa
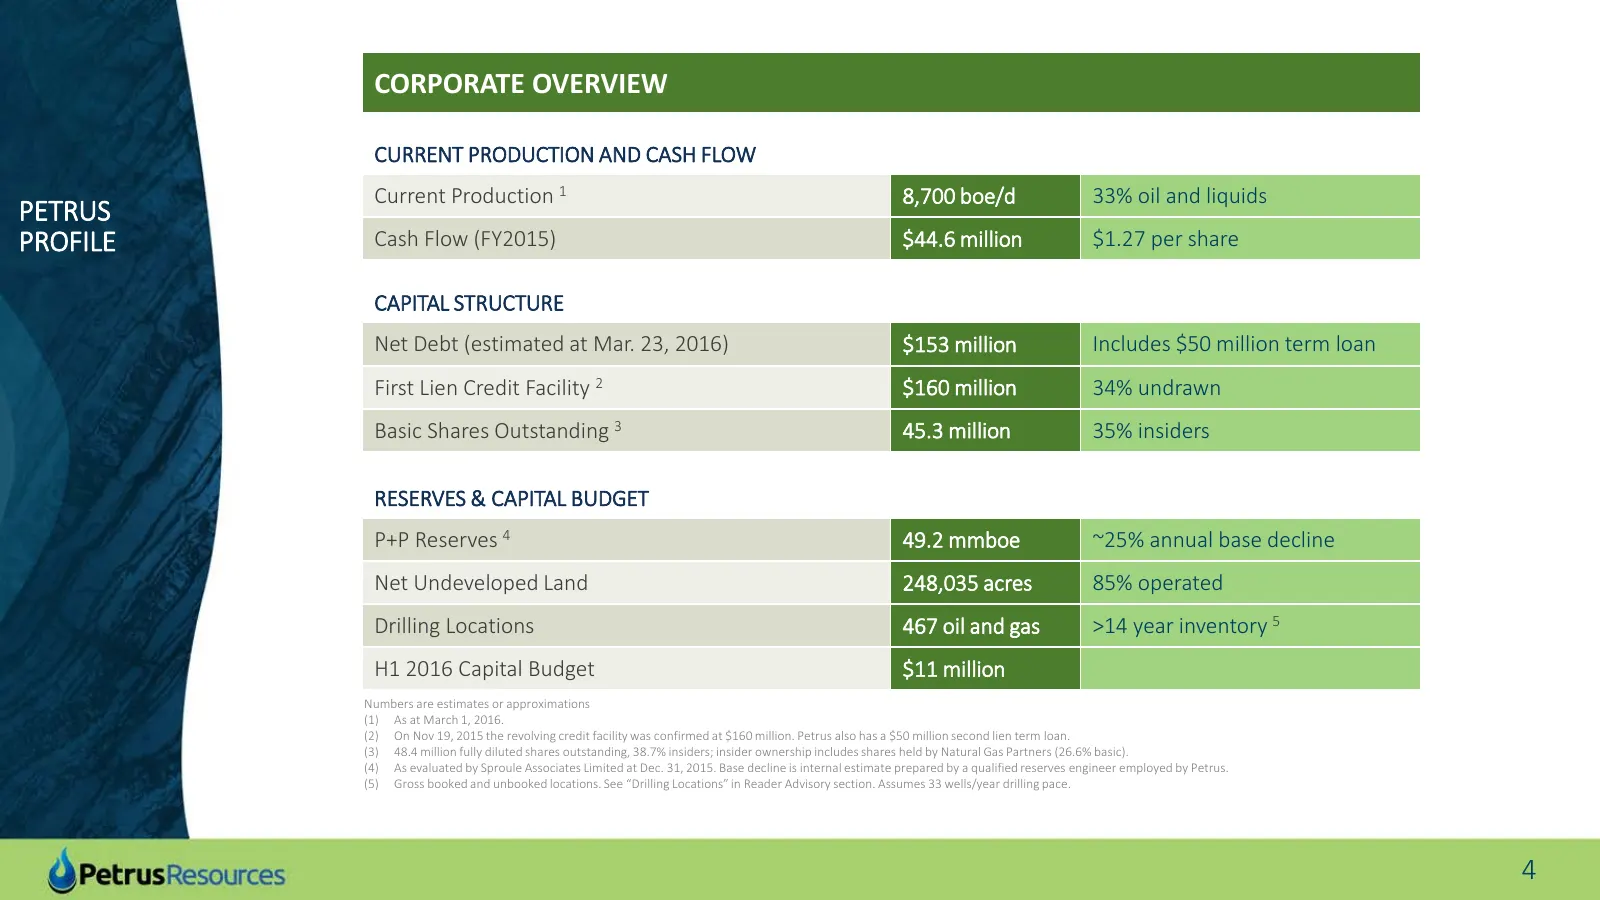
Slide 4: Corporate Overview: Petrus Profile
CORPORATE OVERVIEW CURRENT PRODUCTION AND CASH FLOW Current Production 1 8,700 boe/d 33% oil and liquids PETRUS PROFILE Cash Flow (FY2015) $44.6 million $1.27 per share CAPITAL STRUCTURE Net Debt (estimated at Mar. 23, 2016) $153 million Includes $50 million term loan First Lien Credit Facility 2 $1
Slide 5: Strong Hedge Position
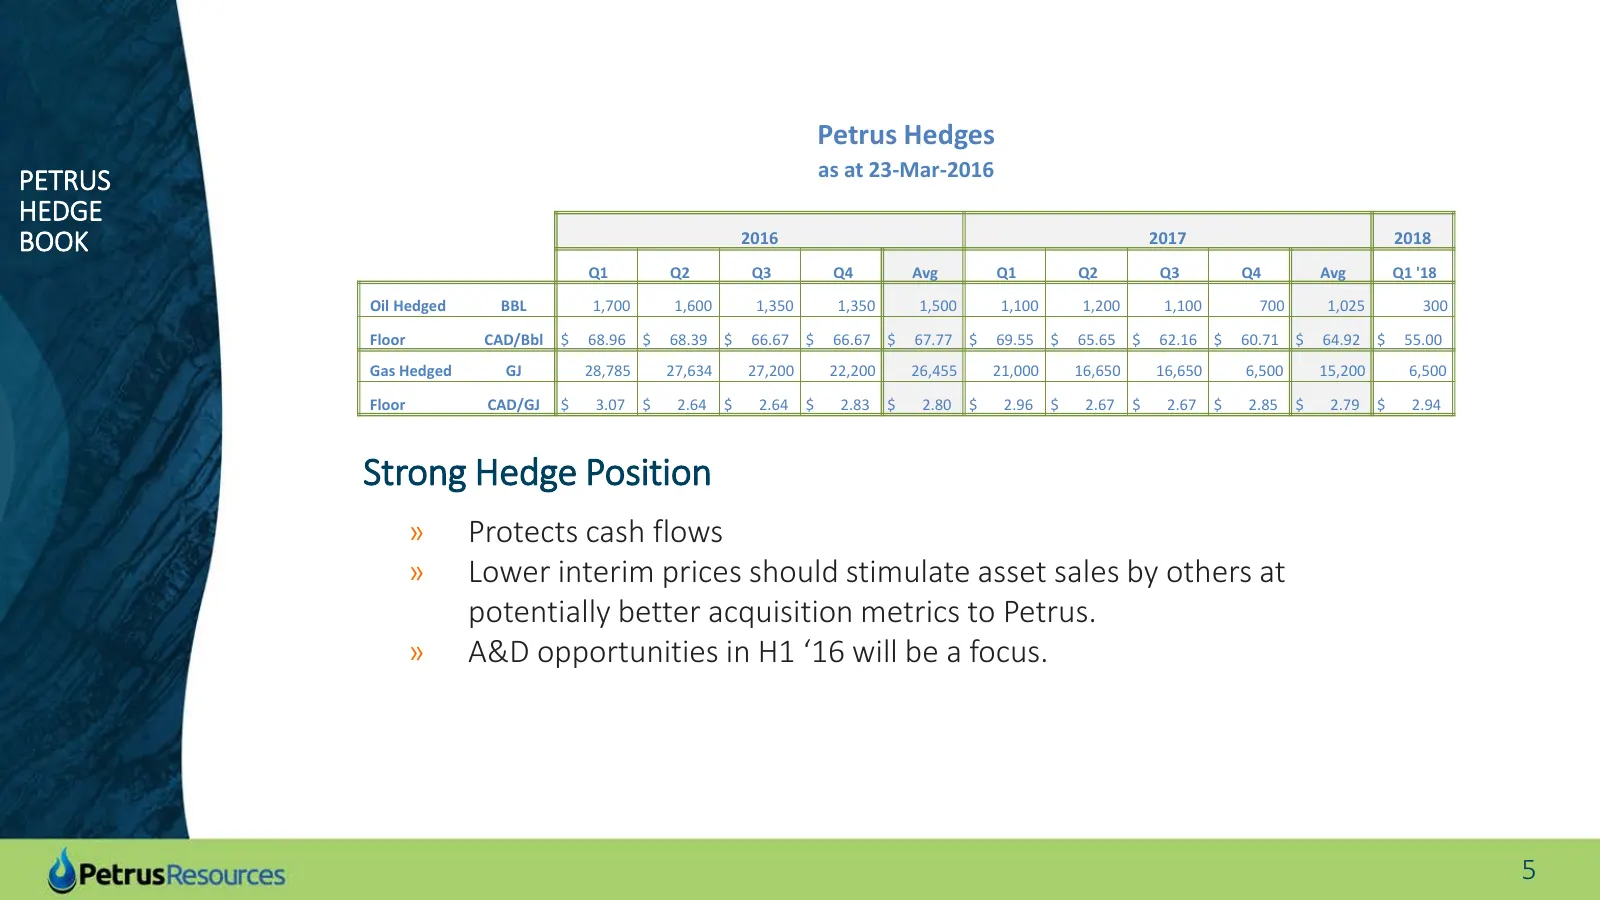
Petrus Hedges as at 23-Mar-2016 PETRUS HEDGE BOOK 2016 2017 2018 Q1 Q2 Q3 Q4 Avg Q1 Q2 Q3 Q4 Avg Q1 '18 Oil Hedged BBL 1,700 1,600 1,350 1,350 1,500 1,100 1,200 1,100 700 1,025 300 Floor CAD/Bbl $ 68.96 $ 68.39 $ 66.67 $ 66.67 $ 67.77 $ 69.55 $ 65.65 $ 62.16 $ 60.71 $ 64.92 $ 55.00 Gas Hedged GJ 28,
Slide 6: The Petrus Model: Growth with Sustainability
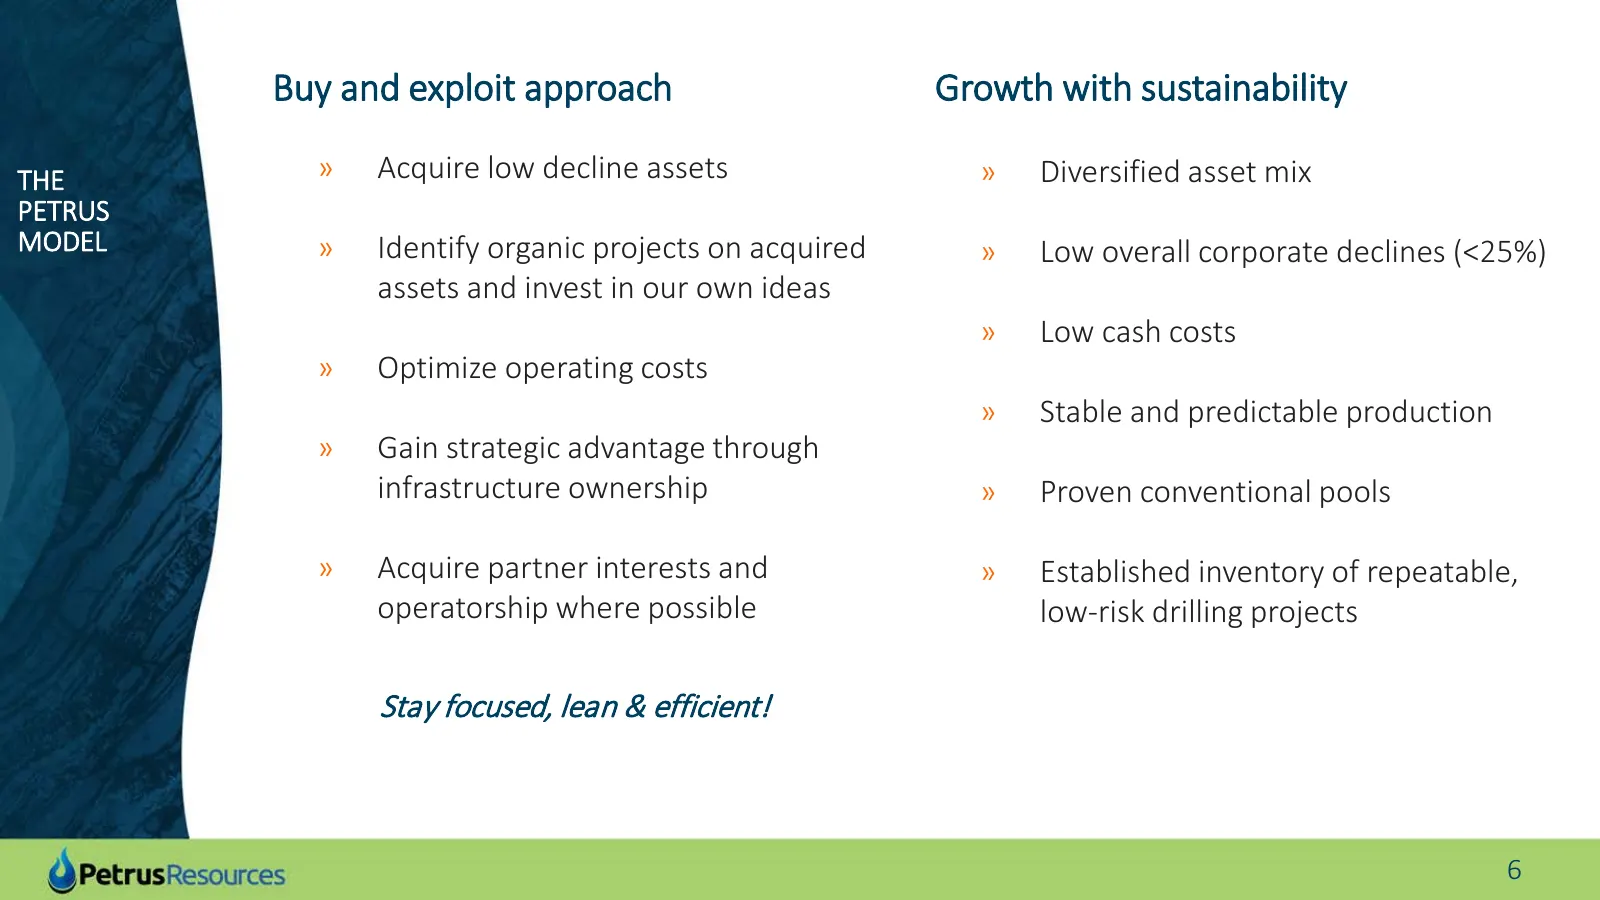
Buy and exploit approach Growth with sustainability THE » Acquire low decline assets » Diversified asset mix PETRUS MODEL » Identify organic projects on acquired » Low overall corporate declines (<25%) assets and invest in our own ideas » Low cash costs » Optimize operating costs » Stable and predic
Slide 7: Production and Cash Flow Growth
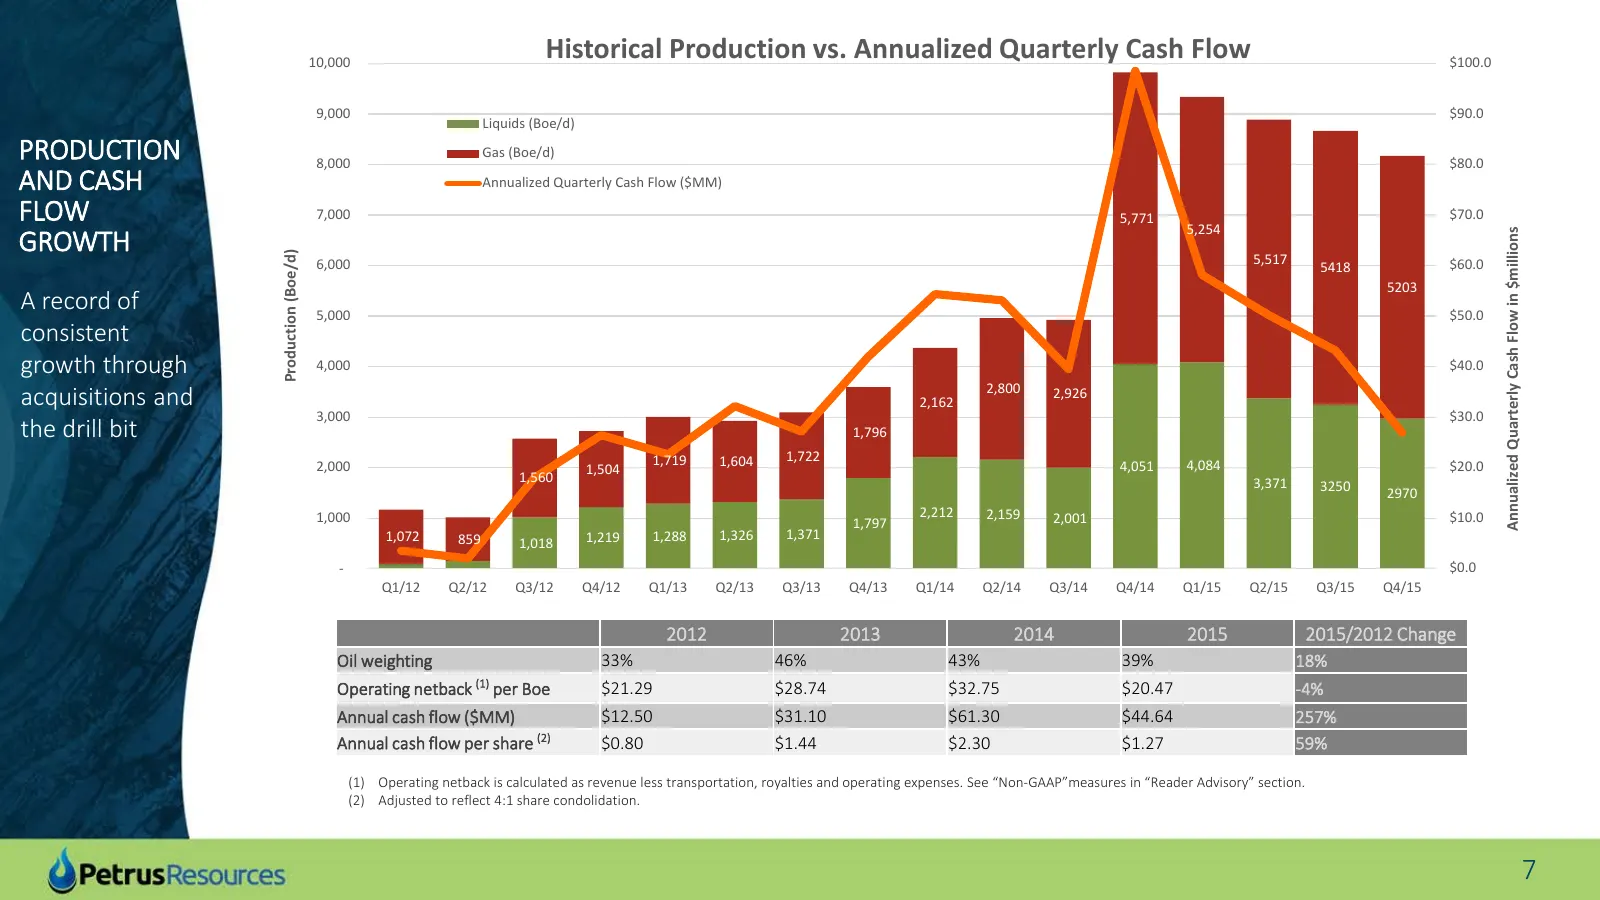
10,000 Historical Production vs. Annualized Quarterly Cash Flow $100.0 9,000 $90.0 Liquids (Boe/d) PRODUCTION 8,000 Gas (Boe/d) $80.0 AND CASH Annualized Quarterly Cash Flow ($MM) FLOW 7,000 5,771 5,254 $70.0 GROWTH Annualized Quarterly Cash Flow in $millions Production (Boe/d) 6,000 5,517 $60.0 541
Slide 8: Petrus Reserves Growth
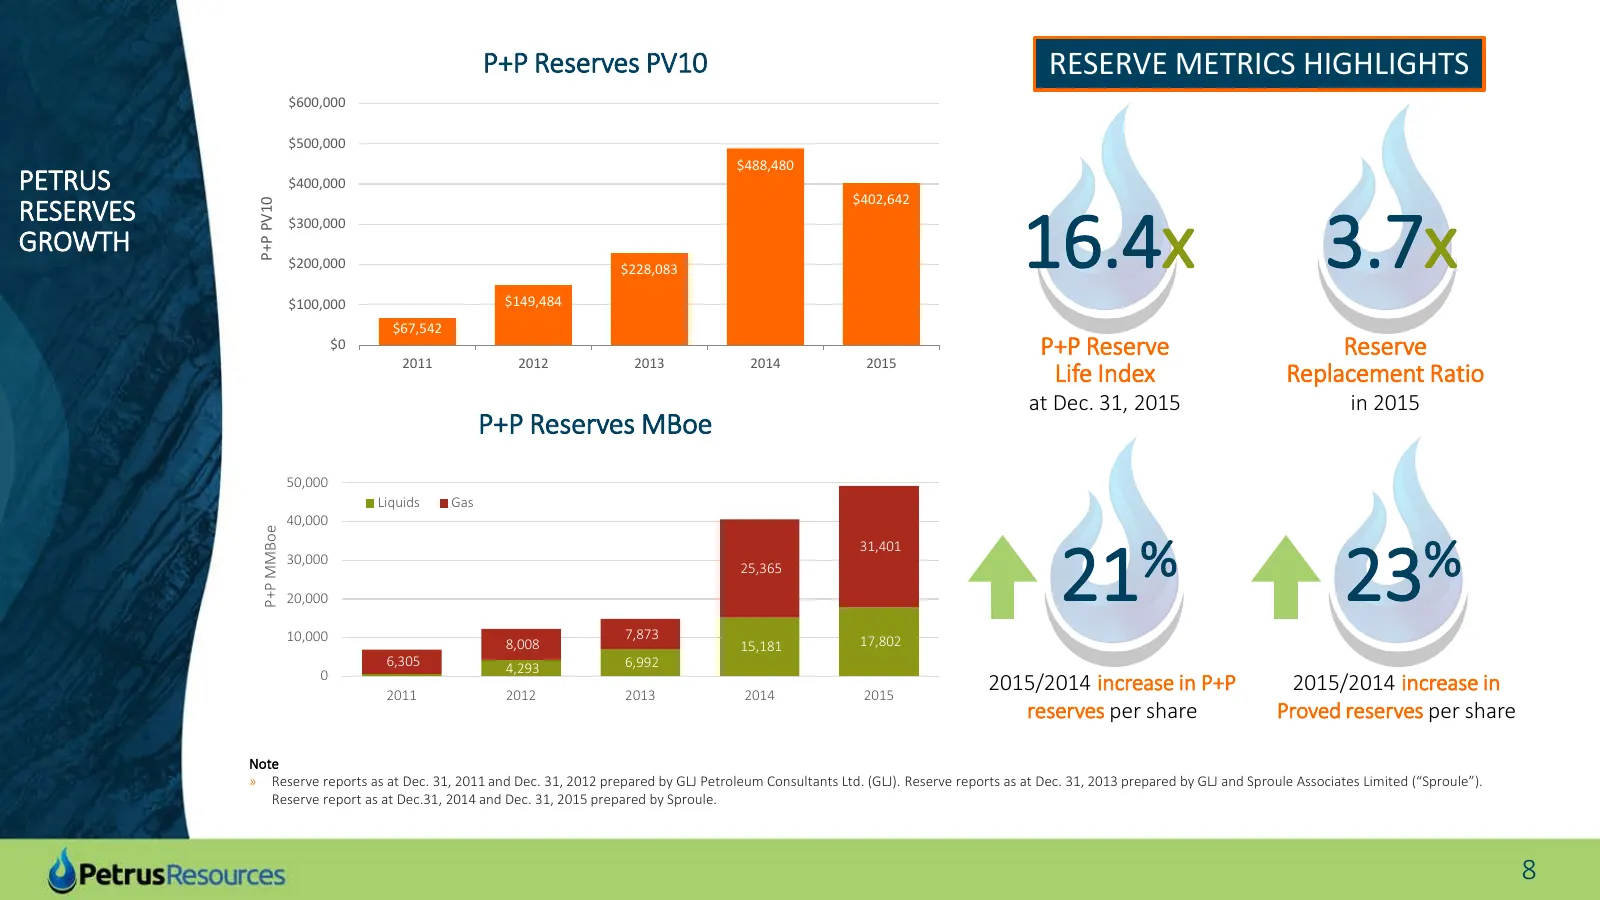
P+P Reserves PV10 RESERVE METRICS HIGHLIGHTS $600,000 $500,000 $488,480 PETRUS $400,000 $402,642 16.4x 3.7x RESERVES P+P PV10 $300,000 GROWTH $200,000 $228,083 $100,000 $149,484 $67,542 $0 P+P Reserve Reserve 2011 2012 2013 2014 2015 Life Index Replacement Ratio at Dec. 31, 2015 in 2015 P+P Reserves
Slide 9: Diversified Low-Decline Assets
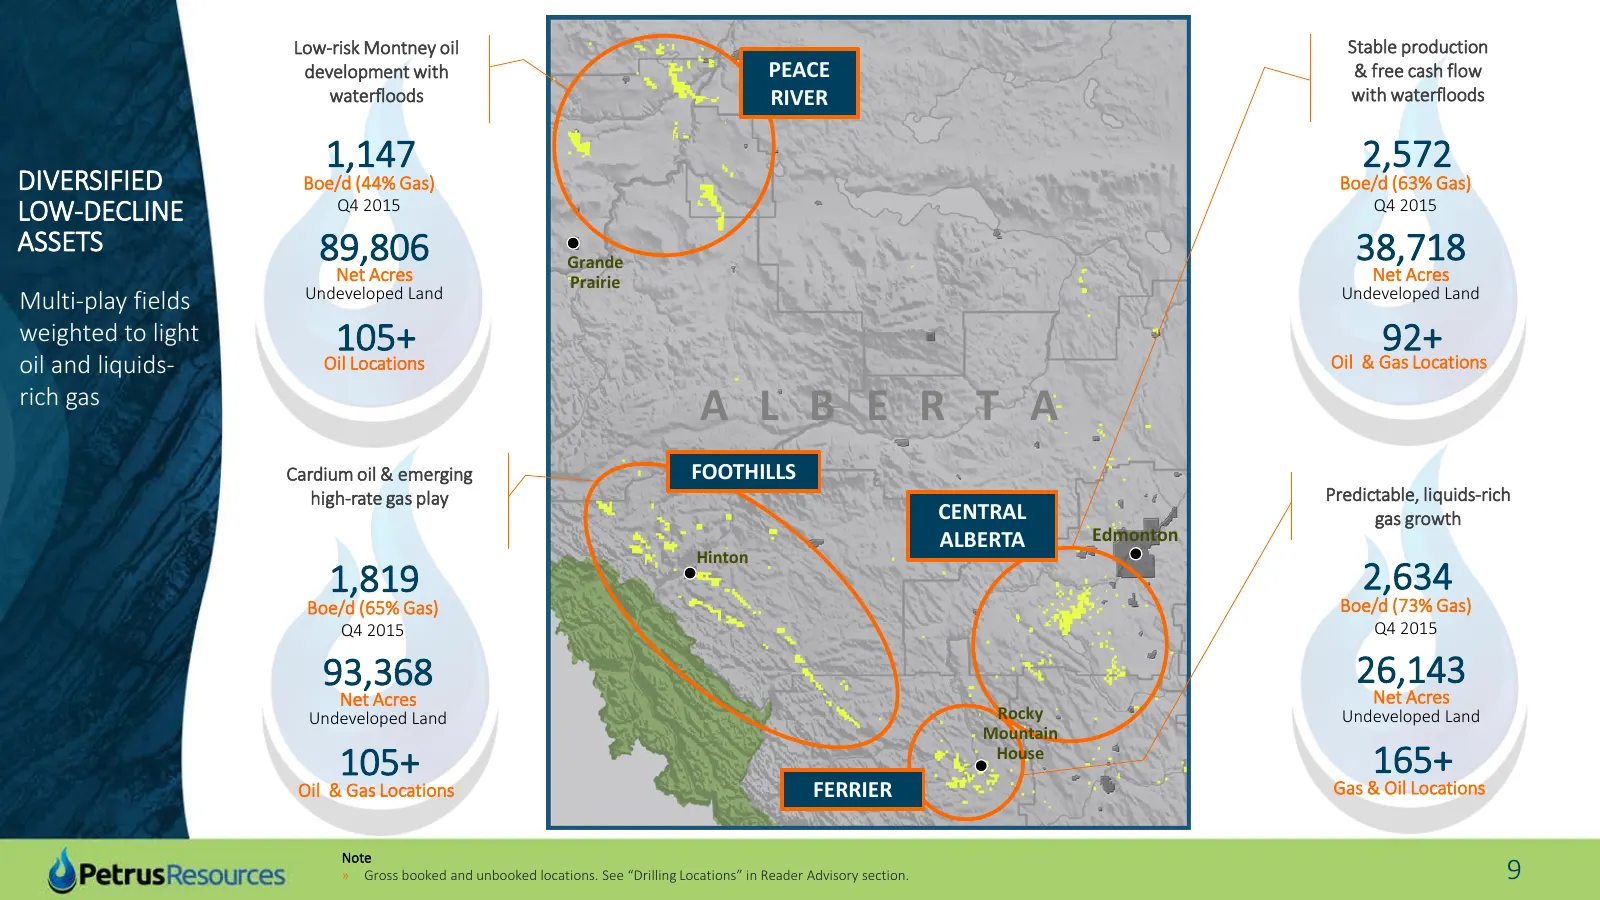
Low-risk Montney oil Stable production development with PEACE & free cash flow waterfloods RIVER with waterfloods 1,147 2,572 DIVERSIFIED Boe/d (44% Gas) Boe/d (63% Gas) LOW-DECLINE Q4 2015 Q4 2015 ASSETS 89,806 Grande 38,718 Net Acres Prairie Net Acres Undeveloped Land Undeveloped Land Multi-play f
Slide 10: Growth Projects
Growth Projects
Slide 11: Focus on Ferrier
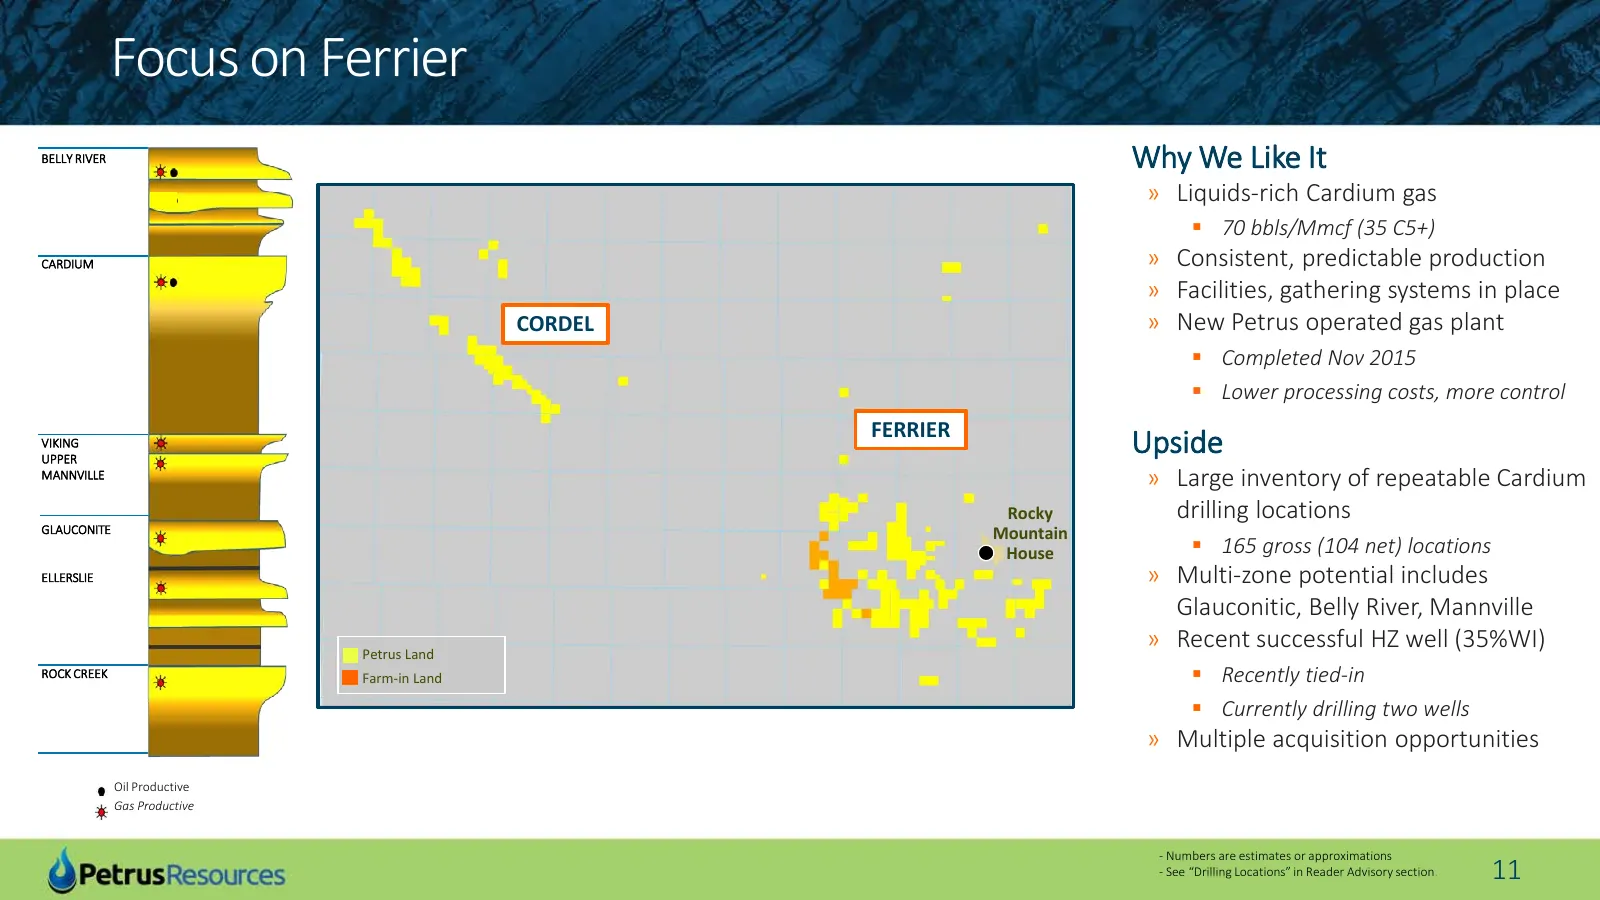
Focus on Ferrier BELLY RIVER Why We Like It » Liquids-rich Cardium gas 70 bbls/Mmcf (35 C5+) CARDIUM » Consistent, predictable production » Facilities, gathering systems in place CORDEL » New Petrus operated gas plant Completed Nov 2015 Lower processing costs, more control FERRIER VIKING UPPER
Slide 12: Ferrier Cardium Pool Highlights
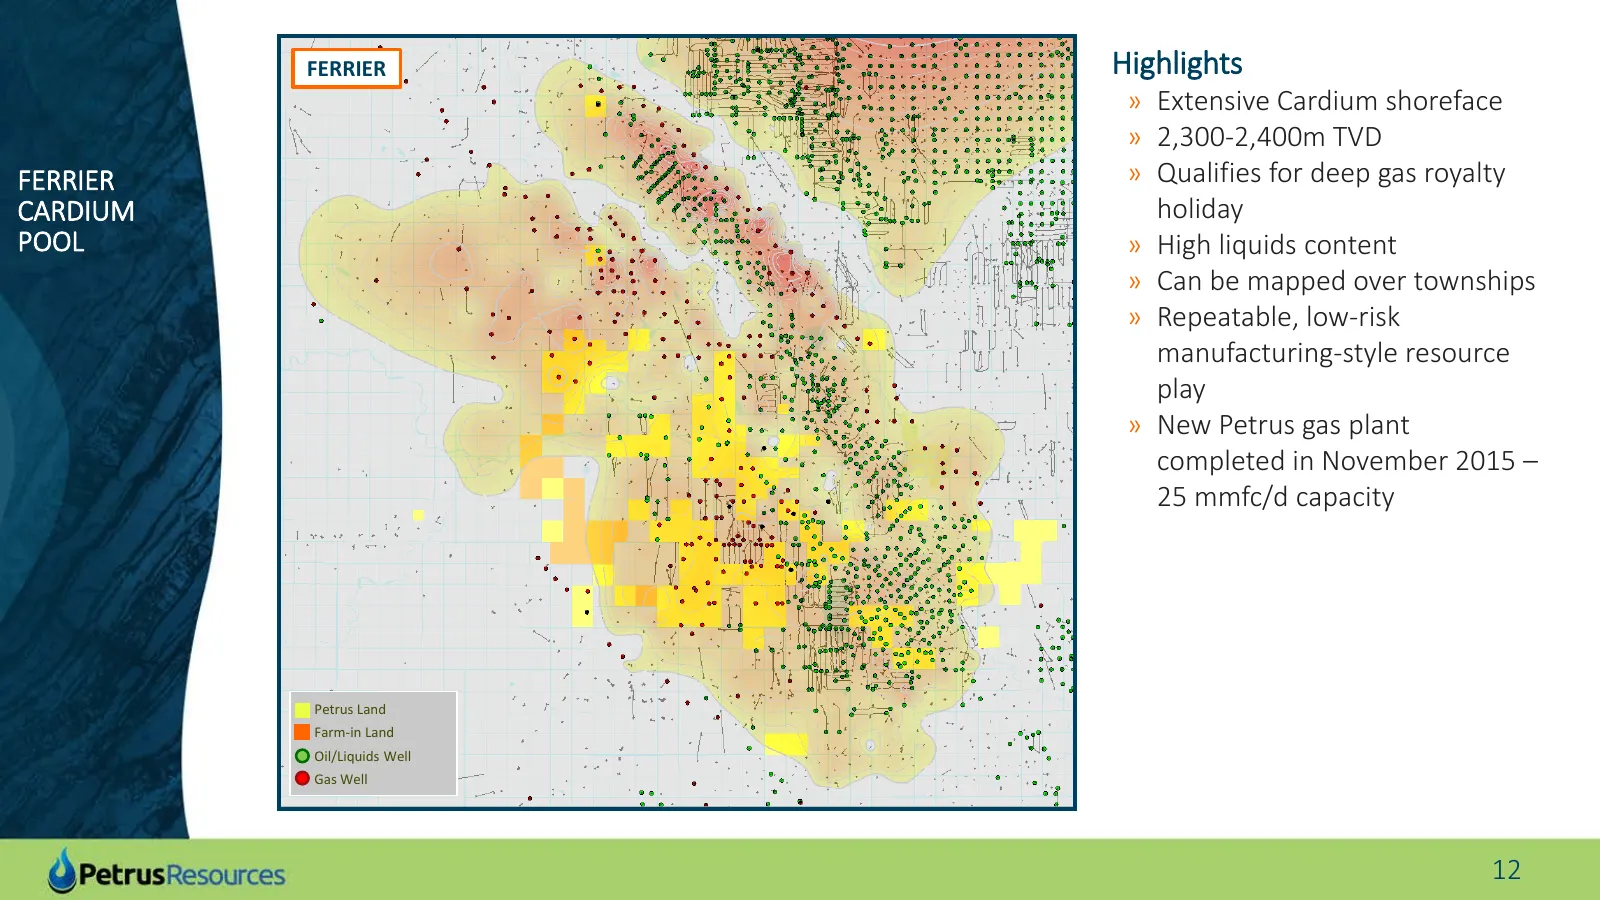
FERRIER Highlights » Extensive Cardium shoreface » 2,300-2,400m TVD FERRIER » Qualifies for deep gas royalty CARDIUM holiday POOL » High liquids content » Can be mapped over townships » Repeatable, low-risk manufacturing-style resource play » New Petrus gas plant completed in November 2015 – 25 mmfc
Slide 13: Current Wells and PUD Locations
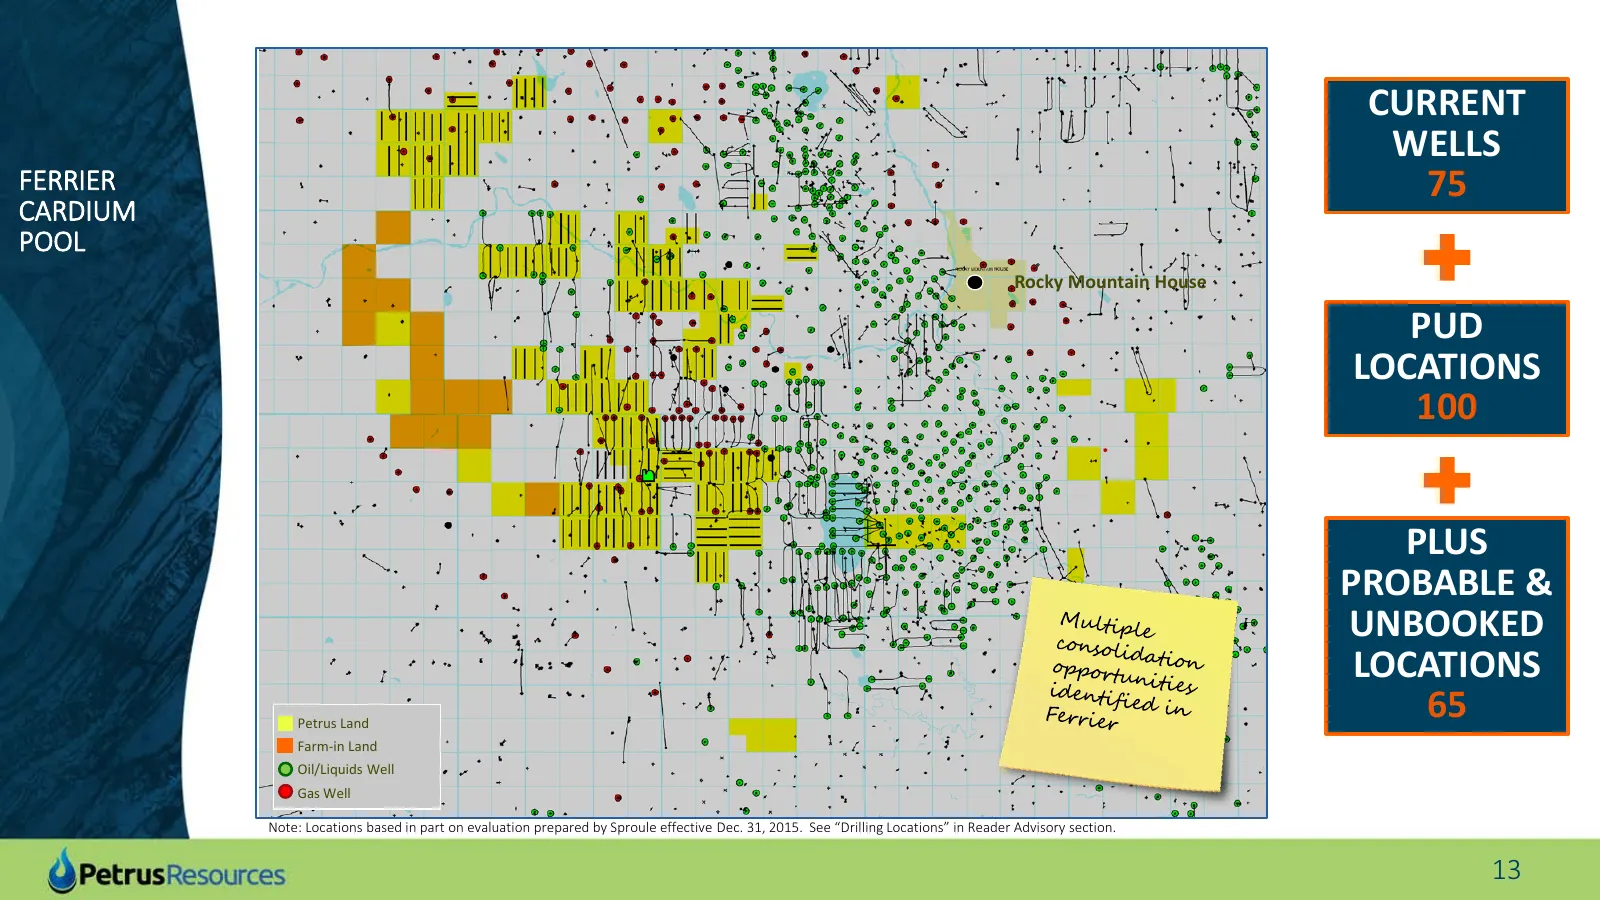
CURRENT WELLS FERRIER 75 CARDIUM POOL Rocky Mountain House PUD LOCATIONS 100 PLUS PROBABLE & UNBOOKED LOCATIONS Petrus Land 65 Farm-in Land Oil/Liquids Well Gas Well Note: Locations based in part on evaluation prepared by Sproule effective Dec. 31, 2015. See “Drilling Locations” in Reader Advisory s
Slide 14: Ferrier Cardium Drilling Economics
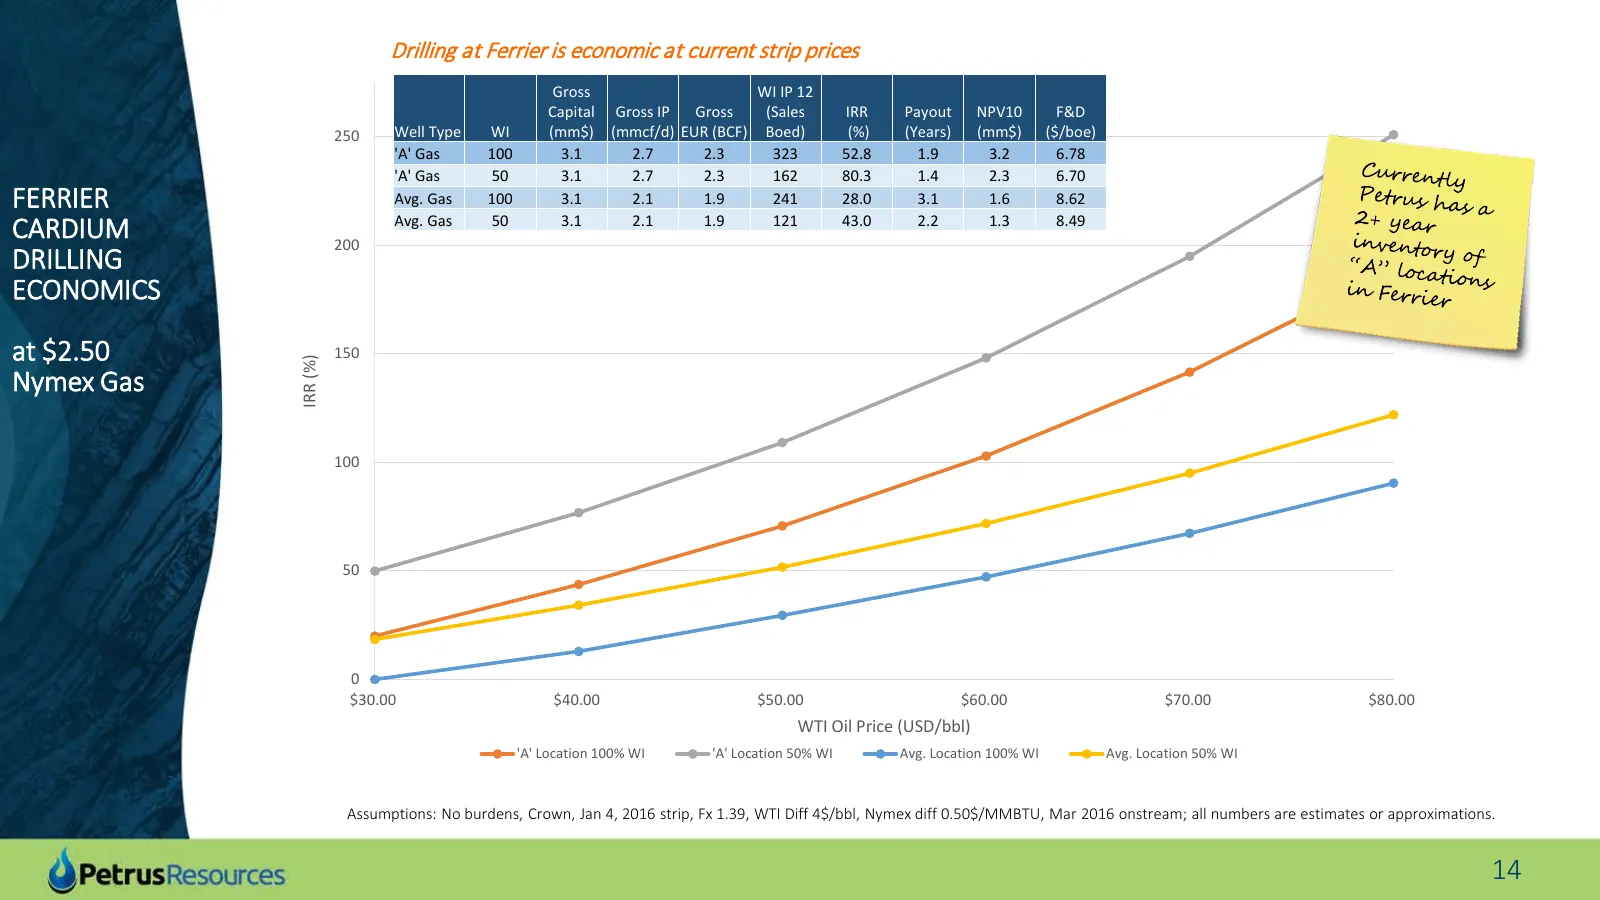
Drilling at Ferrier is economic at current strip prices Gross WI IP 12 Capital Gross IP Gross (Sales IRR Payout NPV10 F&D 250 Well Type WI (mm$) (mmcf/d) EUR (BCF) Boed) (%) (Years) (mm$) ($/boe) 'A' Gas 100 3.1 2.7 2.3 323 52.8 1.9 3.2 6.78 'A' Gas 50 3.1 2.7 2.3 162 80.3 1.4 2.3 6.70 FERRIER Avg.
Slide 15: Sustainability
Sustainability
Slide 16: Waterfloods in Central Alberta
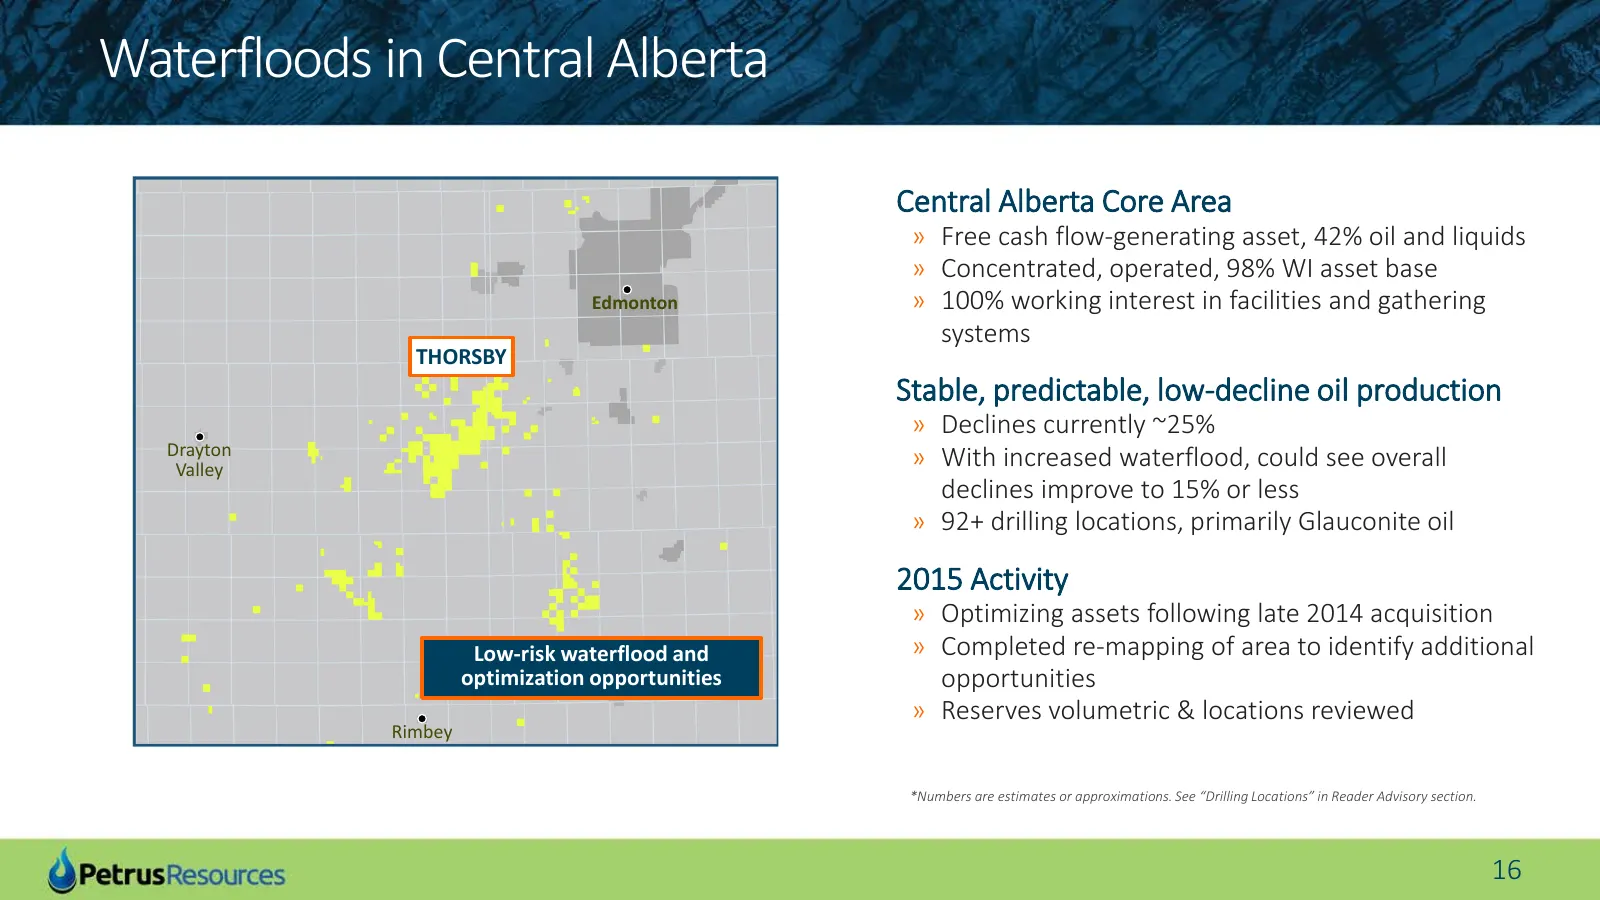
Waterfloods in Central Alberta Central Alberta Core Area » Free cash flow-generating asset, 42% oil and liquids » Concentrated, operated, 98% WI asset base Edmonton » 100% working interest in facilities and gathering systems THORSBY Stable, predictable, low-decline oil production » Declines currentl
Slide 17: Thorsby Glauconite Pools Waterflood Potential
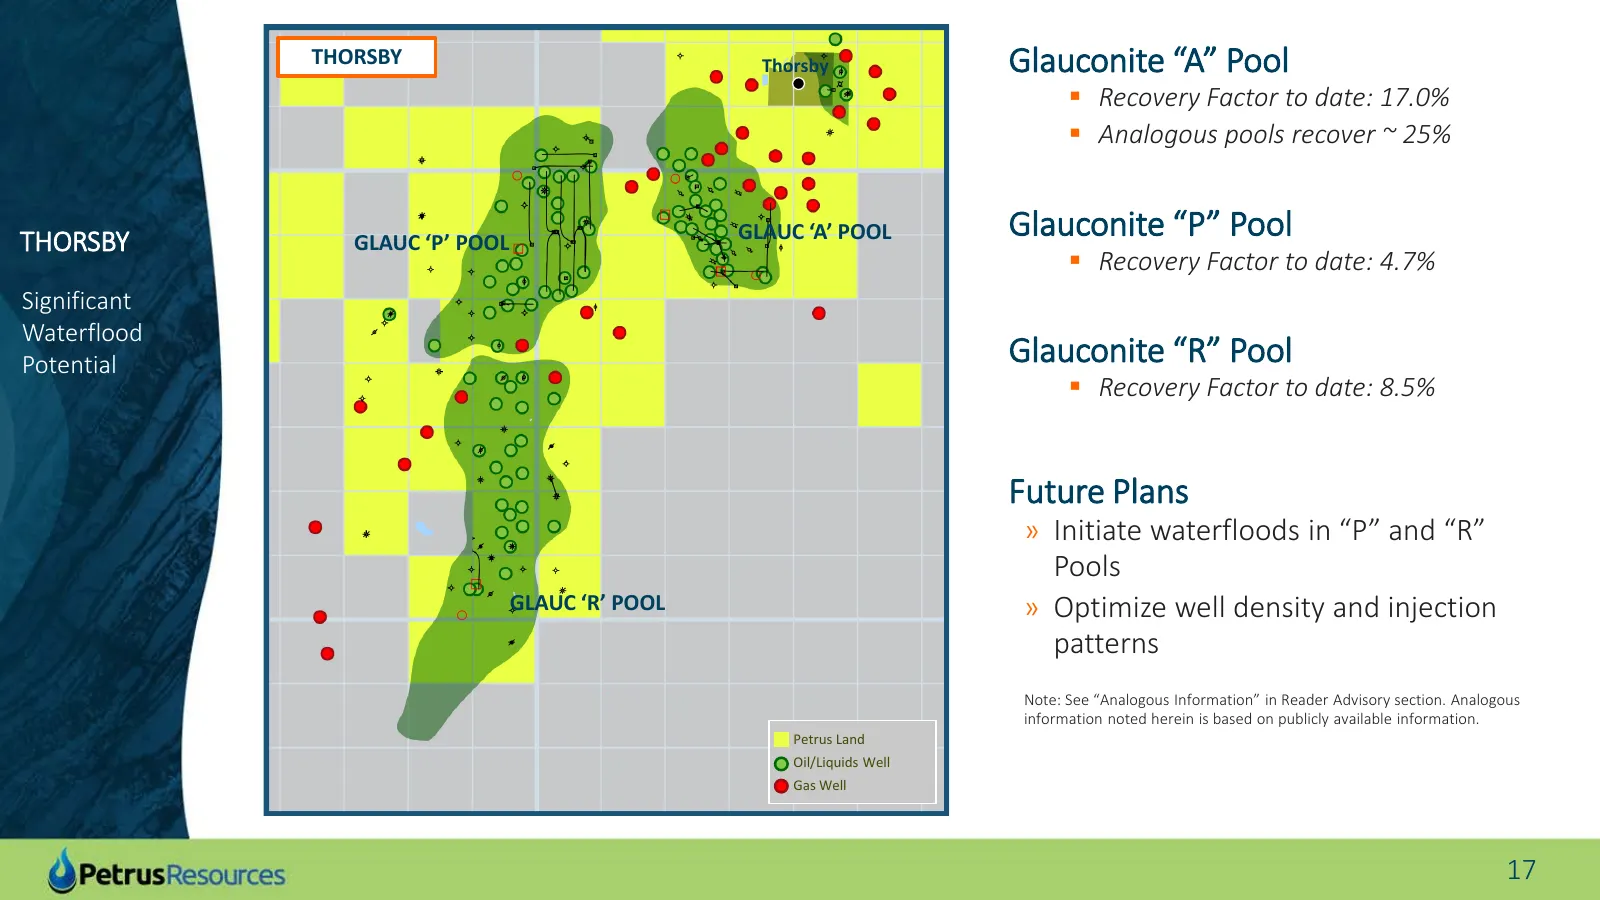
THORSBY Thorsby Glauconite “A” Pool Recovery Factor to date: 17.0% Analogous pools recover ~ 25% THORSBY GLAUC ‘P’ POOL GLAUC ‘A’ POOL Glauconite “P” Pool Recovery Factor to date: 4.7% Significant Waterflood Potential Glauconite “R” Pool Recovery Factor to date: 8.5% Future Plans » Initiate
Slide 18: Reducing Costs in Peace River
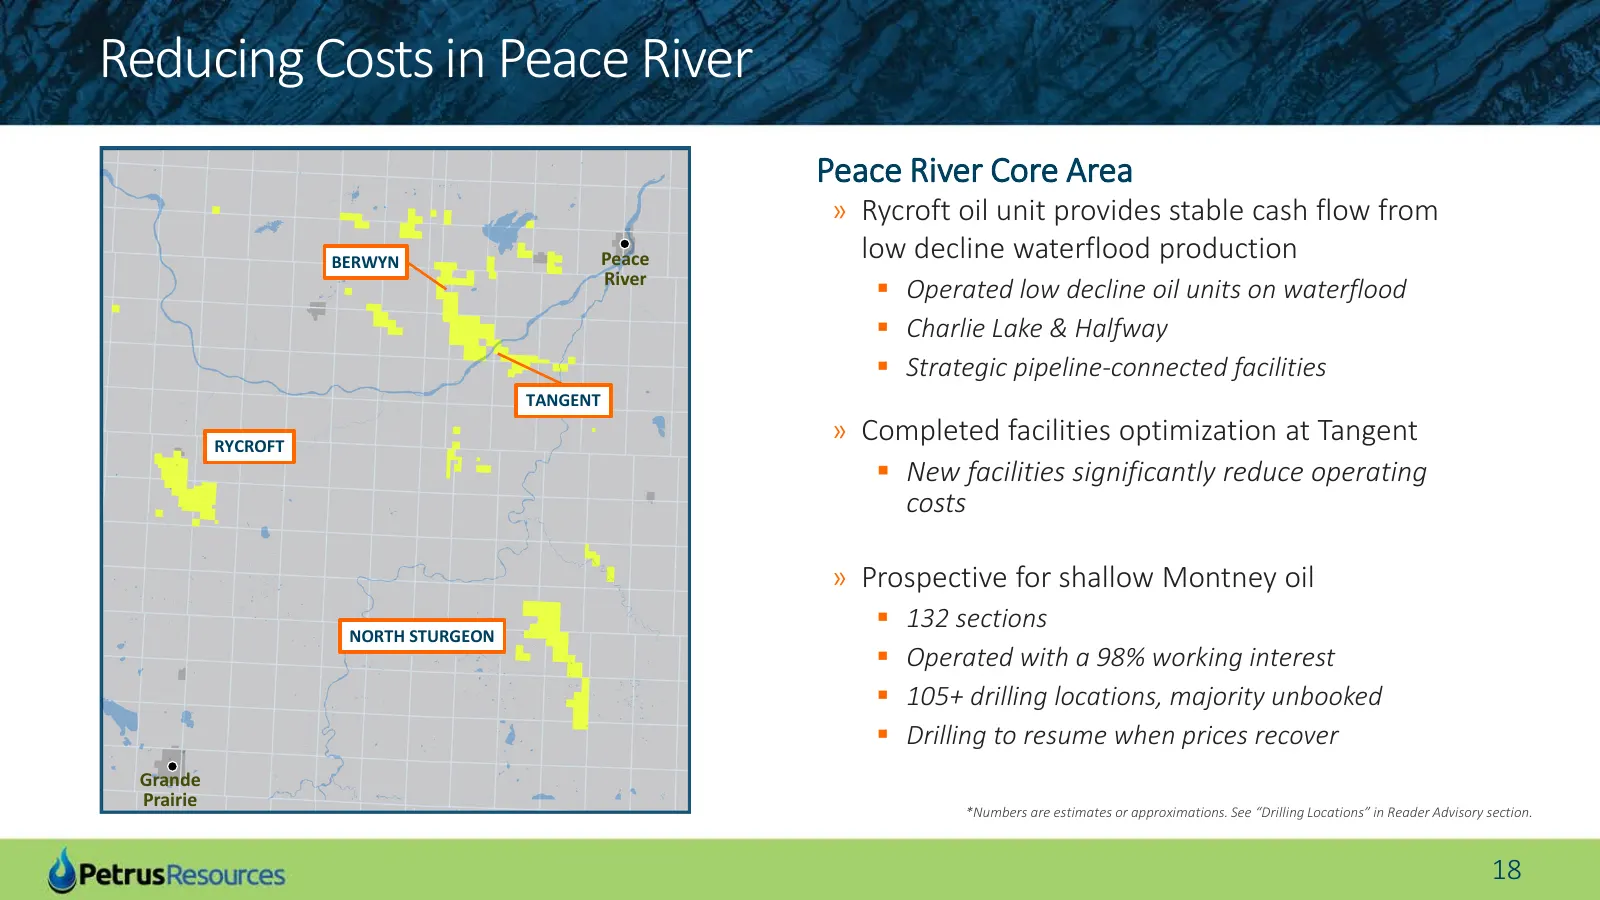
Reducing Costs in Peace River Peace River Core Area » Rycroft oil unit provides stable cash flow from BERWYN Peace low decline waterflood production River Operated low decline oil units on waterflood Charlie Lake & Halfway Strategic pipeline-connected facilities TANGENT RYCROFT » Completed fac
Slide 19: Berwyn Opex vs. Production
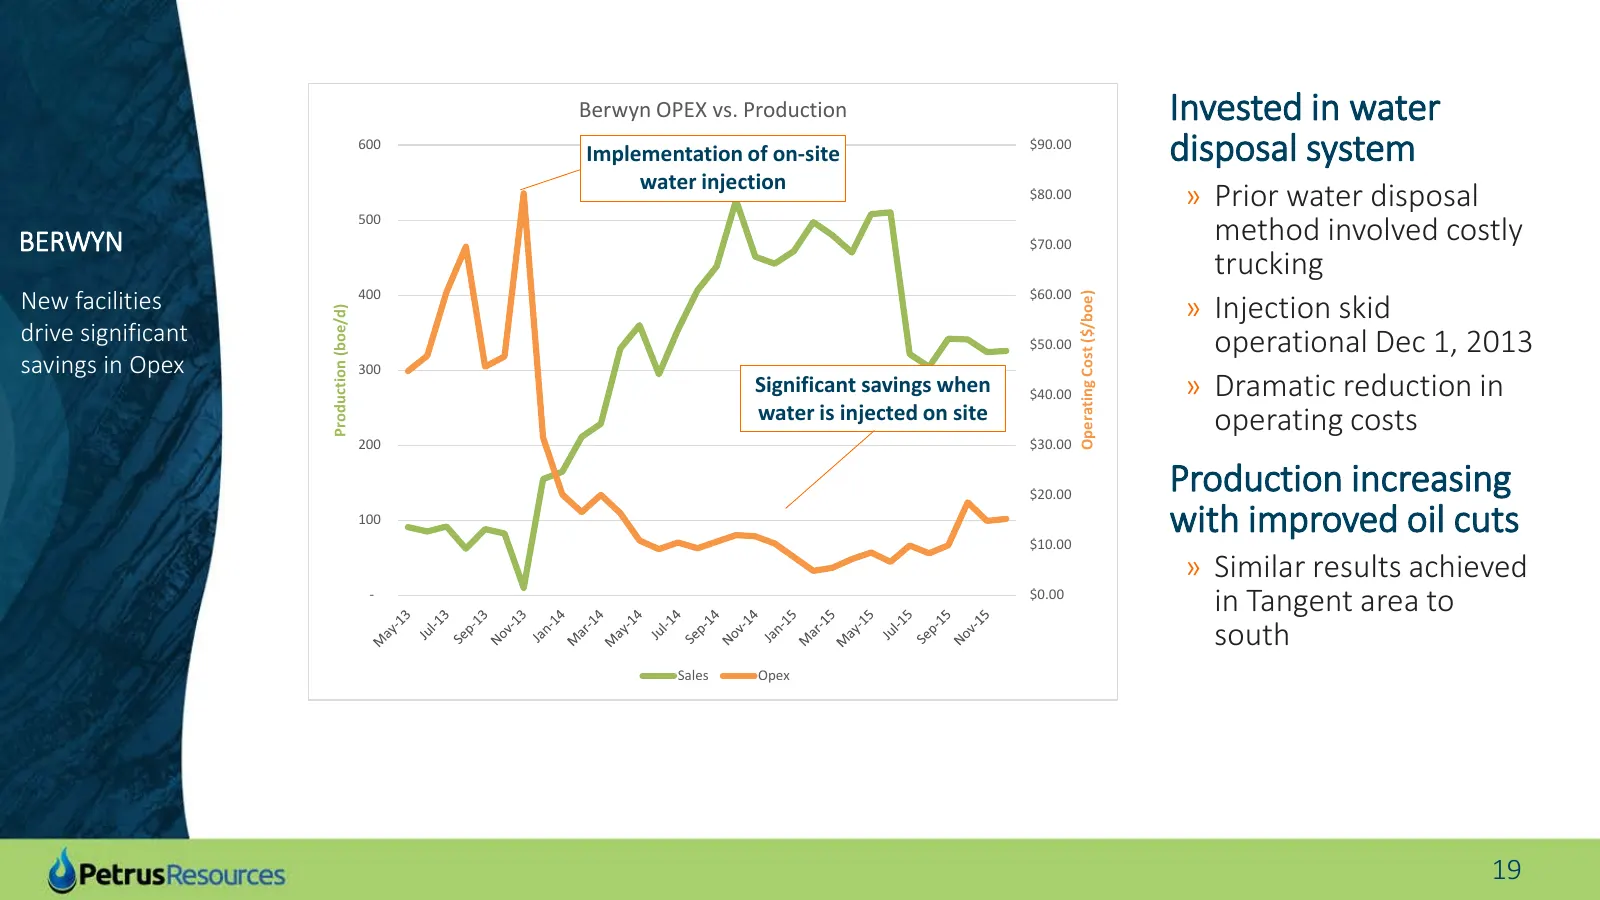
Berwyn OPEX vs. Production Invested in water 600 Implementation of on-site $90.00 disposal system water injection $80.00 » Prior water disposal BERWYN 500 $70.00 method involved costly trucking New facilities 400 $60.00 » Injection skid Operating Cost ($/boe) Production (boe/d) Saskatchewan drive si
Slide 20: Peer Comparison
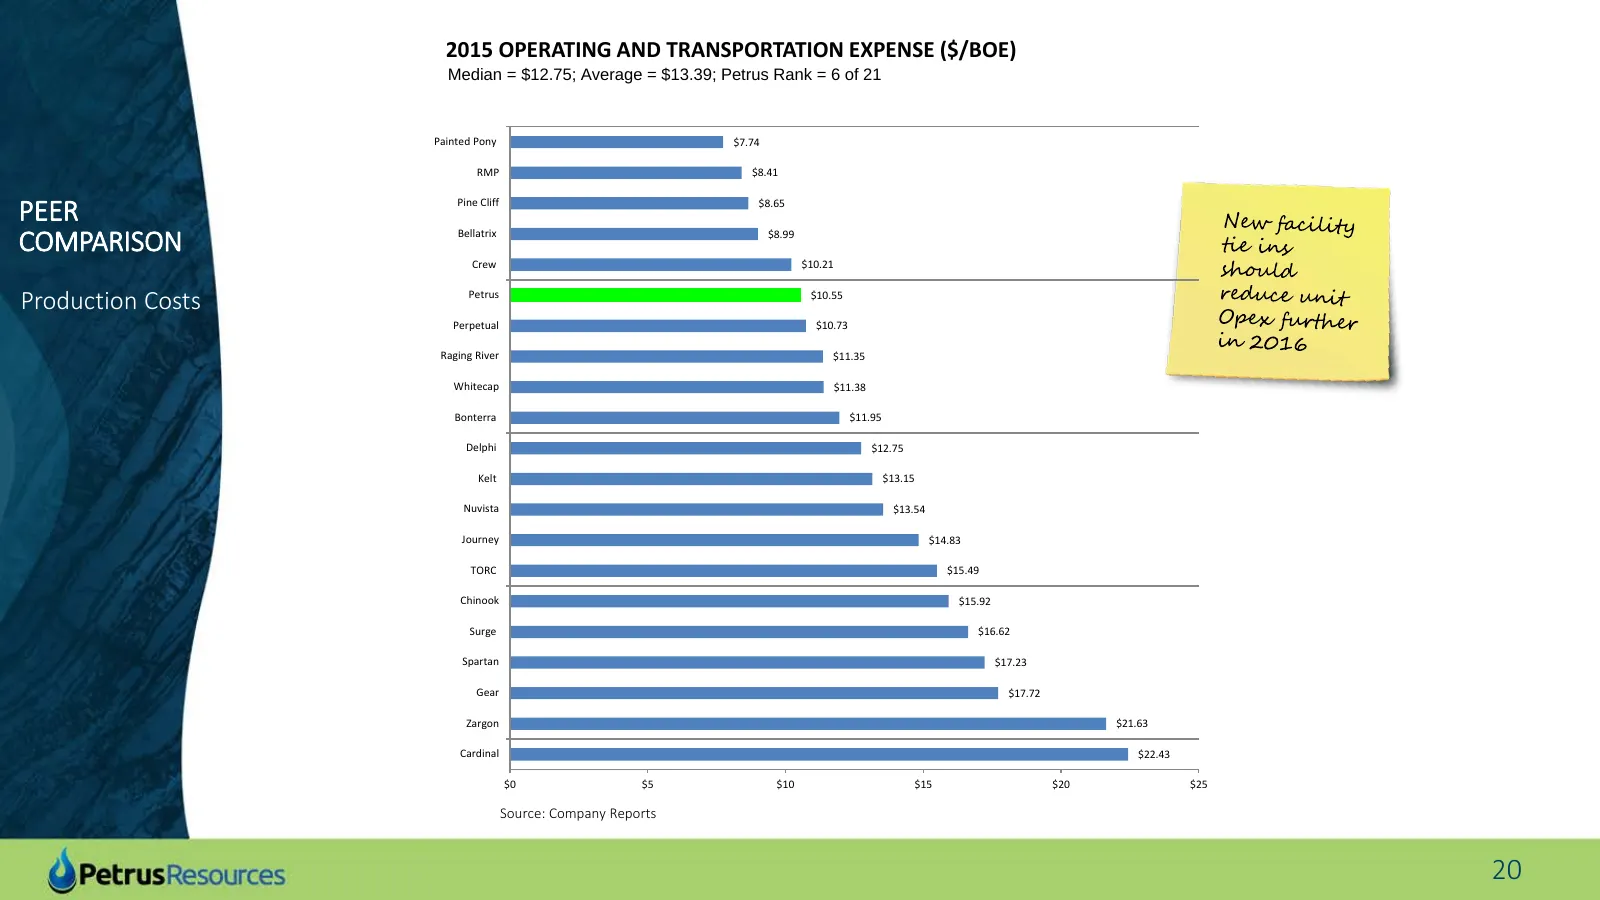
2015 OPERATING AND TRANSPORTATION EXPENSE ($/BOE) Median = $12.75; Average = $13.39; Petrus Rank = 6 of 21 Painted Pony $7.74 RMP $8.41 PEER Pine Cliff $8.65 COMPARISON Bellatrix $8.99 Crew $10.21 Production Costs Petrus $10.55 Perpetual $10.73 Raging River $11.35 Whitecap $11.38 Bonterra $11.95 Del
Slide 21: For more information please contact
Petrus Resources Ltd. Suite 2400, 240 – 4th Avenue SW | Calgary, Alberta T2P 4H4 www.petrusresources.com For more information please contact Kevin Adair, President & CEO 403.930.0888 | kadair@petrusresources.com Cheree Stephenson, VP Finance & CFO 403.930.0891| cstephenson@petrusresources.com 21
Source: Internet Archive copy of petrusresources.com
More decks from Petrus Resources Ltd.
 Q3 2026 Earnings Presentation16 slides · November 2026
 Q2 2026 Earnings Presentation21 slides · Aug 6, 2026
 Q4 2025 Earnings Presentation21 slides · Mar 19, 2026
 Q2 2025 Earnings Presentation18 slides · Aug 8, 2025
 Q3 2021 Earnings Presentation24 slides · Nov 10, 2021
 Q4 2017 Earnings Presentation25 slides · Mar 8, 2018