Petrus Resources Ltd. · TSX:PRQ
Petrus Resources — Q3 2026 Earnings Presentation
16 slides from Petrus Resources's earnings presentation, November 2026
Slide 1: PRQ.TO Q3 2026 Update
PRQ.TO Q3 2026 Update November 2026
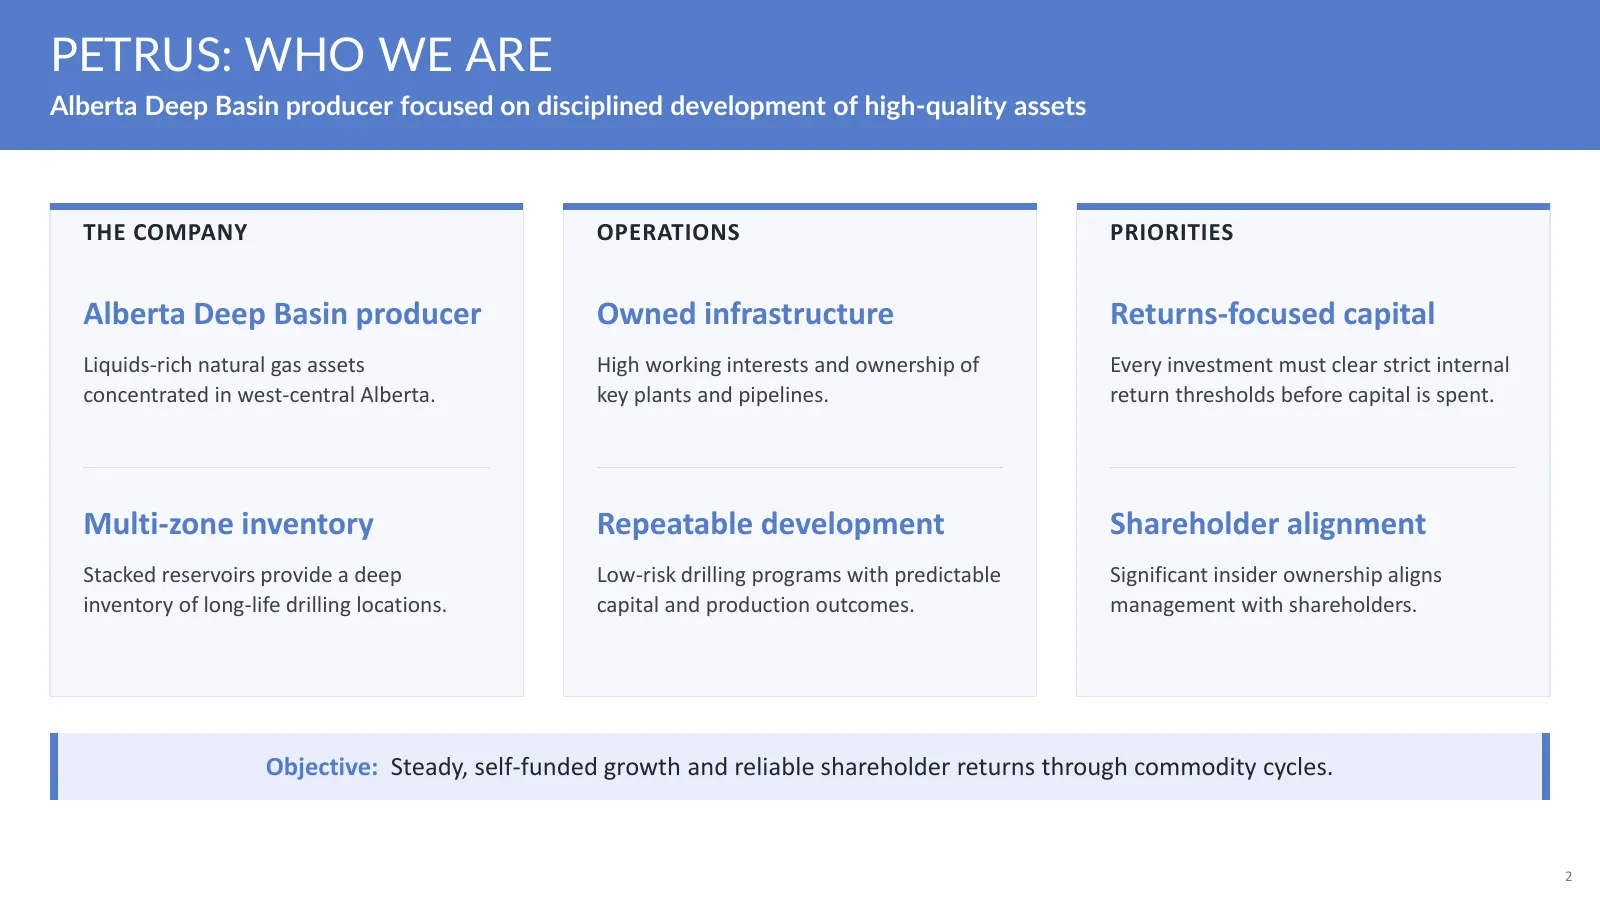
Slide 2: Petrus: Who We Are
PETRUS: WHO WE ARE Alberta Deep Basin producer focused on disciplined development of high-quality assets THE COMPANY OPERATIONS PRIORITIES Alberta Deep Basin producer Owned infrastructure Returns-focused capital Liquids-rich natural gas assets High working interests and ownership of Every investment
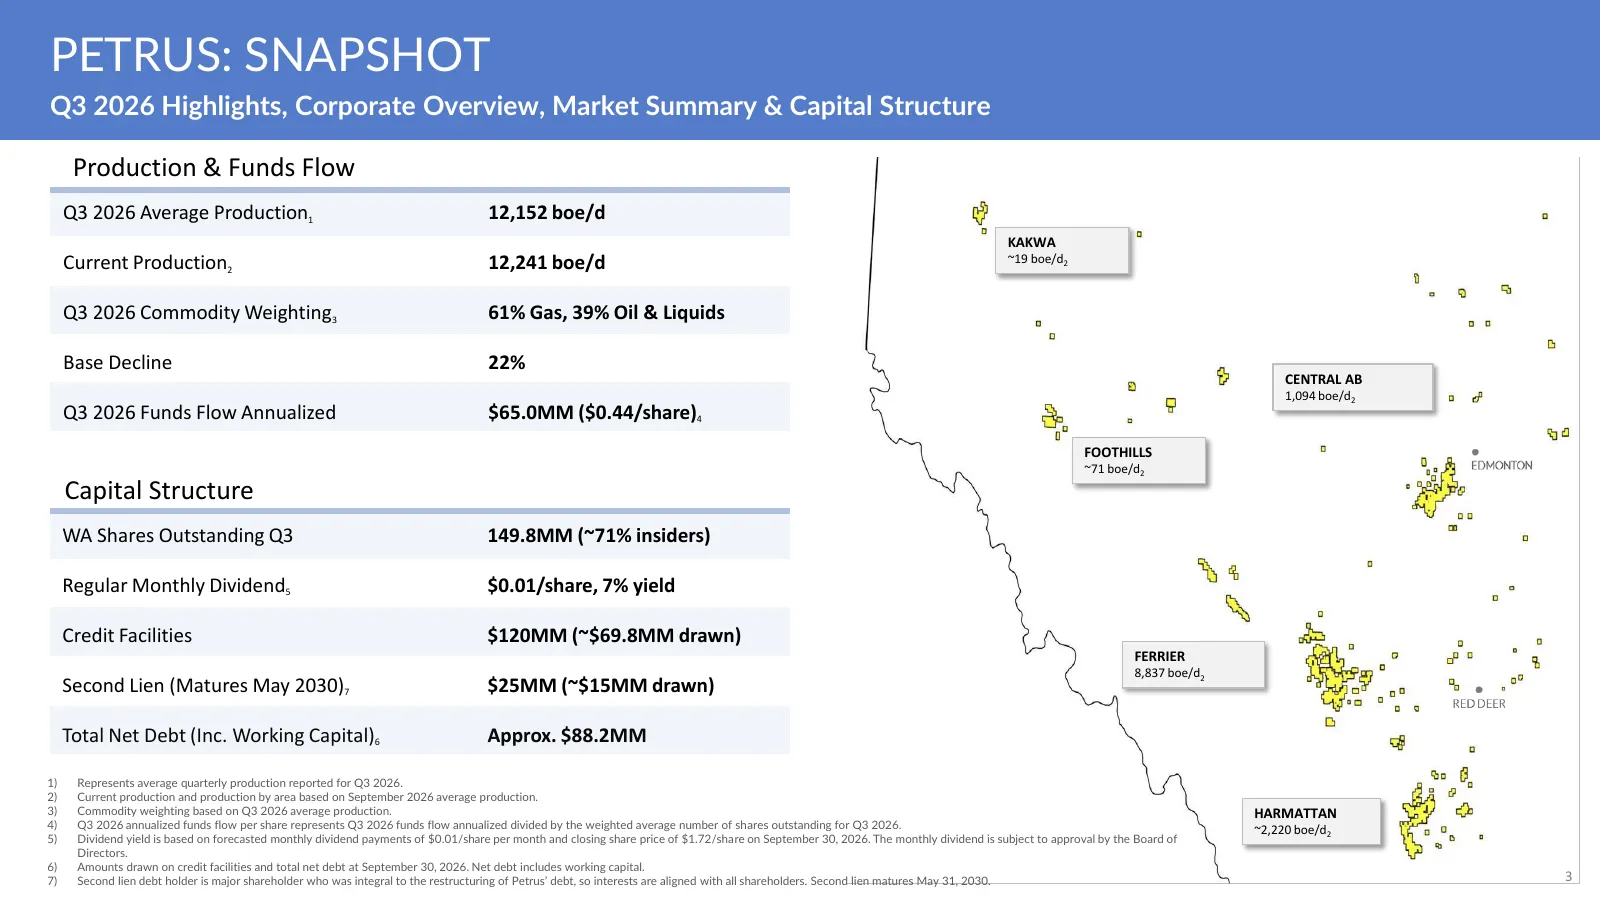
Slide 3: Petrus: Snapshot
PETRUS: SNAPSHOT Q3 2026 Highlights, Corporate Overview, Market Summary & Capital Structure Production & Funds Flow Q3 2026 Average Production1 12,152 boe/d KAKWA Current Production2 12,241 boe/d ~19 boe/d2 Q3 2026 Commodity Weighting3 61% Gas, 39% Oil & Liquids Base Decline 22% CENTRAL AB 1,094 boe
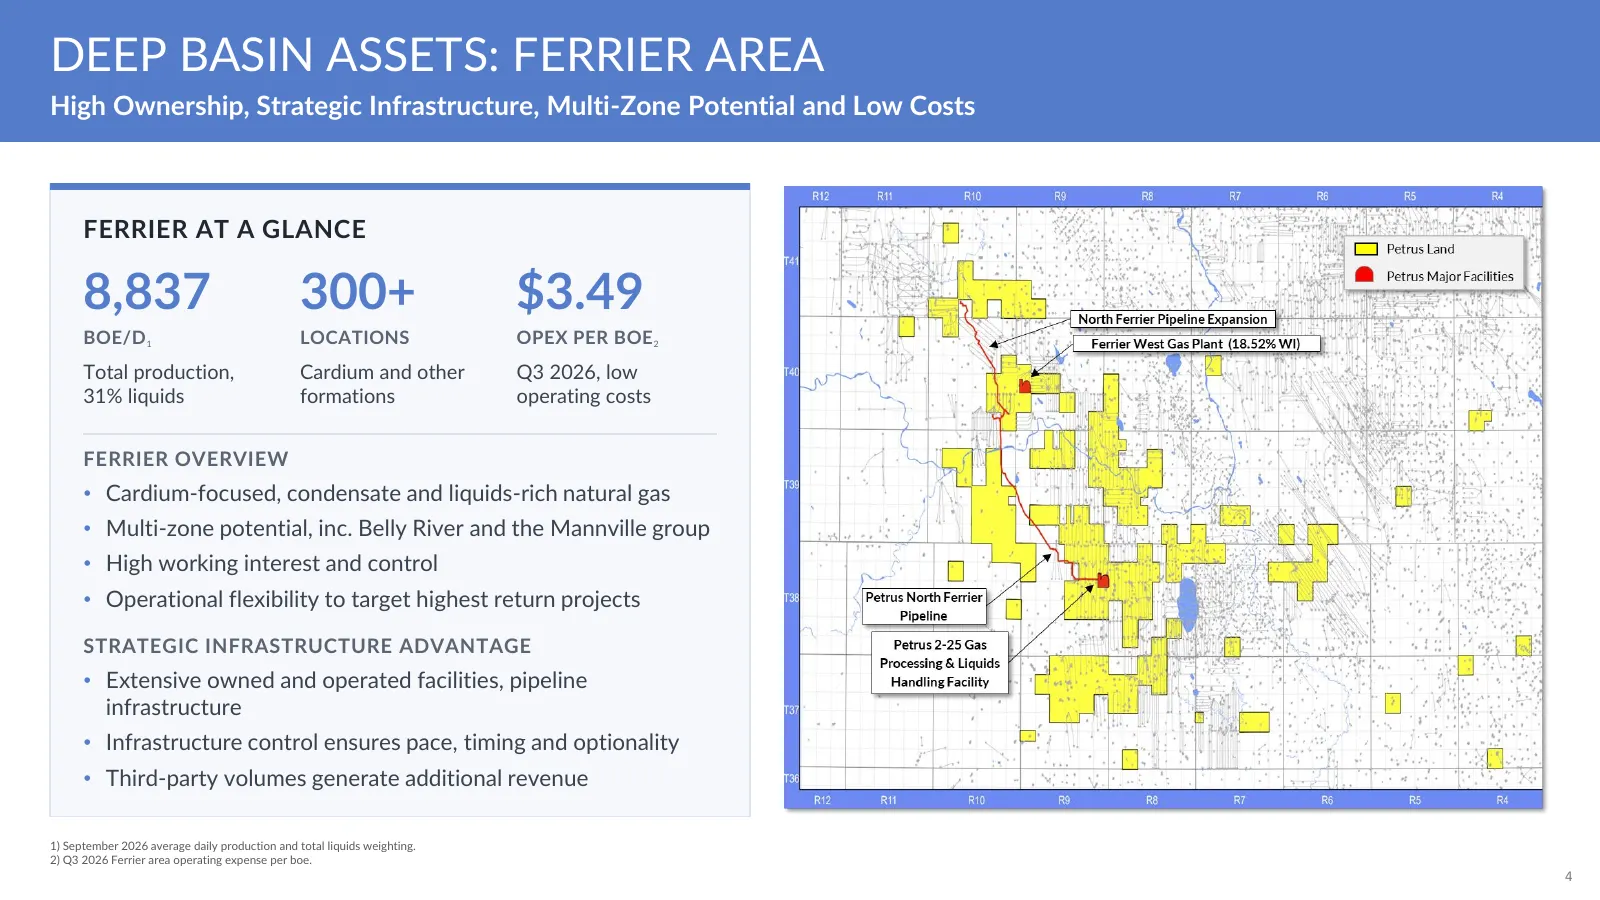
Slide 4: Deep Basin Assets: Ferrier Area
DEEP BASIN ASSETS: FERRIER AREA FERRIER High Ownership, Strategic Infrastructure, Multi-Zone Potential and Low Costs Economics & Drilling Locations FERRIER AT A GLANCE 8,837 300+ $3.49 BOE/D 1 LOCATIONS OPEX PER BOE 2 Total production, Cardium and other Q3 2026, low 31% liquids formations operating
Slide 5: Deep Basin Assets: Ferrier Opportunities
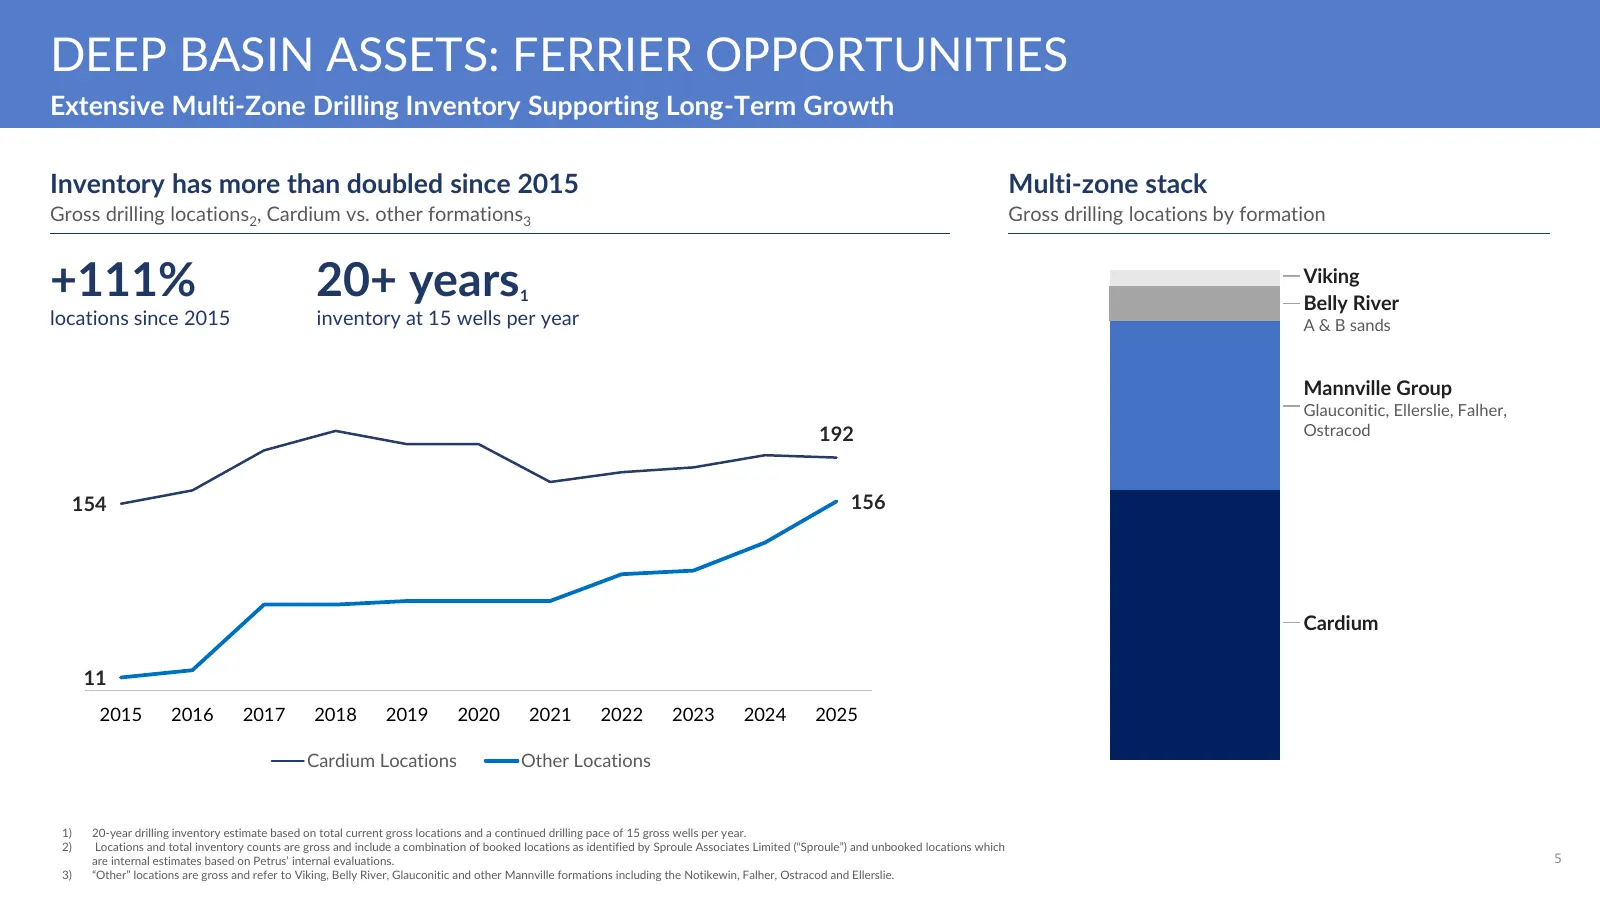
DEEP BASIN ASSETS: FERRIER OPPORTUNITIES Land Position and Drilling Locations 1 Extensive Multi-Zone Drilling Inventory Supporting Long-Term Growth Inventory has more than doubled since 2015 Multi-zone stack Gross drilling locations2, Cardium vs. other formations3 Gross drilling locations by formati
Slide 6: Ferrier: Reducing Capital Costs
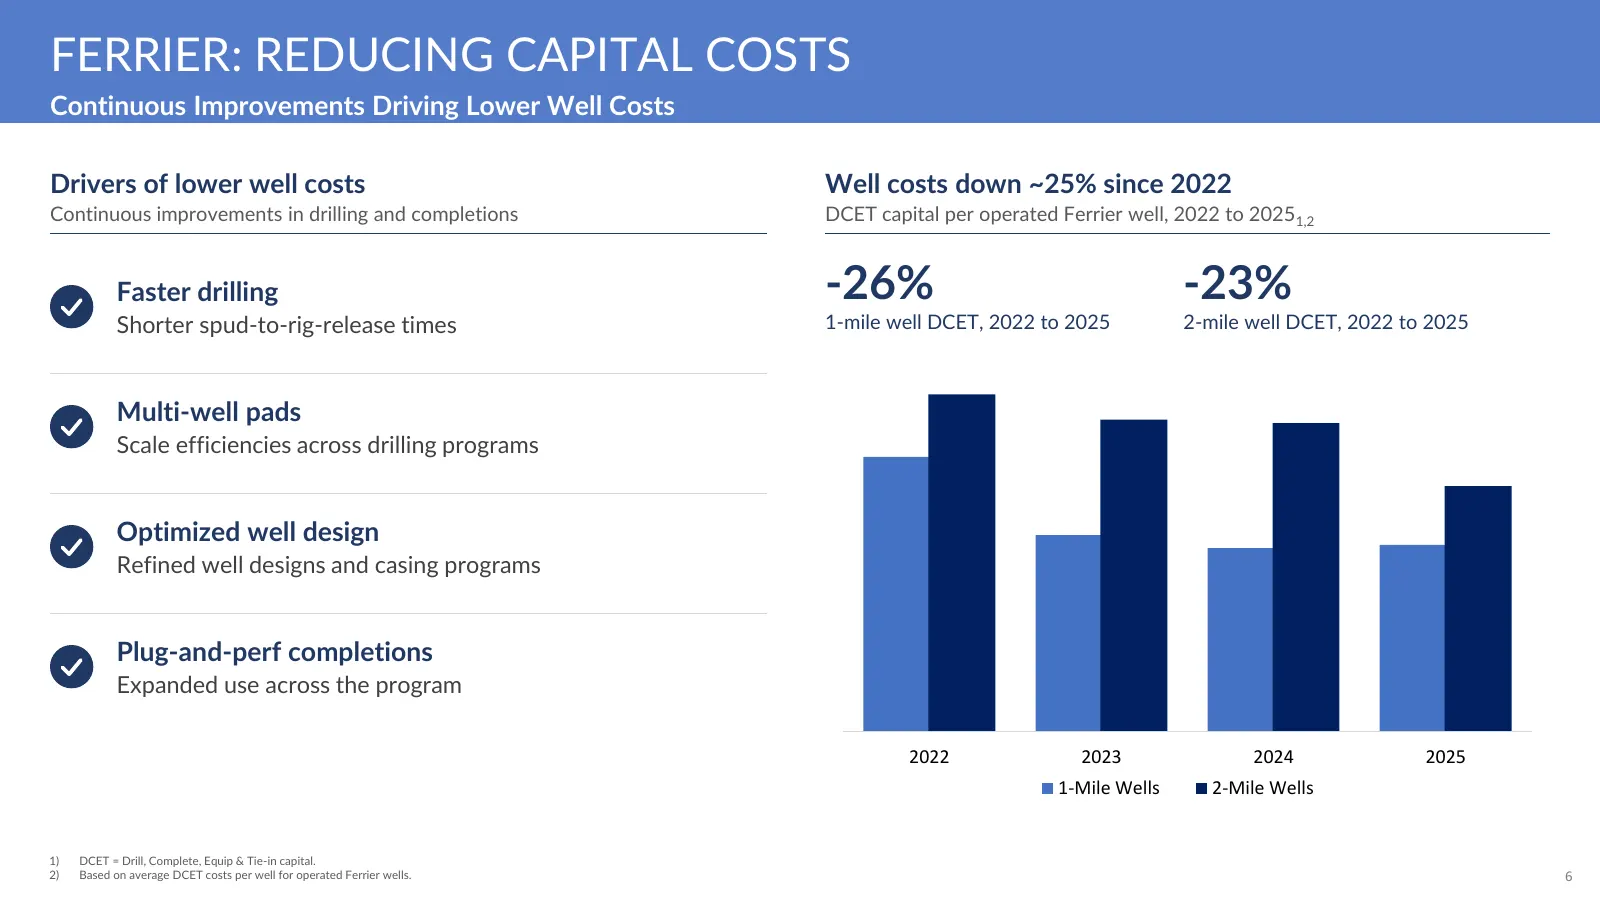
FERRIER: REDUCING CAPITAL COSTS Continuous Improvements Driving Lower Well Costs Drivers of lower well costs Well costs down ~25% since 2022 Continuous improvements in drilling and completions DCET capital per operated Ferrier well, 2022 to 20251,2 Faster drilling -26% -23% Shorter spud-to-rig-relea
Slide 7: Deep Basin Assets: Harmattan Area
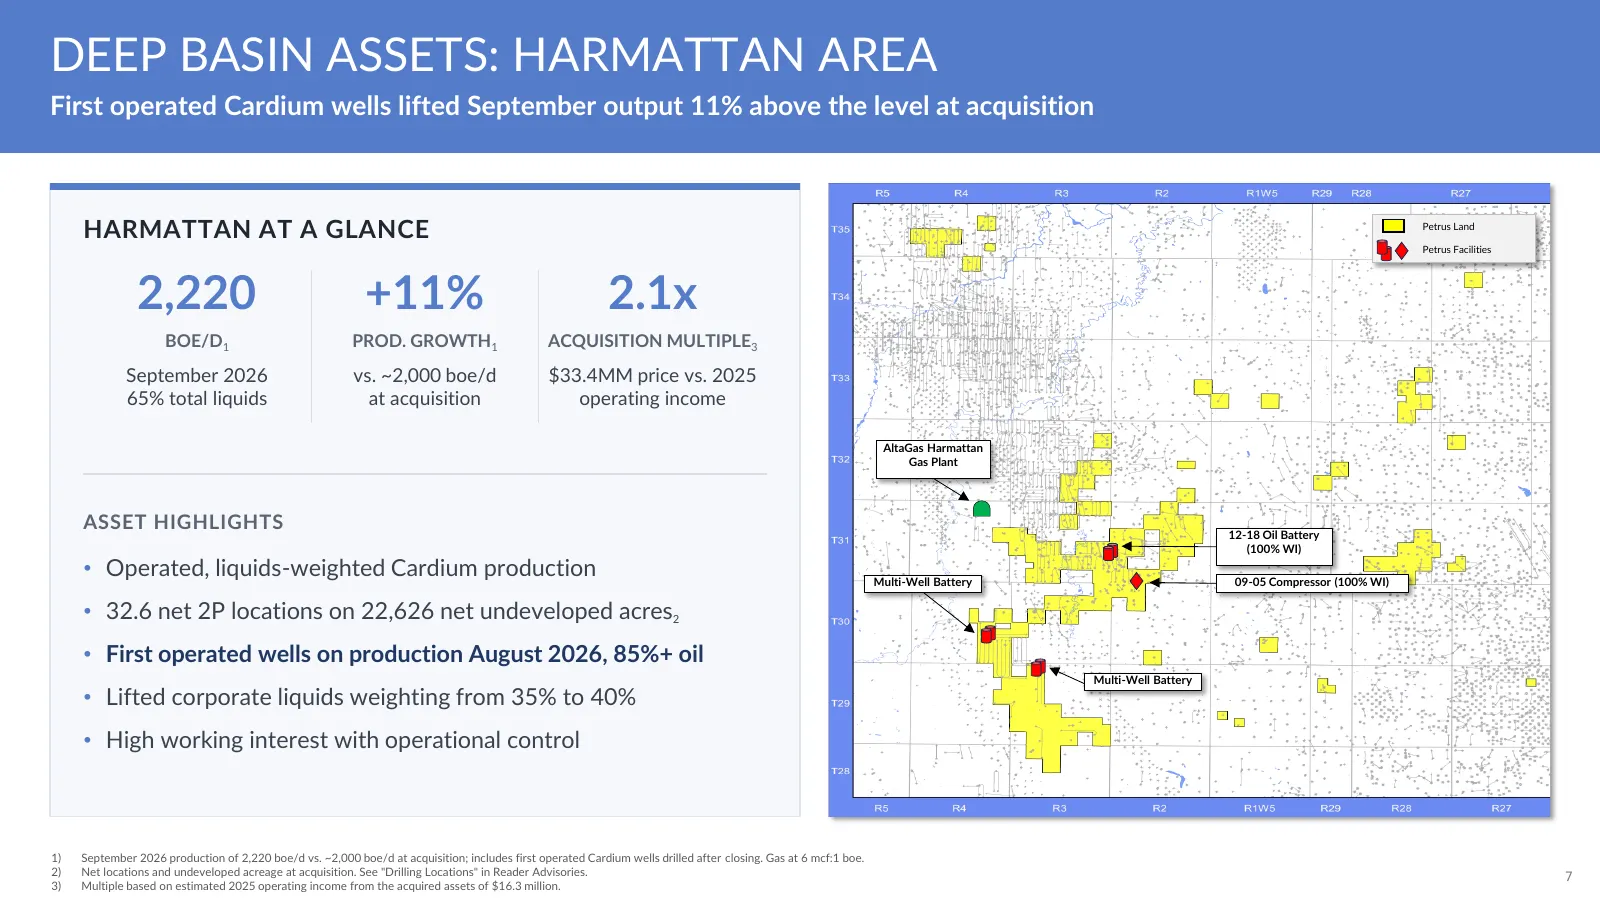
DEEP BASIN ASSETS: HARMATTAN AREA First operated Cardium wells lifted September output 11% above the level at acquisition HARMATTAN AT A GLANCE • Petrus Land • Petrus Facilities 2,220 +11% 2.1x BOE/D1 PROD. GROWTH1 ACQUISITION MULTIPLE3 September 2026 vs. ~2,000 boe/d $33.4MM price vs. 2025 65% tota
Slide 8: Non-Core Assets: Thorsby, Alberta
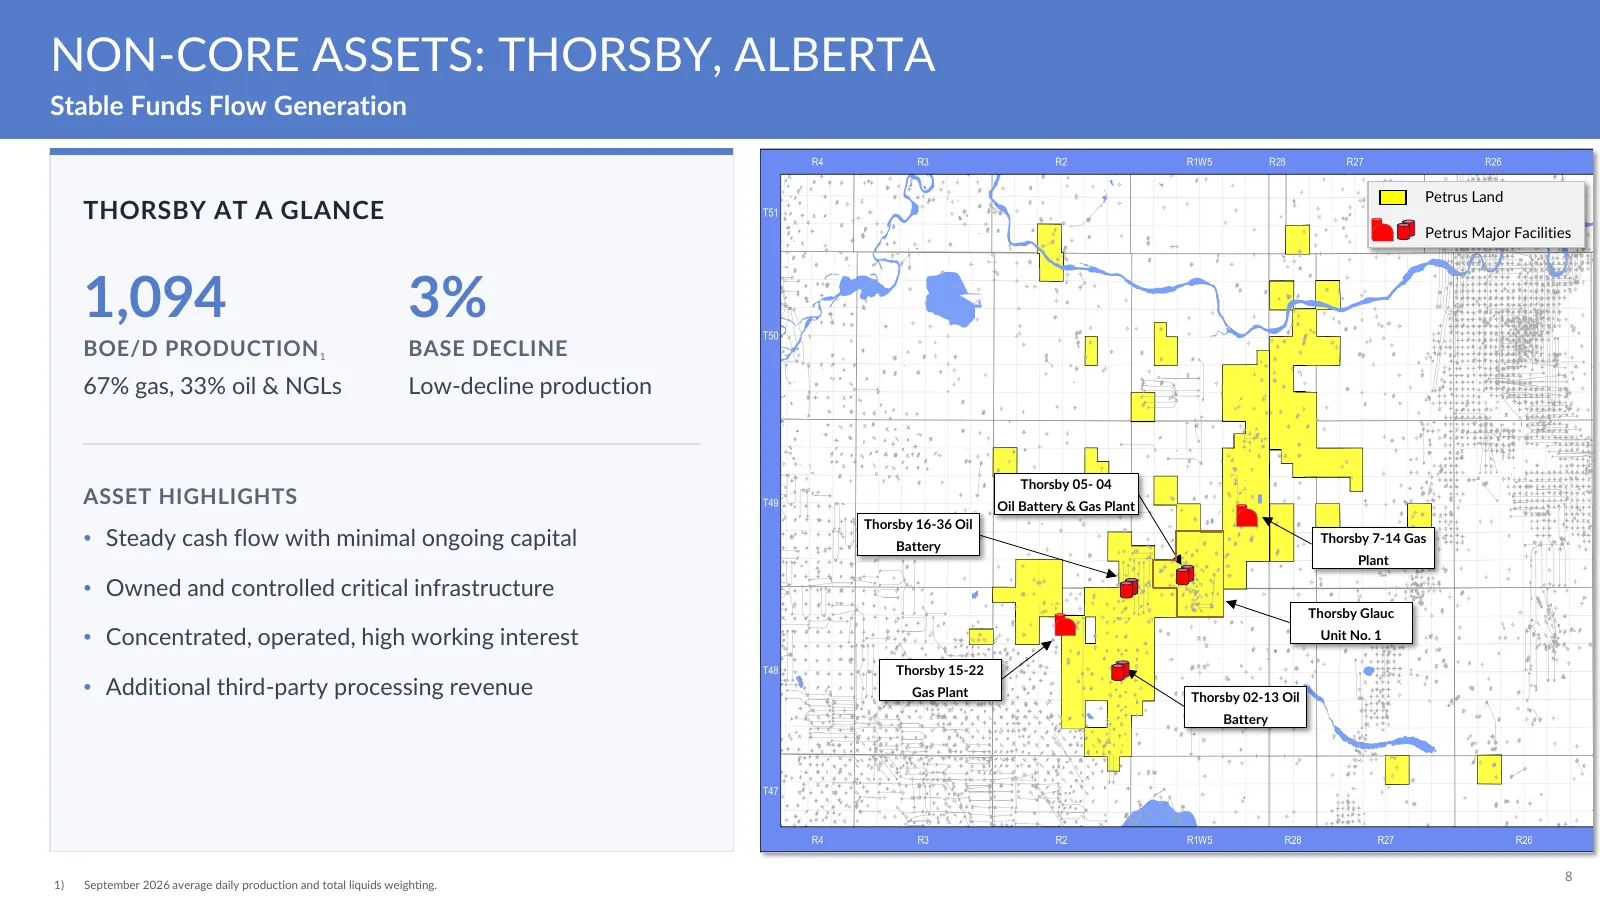
NON-CORE ASSETS: THORSBY, ALBERTA Stable Funds Flow Generation • Petrus Land THORSBY AT A GLANCE • Petrus Major Facilities 1,094 3% BOE/D PRODUCTION 1 BASE DECLINE 67% gas, 33% oil & NGLs Low-decline production Thorsby 05- 04 ASSET HIGHLIGHTS Oil Battery & Gas Plant Thorsby 16-36 Oil • Steady cash f
Slide 9: 2026 Capital Budget & Guidance
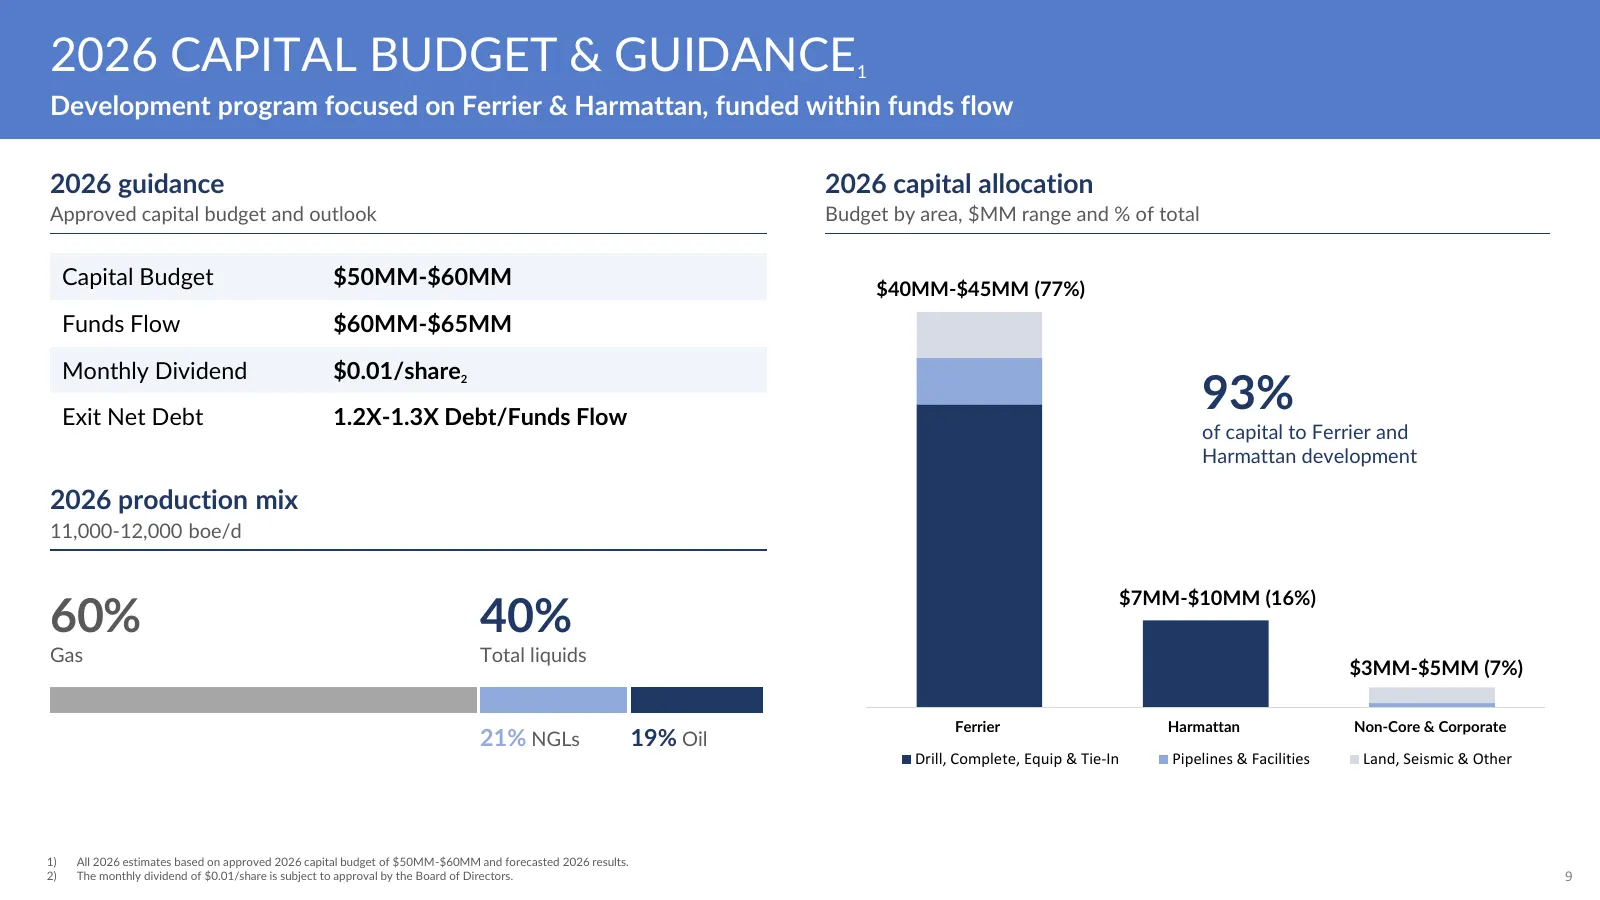
2026 CAPITAL BUDGET & GUIDANCE 1 Development program focused on Ferrier & Harmattan, funded within funds flow 2026 guidance 2026 capital allocation Approved capital budget and outlook Budget by area, $MM range and % of total Capital Budget $50MM-$60MM $40MM-$45MM (77%) Funds Flow $60MM-$65MM Monthly
Slide 10: Disciplined Growth Through Commodity Cycles
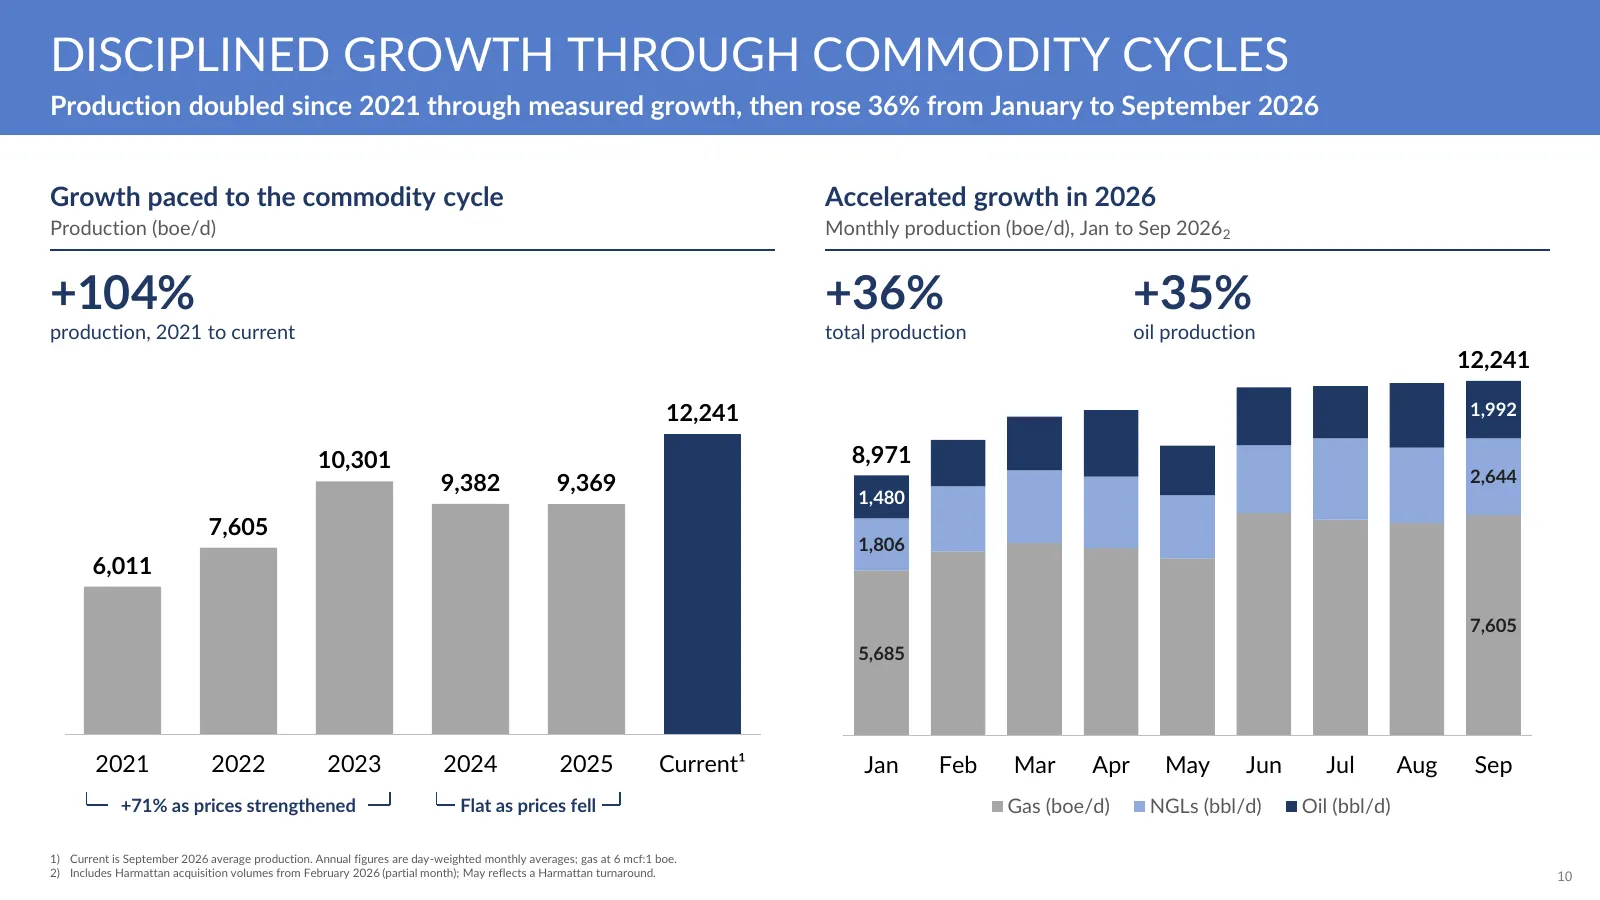
DISCIPLINED GROWTH THROUGH COMMODITY CYCLES Production doubled since 2021 through measured growth, then rose 36% from January to September 2026 Growth paced to the commodity cycle Accelerated growth in 2026 Production (boe/d) Monthly production (boe/d), Jan to Sep 20262 +104% +36% +35% production, 2
Slide 11: Reasons to Own PRQ Today
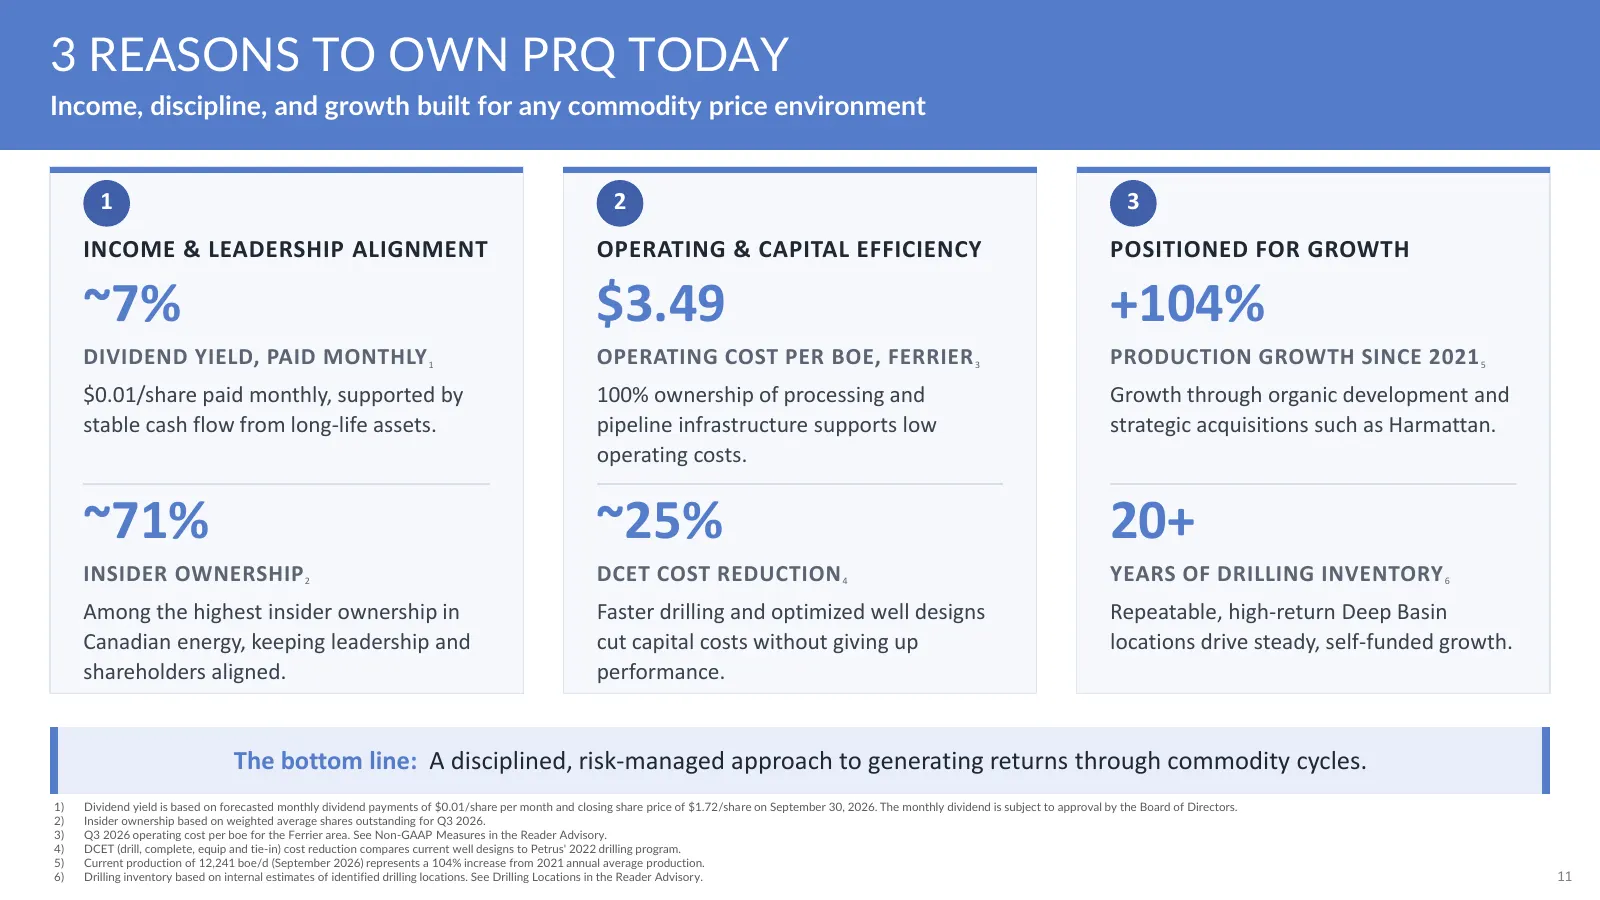
3 REASONS TO OWN PRQ TODAY Income, discipline, and growth built for any commodity price environment 1 2 3 INCOME & LEADERSHIP ALIGNMENT OPERATING & CAPITAL EFFICIENCY POSITIONED FOR GROWTH ~7% $3.49 +104% DIVIDEND YIELD, PAID MONTHLY 1 OPERATING COST PER BOE, FERRIER 3 PRODUCTION GROWTH SINCE 2021 5
Slide 12: Creating Value: No Hype. Just Returns.
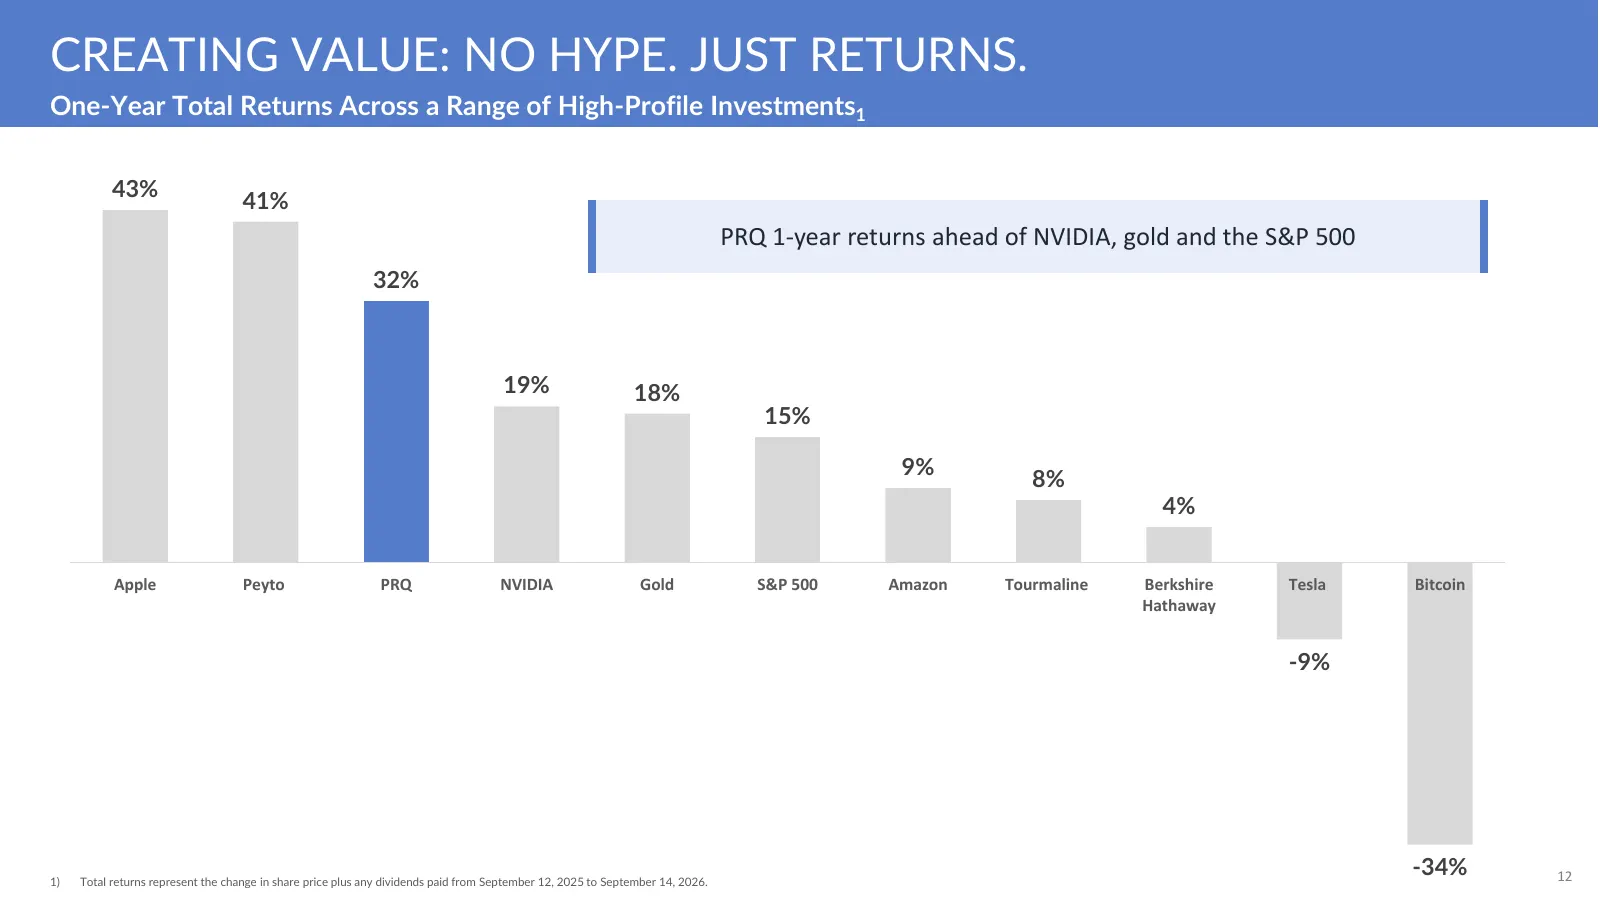
CREATING VALUE: NO HYPE. JUST RETURNS. One-Year Total Returns Across a Range of High-Profile Investments1 43% 41% PRQ 1-year returns ahead of NVIDIA, gold and the S&P 500 32% 19% 18% 15% 9% 8% 4% Apple Peyto PRQ NVIDIA Gold S&P 500 Amazon Tourmaline Berkshire Tesla Bitcoin Hathaway -9% 1) Total retu
Slide 13: Contact Us
CONTACT US Suite 1110, 240-4th Ave SW Calgary, Alberta T2P 4H4 www.petrusresources.com For more information: Ken Gray, President & CEO 403-930-0889 kgray@petrusresources.com Lindsay Hatcher, VP Commercial & Corporate Development 587-349-5823 lhatcher@petrusresources.com 13
Slide 14: Appendix
APPENDIX Supplementary Information 14
Slide 15: Reader Advisory
READER ADVISORY Certain information regarding Petrus Resources Ltd. ("Petrus", "our" or "we" or the "Company") set forth in this document may constitute forward-looking statements under applicable securities laws, including, but not limited to, the following: Petrus' business model, including planne
Slide 16: Reader Advisory (Continued)
READER ADVISORY Continued Capital costs to drill, complete and tie-in wells and operating costs in each area are also based on management's experience and not on historical data. In addition, such costs are based on management's estimates when the estimates were prepared and have not been escalated
Source: company website
More decks from Petrus Resources Ltd.
 Q2 2026 Earnings Presentation21 slides · Aug 6, 2026
 Q4 2025 Earnings Presentation21 slides · Mar 19, 2026
 Q2 2025 Earnings Presentation18 slides · Aug 8, 2025
 Q3 2021 Earnings Presentation24 slides · Nov 10, 2021
 Q4 2017 Earnings Presentation25 slides · Mar 8, 2018
 Investor Presentation (March 2016)21 slides · Mar 23, 2016