Petrus Resources Ltd. · TSX:PRQ
Petrus Resources — Q4 2017 Earnings Presentation
25 slides from Petrus Resources's earnings presentation, Mar 8, 2018
Slide 1: Focused - Efficient - Sustainable
TSX: PRQ FOCUSED - EFFICIENT - SUSTAINABLE March 8, 2018 1
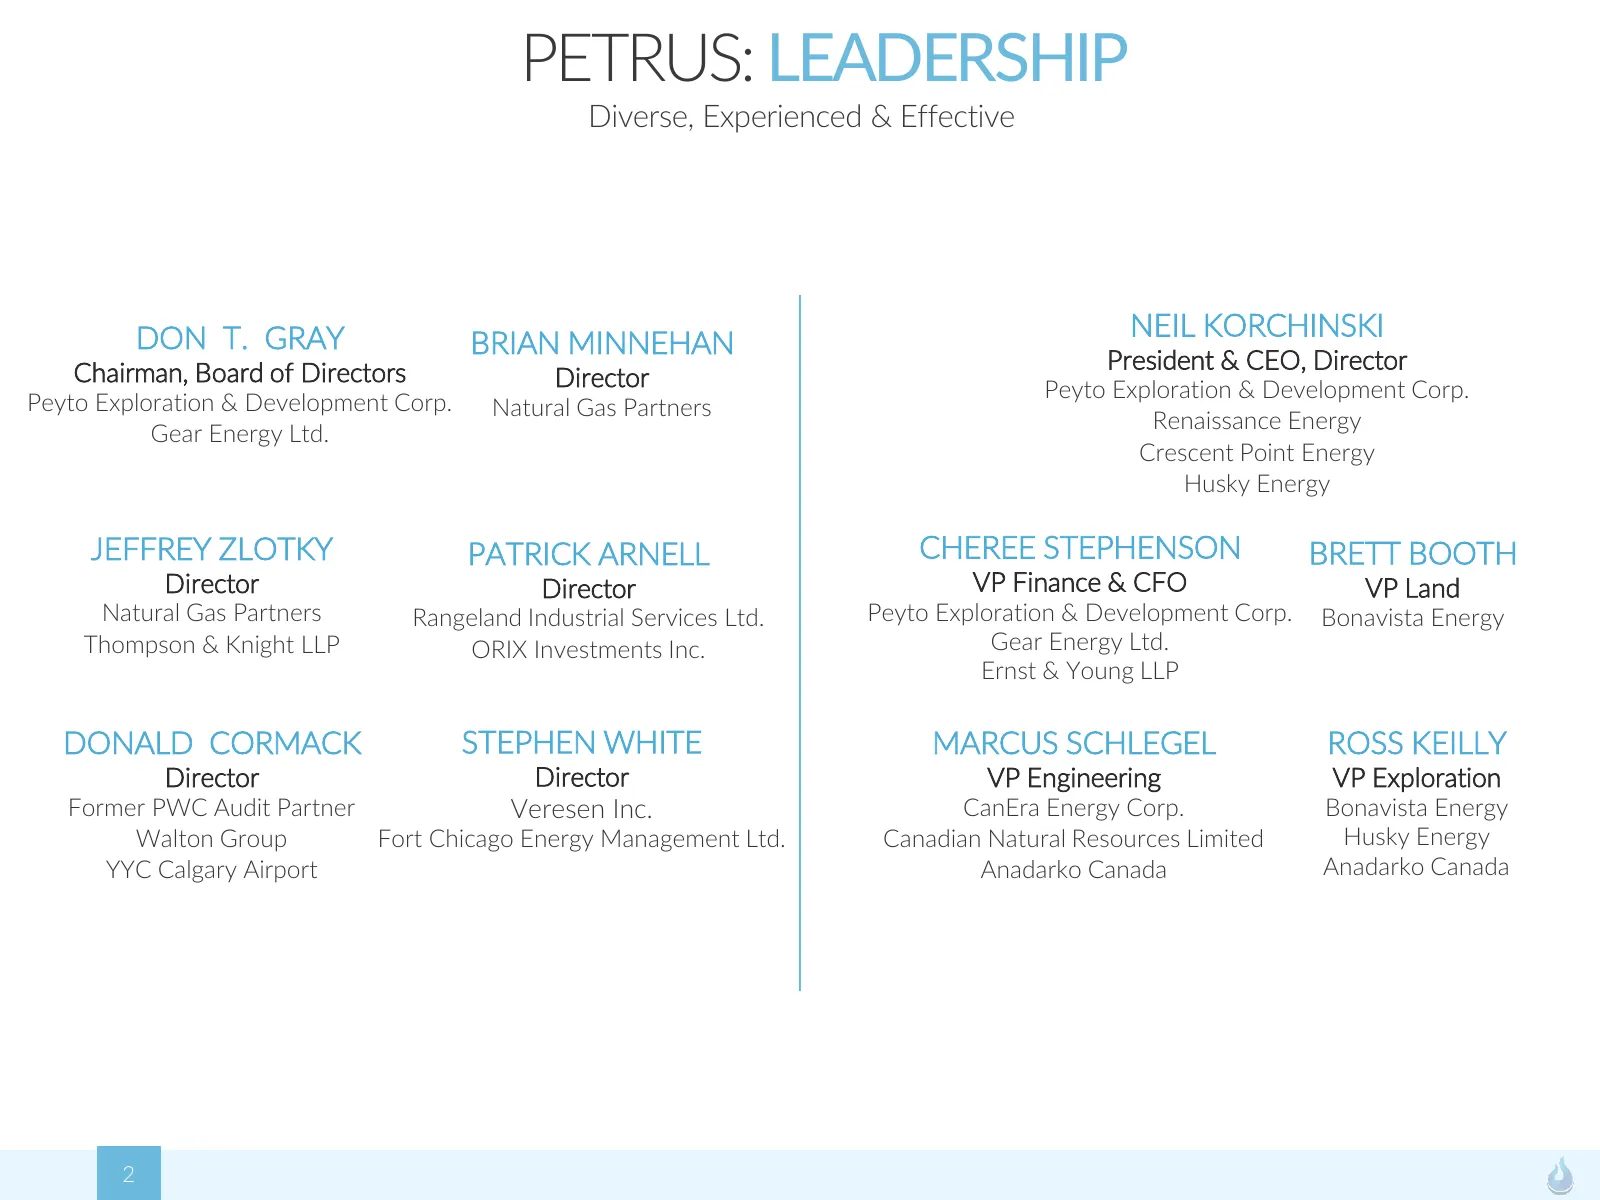
Slide 2: Petrus: Leadership
PETRUS: LEADERSHIP Diverse, Experienced & Effective DON T. GRAY NEIL KORCHINSKI BRIAN MINNEHAN President & CEO, Director Chairman, Board of Directors Director Peyto Exploration & Development Corp. Peyto Exploration & Development Corp. Natural Gas Partners Renaissance Energy Gear Energy Ltd. Crescent
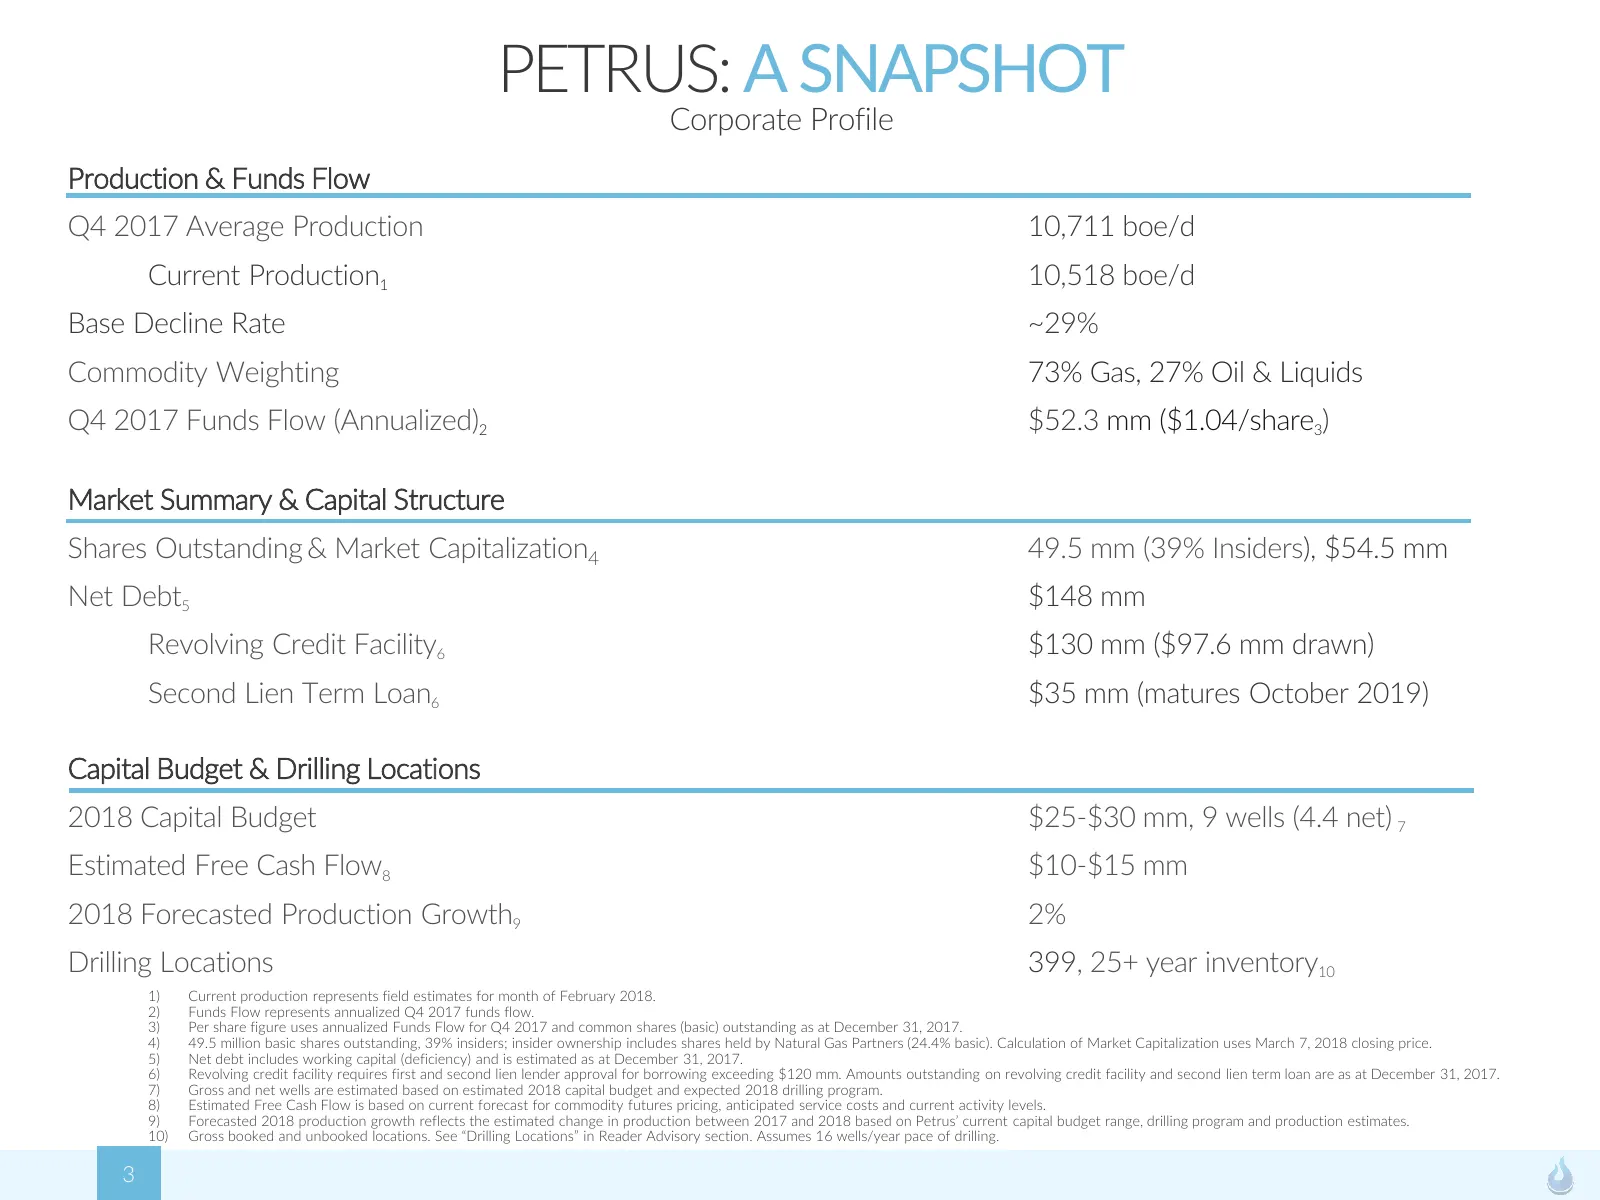
Slide 3: Petrus: A Snapshot
PETRUS: A SNAPSHOT Corporate Profile Production & Funds Flow Q4 2017 Average Production 10,711 boe/d Current Production1 10,518 boe/d Base Decline Rate ~29% Commodity Weighting 73% Gas, 27% Oil & Liquids Q4 2017 Funds Flow (Annualized)2 $52.3 mm ($1.04/share3) Market Summary & Capital Structure Shar
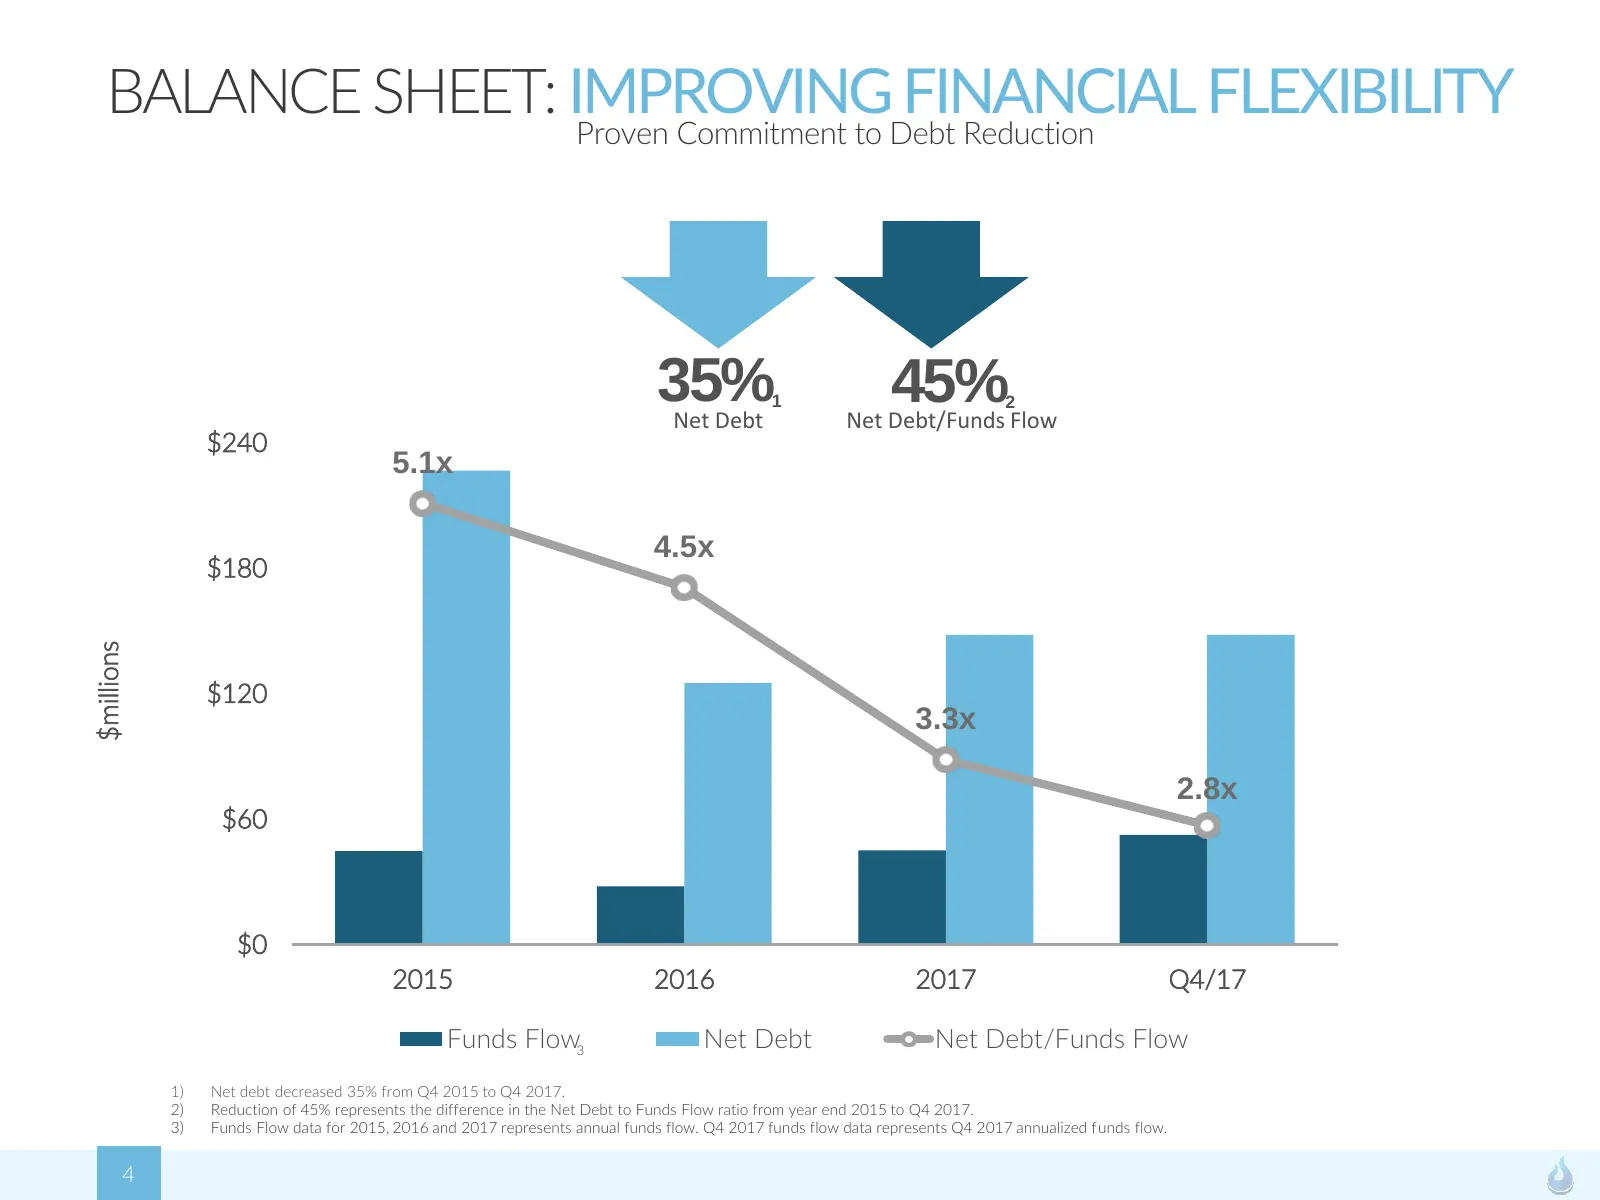
Slide 4: Balance Sheet: Improving Financial Flexibility
BALANCE SHEET: IMPROVING FINANCIAL Proven Commitment to Debt Reduction FLEXIBILITY 35% Net Debt 1 45% Net Debt/Funds Flow 2 $240 5.1x 4.5x $180 $millions $120 3.3x 2.8x $60 $0 2015 2016 2017 Q4/17 Funds Flow3 Net Debt Net Debt/Funds Flow 1) Net debt decreased 35% from Q4 2015 to Q4 2017. 2) Reductio
Slide 5: Cost Management: Production Costs
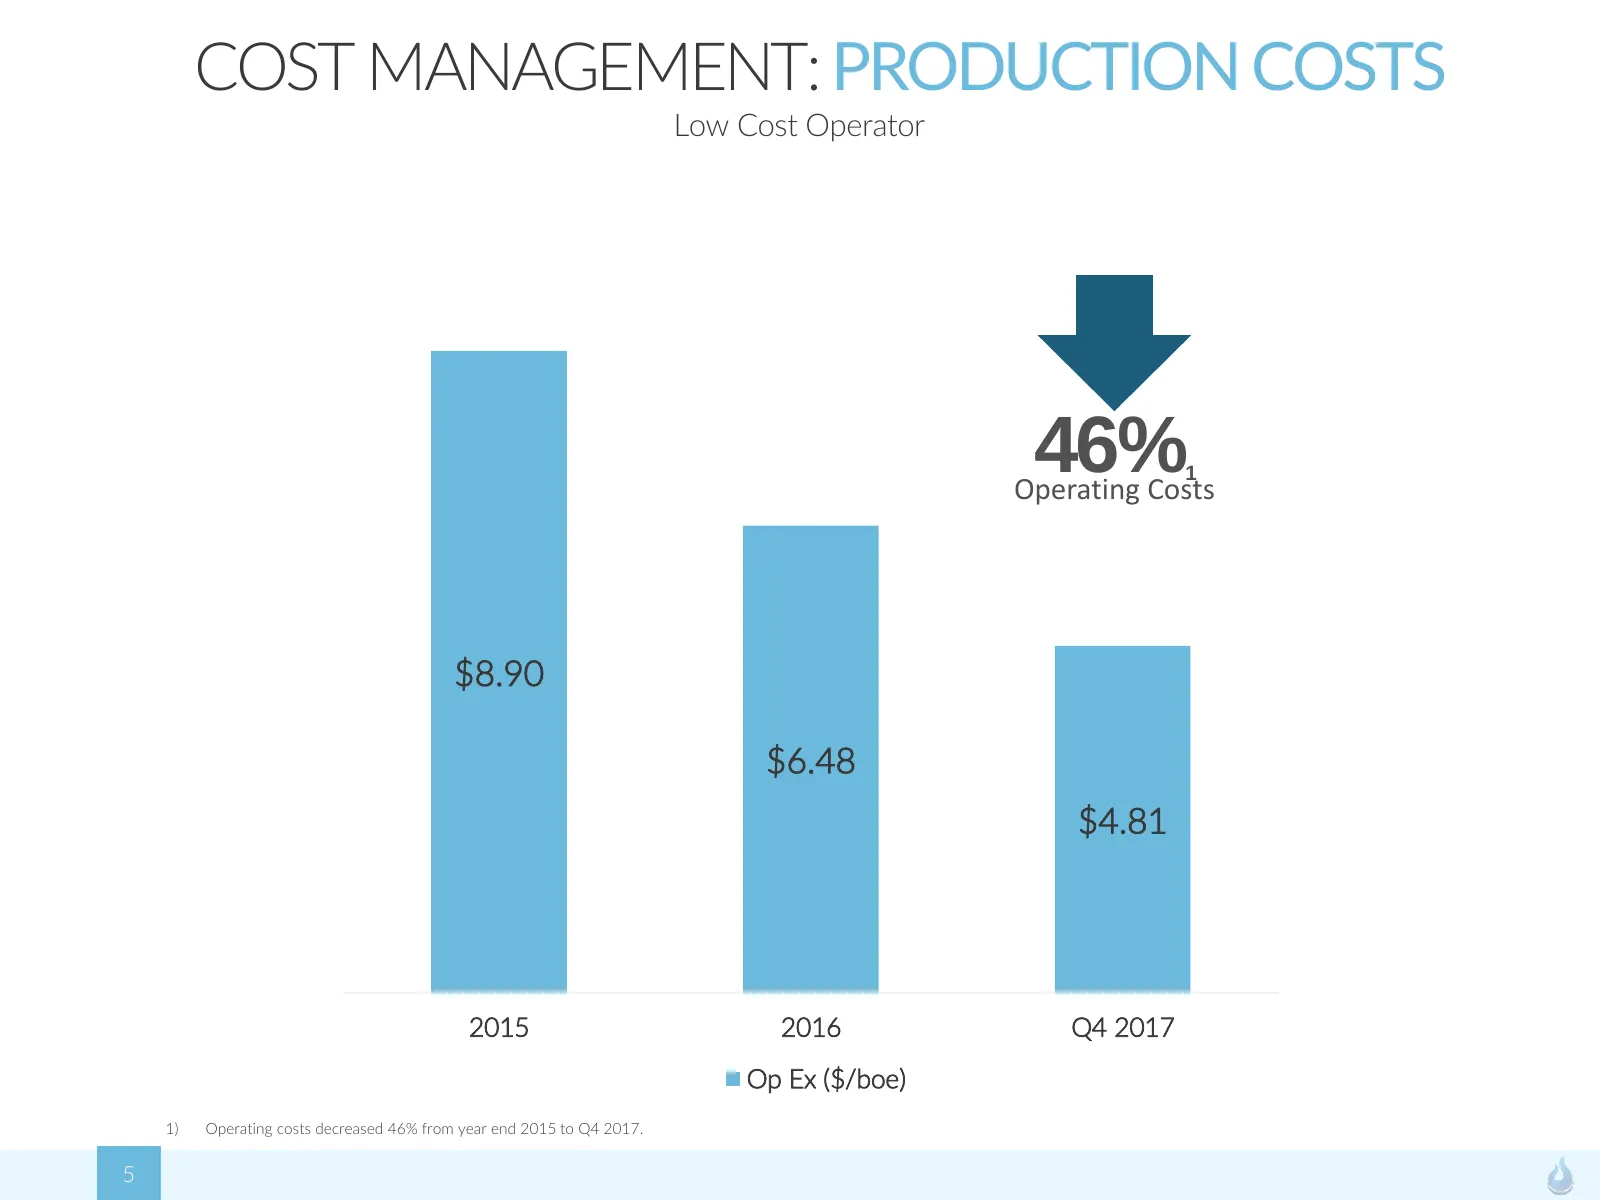
COST MANAGEMENT: PRODUCTION COSTS Low Cost Operator 46% 1 Operating Costs $8.90 $6.48 $4.81 2015 2016 Q4 2017 Op Ex ($/boe) 1) Operating costs decreased 46% from year end 2015 to Q4 2017. 5
Slide 6: Production: Organic Growth
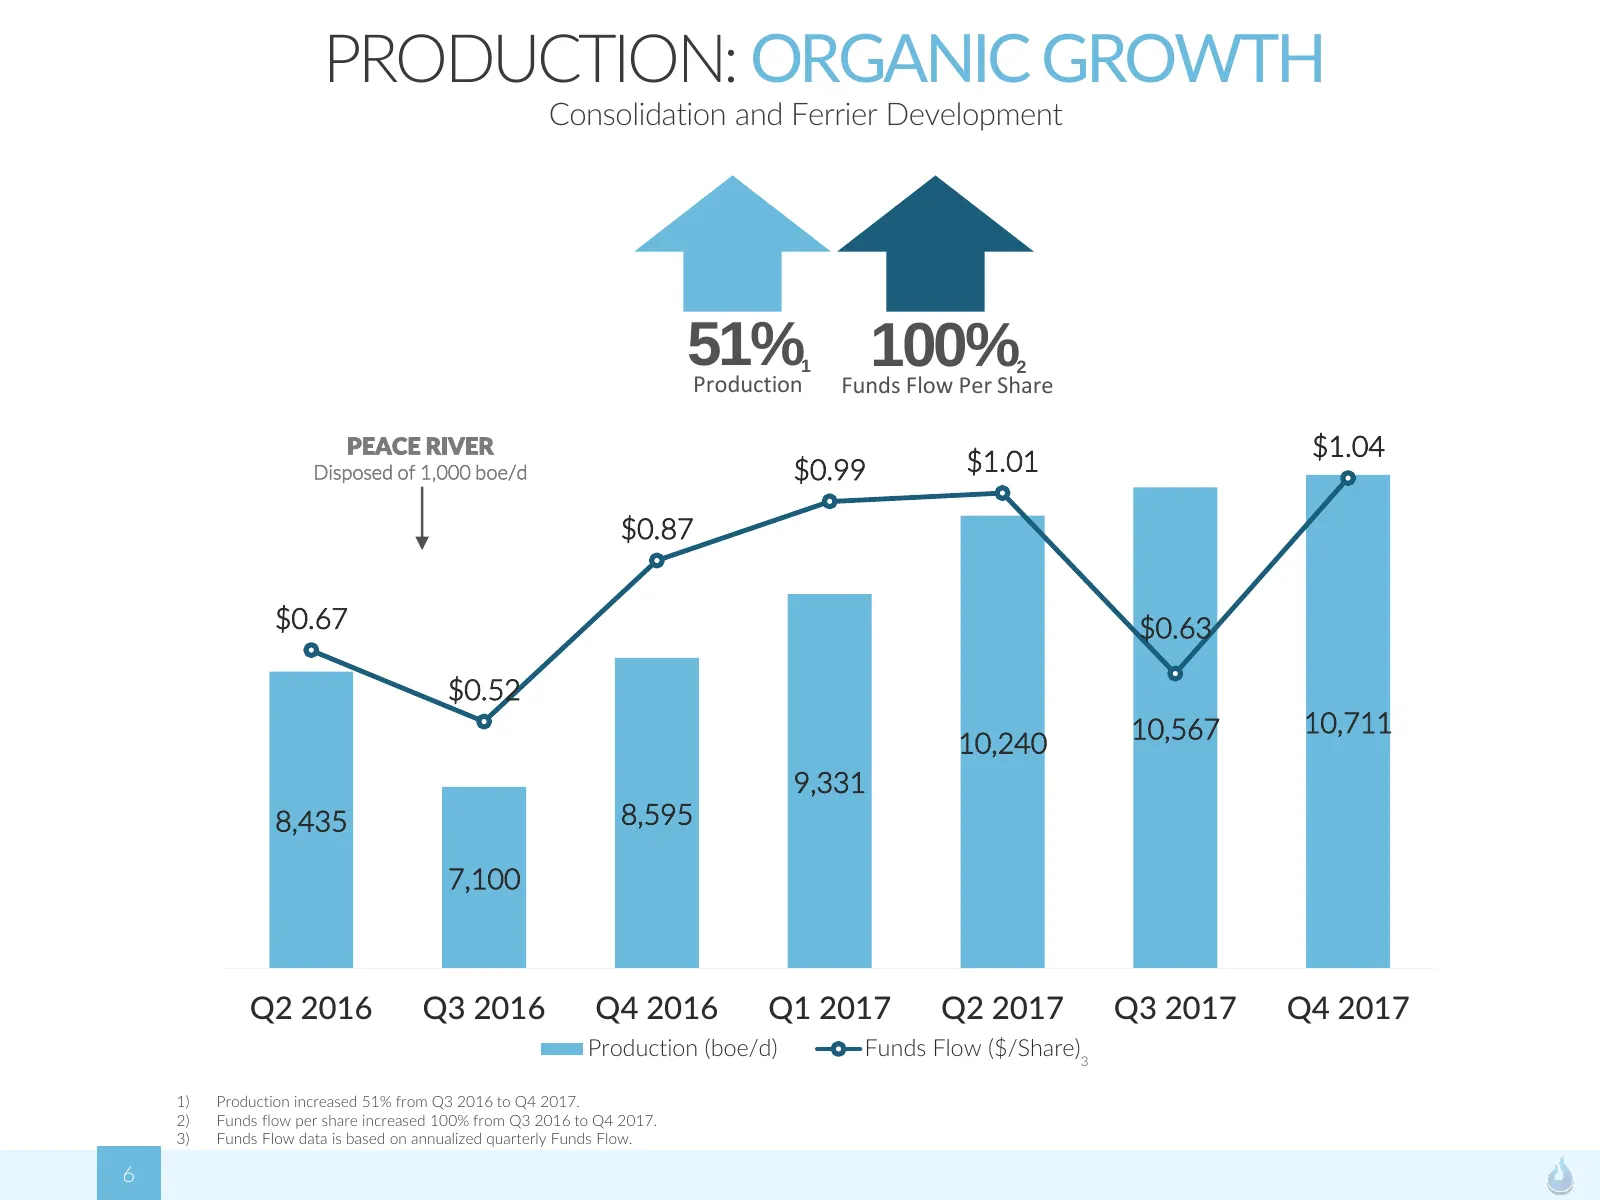
PRODUCTION: ORGANIC GROWTH Consolidation and Ferrier Development 51% 1 Production 100% 2 Funds Flow Per Share PEACE RIVER $1.04 Disposed of 1,000 boe/d $0.99 $1.01 $0.87 $0.67 $0.63 $0.52 10,567 10,711 10,240 9,331 8,435 8,595 7,100 Q2 2016 Q3 2016 Q4 2016 Q1 2017 Q2 2017 Q3 2017 Q4 2017 Production
Slide 7: Assets: Corporate Overview
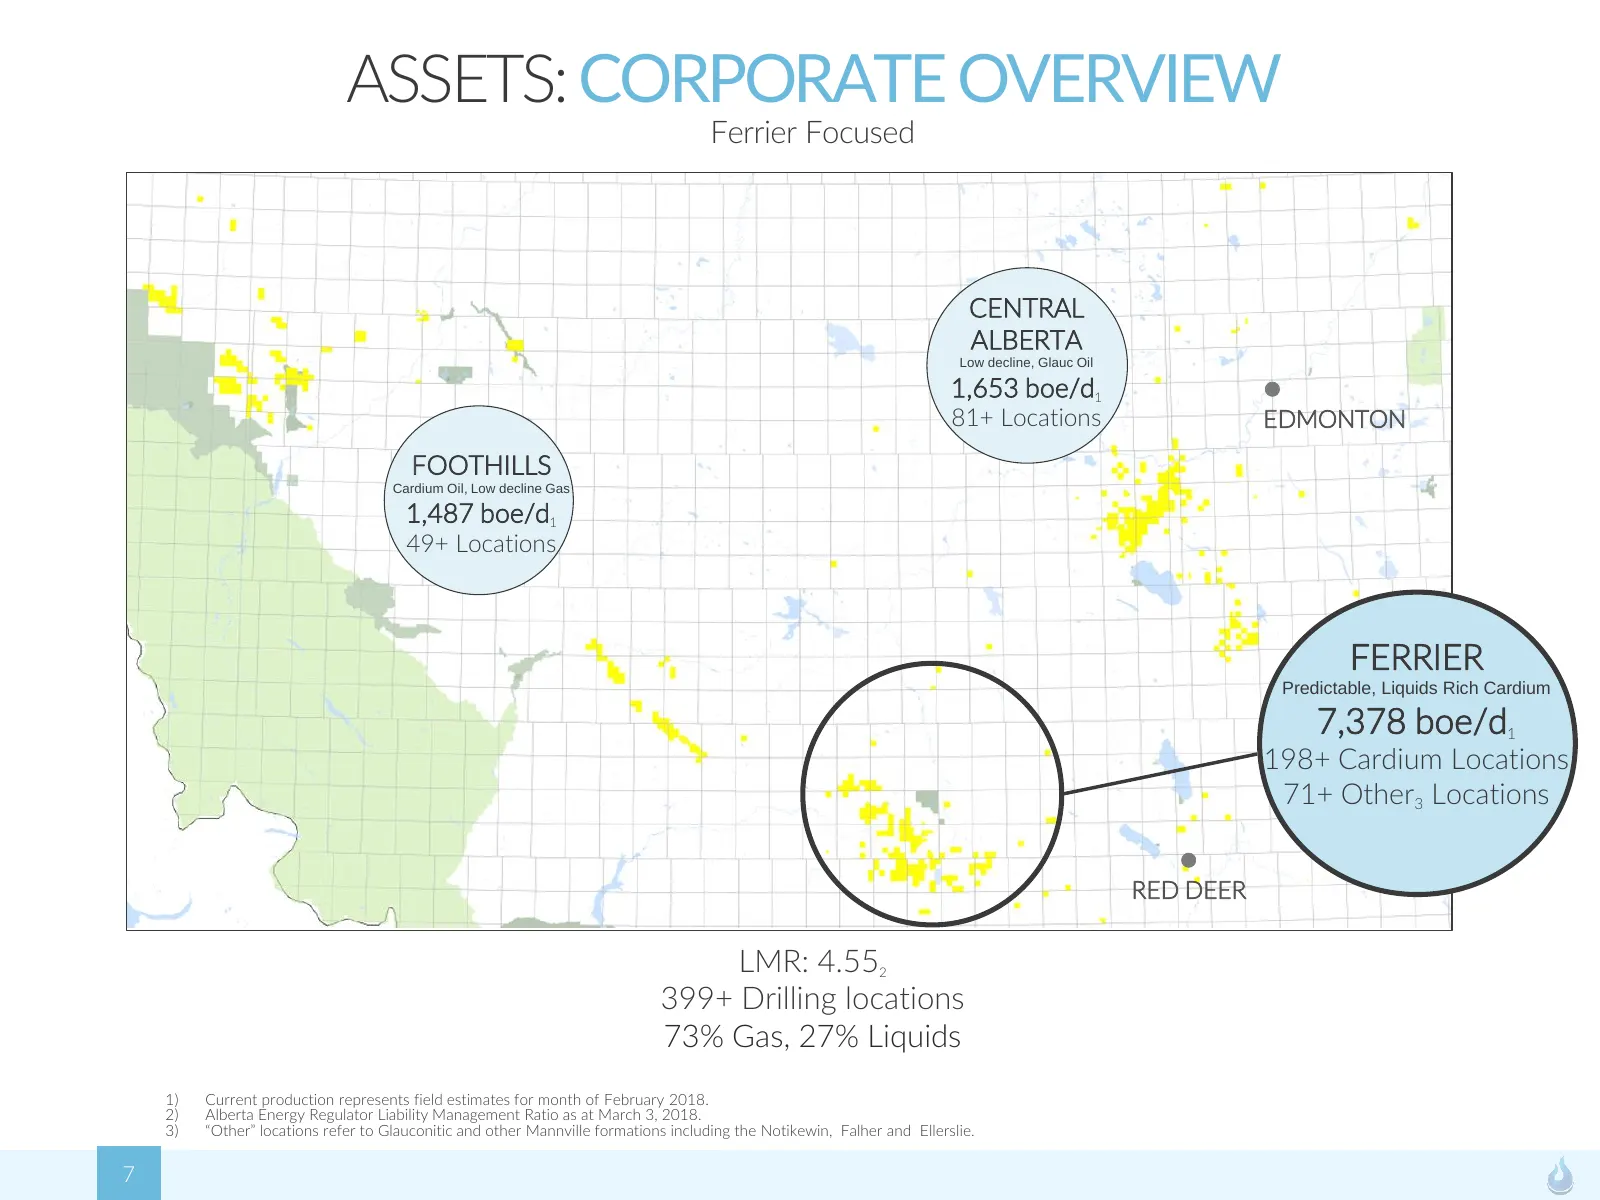
ASSETS: CORPORATE OVERVIEW Ferrier Focused CENTRAL ALBERTA Low decline, Glauc Oil 1,653 boe/d1 l 81+ Locations EDMONTON FOOTHILLS Cardium Oil, Low decline Gas 1,487 boe/d1 49+ Locations FERRIER Predictable, Liquids Rich Cardium 7,378 boe/d1 198+ Cardium Locations 71+ Other3 Locations l RED DEER LMR:
Slide 8: Assets: Ferrier
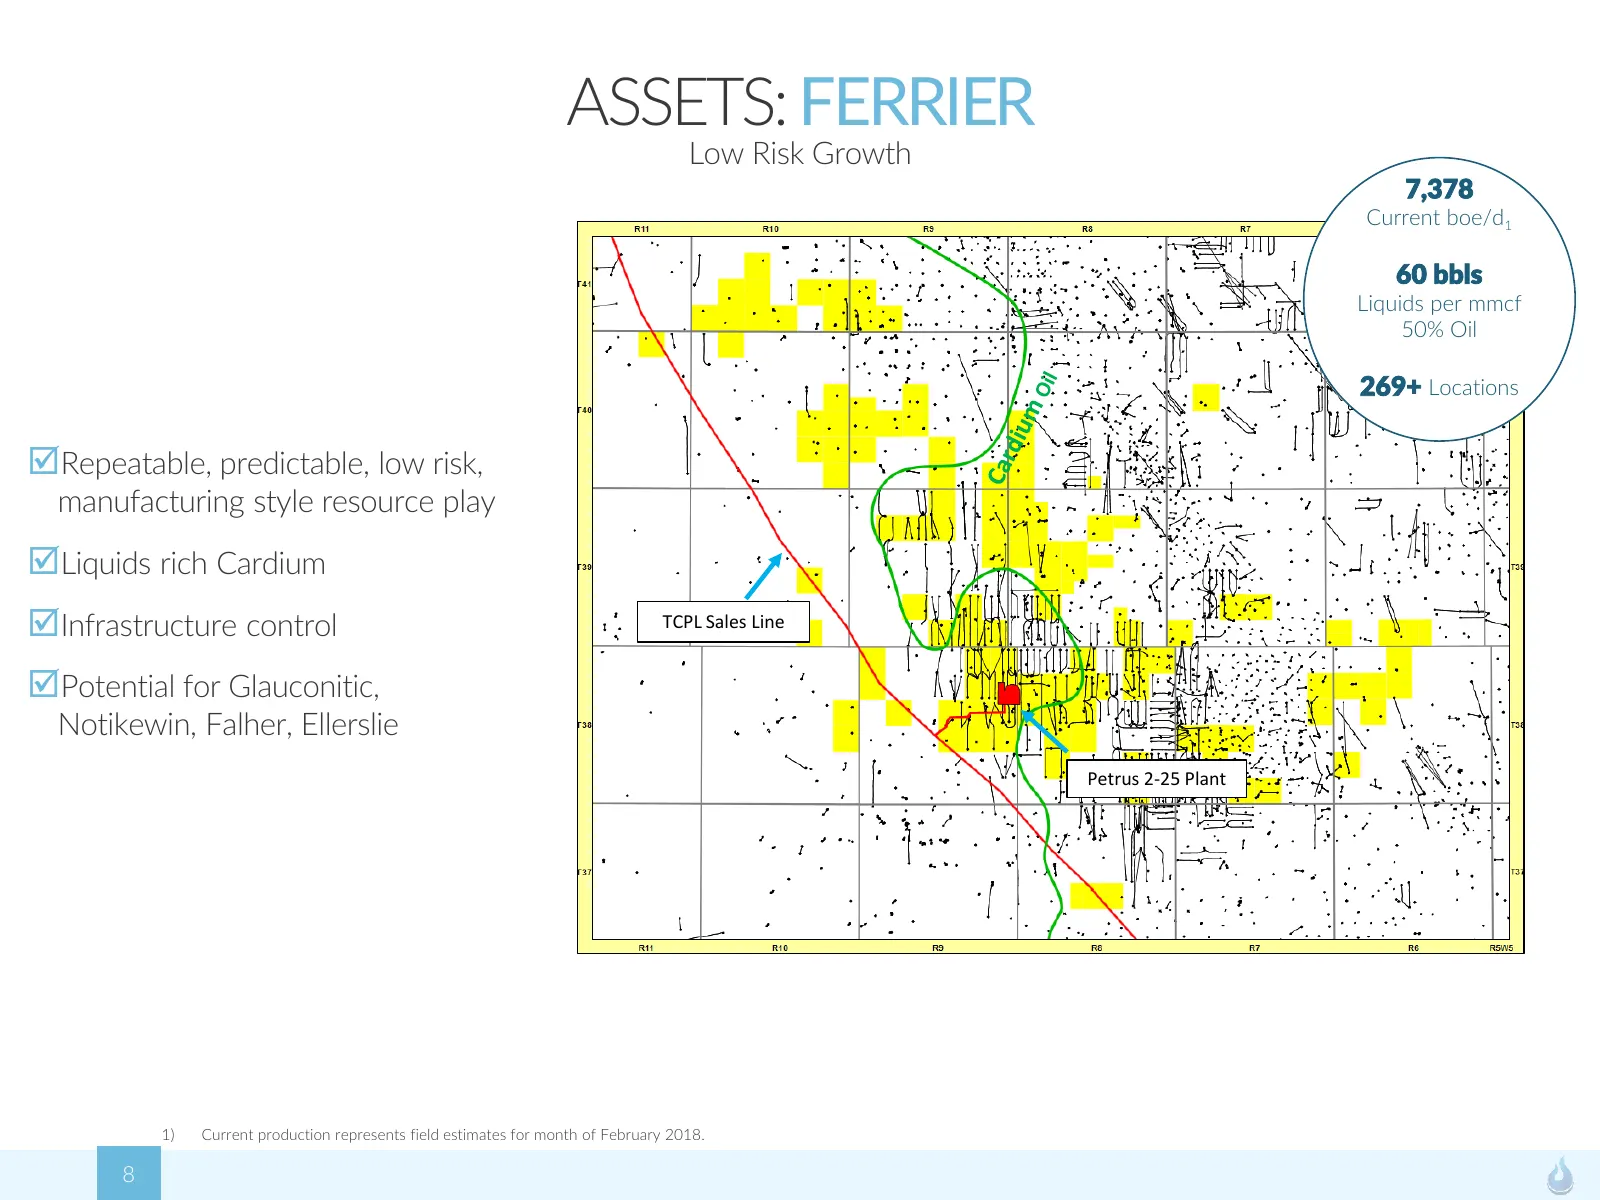
ASSETS: FERRIER Low Risk Growth 7,378 Current boe/d1 60 bbls Liquids per mmcf 50% Oil 269+ Locations Repeatable, predictable, low risk, manufacturing style resource play Liquids rich Cardium Infrastructure control TCPL Sales Line Potential for Glauconitic, Notikewin, Falher, Ellerslie Petrus 2-2
Slide 9: Ferrier: Growth
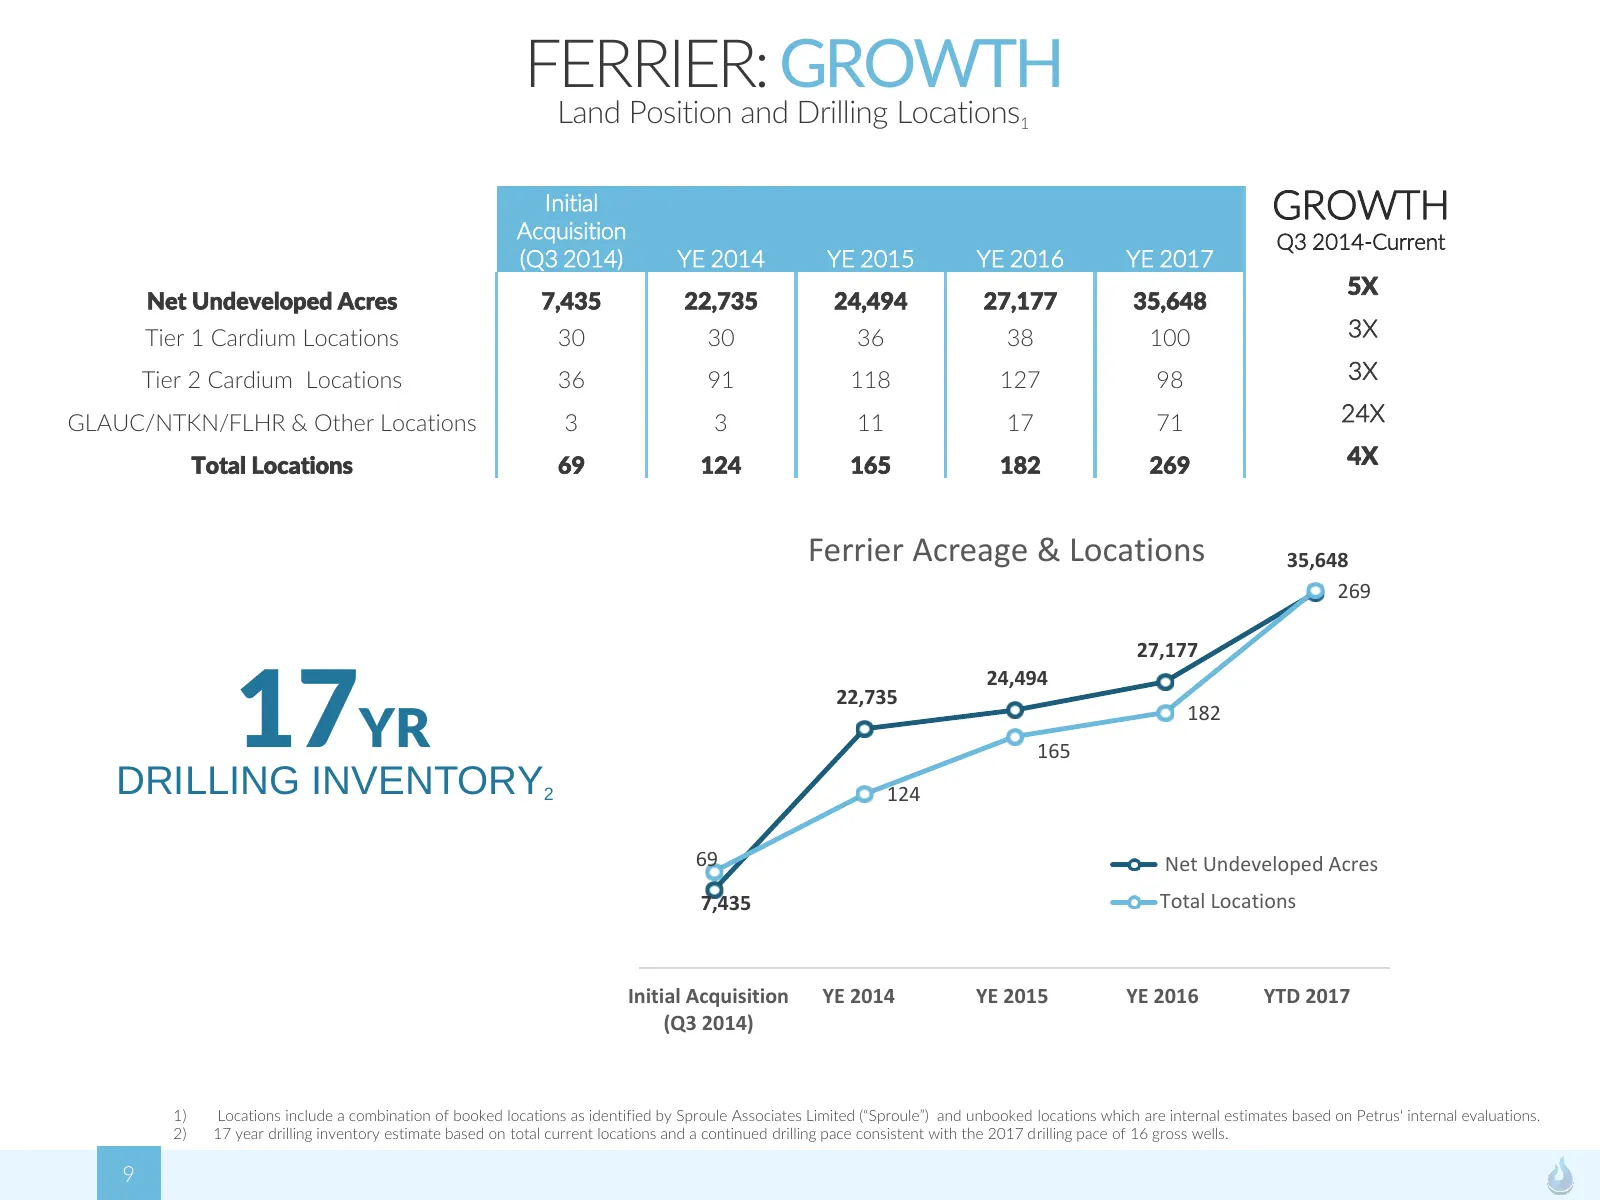
FERRIER: GROWTH Land Position and Drilling Locations1 Initial Acquisition GROWTH Q3 2014-Current (Q3 2014) YE 2014 YE 2015 YE 2016 YE 2017 5X Net Undeveloped Acres 7,435 22,735 24,494 27,177 35,648 Tier 1 Cardium Locations 30 30 36 38 100 3X Tier 2 Cardium Locations 36 91 118 127 98 3X GLAUC/NTKN/FL
Slide 10: Ferrier: Owned Infrastructure
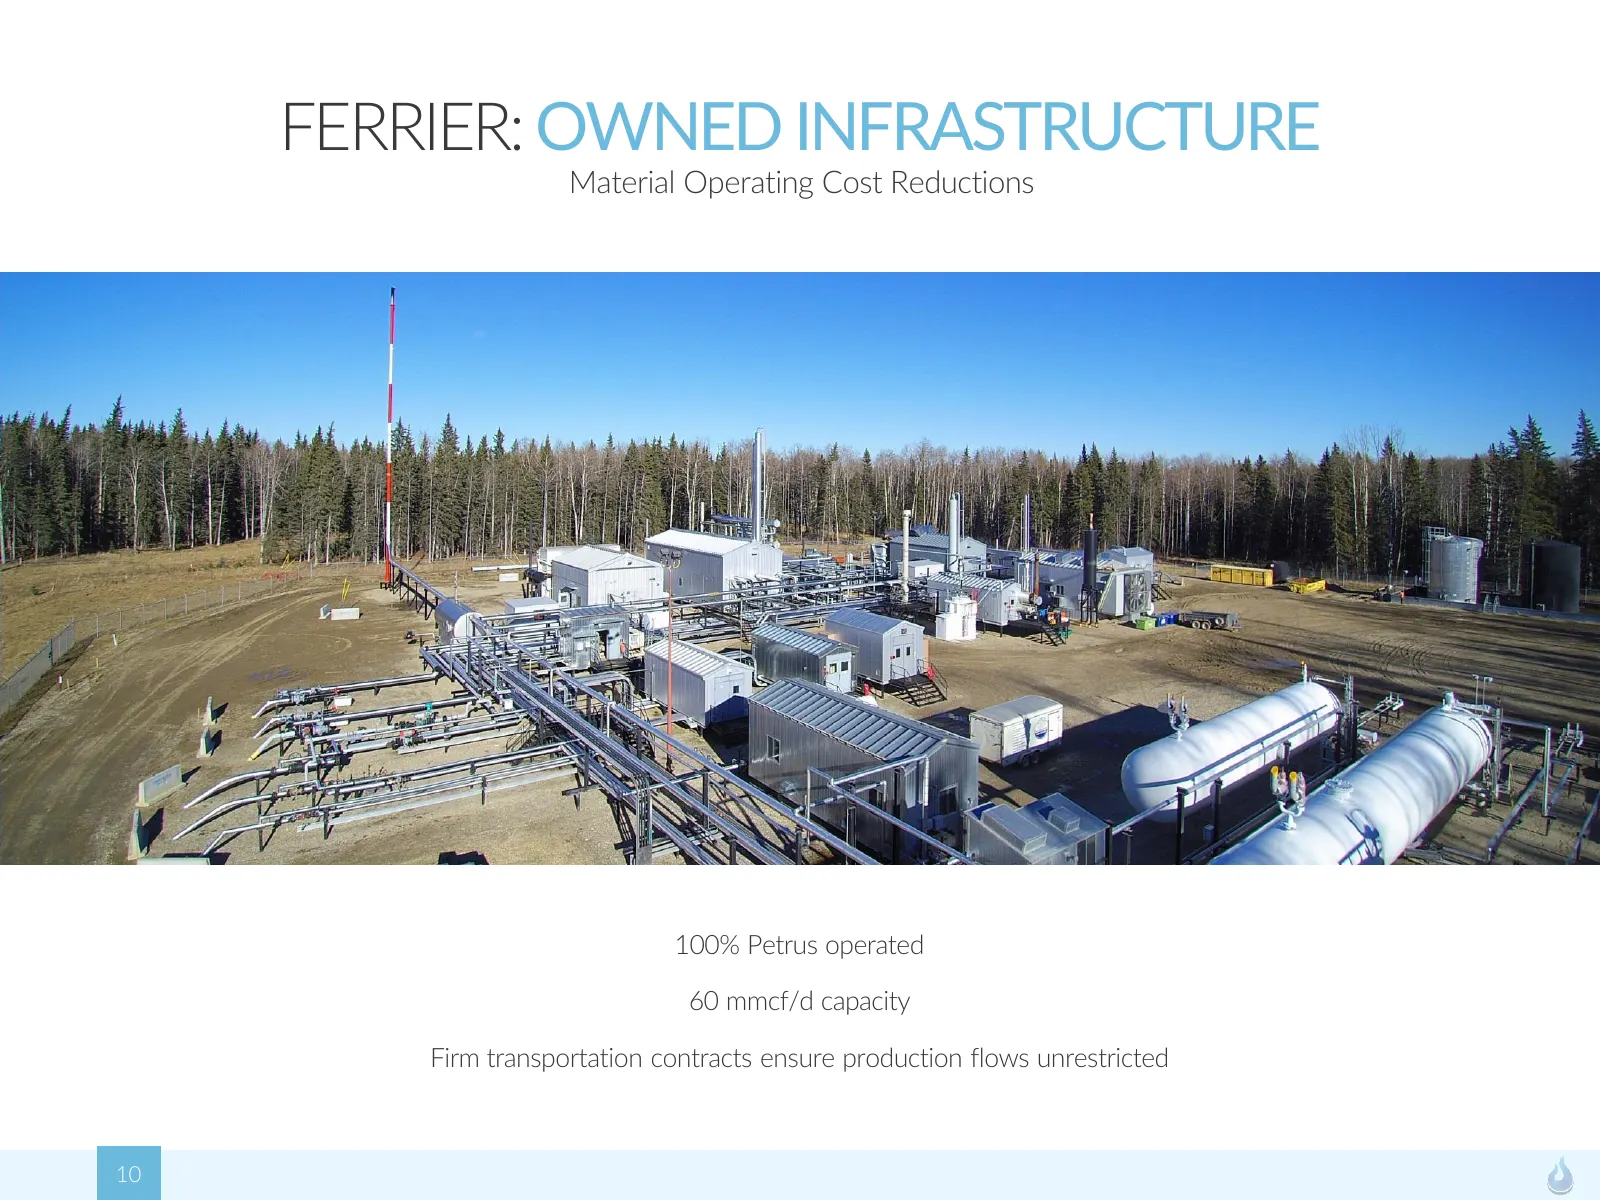
FERRIER: OWNED INFRASTRUCTURE Material Operating Cost Reductions 100% Petrus operated 60 mmcf/d capacity Firm transportation contracts ensure production flows unrestricted 10
Slide 11: Ferrier: Operating Expense
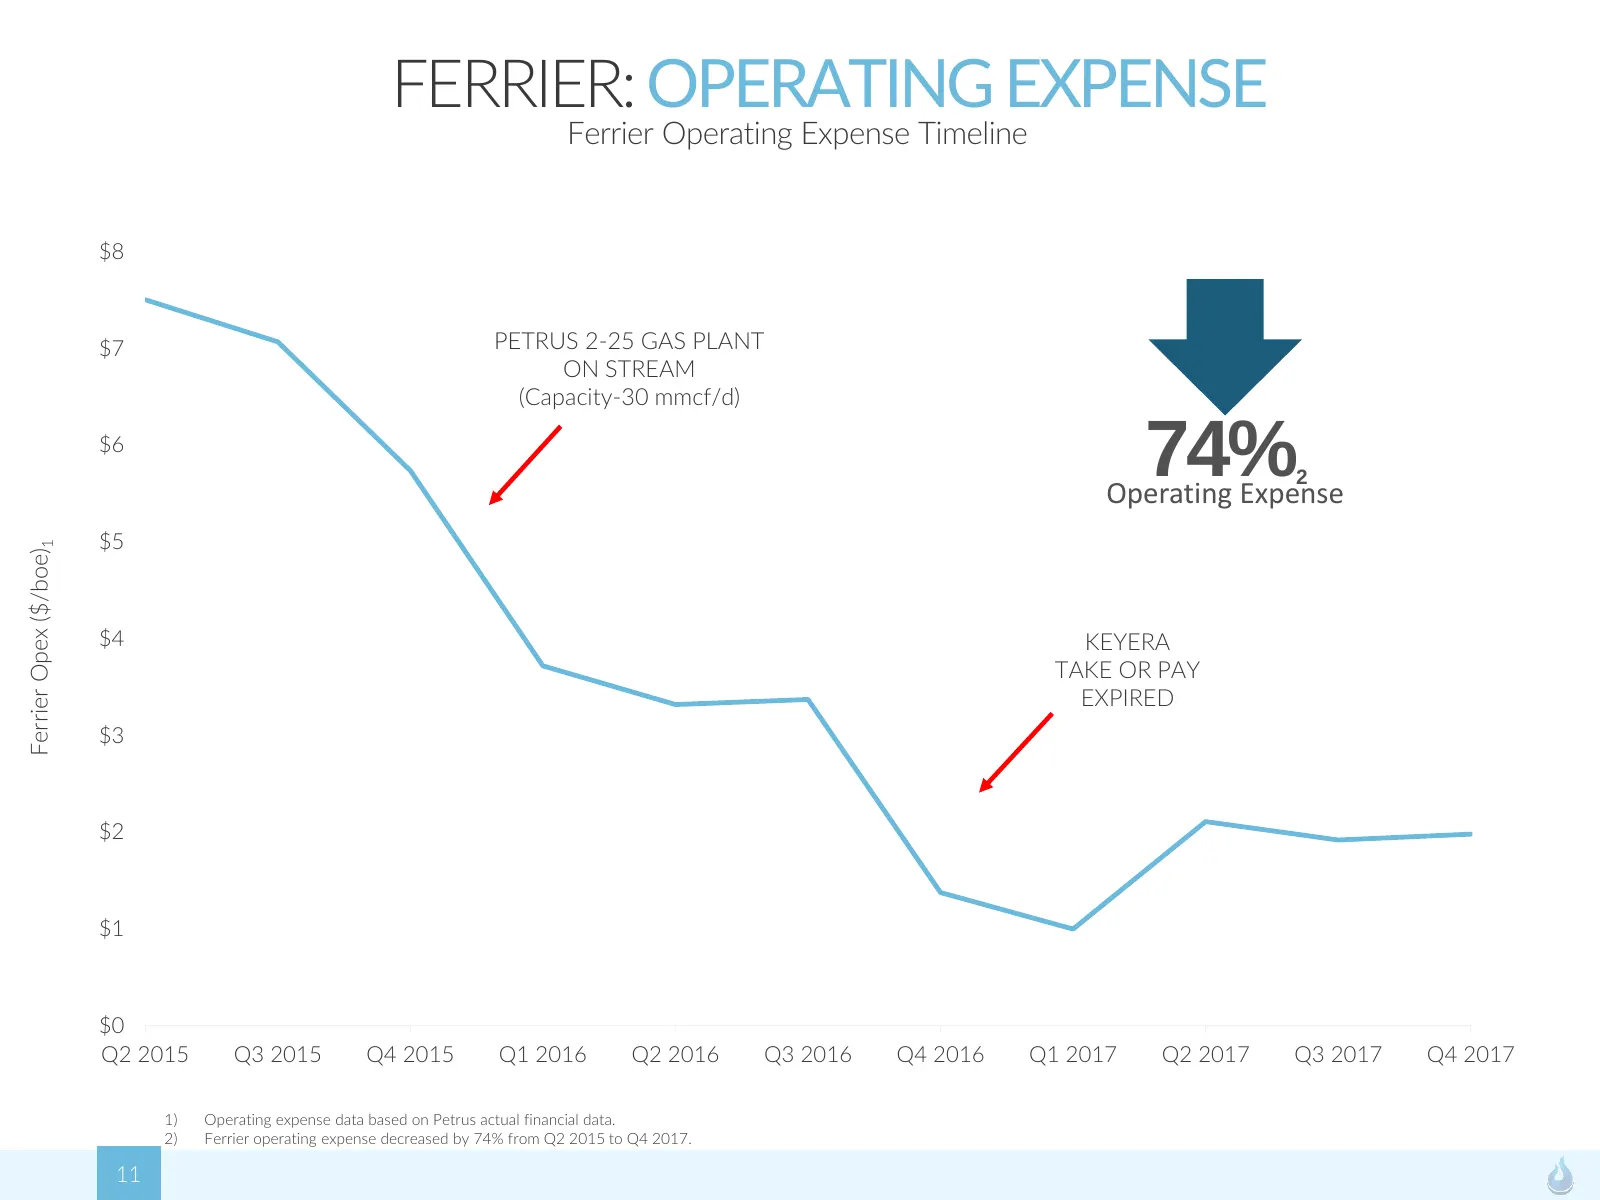
FERRIER: OPERATING EXPENSE Ferrier Operating Expense Timeline $8 $7 PETRUS 2-25 GAS PLANT ON STREAM (Capacity-30 mmcf/d) $6 74% 2 Operating Expense $5 Ferrier Opex ($/boe)1 $4 KEYERA TAKE OR PAY EXPIRED $3 $2 $1 $0 Q2 2015 Q3 2015 Q4 2015 Q1 2016 Q2 2016 Q3 2016 Q4 2016 Q1 2017 Q2 2017 Q3 2017 Q4 20
Slide 12: Ferrier: Improving Capital Efficiency
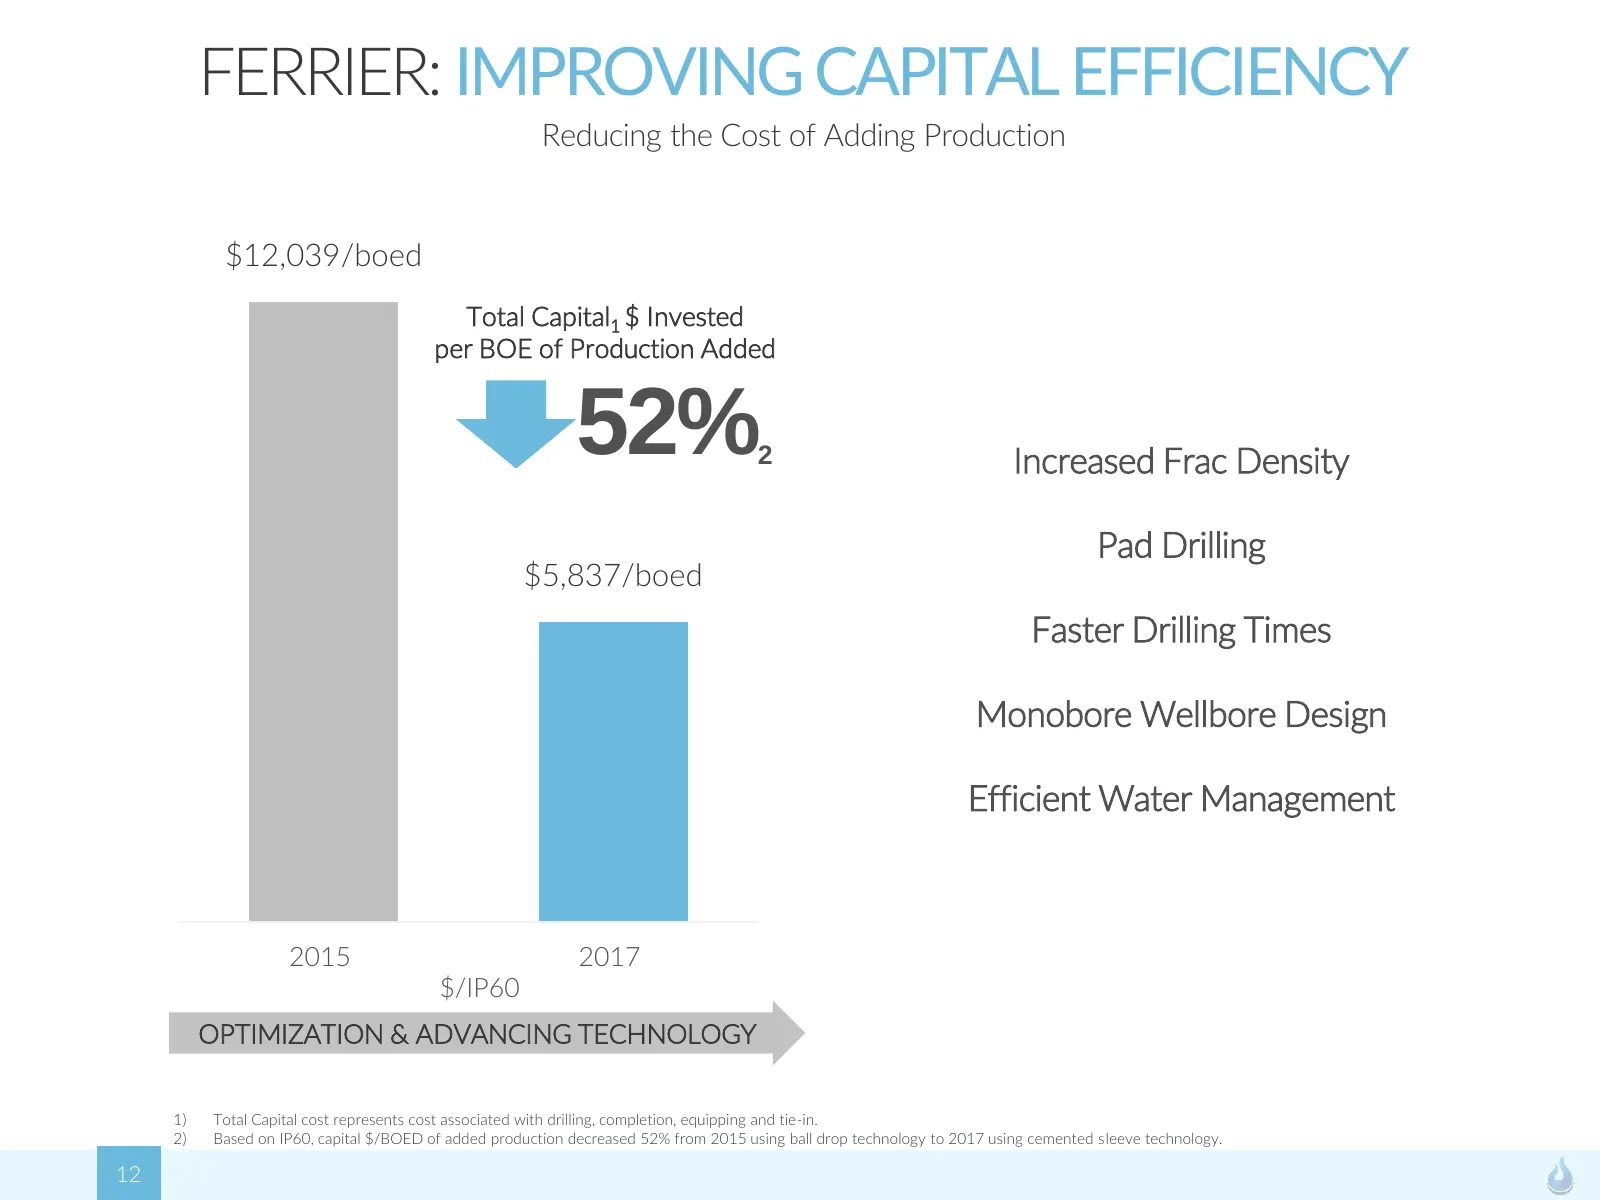
FERRIER: IMPROVING CAPITAL EFFICIENCY Reducing the Cost of Adding Production $12,039/boed Total Capital1 $ Invested per BOE of Production Added 52% 2 Increased Frac Density Pad Drilling $5,837/boed Faster Drilling Times Monobore Wellbore Design Efficient Water Management 2015 2017 $/IP60 OPTIMIZATIO
Slide 13: Ferrier: Cardium Drilling
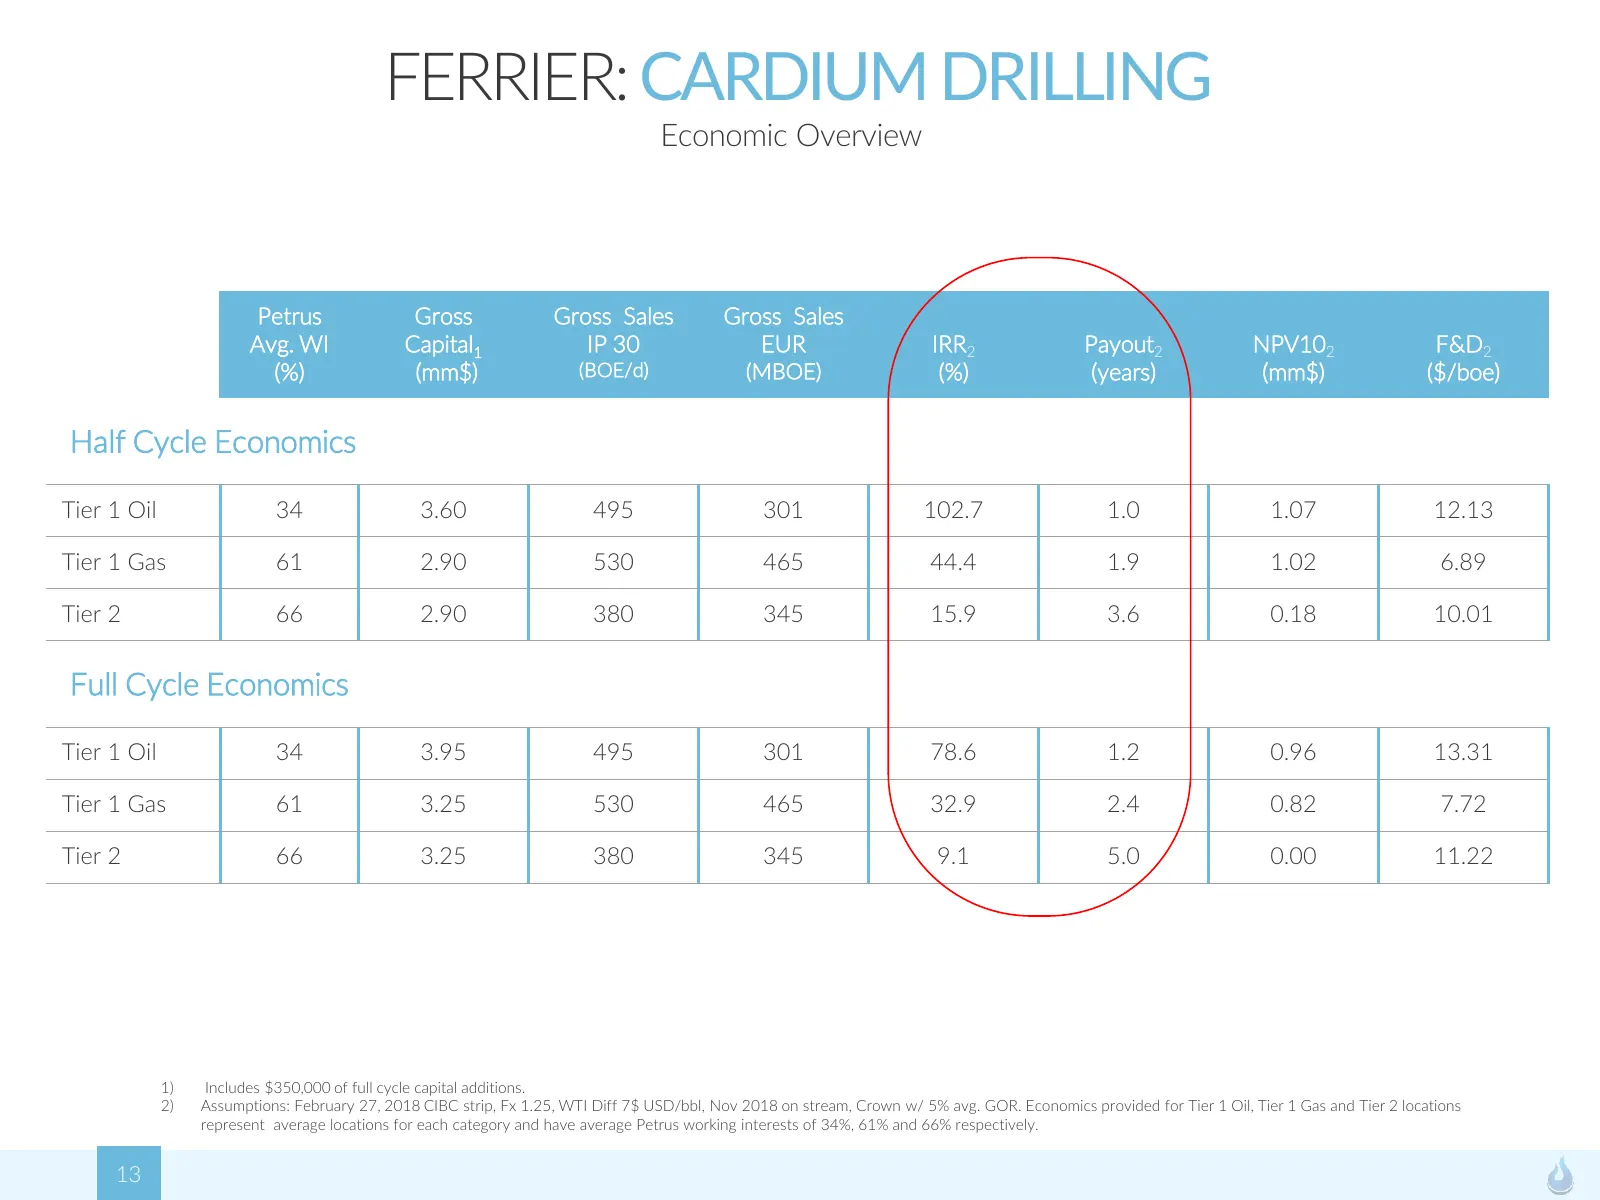
FERRIER: CARDIUM DRILLING Economic Overview Petrus Gross Gross Sales Gross Sales Avg. WI Capital1 IP 30 EUR IRR2 Payout2 NPV102 F&D2 (%) (mm$) (BOE/d) (MBOE) (%) (years) (mm$) ($/boe) Half Cycle Economics Tier 1 Oil 34 3.60 495 301 102.7 1.0 1.07 12.13 Tier 1 Gas 61 2.90 530 465 44.4 1.9 1.02 6.89 T
Slide 14: Ferrier: Economic Comparison
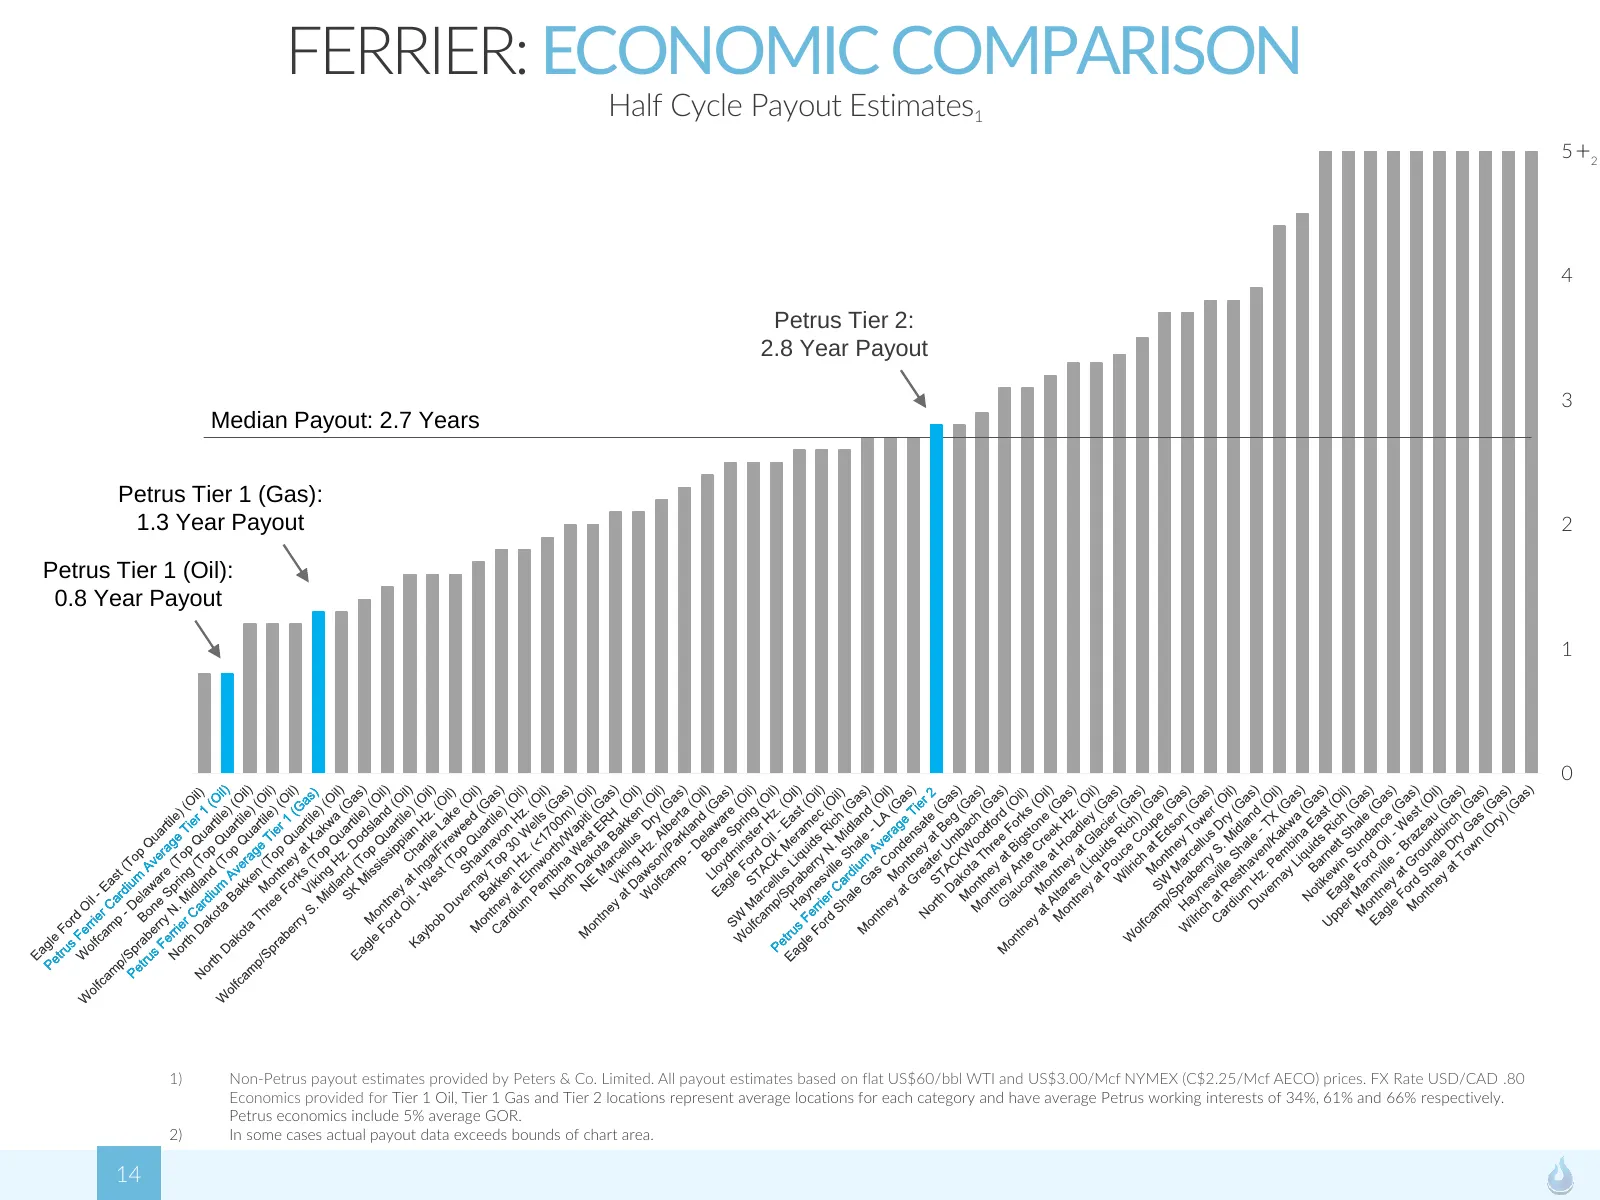
FERRIER: ECONOMIC COMPARISON Half Cycle Payout Estimates1 5 +2 4 Petrus Tier 2: 2.8 Year Payout 3 Median Payout: 2.7 Years Petrus Tier 1 (Gas): 1.3 Year Payout 2 Petrus Tier 1 (Oil): 0.8 Year Payout 1 0 1) Non-Petrus payout estimates provided by Peters & Co. Limited. All payout estimates based on fl
Slide 15: Assets: Central
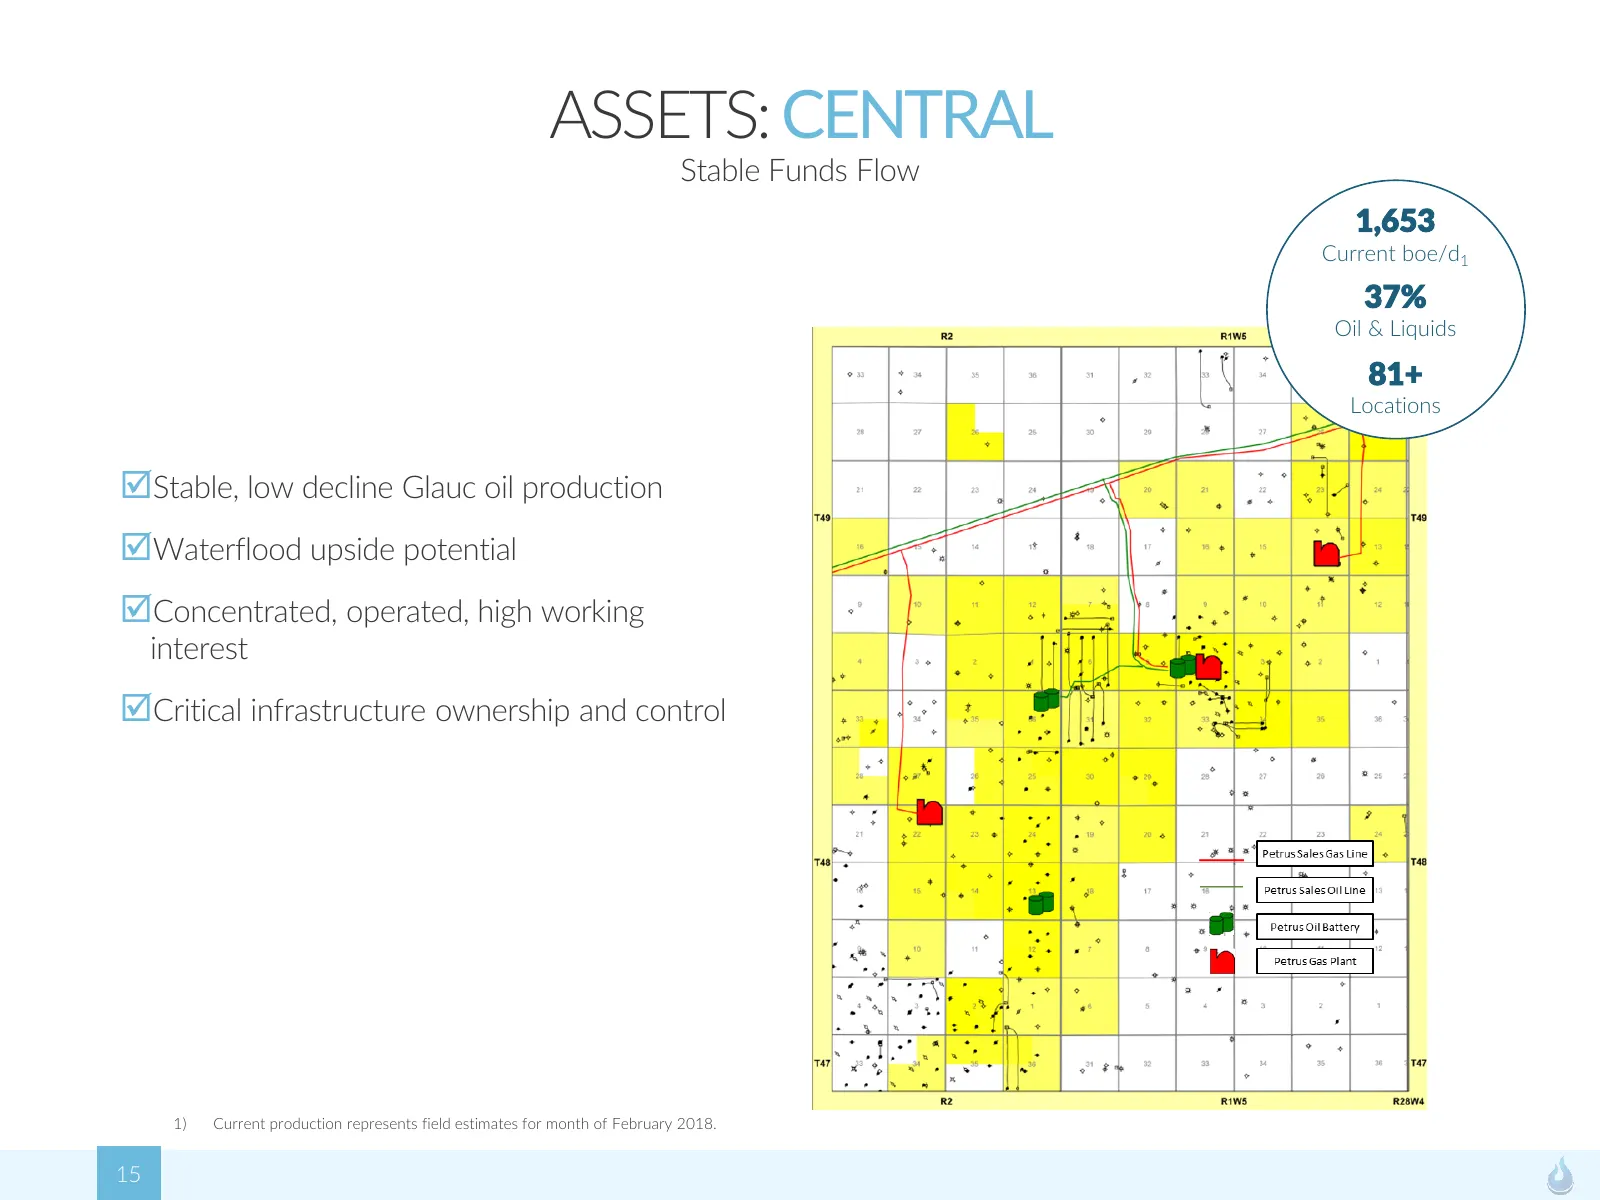
ASSETS: CENTRAL Stable Funds Flow 1,653 Current boe/d1 37% Oil & Liquids 81+ Locations Stable, low decline Glauc oil production Waterflood upside potential Concentrated, operated, high working interest Critical infrastructure ownership and control 1) Current production represents field estimates
Slide 16: Central: Waterflood Overview
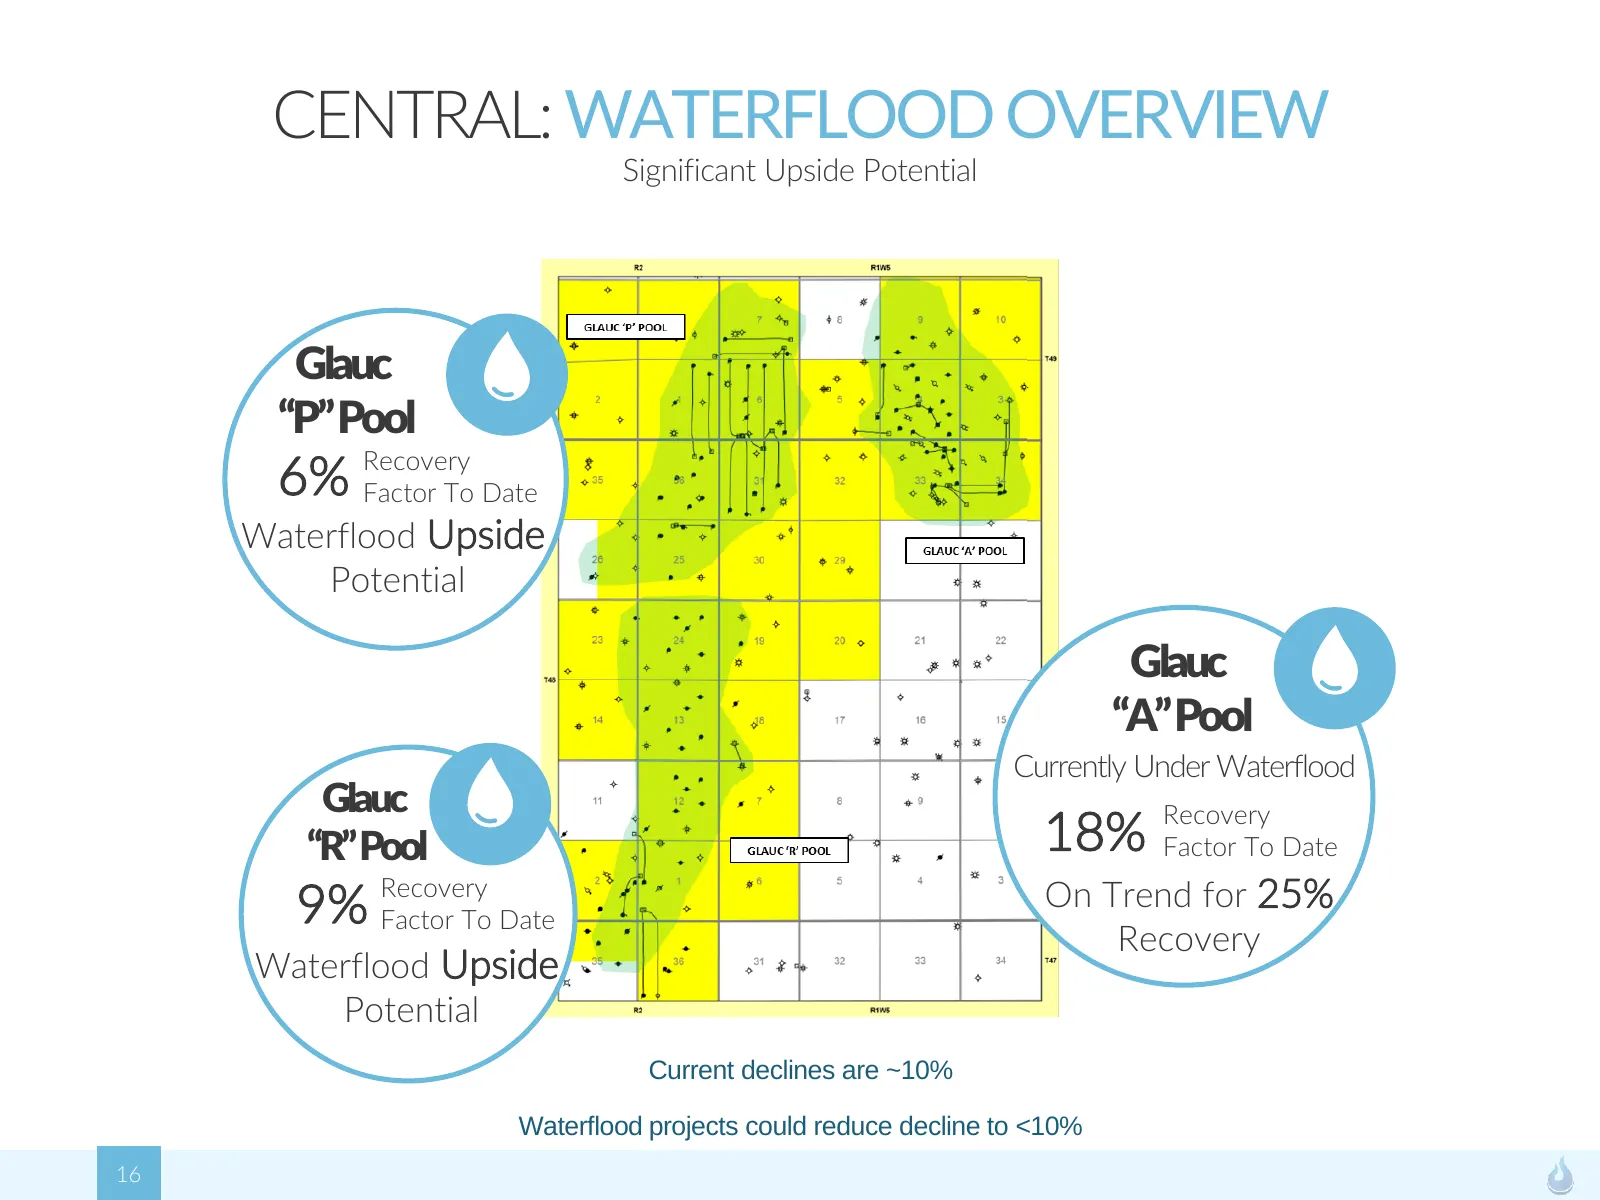
CENTRAL: WATERFLOOD OVERVIEW Significant Upside Potential Glauc “P” Pool 6% Recovery Factor To Date Waterflood Upside Potential Glauc “A” Pool Currently Under Waterflood Glauc “R”Pool 18% Recovery Factor To Date 9% Recovery On Trend for 25% Factor To Date Recovery Waterflood Upside Potential Current
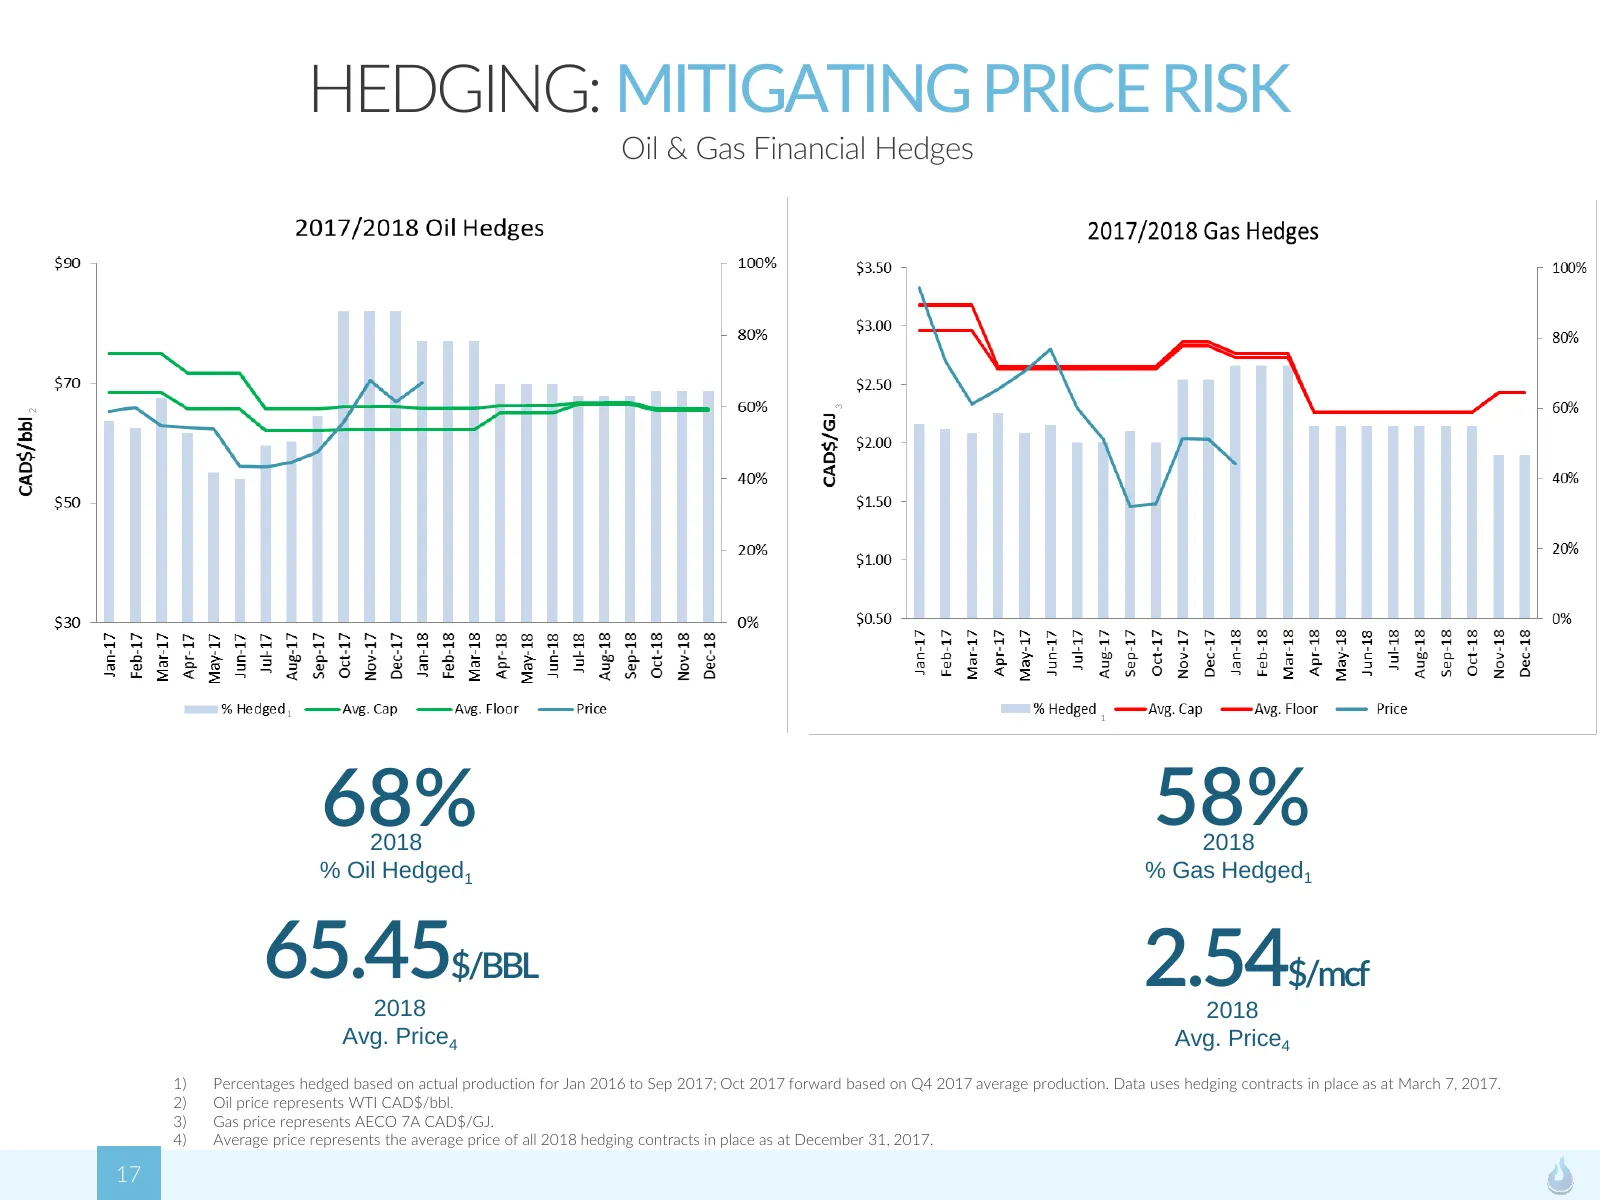
Slide 17: Hedging: Mitigating Price Risk
HEDGING: MITIGATING PRICE RISK Oil & Gas Financial Hedges 3 2 1 1 68% 2018 58%2018 % Oil Hedged1 % Gas Hedged1 65.45$/BBL 2018 2.54$/mcf 2018 Avg. Price4 Avg. Price4 1) Percentages hedged based on actual production for Jan 2016 to Sep 2017; Oct 2017 forward based on Q4 2017 average production. Data
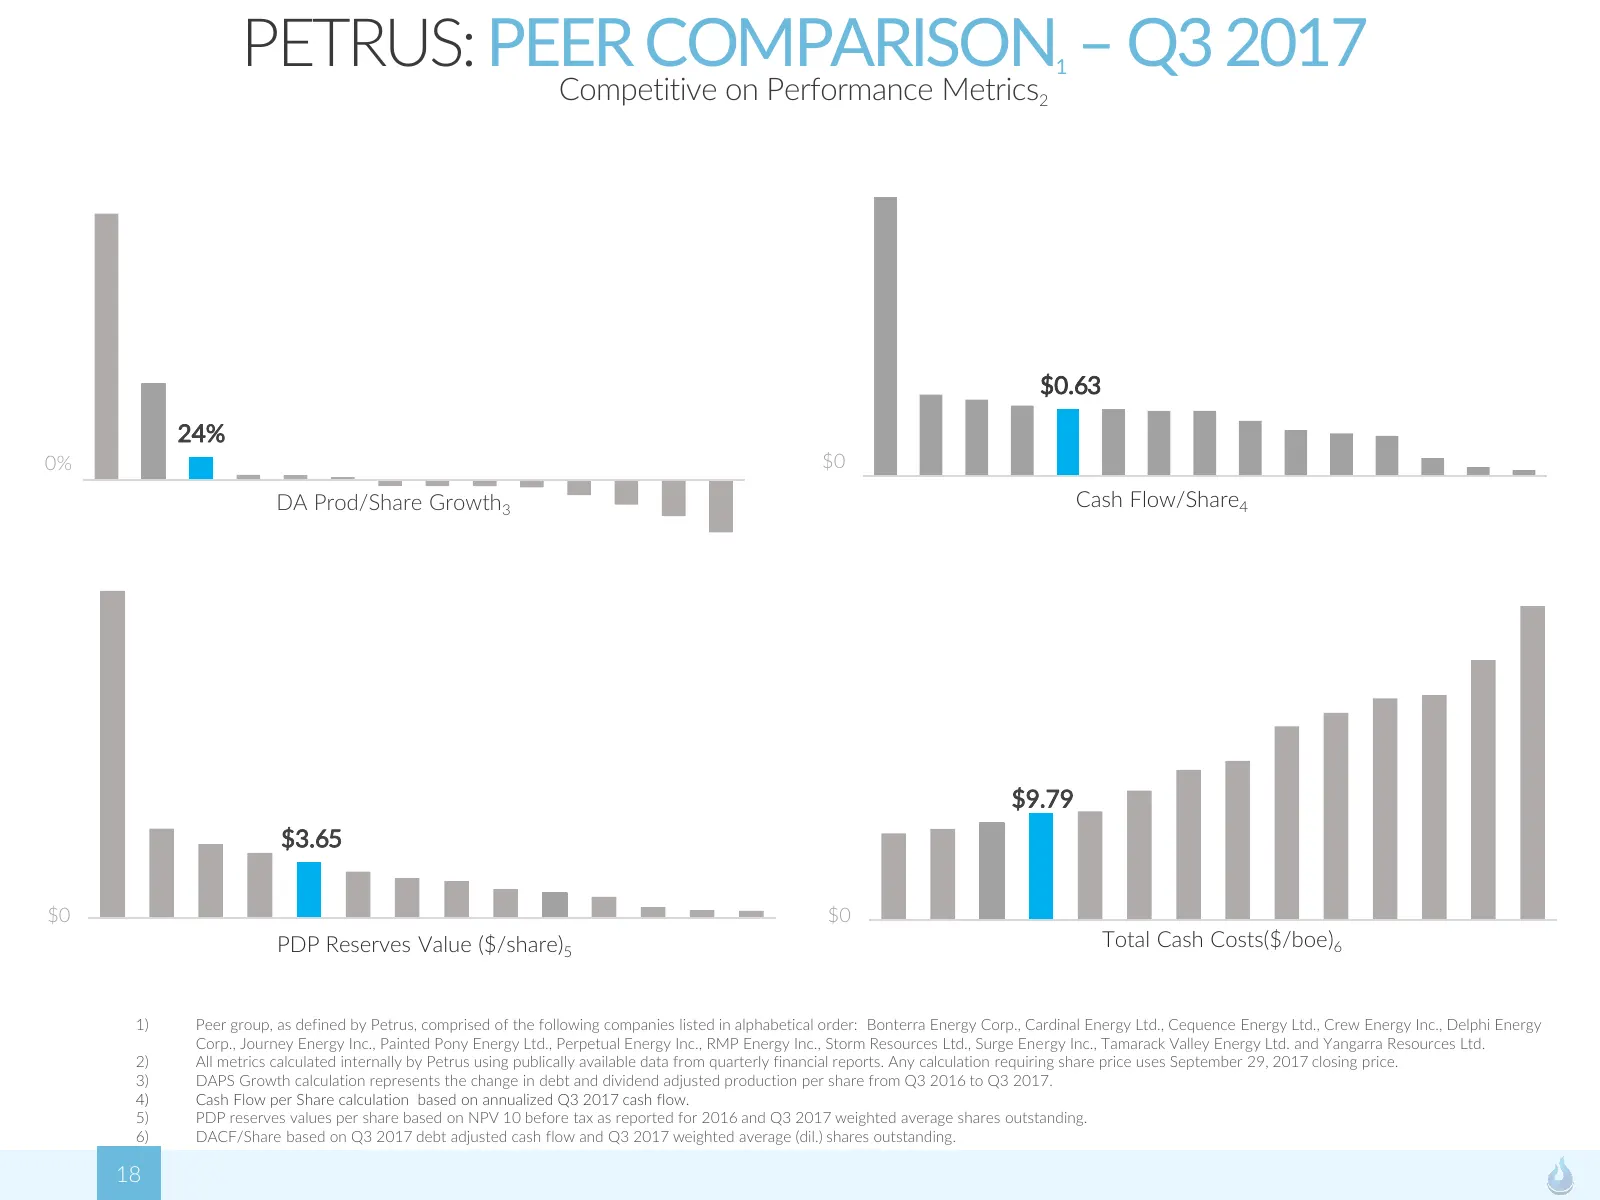
Slide 18: Petrus: Peer Comparison – Q3 2017
PETRUS: PEER COMPARISON – Q3 2017 1 Competitive on Performance Metrics2 $0.63 24% 0% $0 DA Prod/Share Growth3 Cash Flow/Share4 $9.79 $3.65 $0 $0 PDP Reserves Value ($/share)5 Total Cash Costs($/boe)6 1) Peer group, as defined by Petrus, comprised of the following companies listed in alphabetical ord
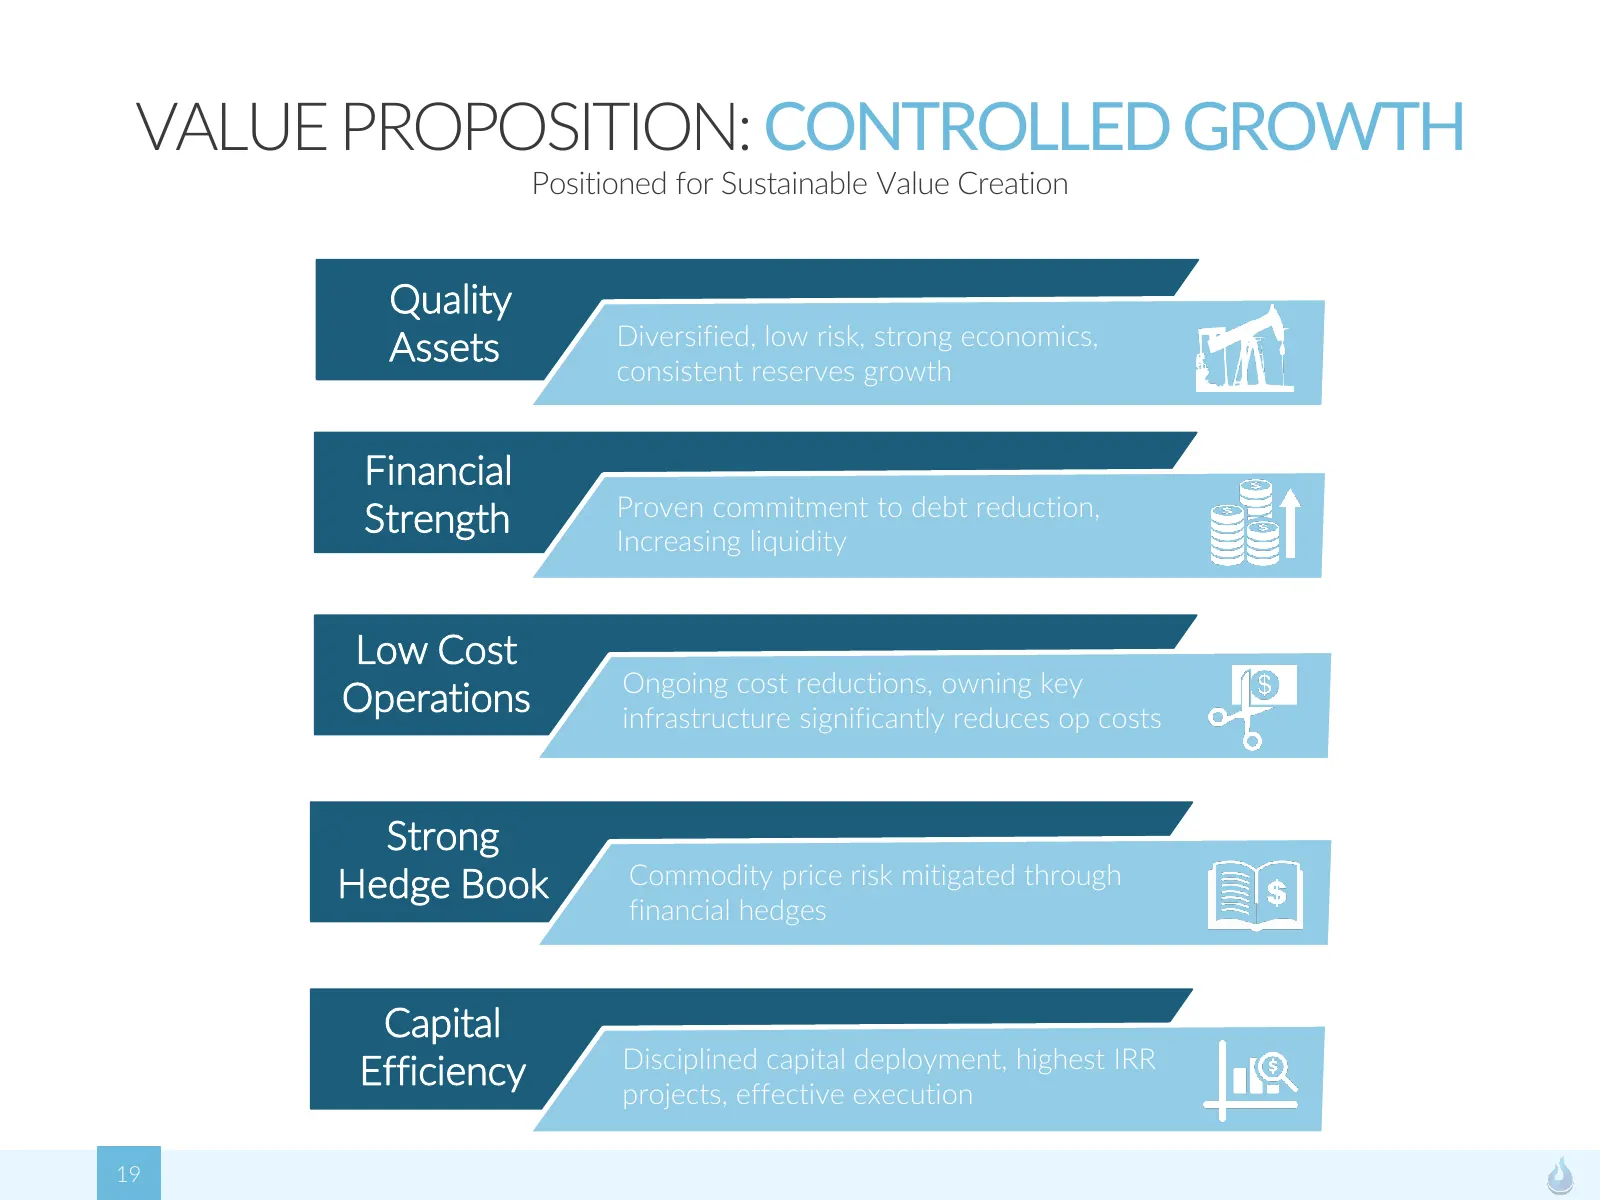
Slide 19: Value Proposition: Controlled Growth
VALUE PROPOSITION: CONTROLLED GROWTH Positioned for Sustainable Value Creation Quality Diversified, low risk, strong economics, Assets consistent reserves growth Financial Proven commitment to debt reduction, Strength Increasing liquidity Low Cost Ongoing cost reductions, owning key Operations infra
Slide 20: Reader Advisory
READER ADVISORY Petrus Resources Ltd. Corporate Update March 8, 2018 Certain information regarding Petrus Resources Ltd. ("Petrus", "our" or "we" or the "Company") set forth in this document may constitute forward-looking statements under applicable securities laws, including, but not limited to, th
Slide 21: Reader Advisory Continued
READER ADVISORY Continued Capital costs to drill, complete and tie-in wells and operating costs in each area are also based on management's experience and not on historical data. In addition, such costs are based on management's estimates when the estimates were prepared and have not been escalated
Slide 22: Contact Information
Suite 2400, 240 – 4th Avenue SW | Calgary, Alberta T2P 4H4 www.petrusresources.com FOR MORE INFORMATION PLEASE CONTACT: Neil Korchinski, President & CEO 403.930.0889 | nkorchinski@petrusresources.com Cheree Stephenson, VP Finance & CFO 403.930.0891 | cstephenson@petrusresources.com 22
Slide 23: Appendix
APPENDIX Supplemental Information 23
Slide 24: Appendix: Oil and Gas Production Rates
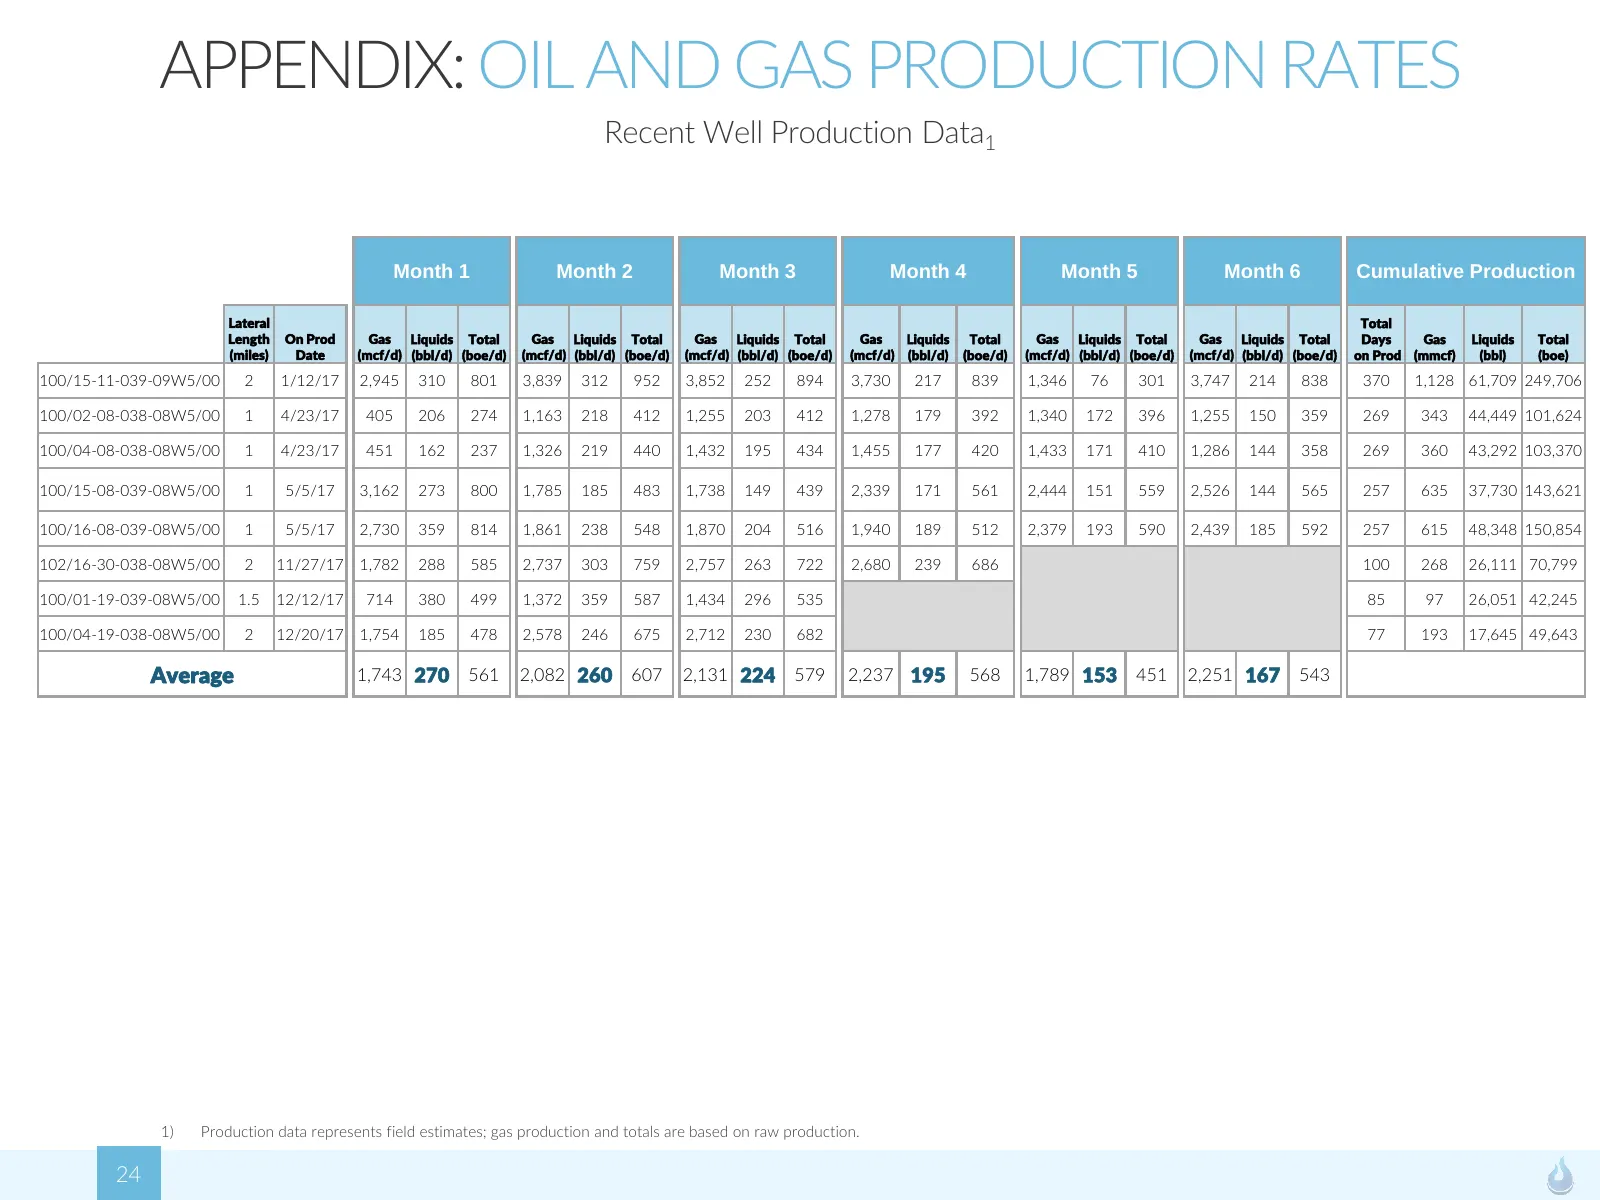
APPENDIX: OIL AND GAS PRODUCTION RATES Recent Well Production Data1 Month 1 Month 2 Month 3 Month 4 Month 5 Month 6 Cumulative Production Lateral Total Length On Prod Gas Liquids Total Gas Liquids Total Gas Liquids Total Gas Liquids Total Gas Liquids Total Gas Liquids Total Days Gas Liquids Total (m
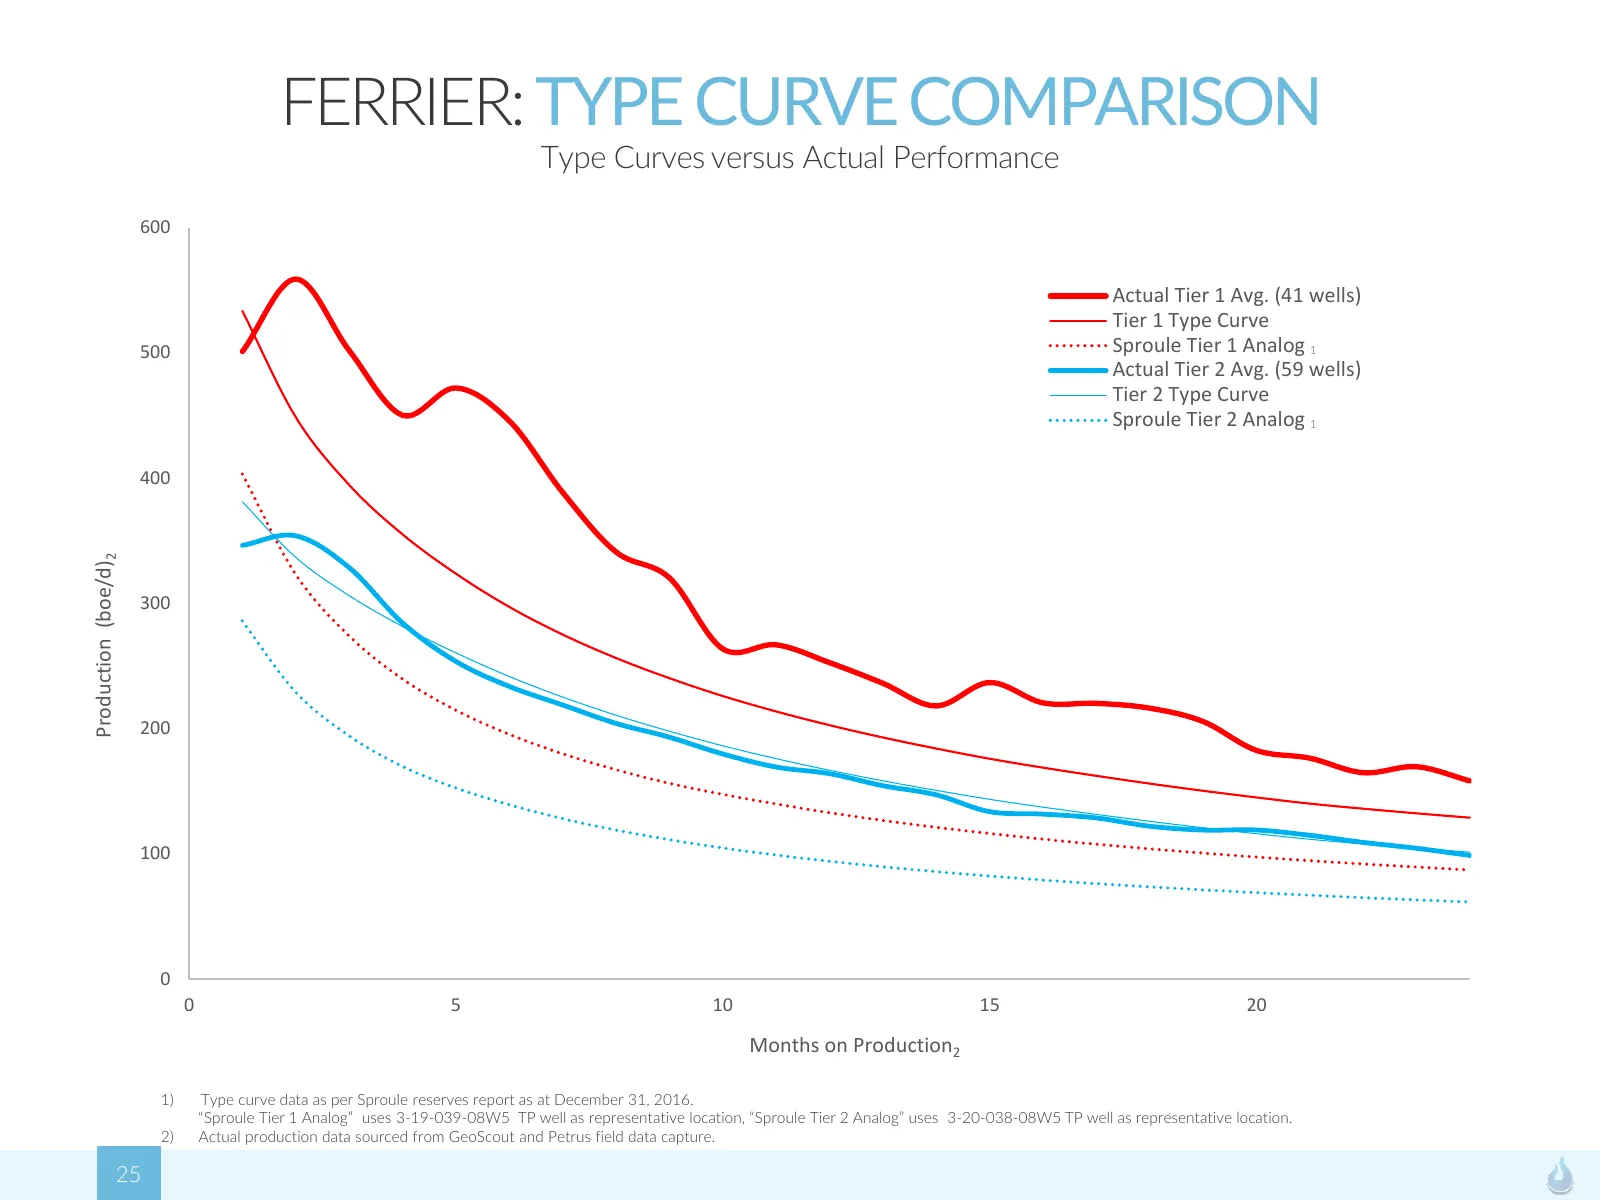
Slide 25: Ferrier: Type Curve Comparison
FERRIER: TYPE CURVE COMPARISON Type Curves versus Actual Performance 600 Actual Tier 1 Avg. (41 wells) Tier 1 Type Curve 500 Sproule Tier 1 Analog 1 Actual Tier 2 Avg. (59 wells) Tier 2 Type Curve Sproule Tier 2 Analog 1 400 Production (boe/d)2 300 200 100 0 0 5 10 15 20 Months on Production2 1) Typ
Source: Internet Archive copy of petrusresources.com
More decks from Petrus Resources Ltd.
 Q3 2026 Earnings Presentation16 slides · November 2026
 Q2 2026 Earnings Presentation21 slides · Aug 6, 2026
 Q4 2025 Earnings Presentation21 slides · Mar 19, 2026
 Q2 2025 Earnings Presentation18 slides · Aug 8, 2025
 Q3 2021 Earnings Presentation24 slides · Nov 10, 2021
 Investor Presentation (March 2016)21 slides · Mar 23, 2016