Select Interior Concepts — Q3 2018 Earnings Presentation
20 slides from Select Interior Concepts's earnings presentation, Nov 16, 2018

Slide 1: Third Quarter 2018 Earnings Conference Call
Second Quarter 2018 Earnings Conference Call November 13, 2018 Third Quarter Earnings Call NASDAQ: SIC Exhibit 99.2
Slide 2: Forward-Looking Statements and Non-GAAP Financial Measures
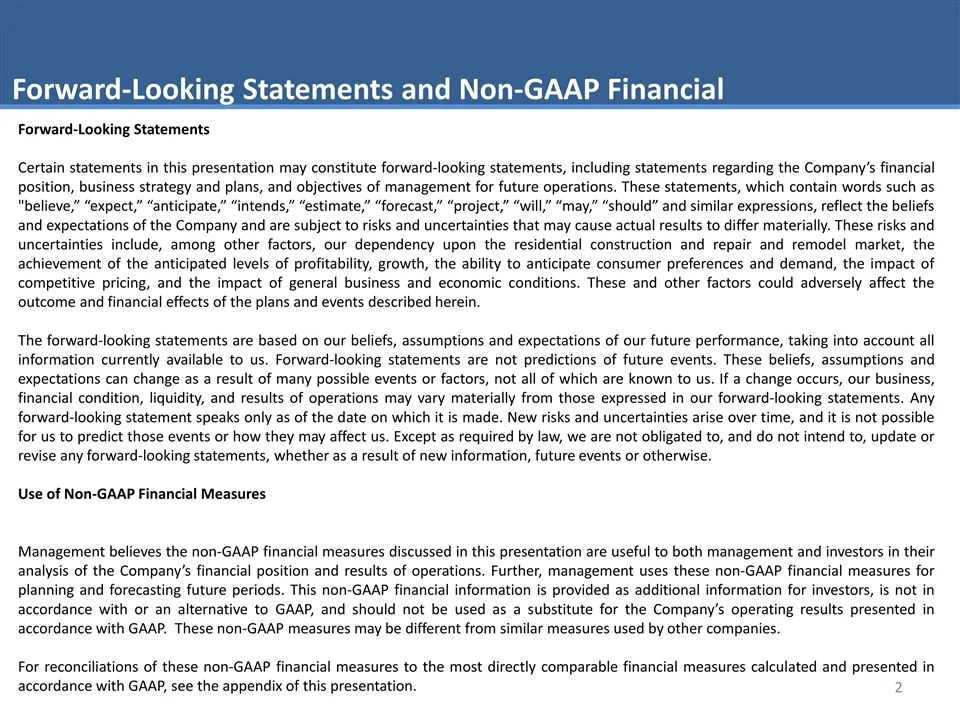
Forward-Looking Statements and Non-GAAP Financial Measures Forward-Looking Statements Certain statements in this presentation may constitute forward-looking statements, including statements regarding the Company’s financial position, business strategy and plans, and objectives of management for futu
Slide 3: SIC Overview
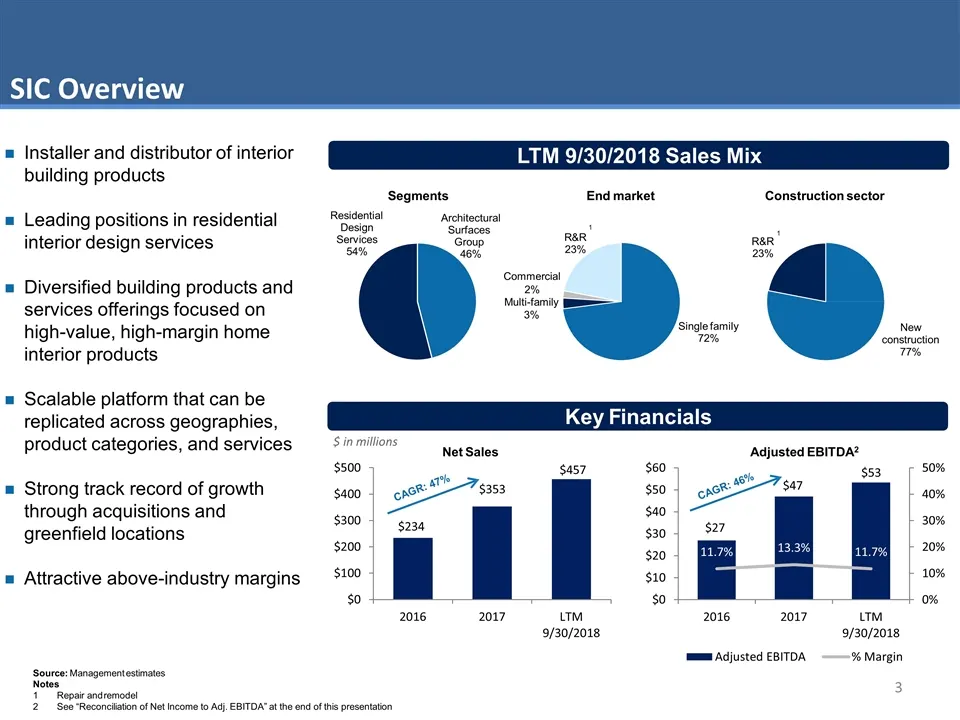
SIC Overview Net Sales 1 LTM 9/30/2018 Sales Mix Key Financials Installer and distributor of interior building products Leading positions in residential interior design services Diversified building products and services offerings focused on high-value, high-margin home interior products Scalable pl
Slide 4: SIC Segments
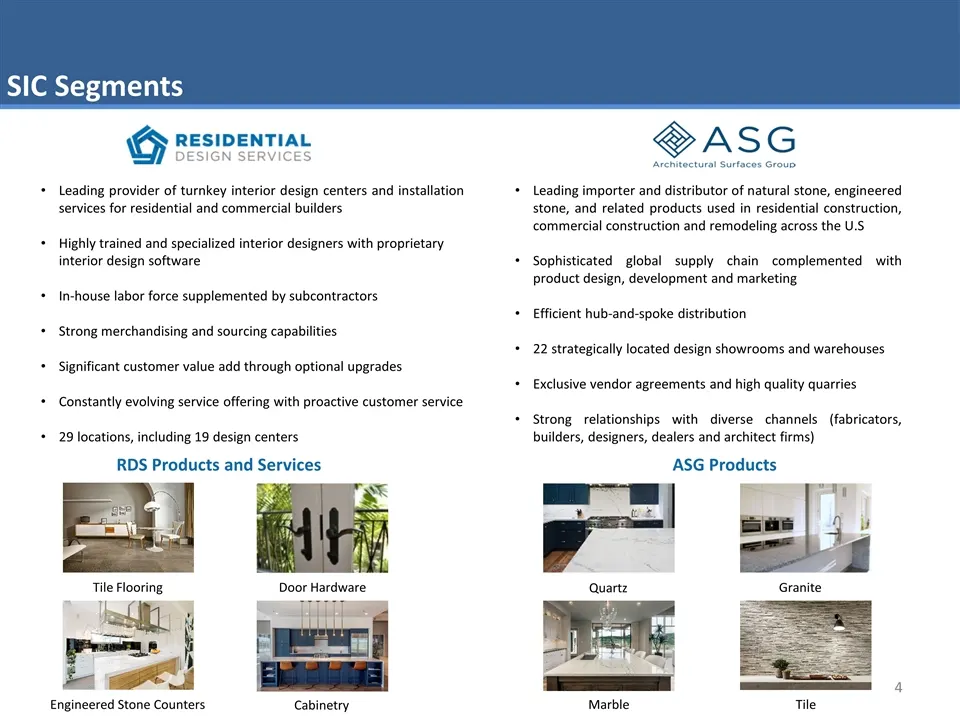
SIC Segments Leading provider of turnkey interior design centers and installation services for residential and commercial builders Highly trained and specialized interior designers with proprietary interior design software In-house labor force supplemented by subcontractors Strong merchandising and
Slide 5: Pillars for SIC Growth
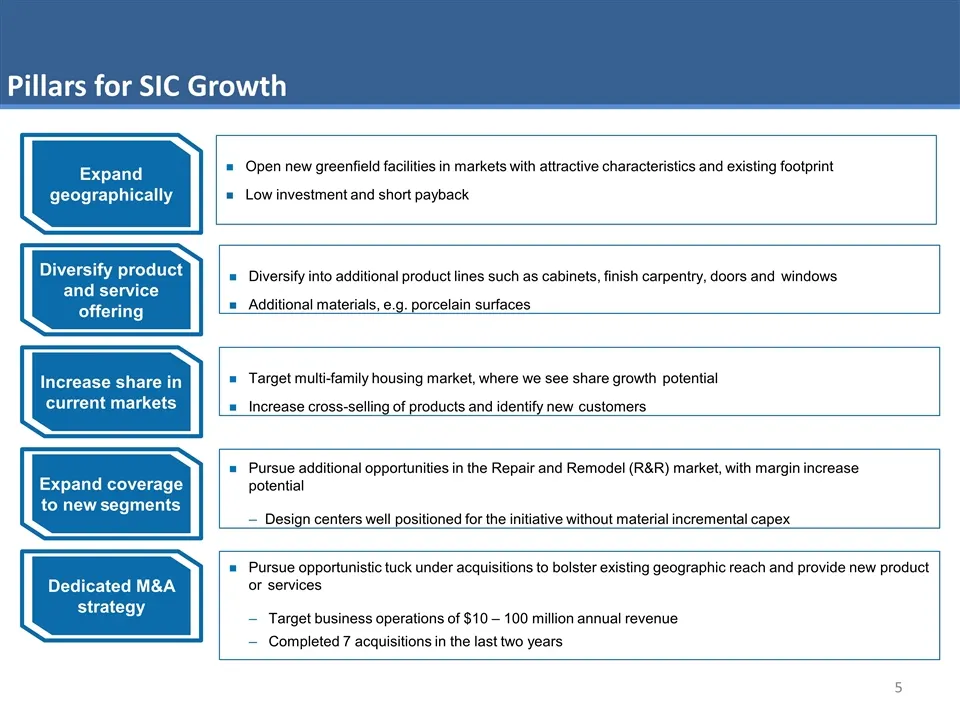
Pillars for SIC Growth Expand geographically Diversify product and service offering Diversify into additional product lines such as cabinets, finish carpentry, doors and windows Additional materials, e.g. porcelain surfaces Increase share in current markets Target multi-family housing market, where
Slide 6: Q3 2018 Acquisitions
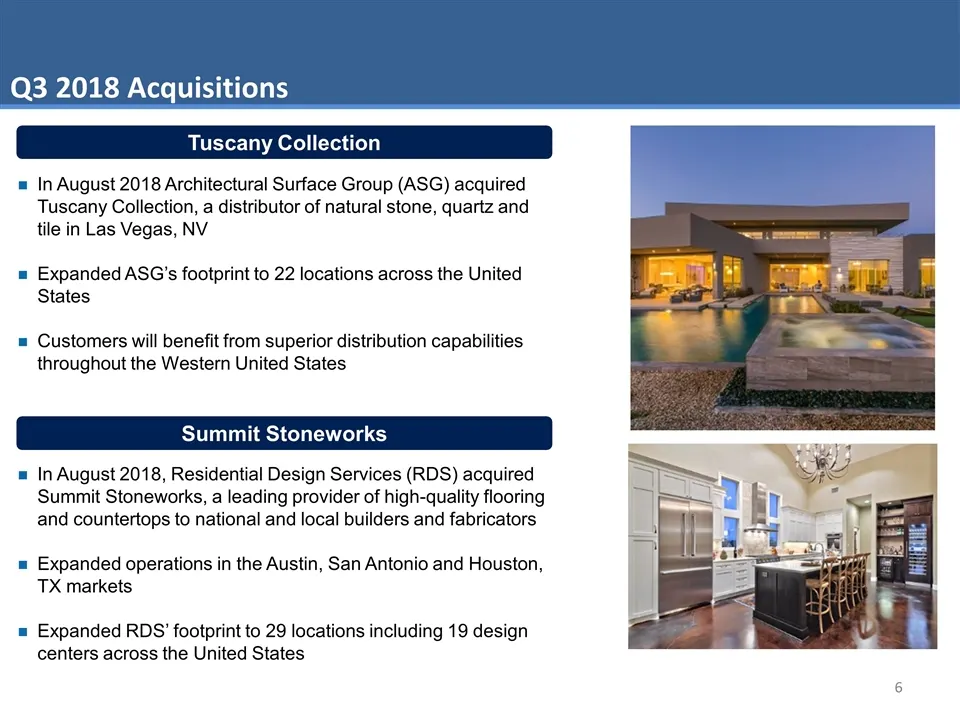
Q3 2018 Acquisitions Tuscany Collection In August 2018 Architectural Surface Group (ASG) acquired Tuscany Collection, a distributor of natural stone, quartz and tile in Las Vegas, NV Expanded ASG’s footprint to 22 locations across the United States Customers will benefit from superior distribution c
Slide 7: Growth Opportunities: New Products and Channels
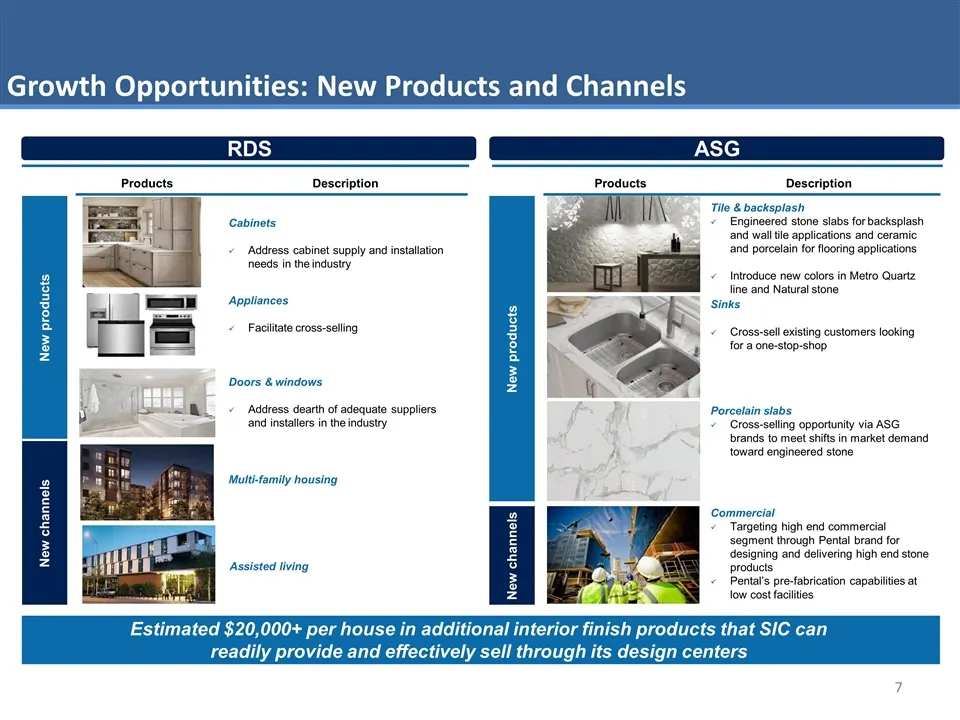
Growth Opportunities: New Products and Channels Estimated $20,000+ per house in additional interior finish products that SIC can readily provide and effectively sell through its design centers New channels New products Products Description Products Description New channels New products Multi-family
Slide 8: Third Quarter Highlights
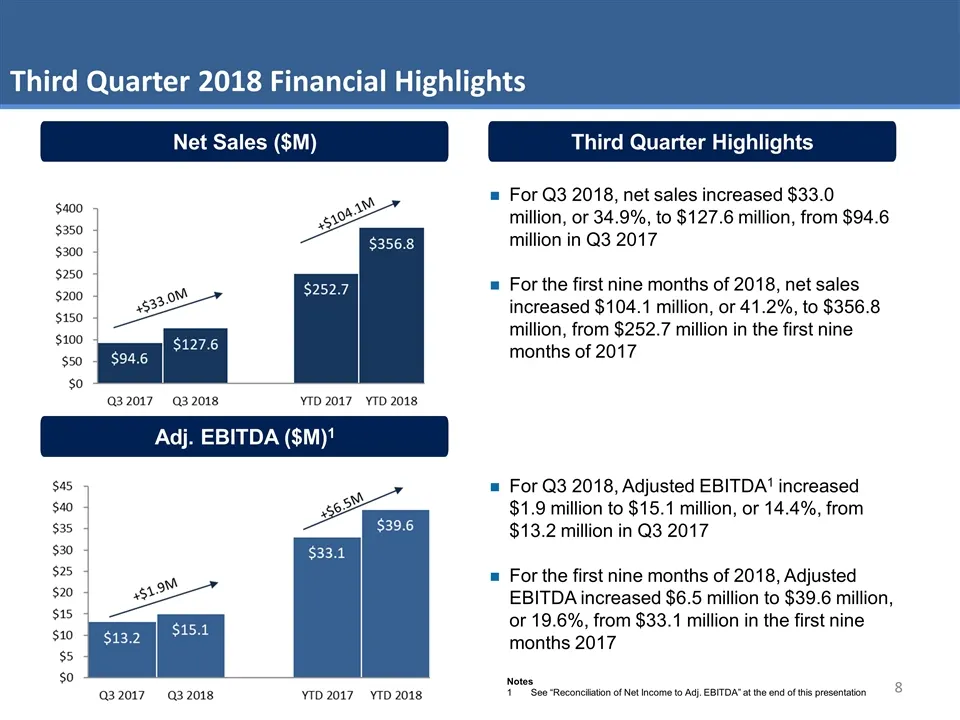
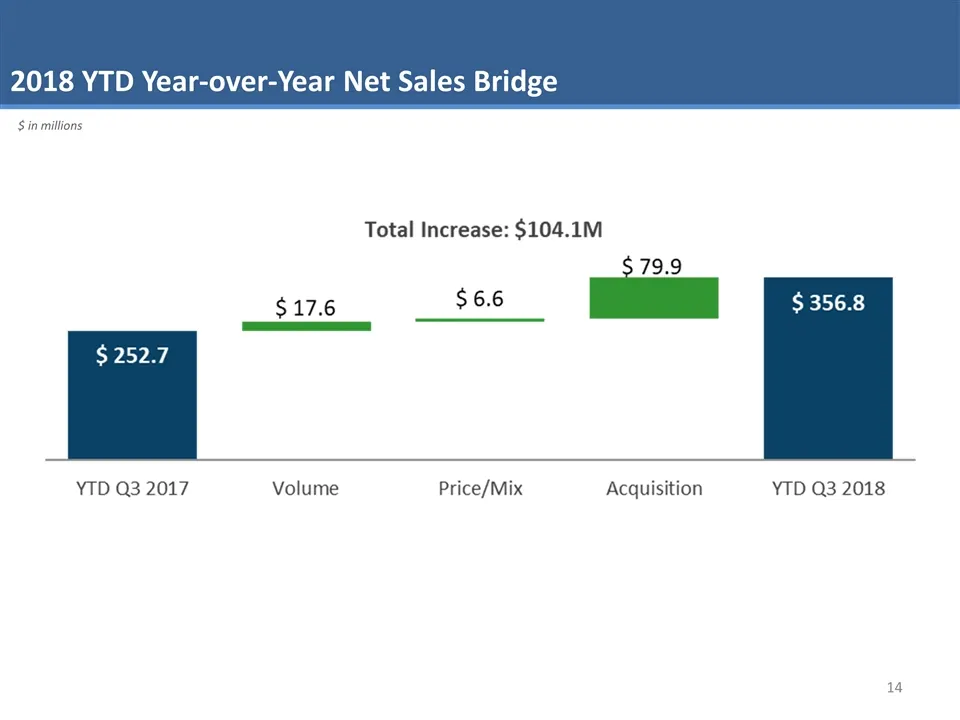
Third Quarter Highlights Adj. EBITDA ($M)1 Net Sales ($M) Third Quarter 2018 Financial Highlights For Q3 2018, net sales increased $33.0 million, or 34.9%, to $127.6 million, from $94.6 million in Q3 2017 For the first nine months of 2018, net sales increased $104.1 million, or 41.2%, to $356.8 mill
Slide 9: Third Quarter 2018 Year-over-Year Net Sales Bridge
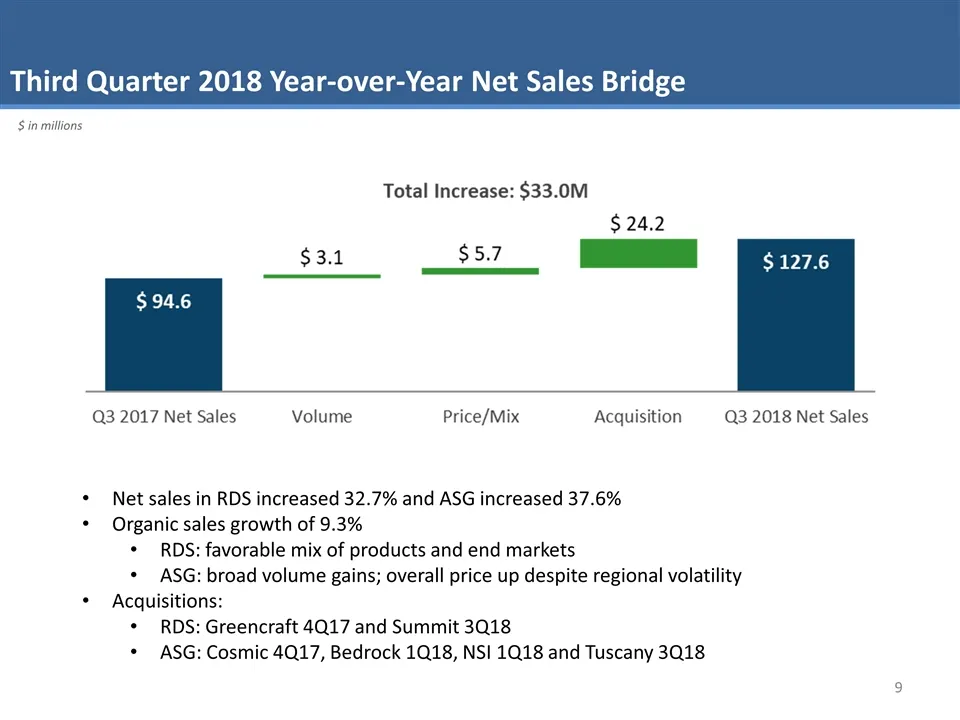
Third Quarter 2018 Year-over-Year Net Sales Bridge Net sales in RDS increased 32.7% and ASG increased 37.6% Organic sales growth of 9.3% RDS: favorable mix of products and end markets ASG: broad volume gains; overall price up despite regional volatility Acquisitions: RDS: Greencraft 4Q17 and Summit
Slide 10: Third Quarter 2018 Year-over-Year Adj. EBITDA Bridge
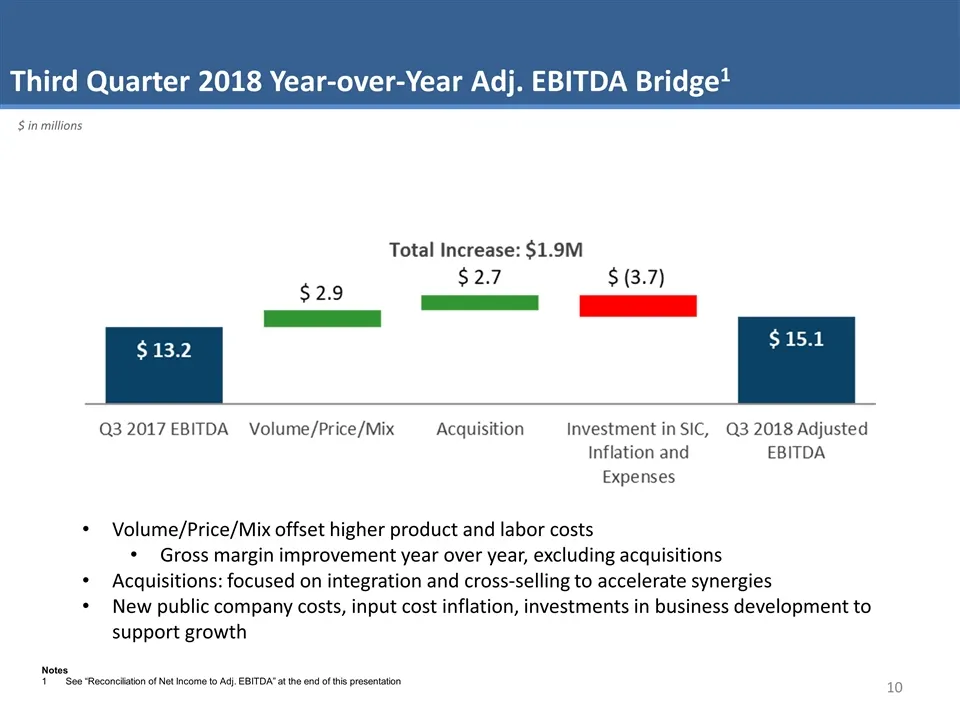
Third Quarter 2018 Year-over-Year Adj. EBITDA Bridge1 Volume/Price/Mix offset higher product and labor costs Gross margin improvement year over year, excluding acquisitions Acquisitions: focused on integration and cross-selling to accelerate synergies New public company costs, input cost inflation,
Slide 11: Effectively Positioned Balance Sheet
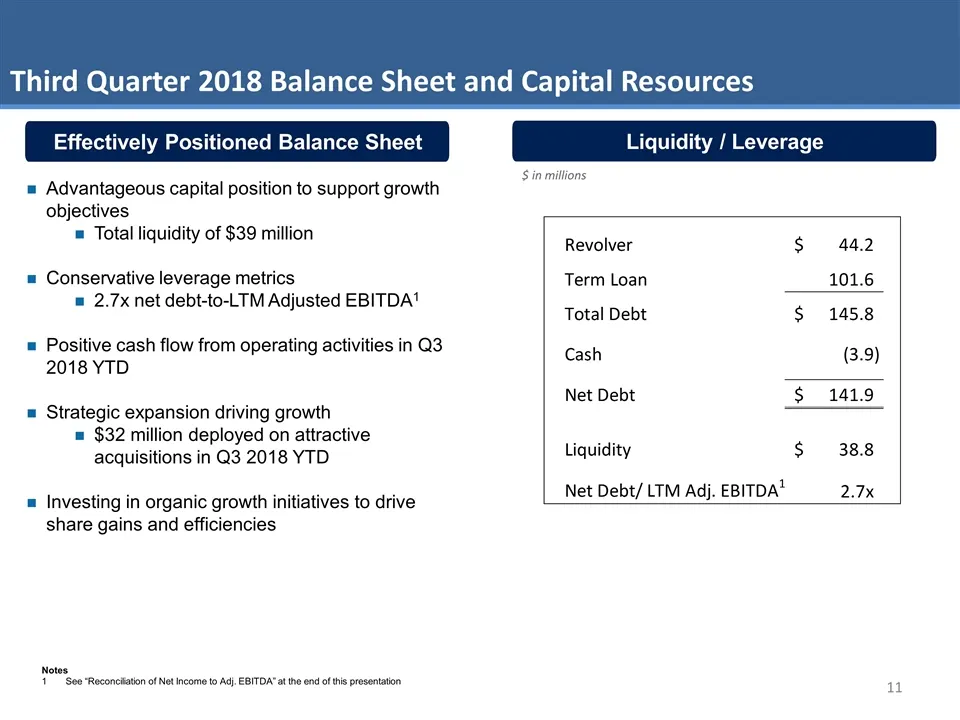
Effectively Positioned Balance Sheet Liquidity / Leverage Third Quarter 2018 Balance Sheet and Capital Resources Advantageous capital position to support growth objectives Total liquidity of $39 million Conservative leverage metrics 2.7x net debt-to-LTM Adjusted EBITDA1 Positive cash flow from opera
Slide 12: Third Quarter 2018 Key Take-Aways
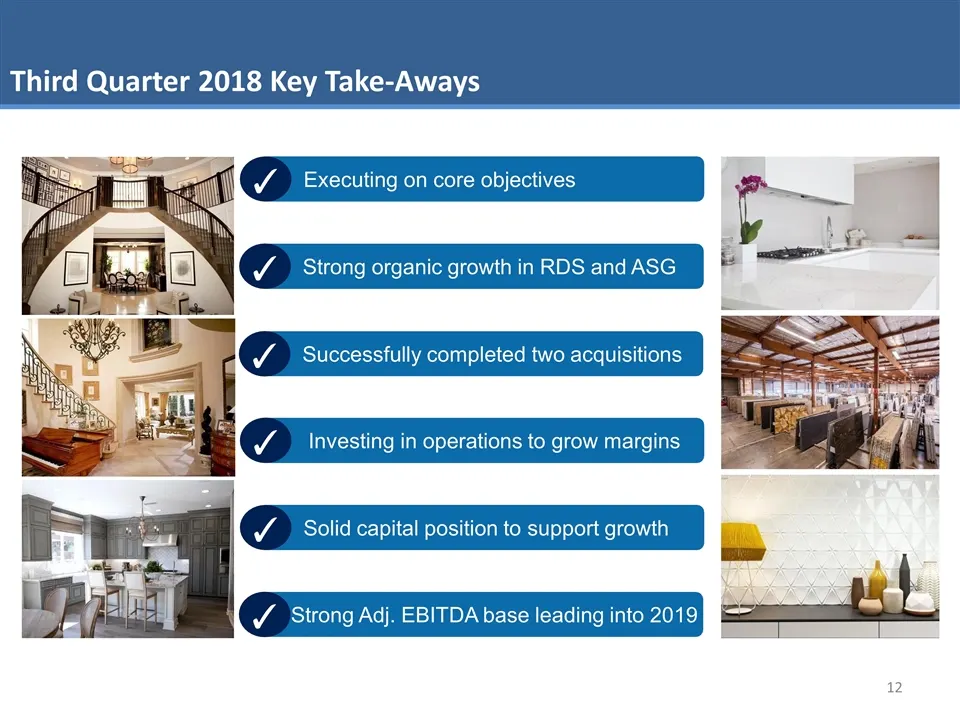
Third Quarter 2018 Key Take-Aways Executing on core objectives Market leadership promotes high barriers to competition Strong customer relationships Strong and experienced management team ✓ Strong organic growth in RDS and ASG ✓ Successfully completed two acquisitions ✓ Investing in operations to gr
Slide 13: Appendix
Appendix
Slide 14: 2018 YTD Year-over-Year Net Sales Bridge
2018 YTD Year-over-Year Net Sales Bridge $ in millions
Slide 15: 2018 YTD Year-over-Year Adj. EBITDA Bridge
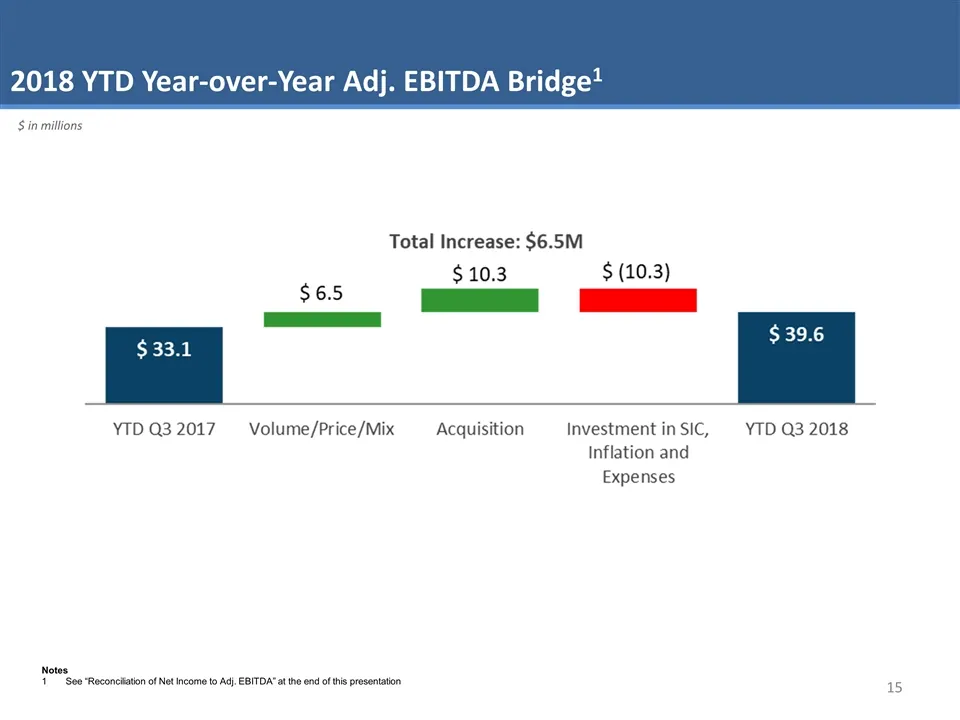
2018 YTD Year-over-Year Adj. EBITDA Bridge1 $ in millions Notes 1See “Reconciliation of Net Income to Adj. EBITDA” at the end of this presentation
Slide 16: Statement of Profit and Loss
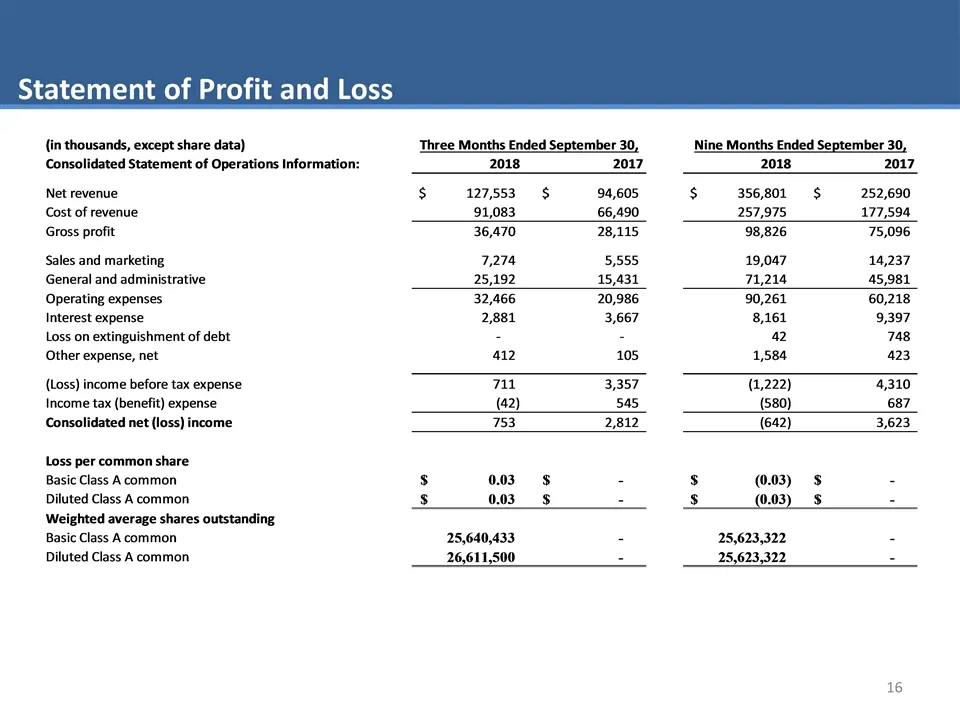
Statement of Profit and Loss {in thousands, except share data) 2018 2017 2018 2017 127,553 $ 94,605 356,801 $ 252,690 x 490 257,975 17,594 36,470 28,115 98,826 09 7,278 5,555 19,047 14,237 25,192 15,431 71,214 45,981 32,466 20,986 261 60,218 pe 2,881 3,667 8,161 9,397 Loss on extinguishment of debt
Slide 17: Balance Sheet
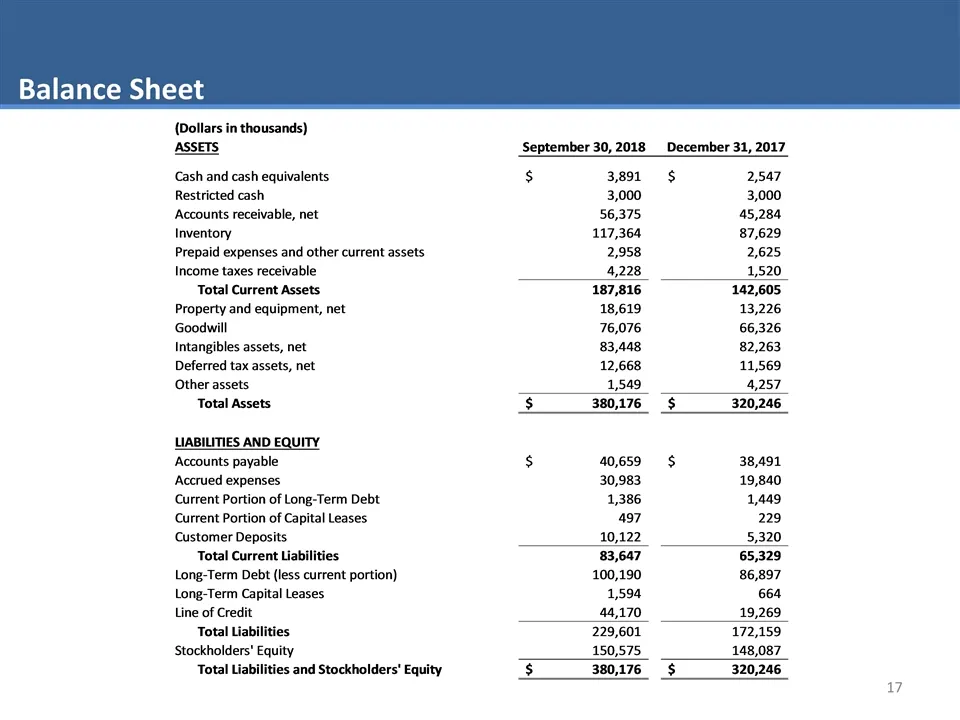
Balance Sheet (Dollars in thousands) ASSETS September 30,2018 December 31, 2017 Cash and cash equivalents $ $ 2,587 Restricted cas! 3,000 ‘Accounts receivable, net 45,284 Inventory 87,629 Prepaid expenses and other current assets 2,625 Income taxes receivable 1,520 fotal Current Assets 142,605 Prope
Slide 18: Cash Flow
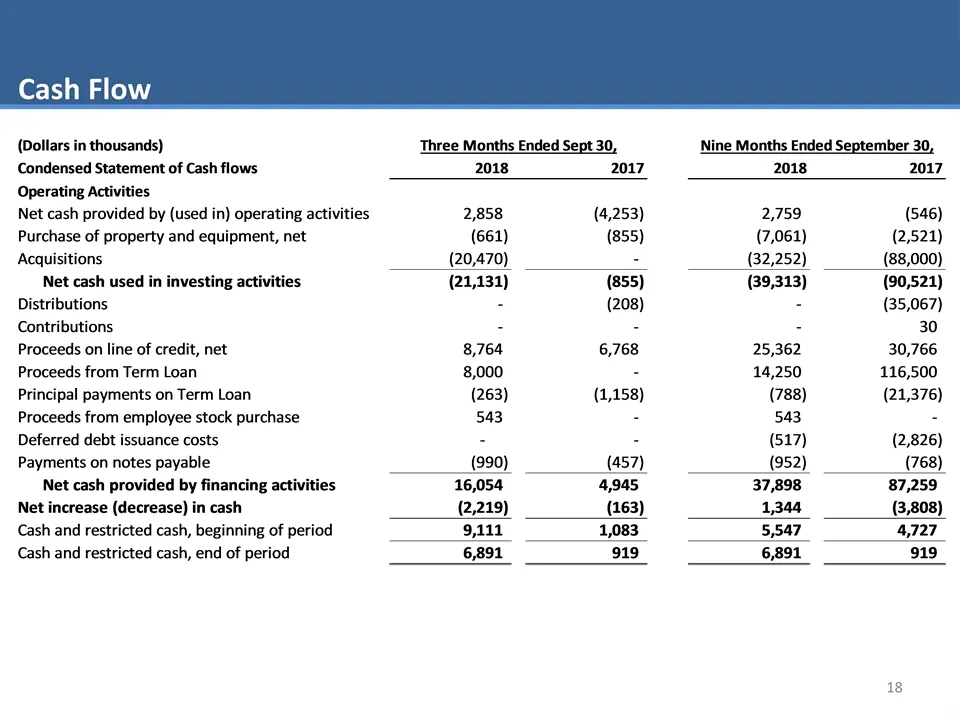
Cash Flow (Dollars in thousands) Condensed Statement of Cash flows Operating Activities Net cash provided by (used in) operating activities Purchase of property and equipment, net Acquisitions Net cash used in investing activities Distributions Contributions is on line of credit, net Proceeds from T
Slide 19: Revenue by Segment
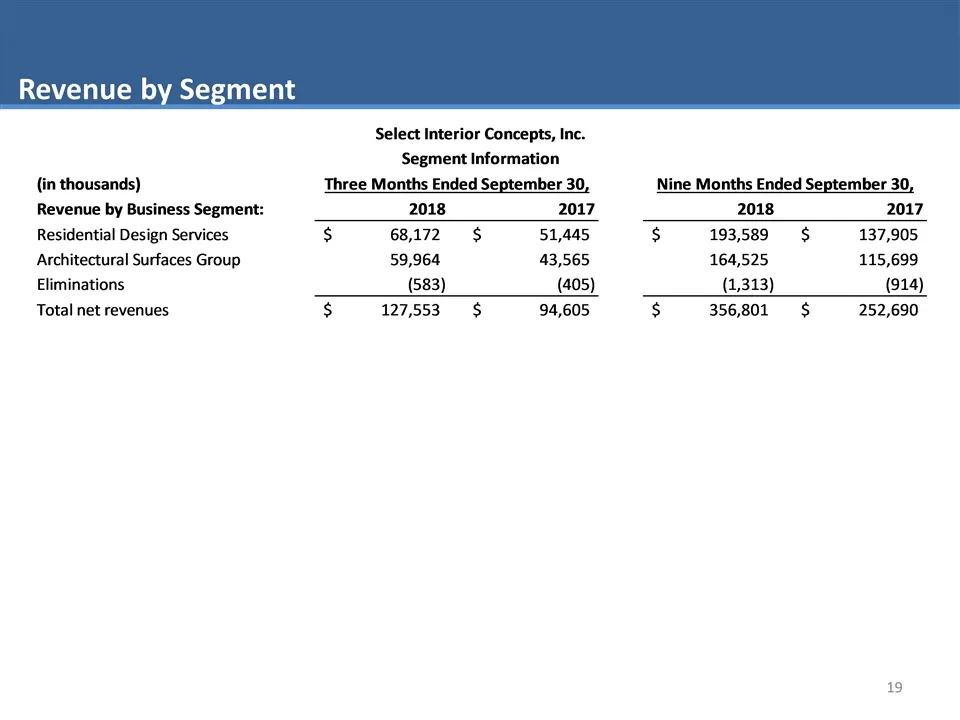
Revenue by Segment Select Interior Concepts, Inc. Segment Information {in thousands) Th 30, Revenue by 2018 2017 2018 2017 Residential Design Services $ 68,172 $ 51,445 $ 193,589 $ 137,905 Architectural Surfaces Group 59,964 43,565 164,525 115,699 Eliminations (583) (405) (1,313) (914) Total net rev
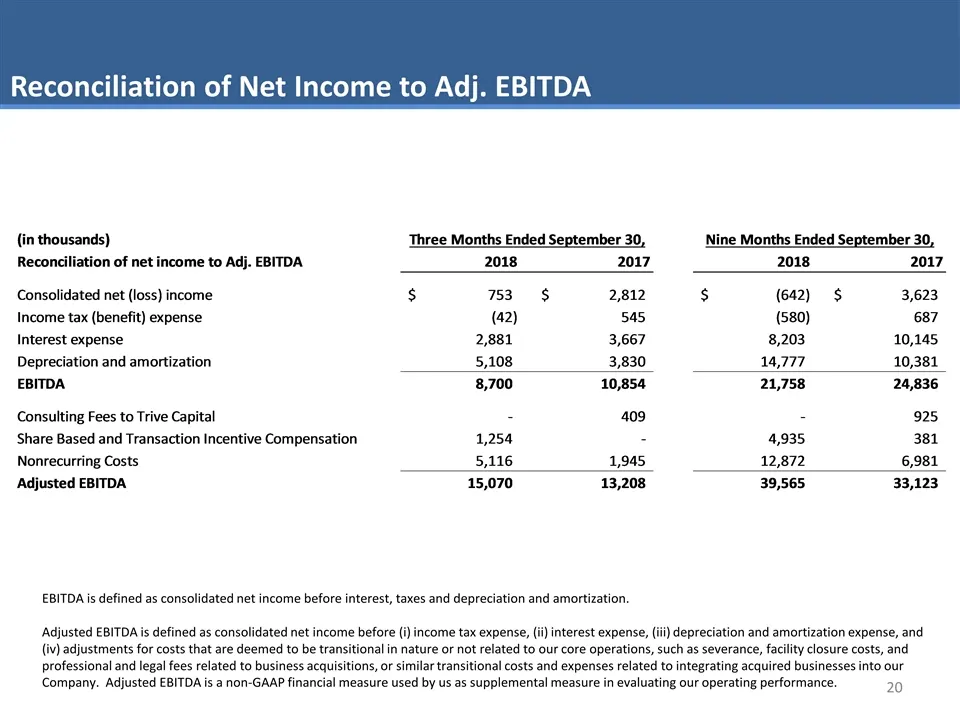
Slide 20: Reconciliation of Net Income to Adj. EBITDA
Reconciliation of Net Income to Adj. EBITDA EBITDA is defined as consolidated net income before interest, taxes and depreciation and amortization. Adjusted EBITDA is defined as consolidated net income before (i) income tax expense, (ii) interest expense, (iii) depreciation and amortization expense,
Source: SEC EDGAR · 8-K filed Nov 16, 2018