Select Interior Concepts — Investor Presentation (March 2019)
20 slides from Select Interior Concepts's investor presentation, Mar 20, 2019
Slide 1: March 2019 Investor Presentation
March 2019 Investor Presentation Exhibit 99.1
Slide 2: Forward-Looking Statements
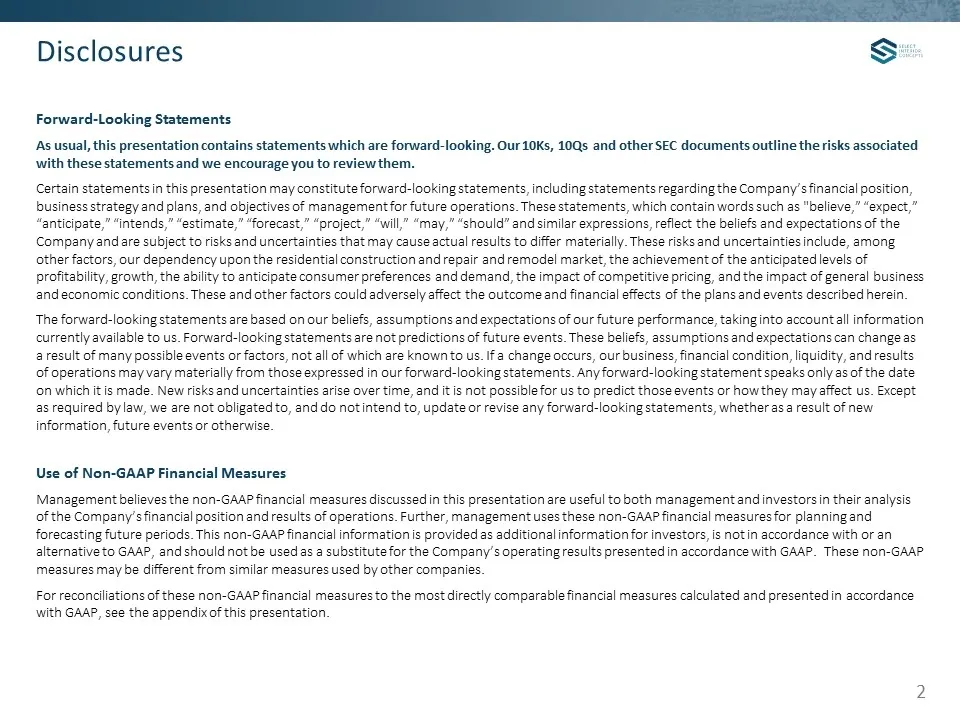
Forward-Looking Statements As usual, this presentation contains statements which are forward-looking. Our 10Ks, 10Qs and other SEC documents outline the risks associated with these statements and we encourage you to review them. Certain statements in this presentation may constitute forward-looking
Slide 3: Company Overview
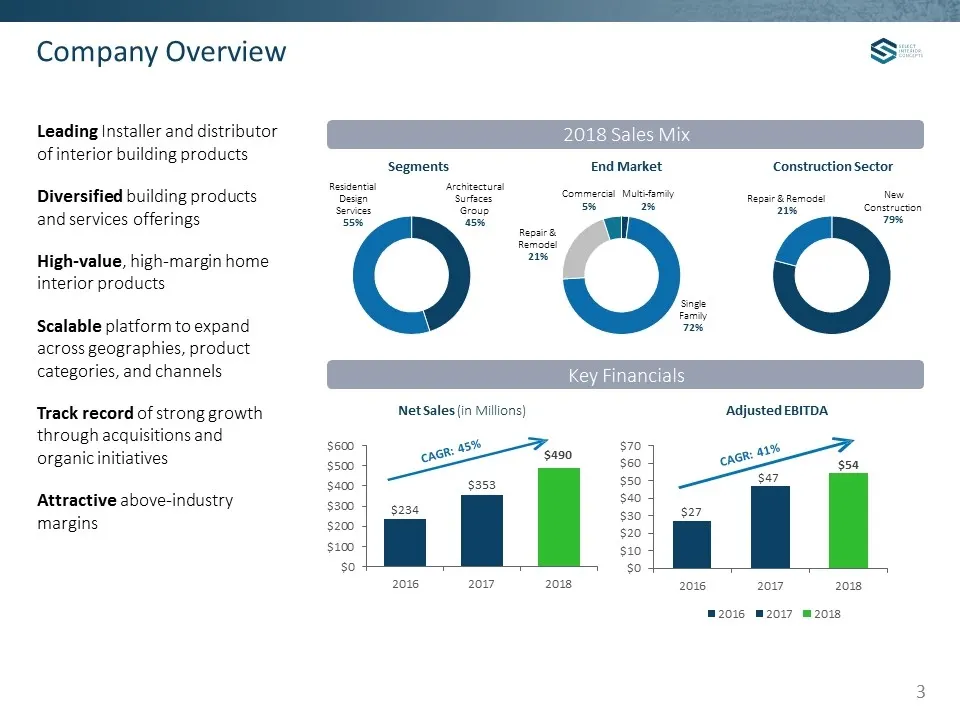
Net Sales (in Millions) 2018 Sales Mix Key Financials Leading Installer and distributor of interior building products Diversified building products and services offerings High-value, high-margin home interior products Scalable platform to expand across geographies, product categories, and channels T
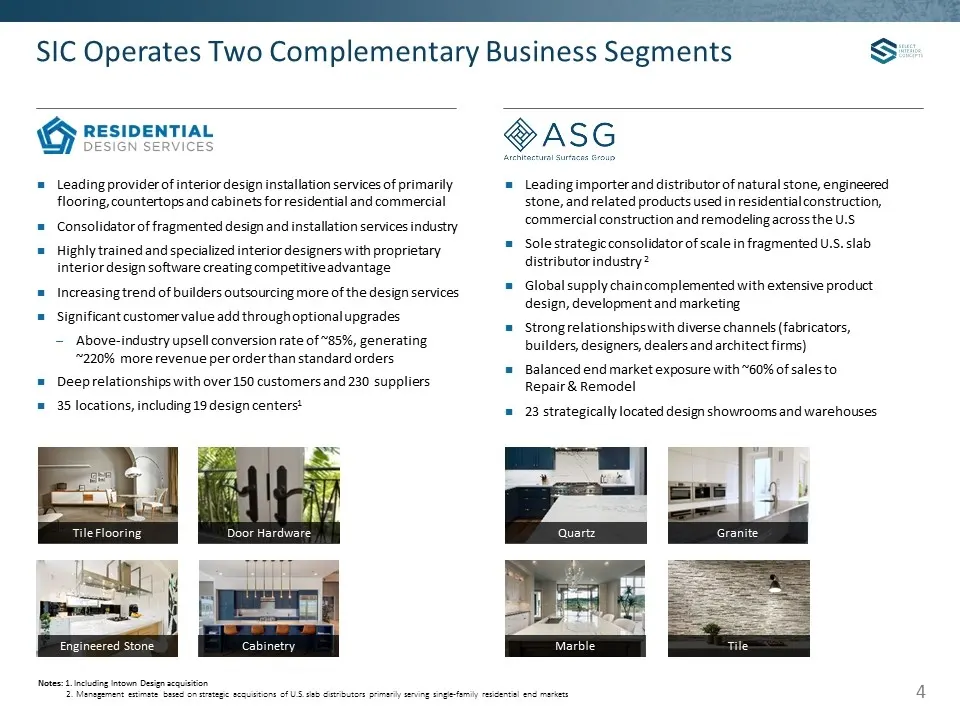
Slide 4: Leading provider of interior design installation services and stone distribution
Leading provider of interior design installation services of primarily flooring, countertops and cabinets for residential and commercial Consolidator of fragmented design and installation services industry Highly trained and specialized interior designers with proprietary interior design software cr
Slide 5: SIC is Positioned to Grow Through Cycles
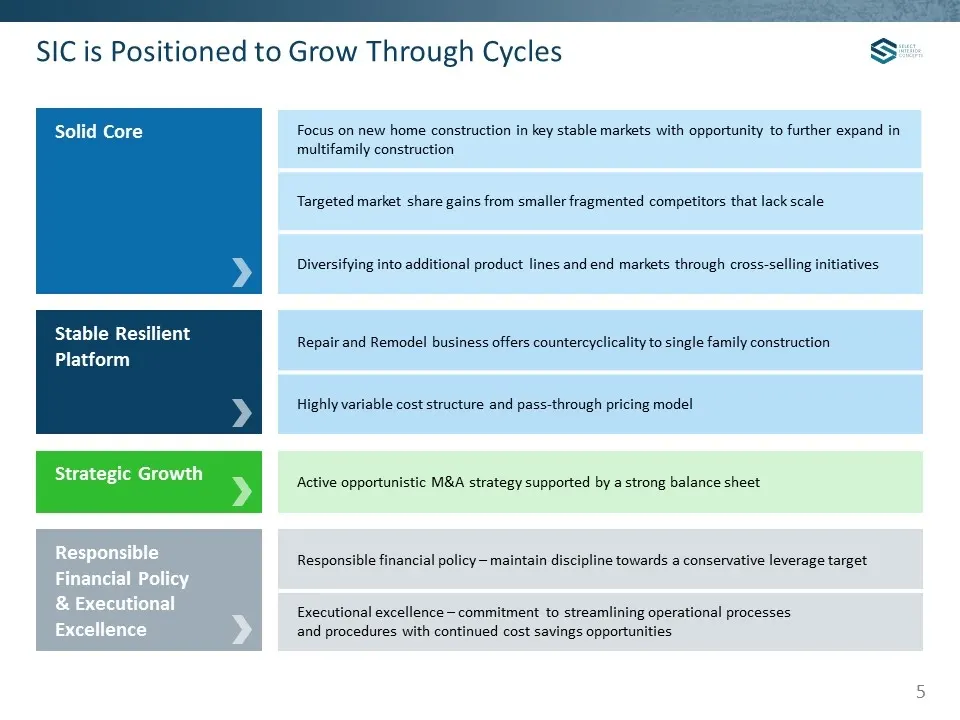
SIC is Positioned to Grow Through Cycles Solid Core Focus on new home construction in key stable markets with opportunity to further expand in multifamily construction Targeted market share gains from smaller fragmented competitors that lack scale Diversifying into additional product lines and end m
Slide 6: Key Investment Highlights
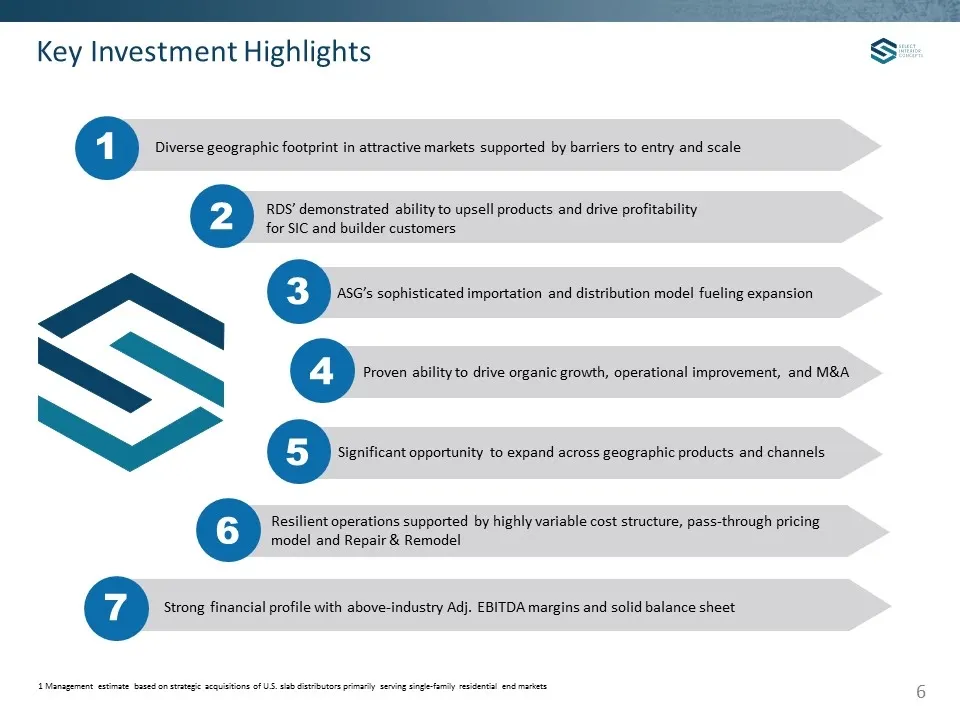
Key Investment Highlights Diverse geographic footprint in attractive markets supported by barriers to entry and scale 1 2 RDS’ demonstrated ability to upsell products and drive profitability for SIC and builder customers 3 ASG’s sophisticated importation and distribution model fueling expansion 4 Pr
Slide 7: Diverse Geographic Footprint in Attractive Markets
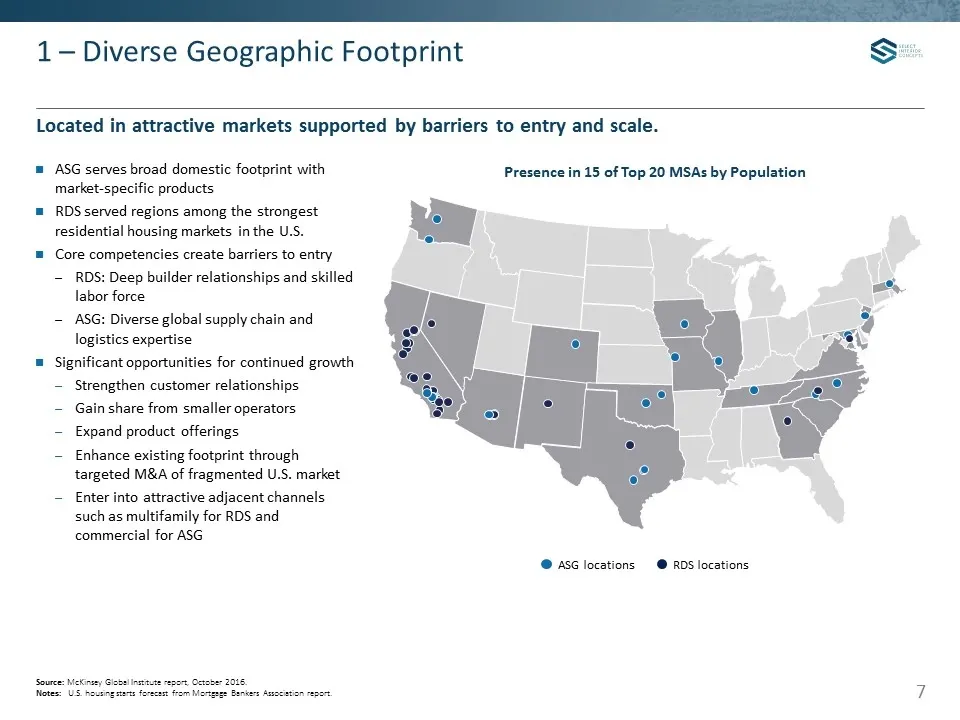
Located in attractive markets supported by barriers to entry and scale. 1 – Diverse Geographic Footprint Source: McKinsey Global Institute report, October 2016. Notes: U.S. housing starts forecast from Mortgage Bankers Association report. Presence in 15 of Top 20 MSAs by Population ASG locations RDS
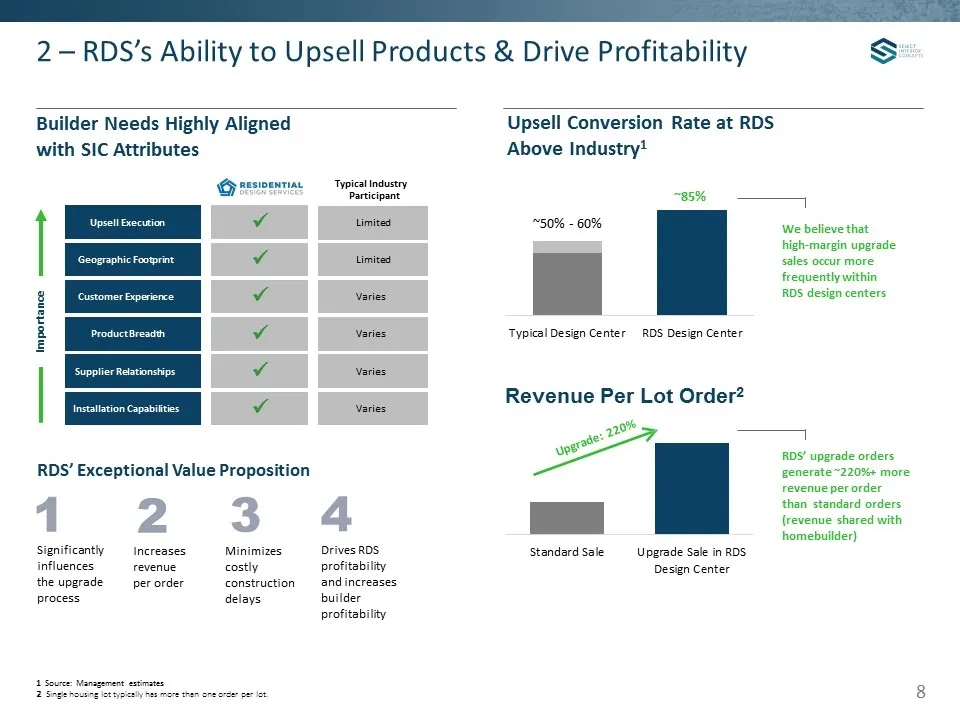
Slide 8: RDS's Ability to Upsell Products & Drive Profitability
Builder Needs Highly Aligned with SIC Attributes 2 – RDS’s Ability to Upsell Products & Drive Profitability Importance Upsell Execution Installation Capabilities Supplier Relationships Product Breadth Customer Experience Geographic Footprint Limited Varies Varies Varies Varies Limited ü ü ü ü ü ü Ty
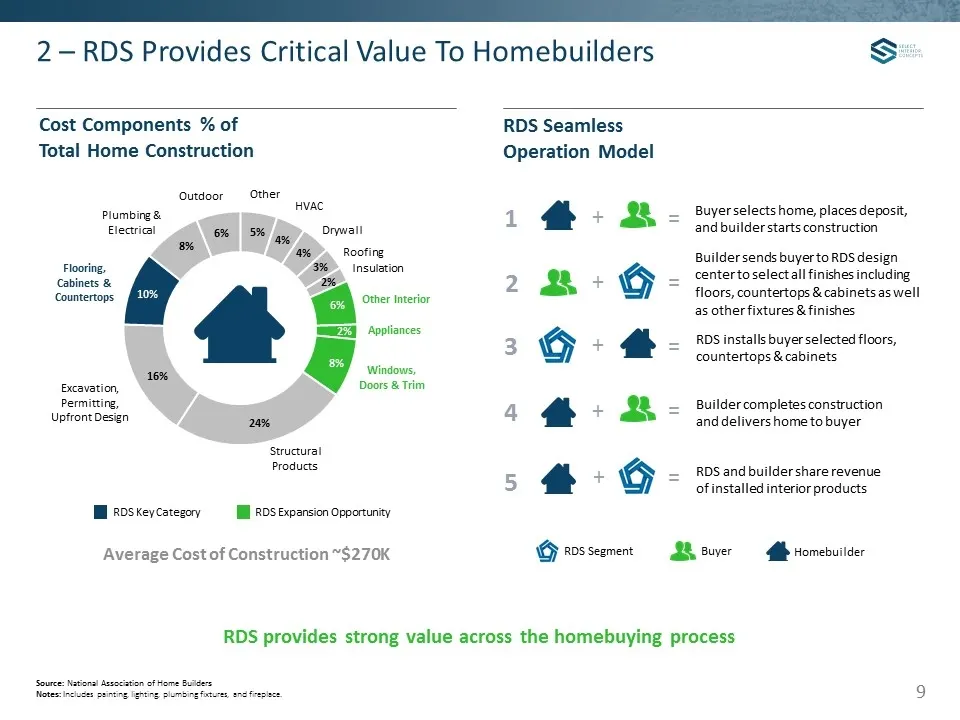
Slide 9: RDS Provides Critical Value To Homebuilders
2 – RDS Provides Critical Value To Homebuilders Average Cost of Construction ~$270K Cost Components % of Total Home Construction HVAC Drywall Roofing Insulation Appliances Windows, Doors & Trim Structural Products Excavation, Permitting, Upfront Design Flooring, Cabinets & Countertops Plumbing & Ele
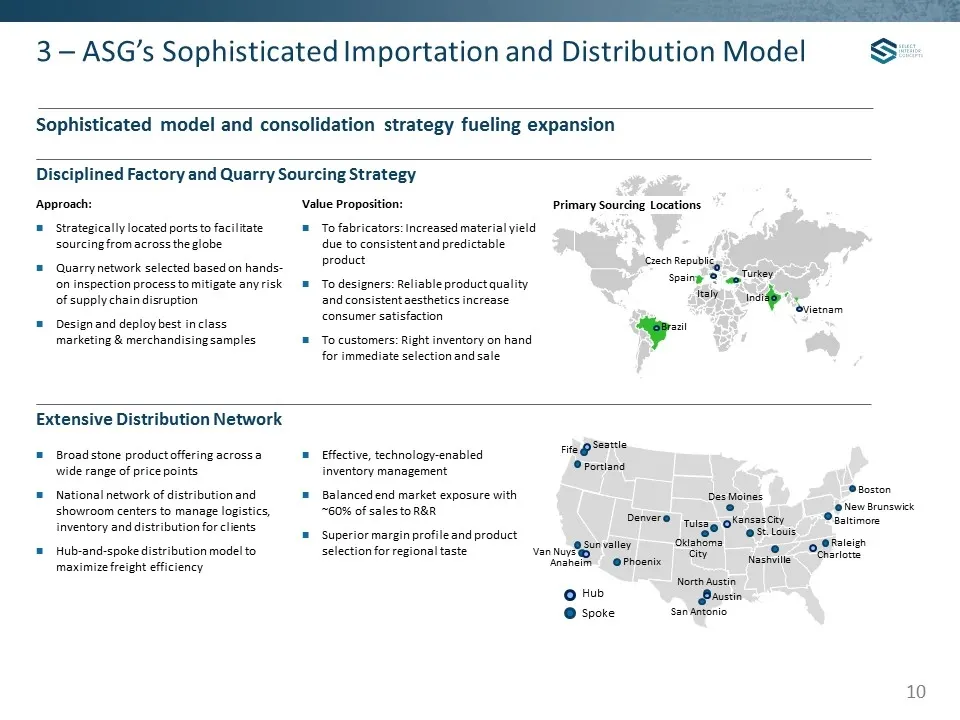
Slide 10: ASG's Sophisticated Importation and Distribution Model
Brazil Spain Italy Vietnam India Czech Republic Turkey Sophisticated model and consolidation strategy fueling expansion 3 – ASG’s Sophisticated Importation and Distribution Model Approach: Strategically located ports to facilitate sourcing from across the globe Quarry network selected based on hands
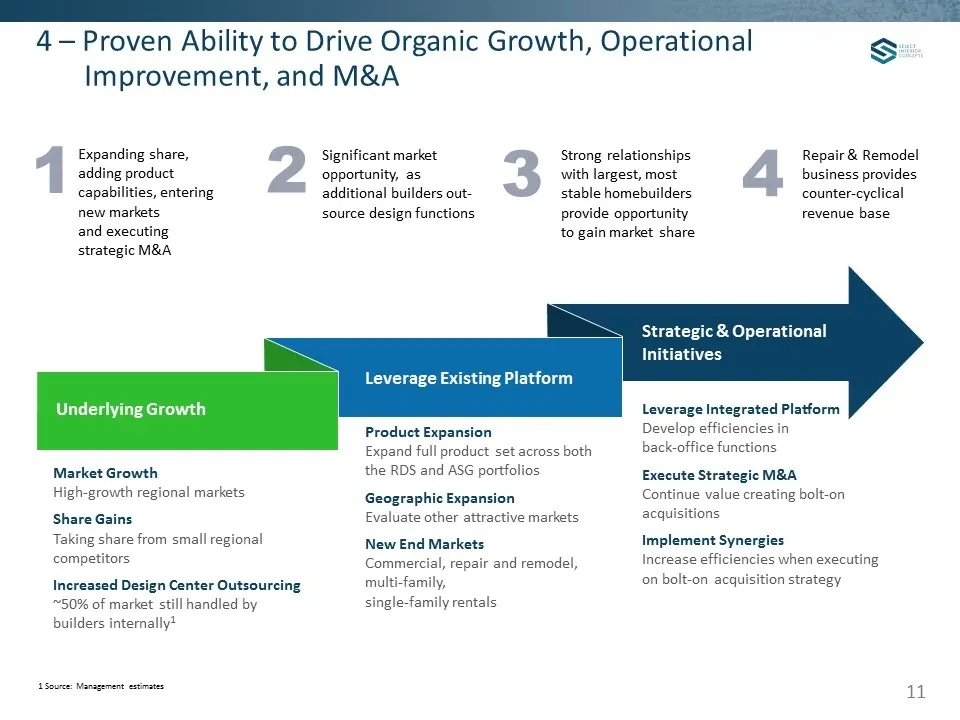
Slide 11: Proven Ability to Drive Organic Growth, Operational Improvement, and M&A
4 – Proven Ability to Drive Organic Growth, Operational Improvement, and M&A Underlying Growth Leverage Existing Platform Strategic & Operational Initiatives Market Growth High-growth regional markets Share Gains Taking share from small regional competitors Increased Design Center Outsourcing ~50% o
Slide 12: Annualized Run-Rate Sales Bridge and Acquisition Criteria
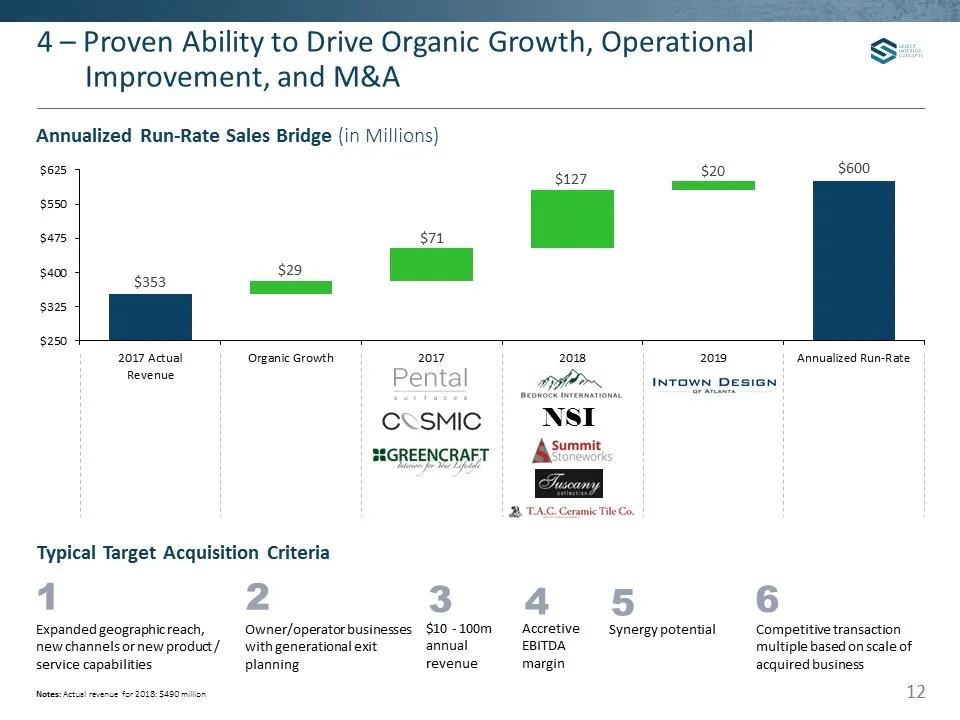
Annualized Run-Rate Sales Bridge (in Millions) 4 – Proven Ability to Drive Organic Growth, Operational Improvement, and M&A $10 - 100m annual revenue Typical Target Acquisition Criteria Expanded geographic reach, new channels or new product / service capabilities 1 2 3 4 5 6 Owner/operator businesse
Slide 13: Significant Opportunity to Expand Across Geographies, Products & Channels
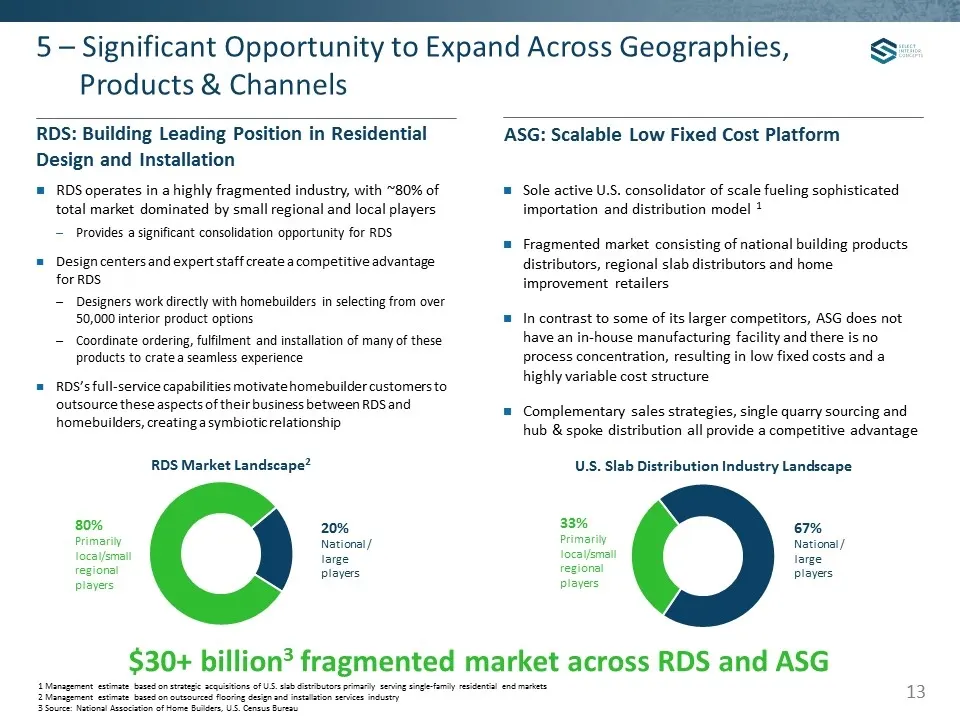
5 – Significant Opportunity to Expand Across Geographies, Products & Channels ASG: Scalable Low Fixed Cost Platform RDS operates in a highly fragmented industry, with ~80% of total market dominated by small regional and local players Provides a significant consolidation opportunity for RDS Design ce
Slide 14: Consolidator of Scale in Fragmented Core Markets
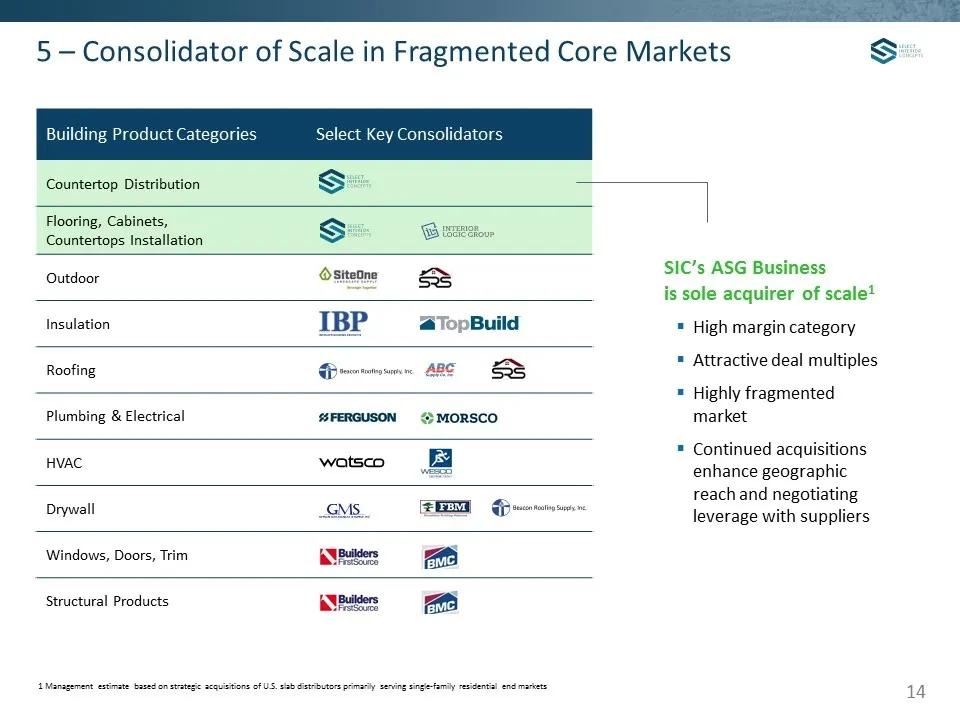
5 – Consolidator of Scale in Fragmented Core Markets Building Product Categories Select Key Consolidators Countertop Distribution Flooring, Cabinets, Countertops Installation Outdoor Insulation Roofing Plumbing & Electrical HVAC Drywall Windows, Doors, Trim Structural Products SIC’s ASG Business is
Slide 15: Growth Opportunities: New Products and Channels
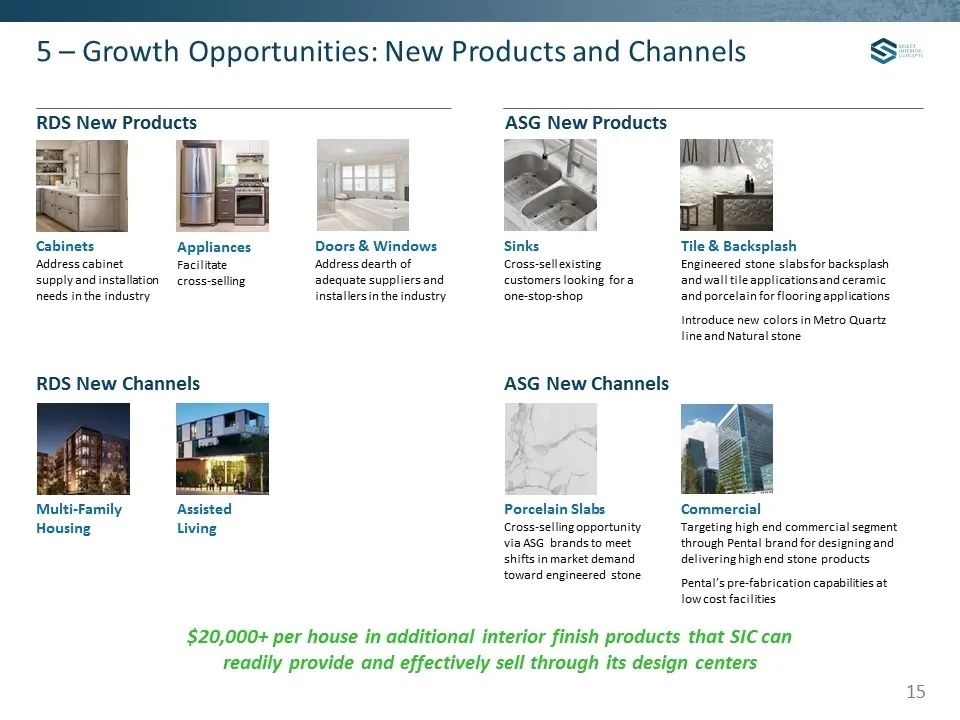
RDS New Products 5 – Growth Opportunities: New Products and Channels Doors & Windows Address dearth of adequate suppliers and installers in the industry Appliances Facilitate cross-selling Cabinets Address cabinet supply and installation needs in the industry RDS New Channels Assisted Living Multi-F
Slide 16: Variable Cost Structure and Pass-through Pricing Model
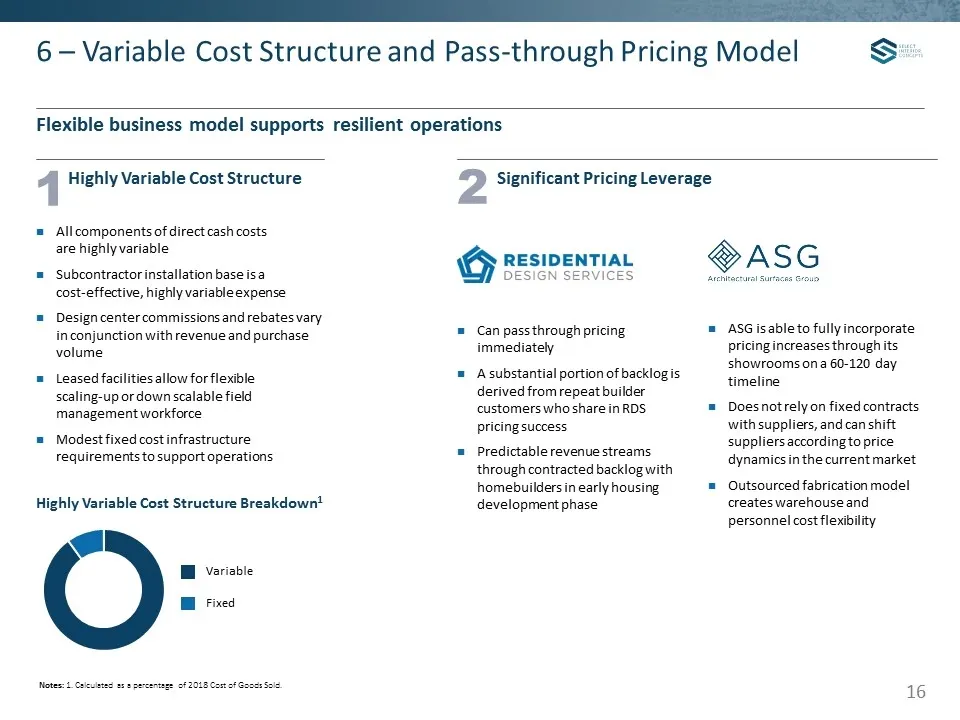
Flexible business model supports resilient operations 6 – Variable Cost Structure and Pass-through Pricing Model Highly Variable Cost Structure Breakdown1 Variable Fixed Highly Variable Cost Structure Significant Pricing Leverage Can pass through pricing immediately A substantial portion of backlog
Slide 17: Strong Financial Profile
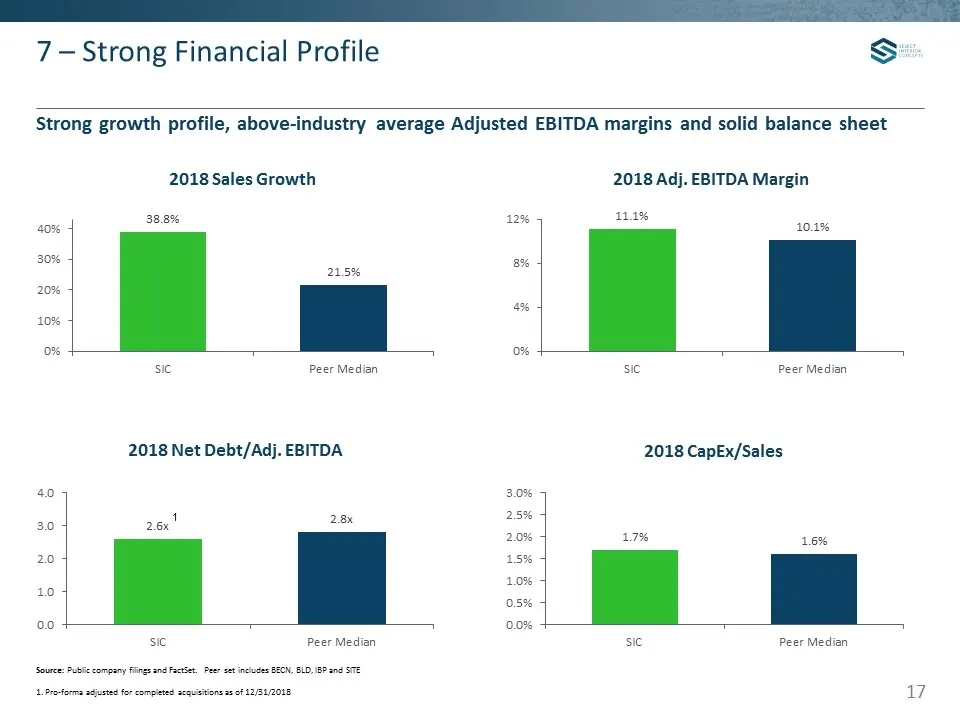
Strong growth profile, above-industry average Adjusted EBITDA margins and solid balance sheet 7 – Strong Financial Profile 2018 Net Debt/Adj. EBITDA 2018 Adj. EBITDA Margin Source: Public company filings and FactSet. Peer set includes BECN, BLD, IBP and SITE 1. Pro-forma adjusted for completed acqui
Slide 18: Strong Financial Profile: Balance Sheet Liquidity and Leverage
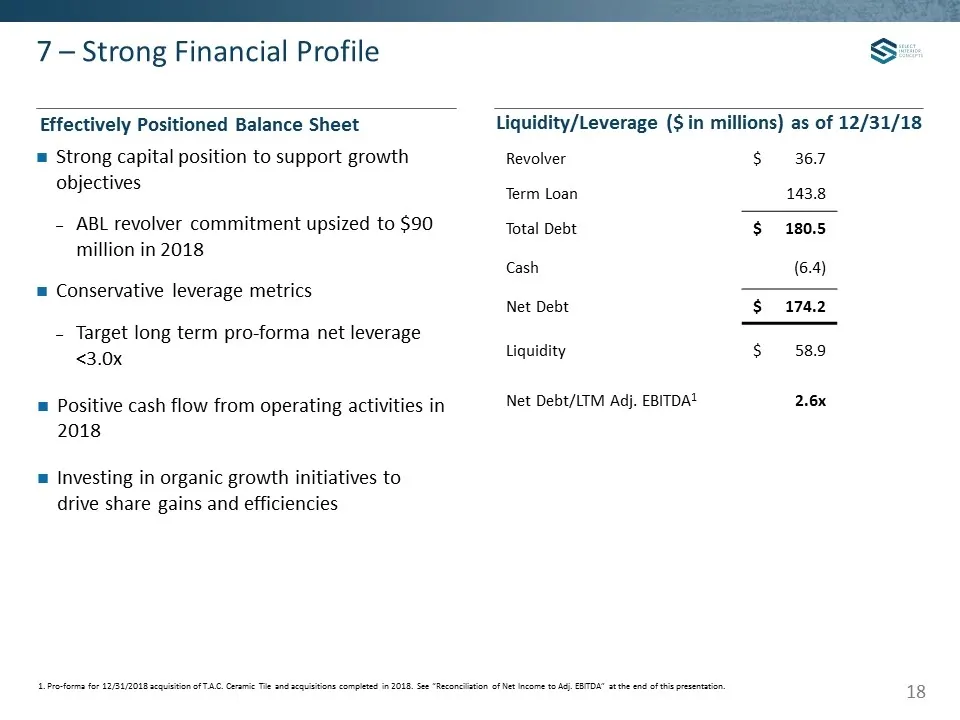
7 – Strong Financial Profile 1. Pro-forma for 12/31/2018 acquisition of T.A.C. Ceramic Tile and acquisitions completed in 2018. See “Reconciliation of Net Income to Adj. EBITDA” at the end of this presentation. Effectively Positioned Balance Sheet Liquidity/Leverage ($ in millions) as of 12/31/18 St
Slide 19: Appendix
Appendix
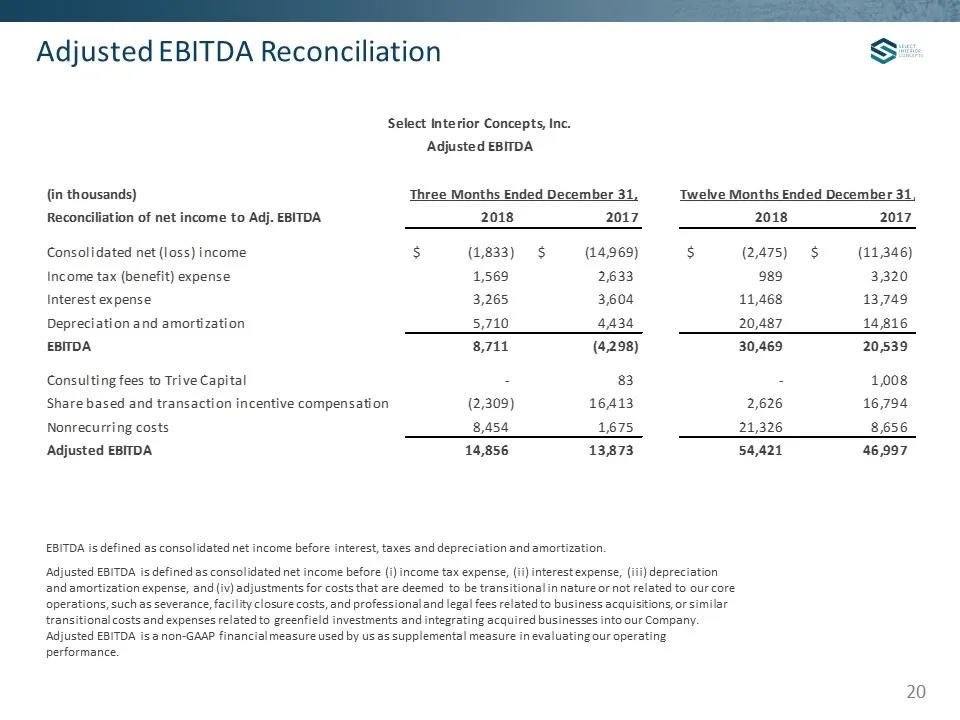
Slide 20: Adjusted EBITDA Reconciliation
Adjusted EBITDA Reconciliation EBITDA is defined as consolidated net income before interest, taxes and depreciation and amortization. Adjusted EBITDA is defined as consolidated net income before (i) income tax expense, (ii) interest expense, (iii) depreciation and amortization expense, and (iv) adju
Source: SEC EDGAR · 8-K filed Mar 20, 2019