Select Interior Concepts — Investor Presentation (December 2020)
20 slides from Select Interior Concepts's investor presentation, Dec 7, 2020
Slide 1: Investor Presentation December 2020
December 2020 NASDAQ: SIC Investor Presentation Exhibit 99.1
Slide 2: Forward-Looking Statements
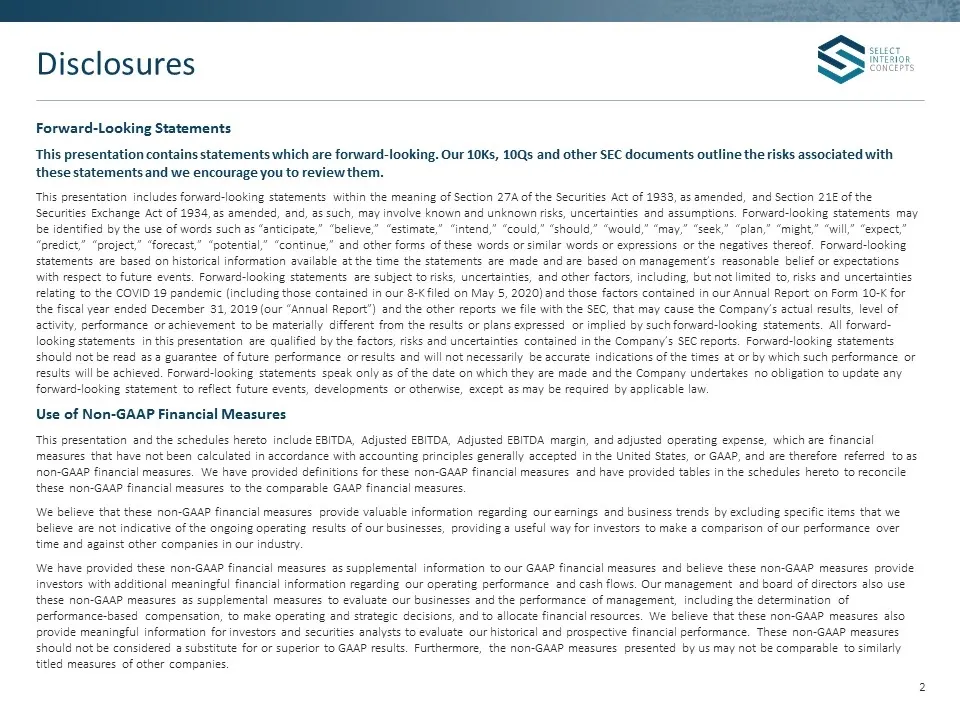
Forward-Looking Statements This presentation contains statements which are forward-looking. Our 10Ks, 10Qs and other SEC documents outline the risks associated with these statements and we encourage you to review them. This presentation includes forward-looking statements within the meaning of Secti
Slide 3: Company Overview
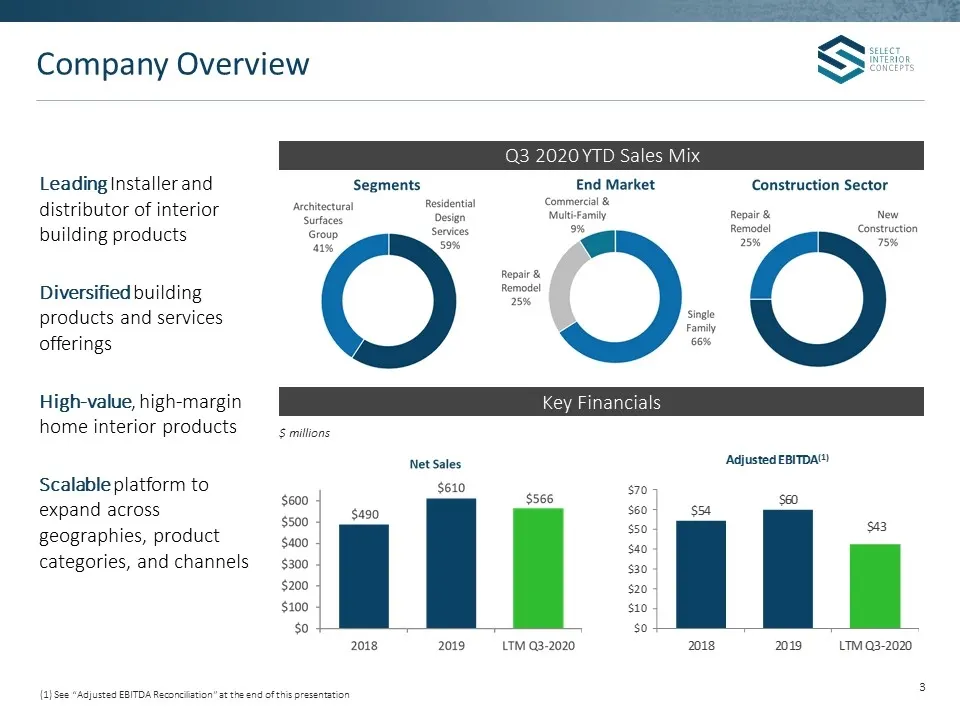
Company Overview Leading Installer and distributor of interior building products Diversified building products and services offerings High-value, high-margin home interior products Scalable platform to expand across geographies, product categories, and channels $ millions Q3 2020 YTD Sales Mix Key F
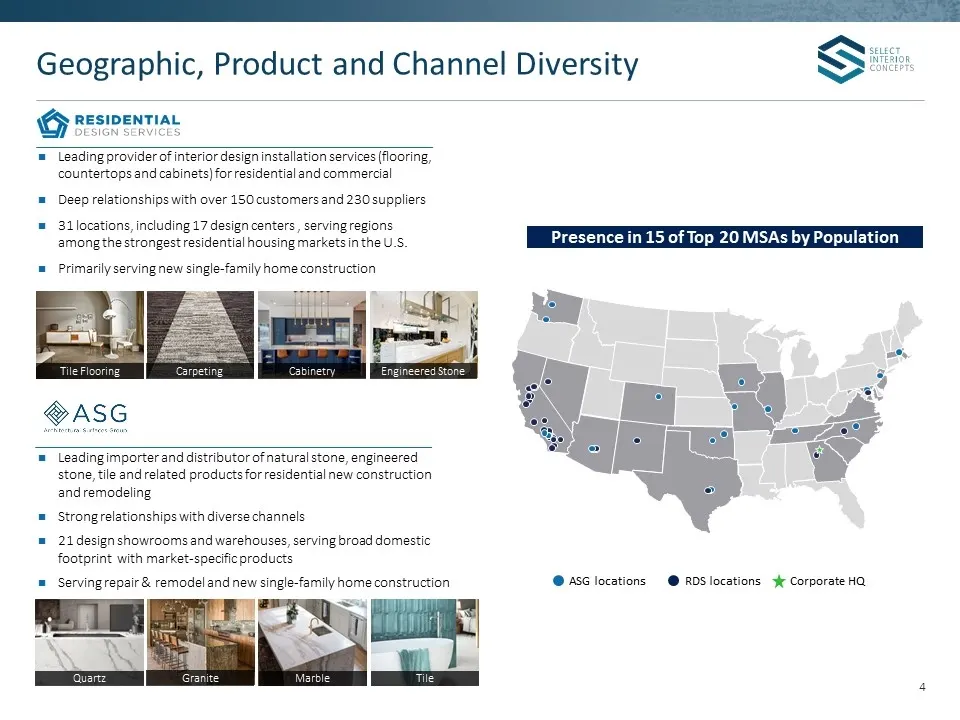
Slide 4: Geographic, Product and Channel Diversity
Leading provider of interior design installation services (flooring, countertops and cabinets) for residential and commercial Deep relationships with over 150 customers and 230 suppliers 31 locations, including 17 design centers , serving regions among the strongest residential housing markets in th
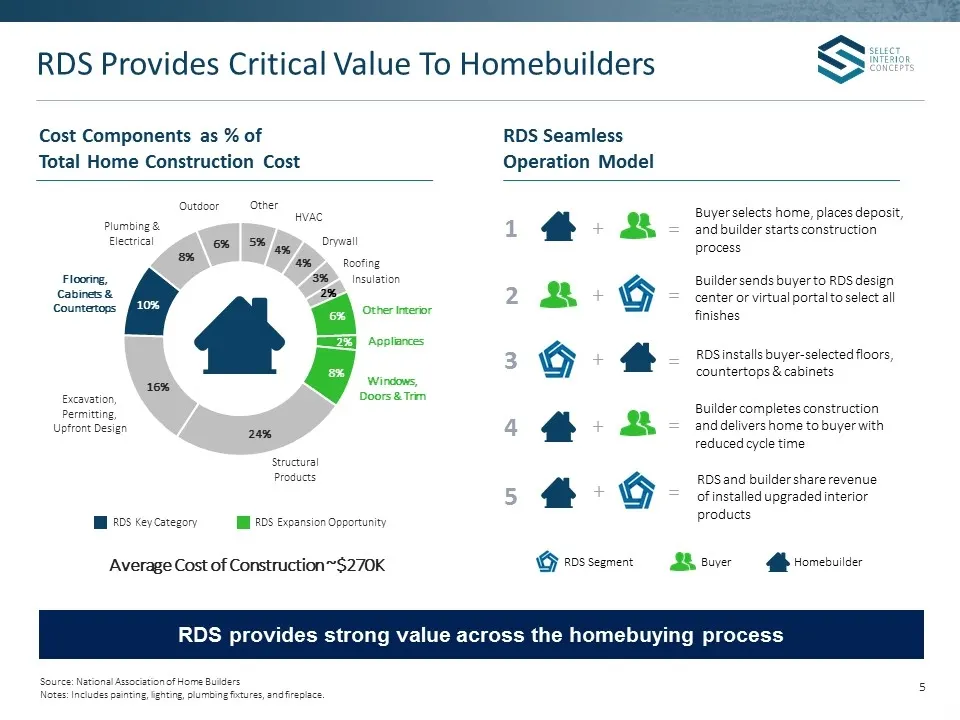
Slide 5: RDS Provides Critical Value To Homebuilders
RDS Provides Critical Value To Homebuilders Average Cost of Construction ~$270K Cost Components as % of Total Home Construction Cost HVAC Drywall Roofing Insulation Appliances Windows, Doors & Trim Structural Products Excavation, Permitting, Upfront Design Flooring, Cabinets & Countertops Plumbing &
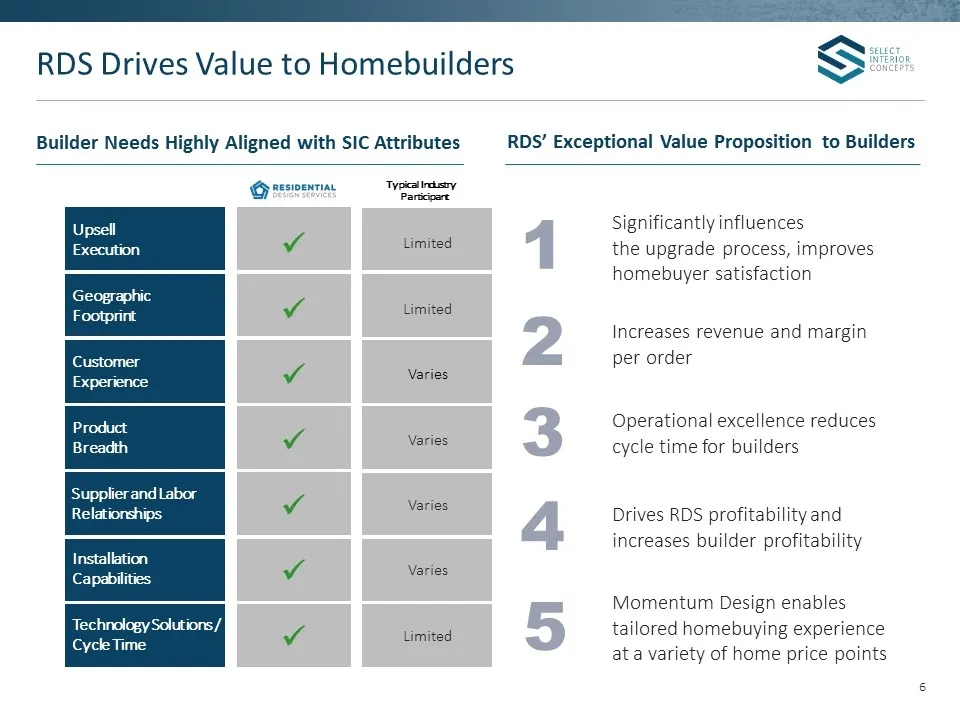
Slide 6: Builder Needs Highly Aligned with SIC Attributes
Builder Needs Highly Aligned with SIC Attributes RDS Drives Value to Homebuilders Typical Industry Participant 1 2 3 4 Significantly influences the upgrade process, improves homebuyer satisfaction Increases revenue and margin per order Operational excellence reduces cycle time for builders Drives RD
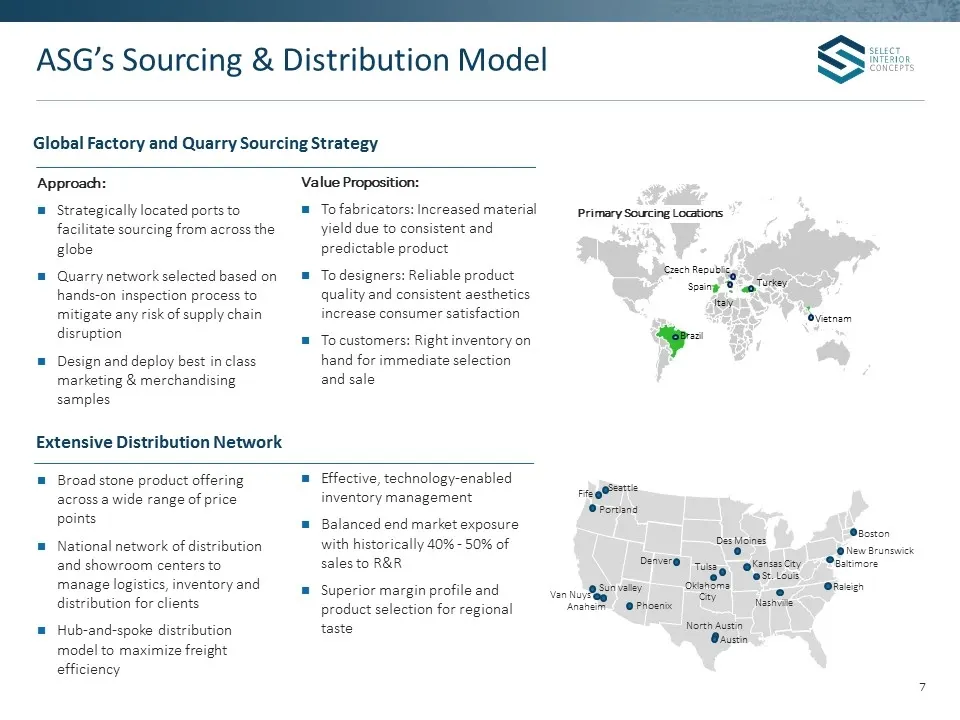
Slide 7: Global Factory and Quarry Sourcing Strategy
Brazil Spain Italy Vietnam Czech Republic Turkey Approach: Strategically located ports to facilitate sourcing from across the globe Quarry network selected based on hands-on inspection process to mitigate any risk of supply chain disruption Design and deploy best in class marketing & merchandising s
Slide 8: New CEO: Tenets of Growth Strategy
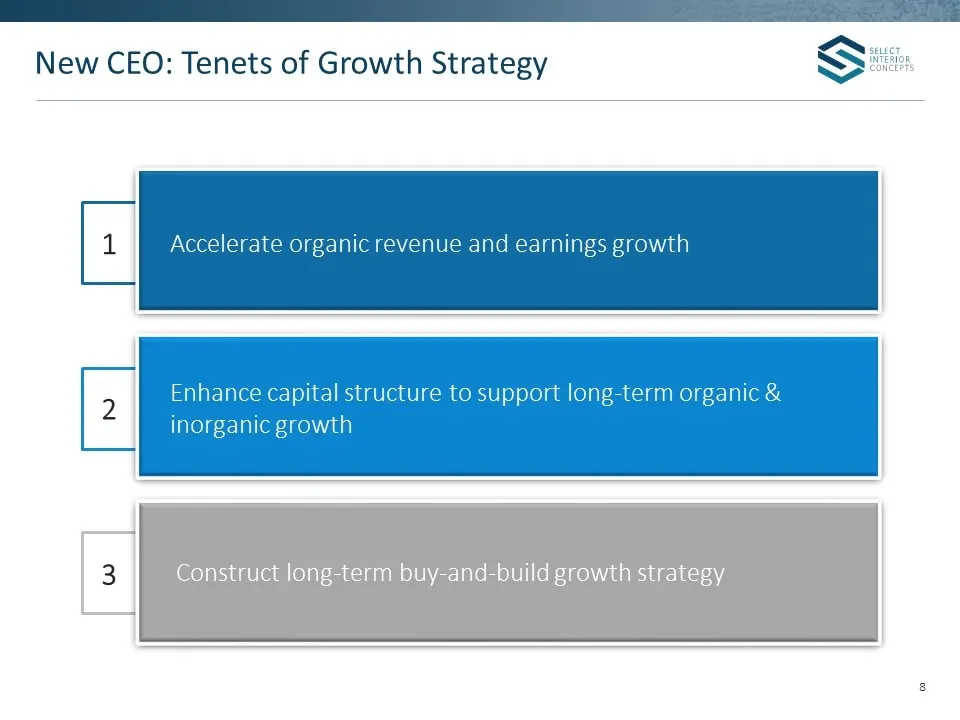
New CEO: Tenets of Growth Strategy 1 2 3 Accelerate organic revenue and earnings growth Enhance capital structure to support long-term organic & inorganic growth Construct long-term buy-and-build growth strategy
Slide 9: Accelerate Organic Revenue and Earnings Growth
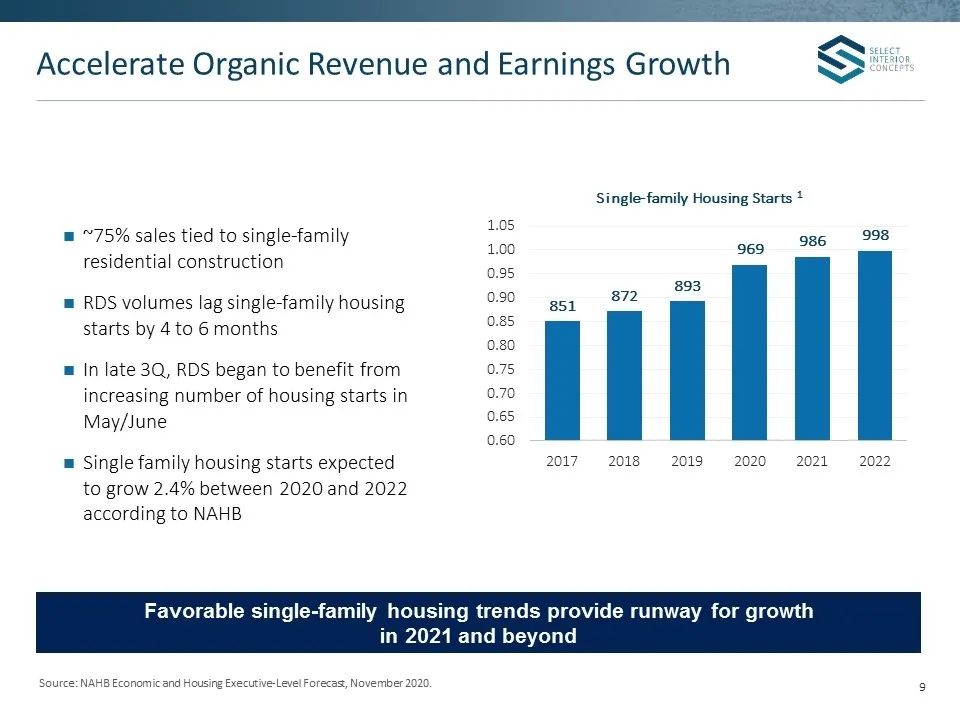
Accelerate Organic Revenue and Earnings Growth Source: NAHB Economic and Housing Executive-Level Forecast, November 2020. ~75% sales tied to single-family residential construction RDS volumes lag single-family housing starts by 4 to 6 months In late 3Q, RDS began to benefit from increasing number of
Slide 10: Structural improvements and cost savings initiatives
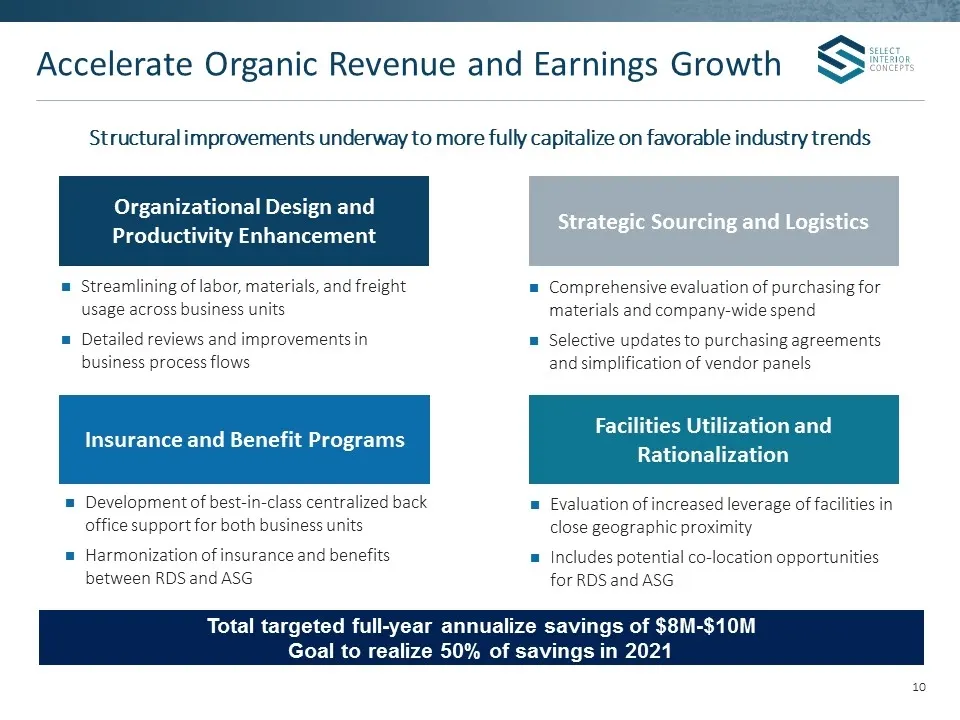
1 Facilities Utilization and Rationalization Insurance and Benefit Programs Organizational Design and Productivity Enhancement Strategic Sourcing and Logistics Structural improvements underway to more fully capitalize on favorable industry trends Accelerate Organic Revenue and Earnings Growth Stream
Slide 11: Additional Products, New Channels and Markets
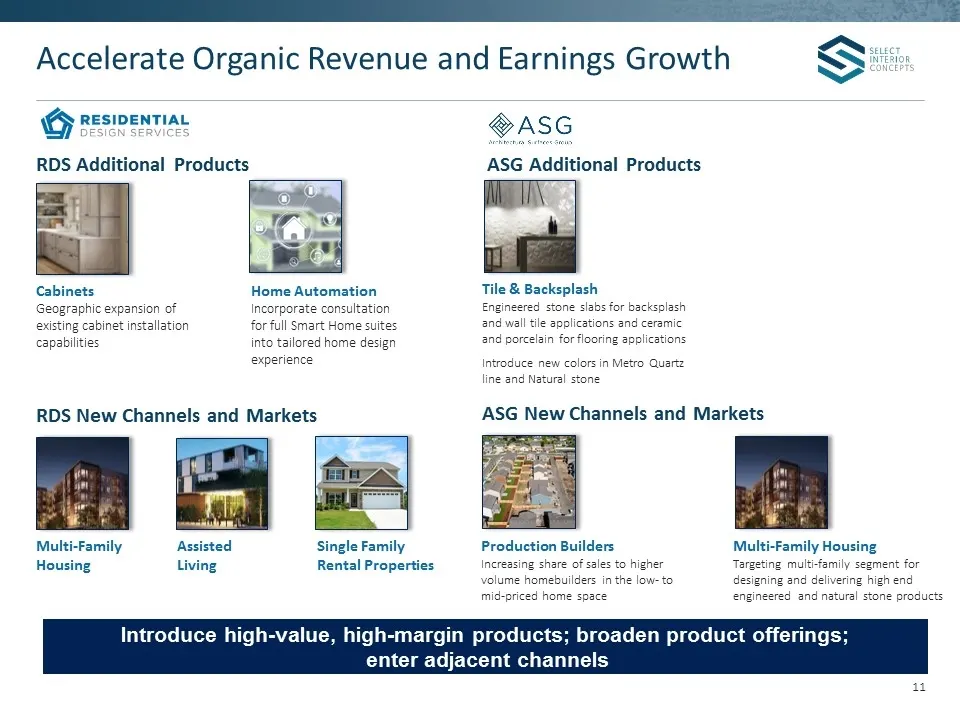
RDS Additional Products Accelerate Organic Revenue and Earnings Growth Home Automation Incorporate consultation for full Smart Home suites into tailored home design experience Cabinets Geographic expansion of existing cabinet installation capabilities RDS New Channels and Markets Assisted Living Mul
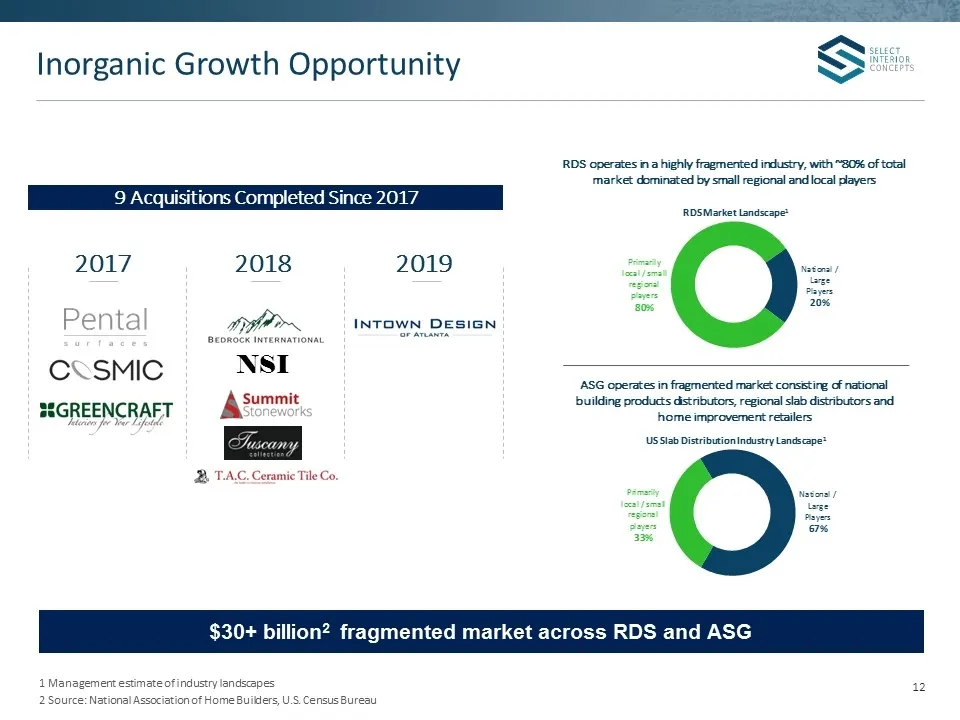
Slide 12: Inorganic Growth Opportunity
Inorganic Growth Opportunity 2017 ASG operates in fragmented market consisting of national building products distributors, regional slab distributors and home improvement retailers NSI $30+ billion2 fragmented market across RDS and ASG 9 Acquisitions Completed Since 2017 RDS operates in a highly fra
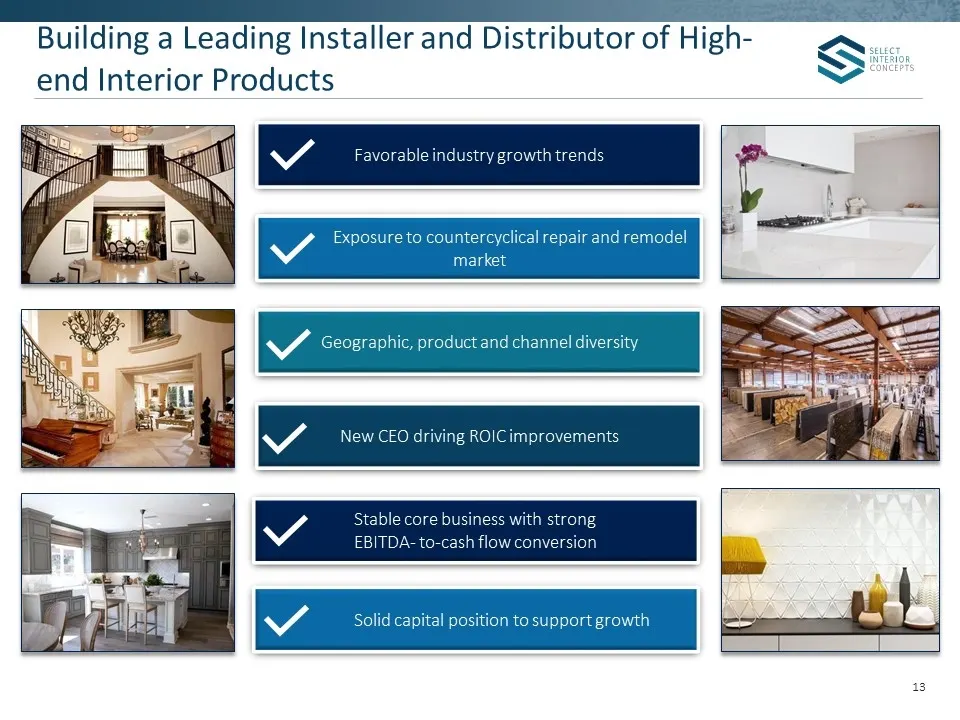
Slide 13: Building a Leading Installer and Distributor of High-end Interior Products
Building a Leading Installer and Distributor of High-end Interior Products Favorable industry growth trends Exposure to countercyclical repair and remodel market Geographic, product and channel diversity New CEO driving ROIC improvements Stable core business with strong EBITDA- to-cash flow conversi
Slide 14: Appendix
Appendix
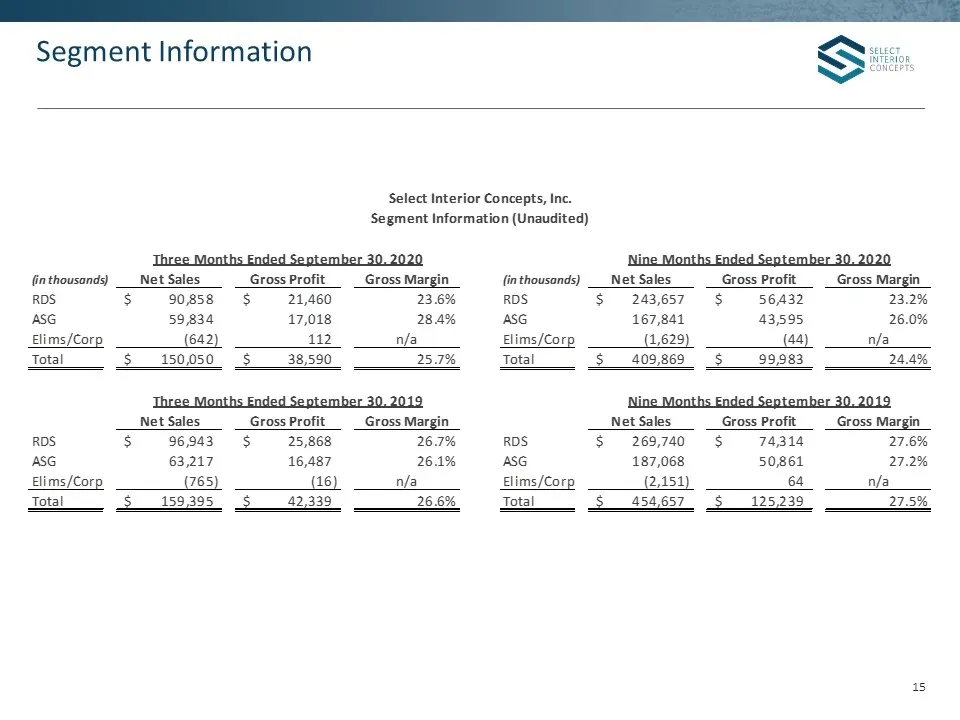
Slide 15: Segment Information
Segment Information Select Interior Concepts, Inc. ‘Segment Information (Unaudited) finthousands) __Net Sales Gross Profit _Gross Margin {inthousonds) __Net Sales Gross Profit _ Gross Margin RDS $9085) 21,460 23.65 RDS $243,657 $ 56,432 23.2% ASG 59,834 17,018 28.4% ASG 167,841 43,595 26.0% Elims/Co
Slide 16: Adjusted EBITDA Reconciliation
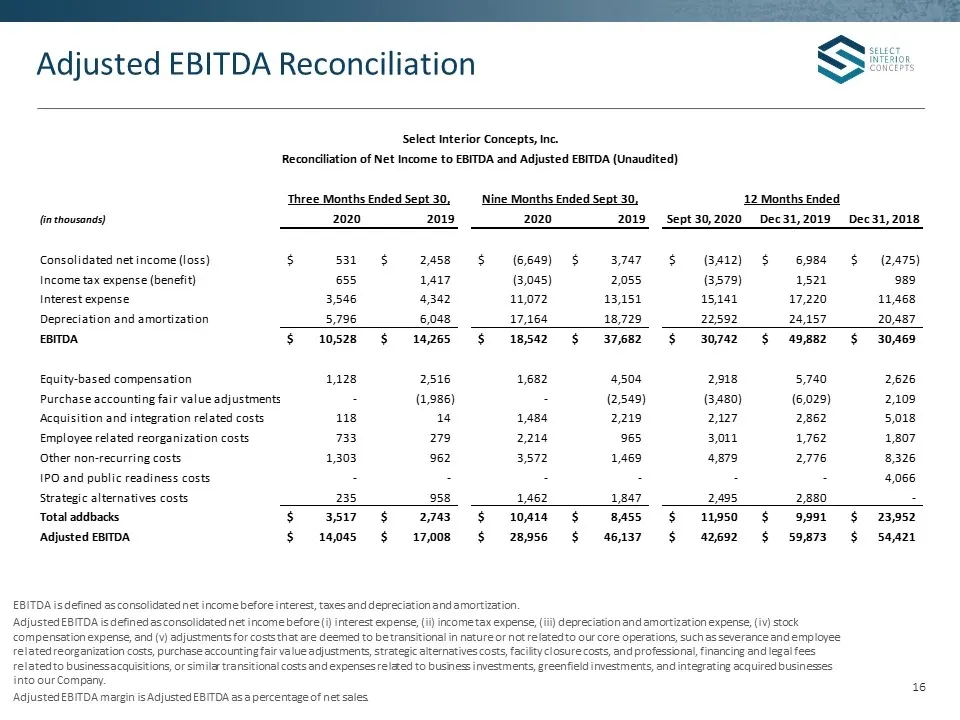
Adjusted EBITDA Reconciliation EBITDA is defined as consolidated net income before interest, taxes and depreciation and amortization. Adjusted EBITDA is defined as consolidated net income before (i) interest expense, (ii) income tax expense, (iii) depreciation and amortization expense, (iv) stock co
Slide 17: Variable Cost Structure and Pass-through Pricing Model
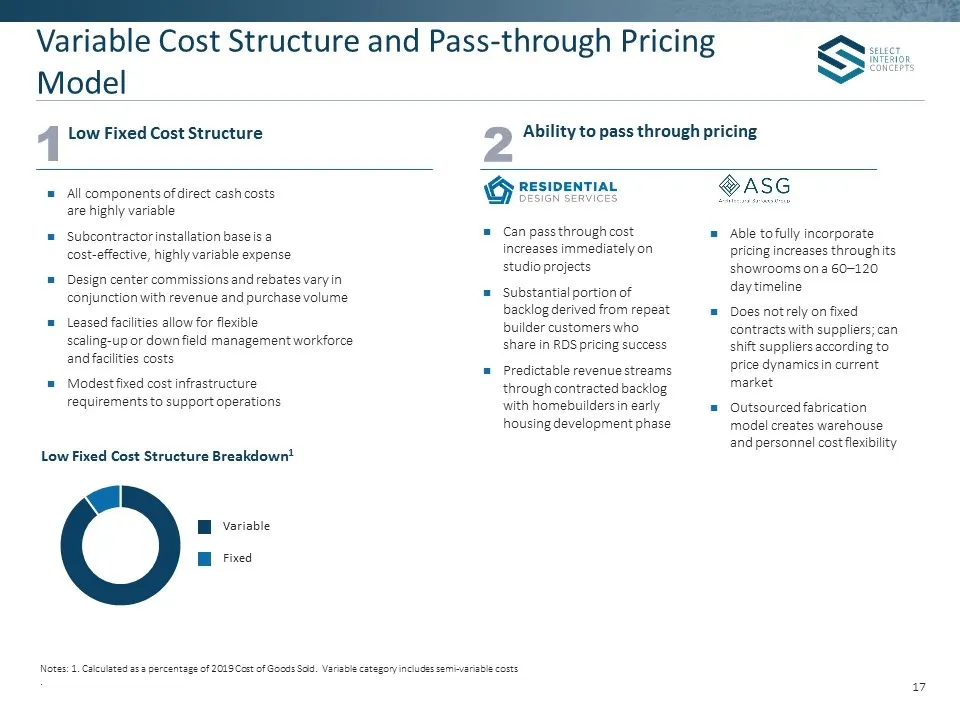
Variable Cost Structure and Pass-through Pricing Model Low Fixed Cost Structure Breakdown1 Variable Fixed Low Fixed Cost Structure Ability to pass through pricing Can pass through cost increases immediately on studio projects Substantial portion of backlog derived from repeat builder customers who s
Slide 18: Q3 2020 Year-Over-Year Net Sales Bridge
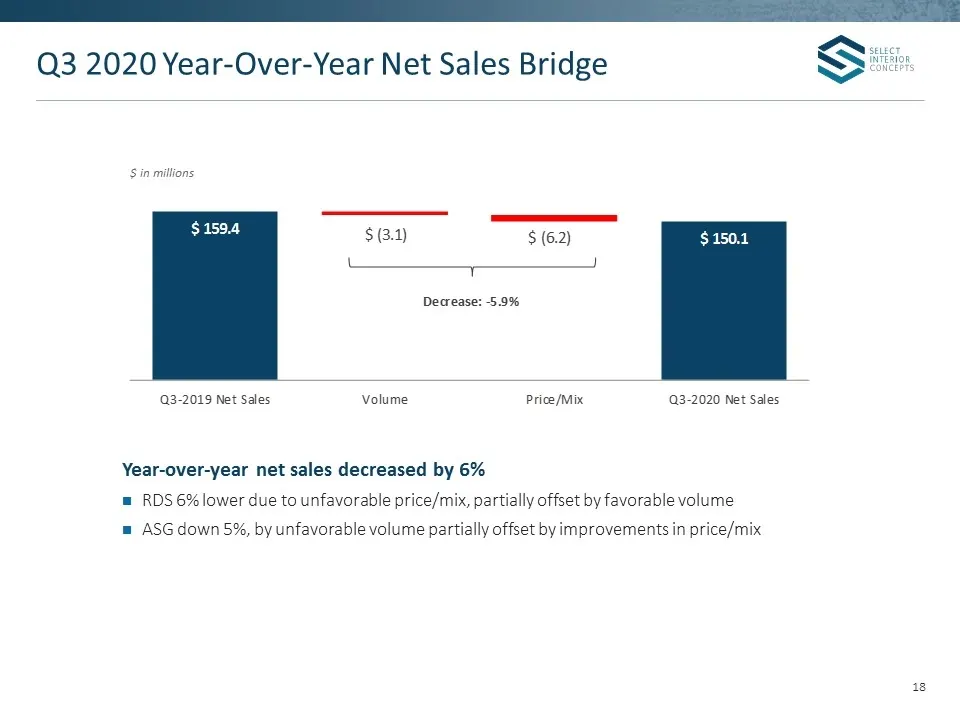
Q3 2020 Year-Over-Year Net Sales Bridge $ in millions Year-over-year net sales decreased by 6% RDS 6% lower due to unfavorable price/mix, partially offset by favorable volume ASG down 5%, by unfavorable volume partially offset by improvements in price/mix
Slide 19: Q3 2020 Year-Over-Year Adjusted EBITDA Bridge
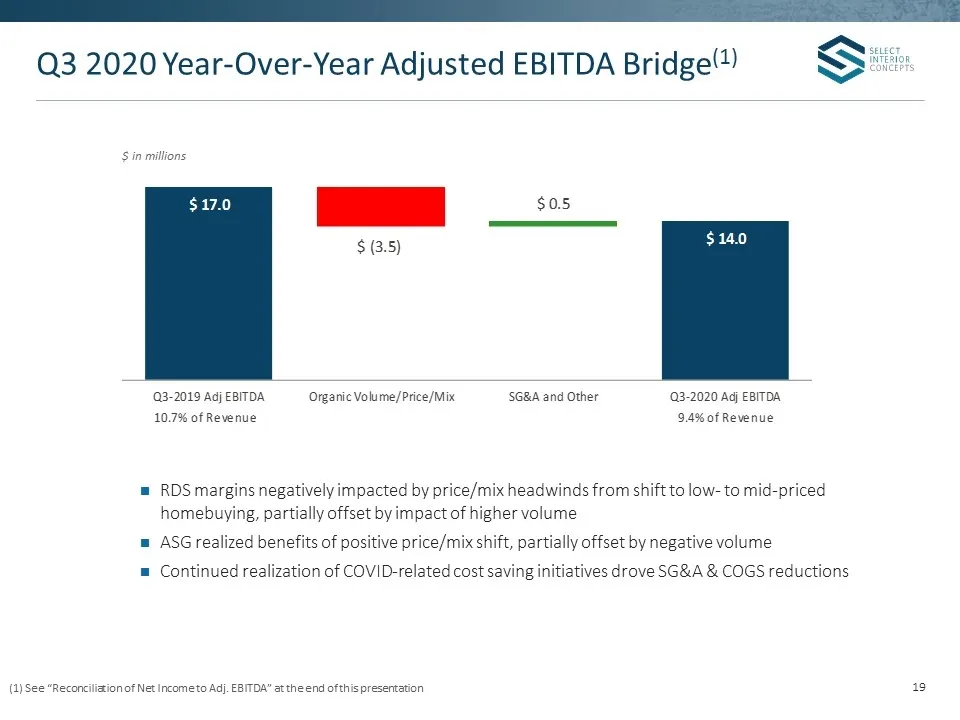
Q3 2020 Year-Over-Year Adjusted EBITDA Bridge(1) $ in millions RDS margins negatively impacted by price/mix headwinds from shift to low- to mid-priced homebuying, partially offset by impact of higher volume ASG realized benefits of positive price/mix shift, partially offset by negative volume Contin
Slide 20: Cash Flow and Balance Sheet Leverage
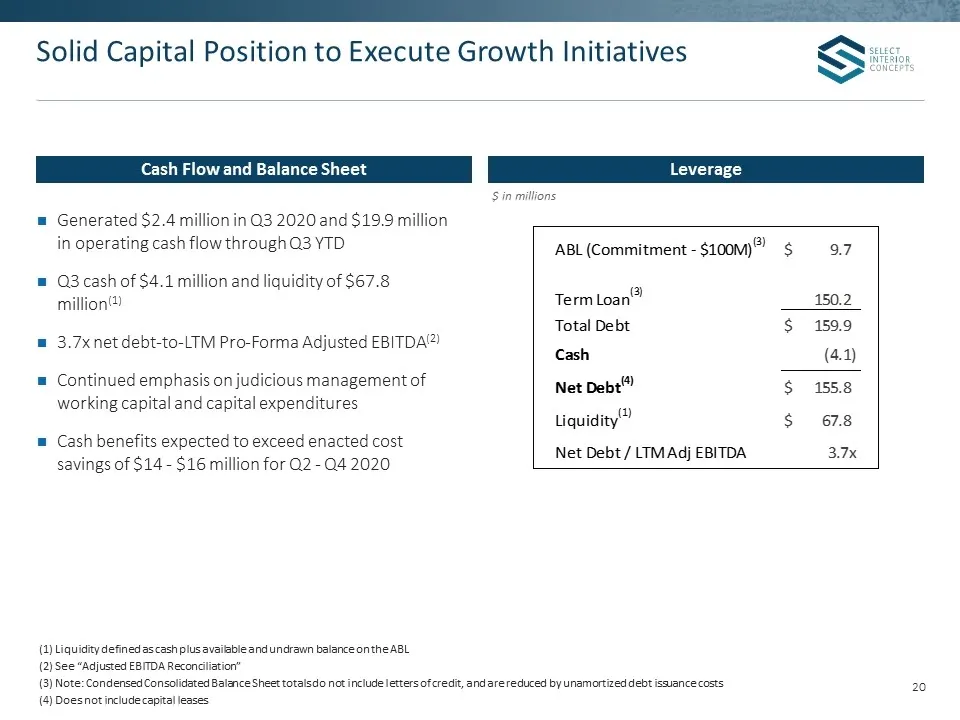
Cash Flow and Balance Sheet Leverage 0 $ in millions Solid Capital Position to Execute Growth Initiatives Generated $2.4 million in Q3 2020 and $19.9 million in operating cash flow through Q3 YTD Q3 cash of $4.1 million and liquidity of $67.8 million(1) 3.7x net debt-to-LTM Pro-Forma Adjusted EBITDA
Source: SEC EDGAR · 8-K filed Dec 7, 2020