CyberAgent Incorporated · TSE:4751
CyberAgent — FY2010 Earnings Presentation
42 slides from CyberAgent's earnings presentation, November 2010
Slide 1: Table of Contents
0 Table of Contents 1 Overview of Consolidated Financial Results 2 Consolidated Business Forecast 3 Major Business 4 Ameba Business 5 Summary 1
Slide 2: Overview of Consolidated Financial Results
1 Overview of Consolidated Financial Results Overview of Consolidated Financial Results (October 2009-September 2010) 2
Slide 3: Full Year Highlights (Oct. 2009 – Sep. 2010)
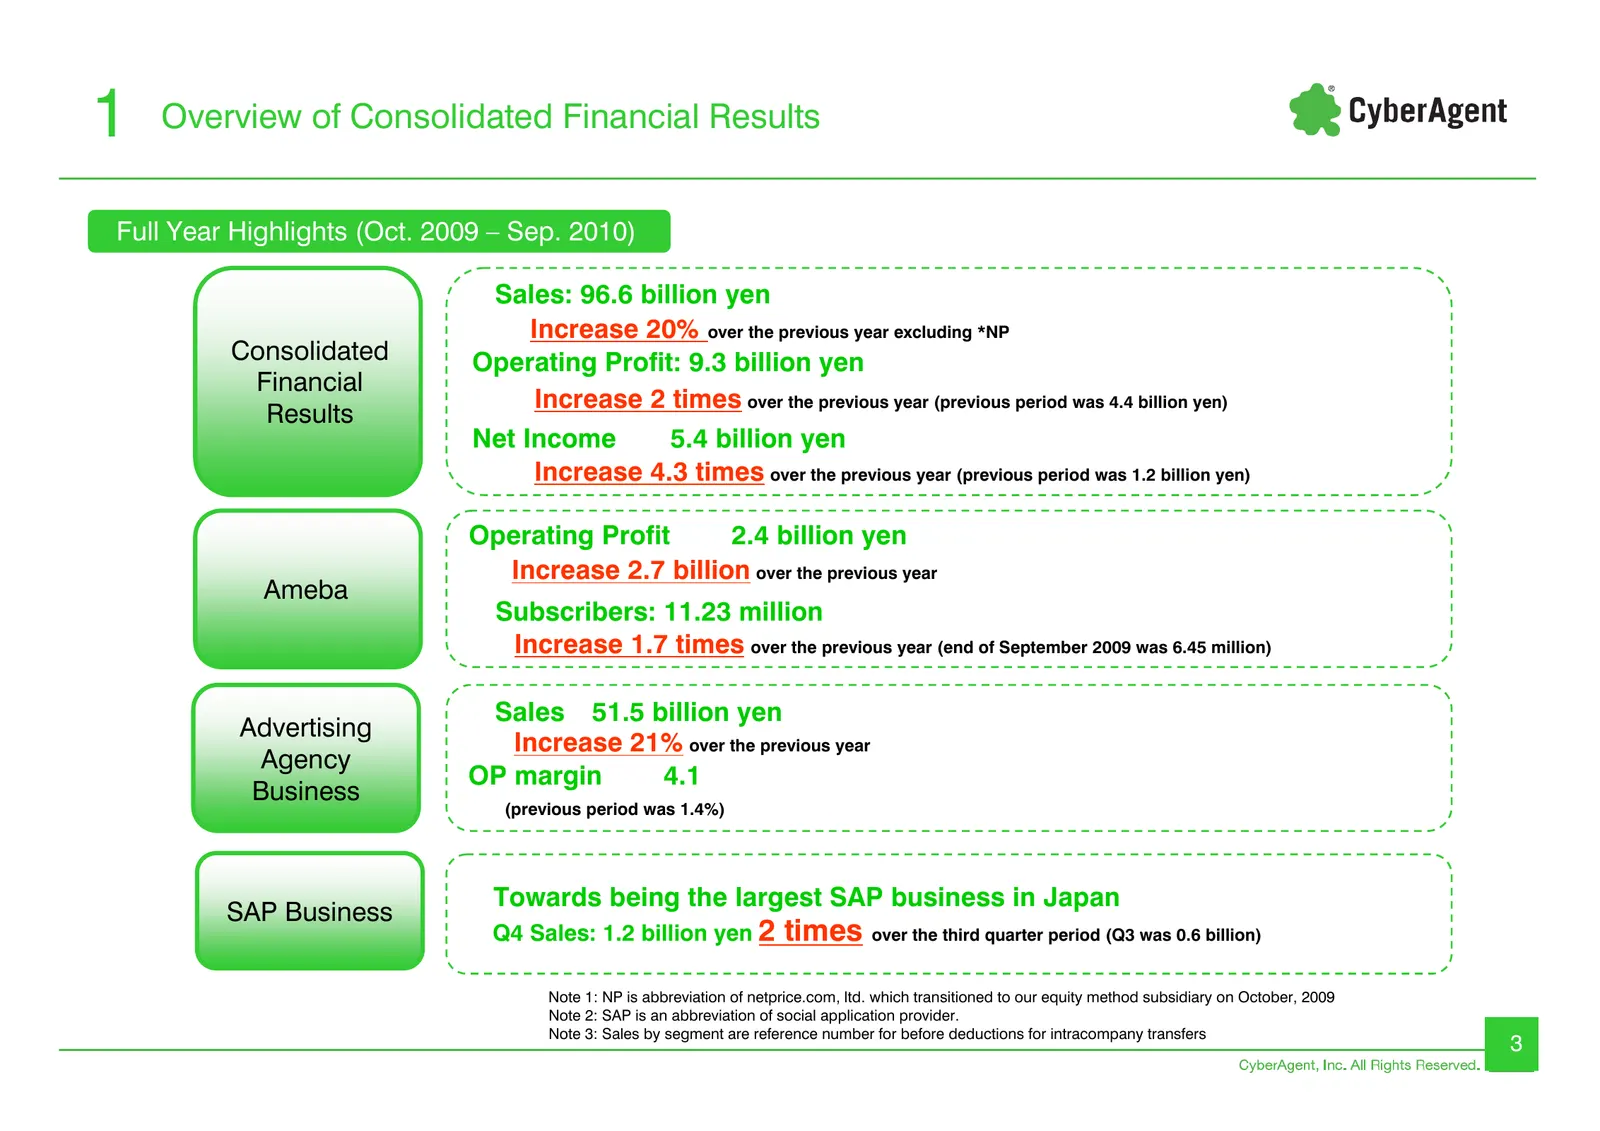
1 Overview of Consolidated Financial Results Full Year Highlights (Oct. 2009 – Sep. 2010) Sales: 96.6 billion yen Increase 20% over the previous year excluding *NP Consolidated Operating Profit: 9.3 billion yen Financial Increase 2 times over the previous year (previous period was 4.4 billion yen) R
Slide 4: Yearly Consolidated Financial Result Trends
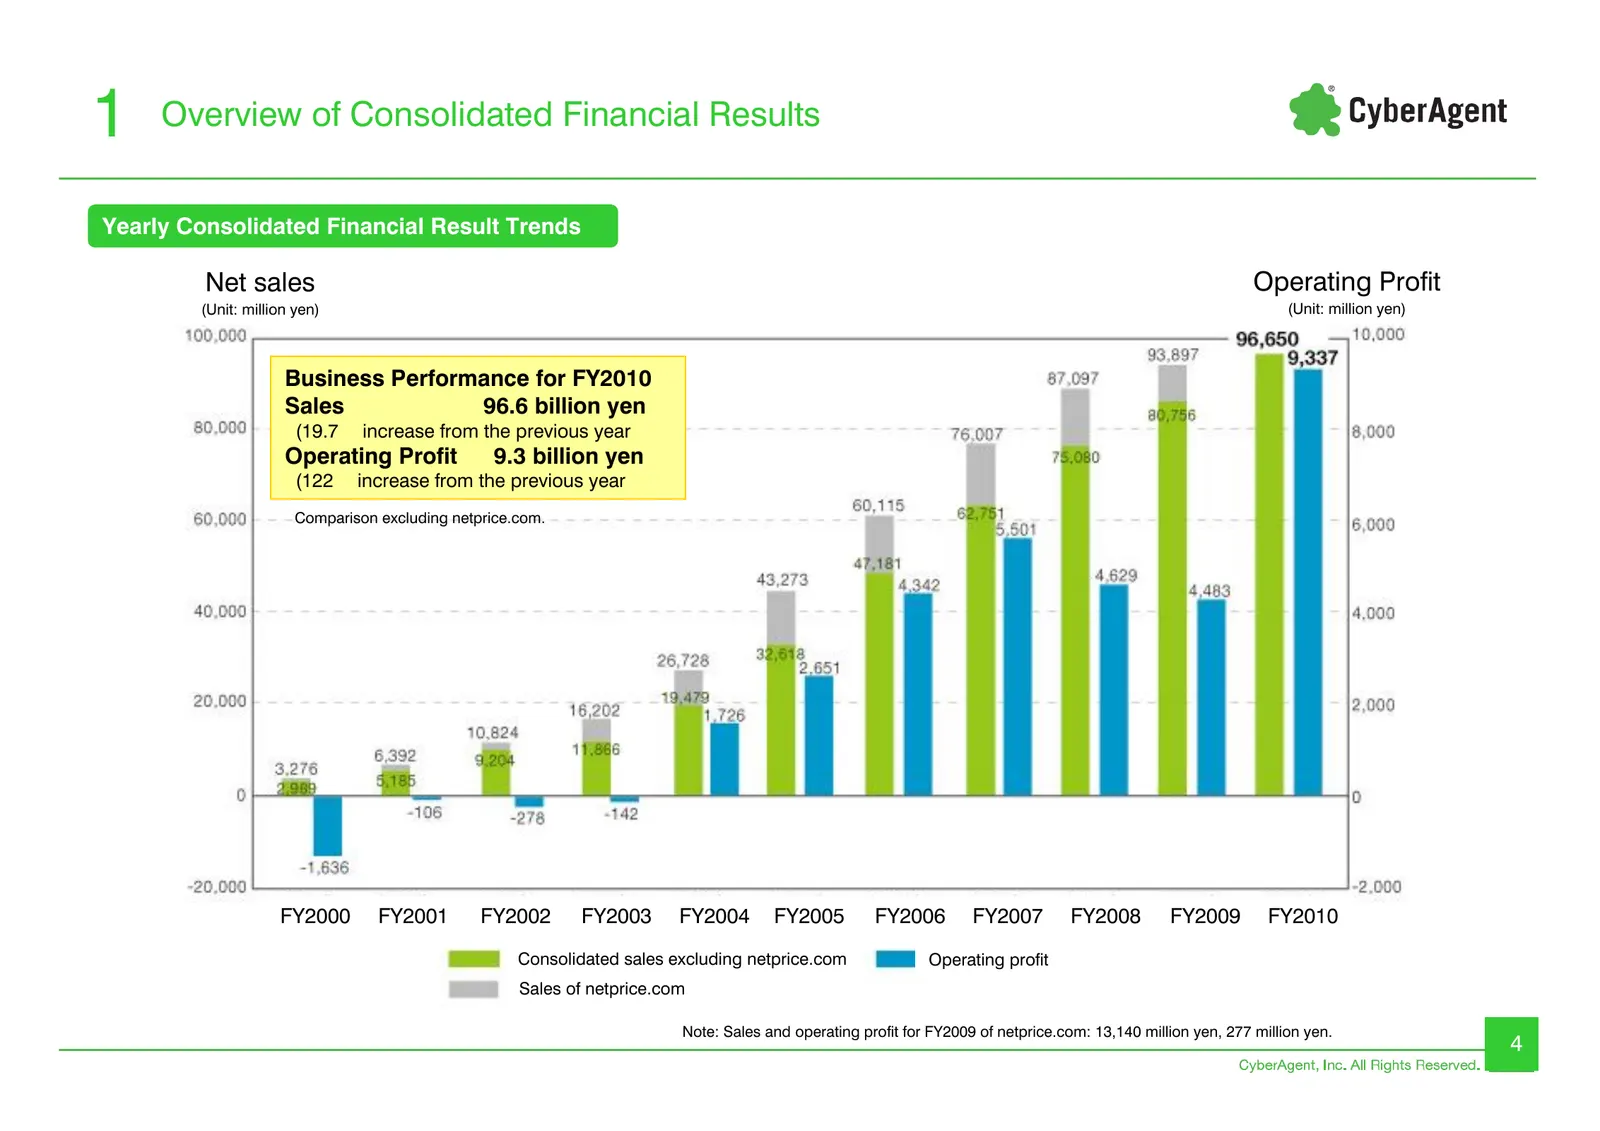
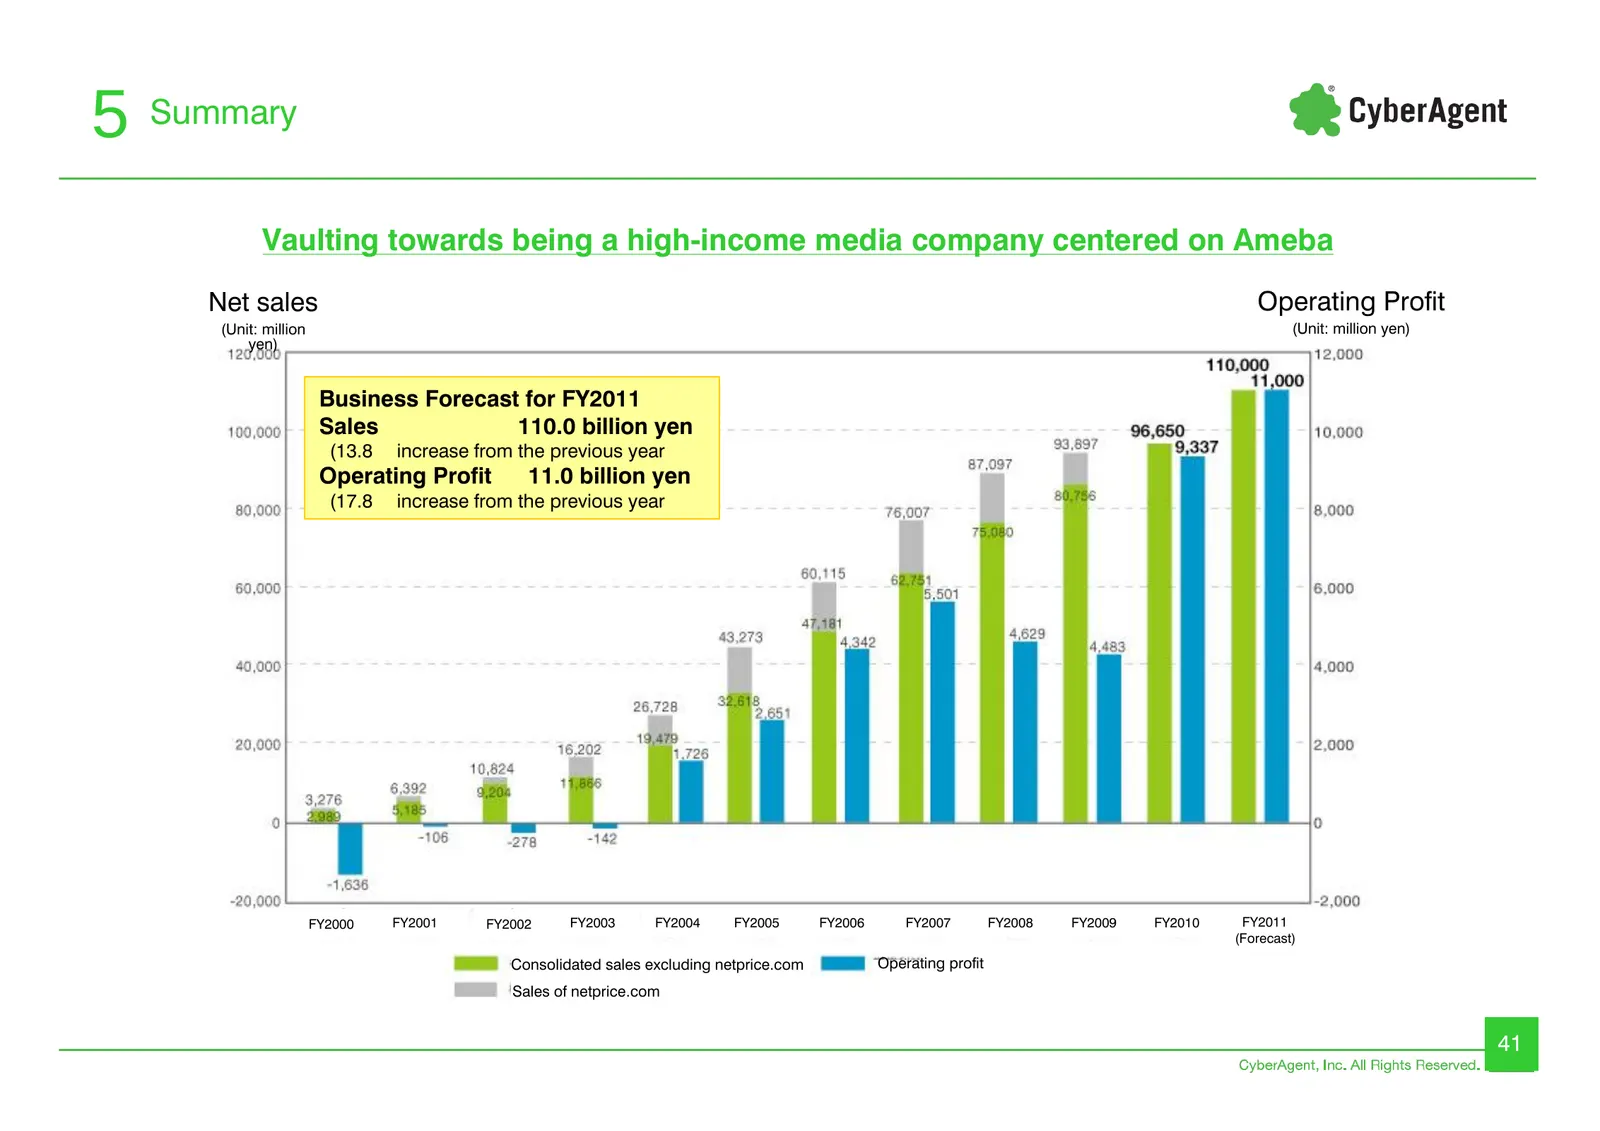
1 Overview of Consolidated Financial Results Yearly Consolidated Financial Result Trends Net sales Operating Profit (Unit: million yen) (Unit: million yen) Business Performance for FY2010 Sales 96.6 billion yen (19.7 increase from the previous year Operating Profit 9.3 billion yen (122 increase from
Slide 5: Consolidated Income Statement (PL)
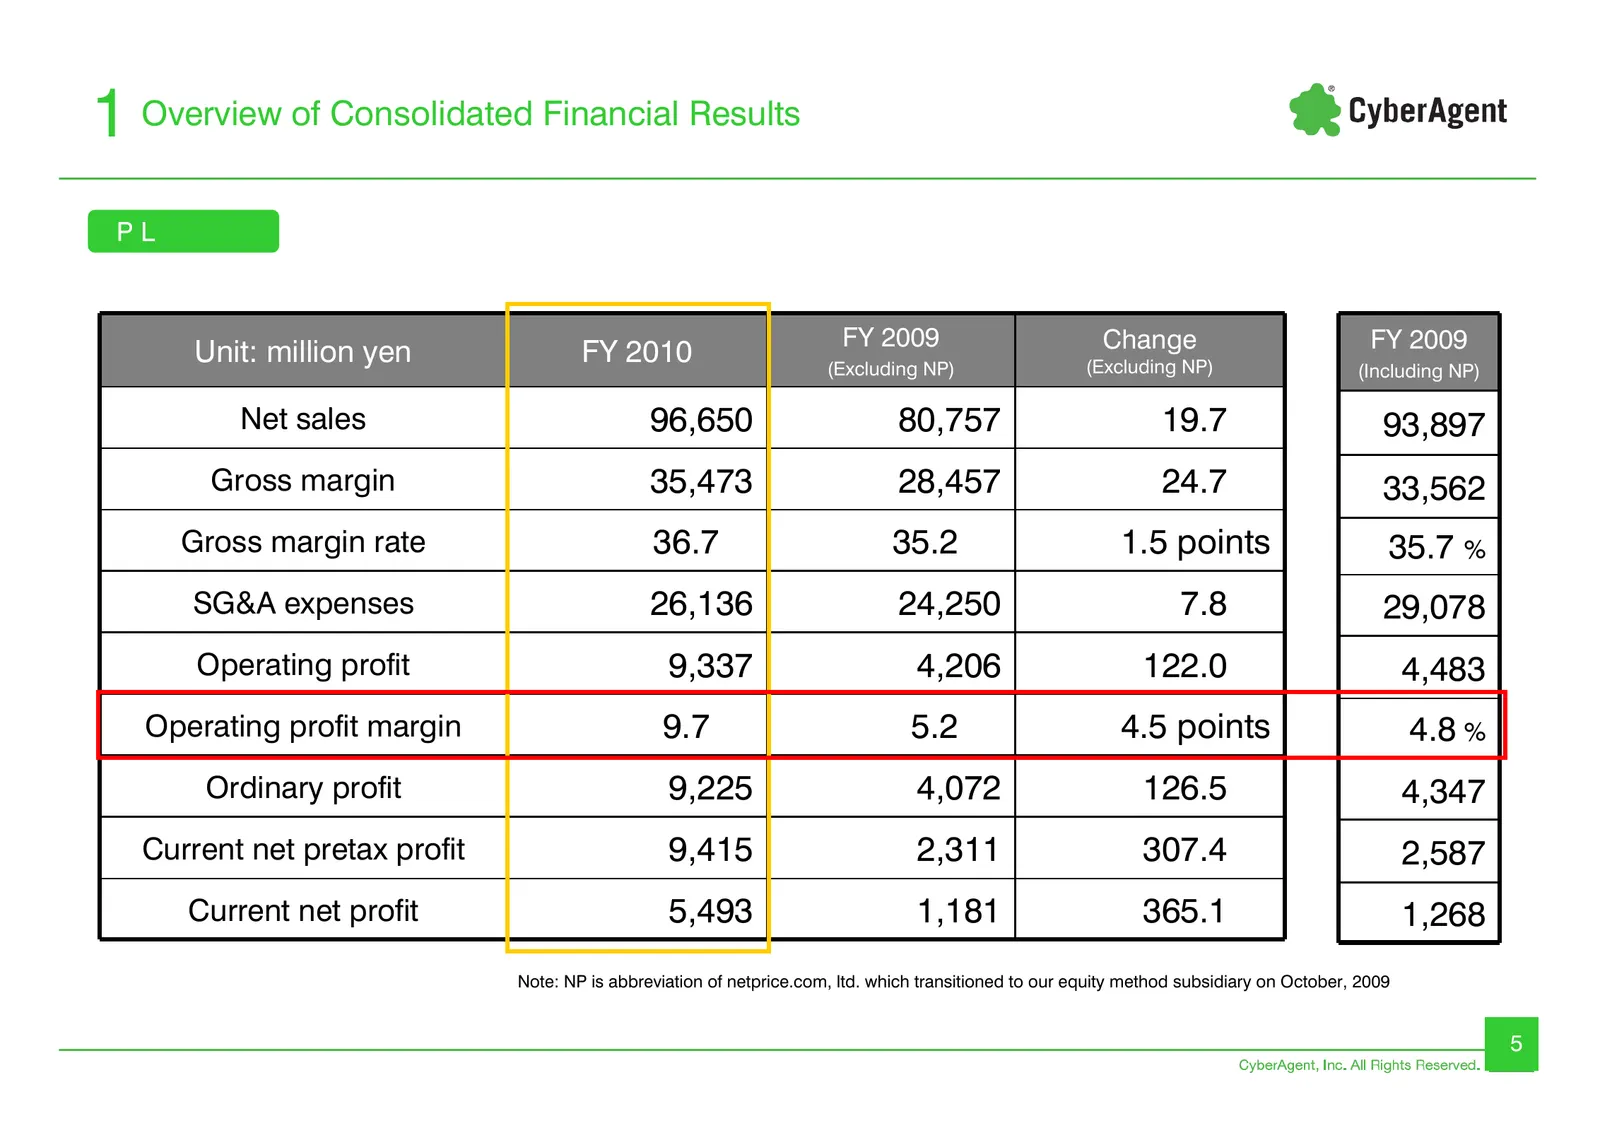
1 Overview of Consolidated Financial Results PL FY 2009 Change FY 2009 Unit: million yen FY 2010 (Excluding NP) (Excluding NP) (Including NP) Net sales 96,650 80,757 19.7 93,897 Gross margin 35,473 28,457 24.7 33,562 Gross margin rate 36.7 35.2 1.5 points 35.7 % SG&A expenses 26,136 24,250 7.8 29,07
Slide 6: Quarterly Consolidated Sales
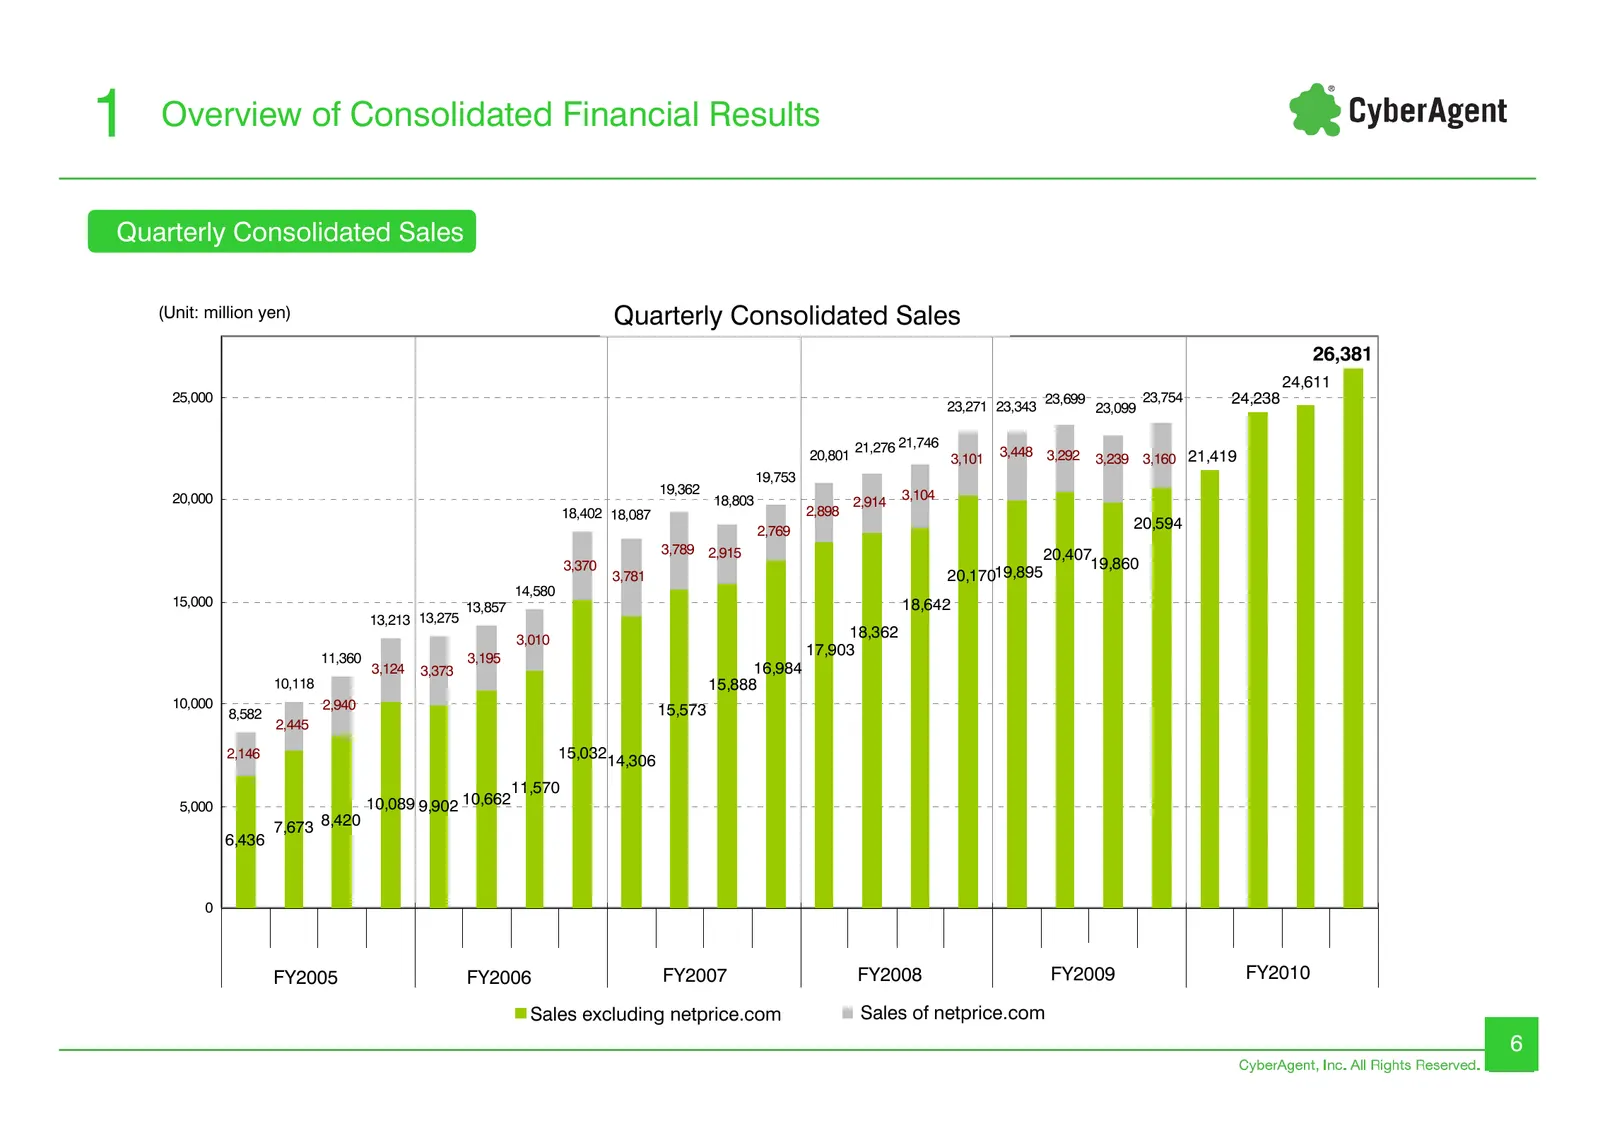
1 Overview of Consolidated Financial Results Quarterly Consolidated Sales (Unit: million yen) Quarterly Consolidated Sales 26,381 24,611 25,000 23,754 24,238 23,271 23,343 23,699 23,099 21,276 21,746 3,448 3,292 20,801 3,101 3,239 3,160 21,419 19,753 19,362 3,104 20,000 18,803 2,914 18,402 18,087 2,
Slide 7: Quarterly Number of Employees in Consolidated Companies
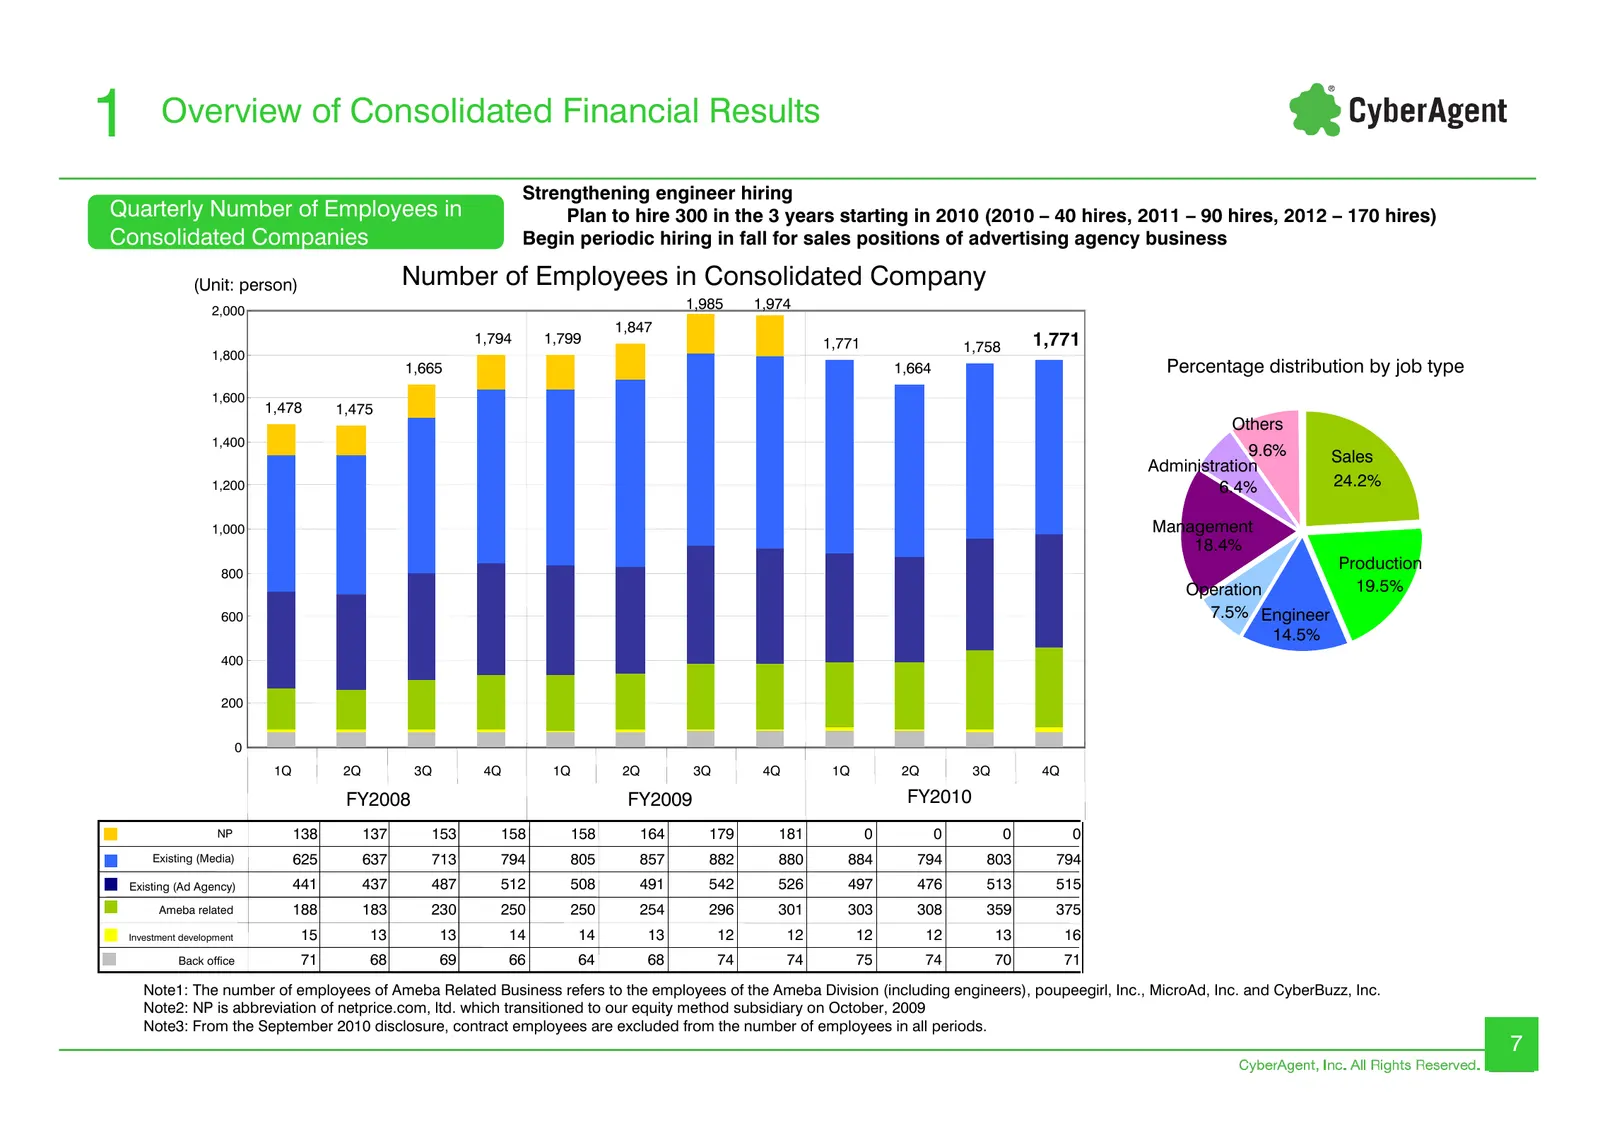
1 Overview of Consolidated Financial Results Strengthening engineer hiring Quarterly Number of Employees in Plan to hire 300 in the 3 years starting in 2010 (2010 – 40 hires, 2011 – 90 hires, 2012 – 170 hires) Consolidated Companies Begin periodic hiring in fall for sales positions of advertising ag
Slide 8: Quarterly SG&A Expenses
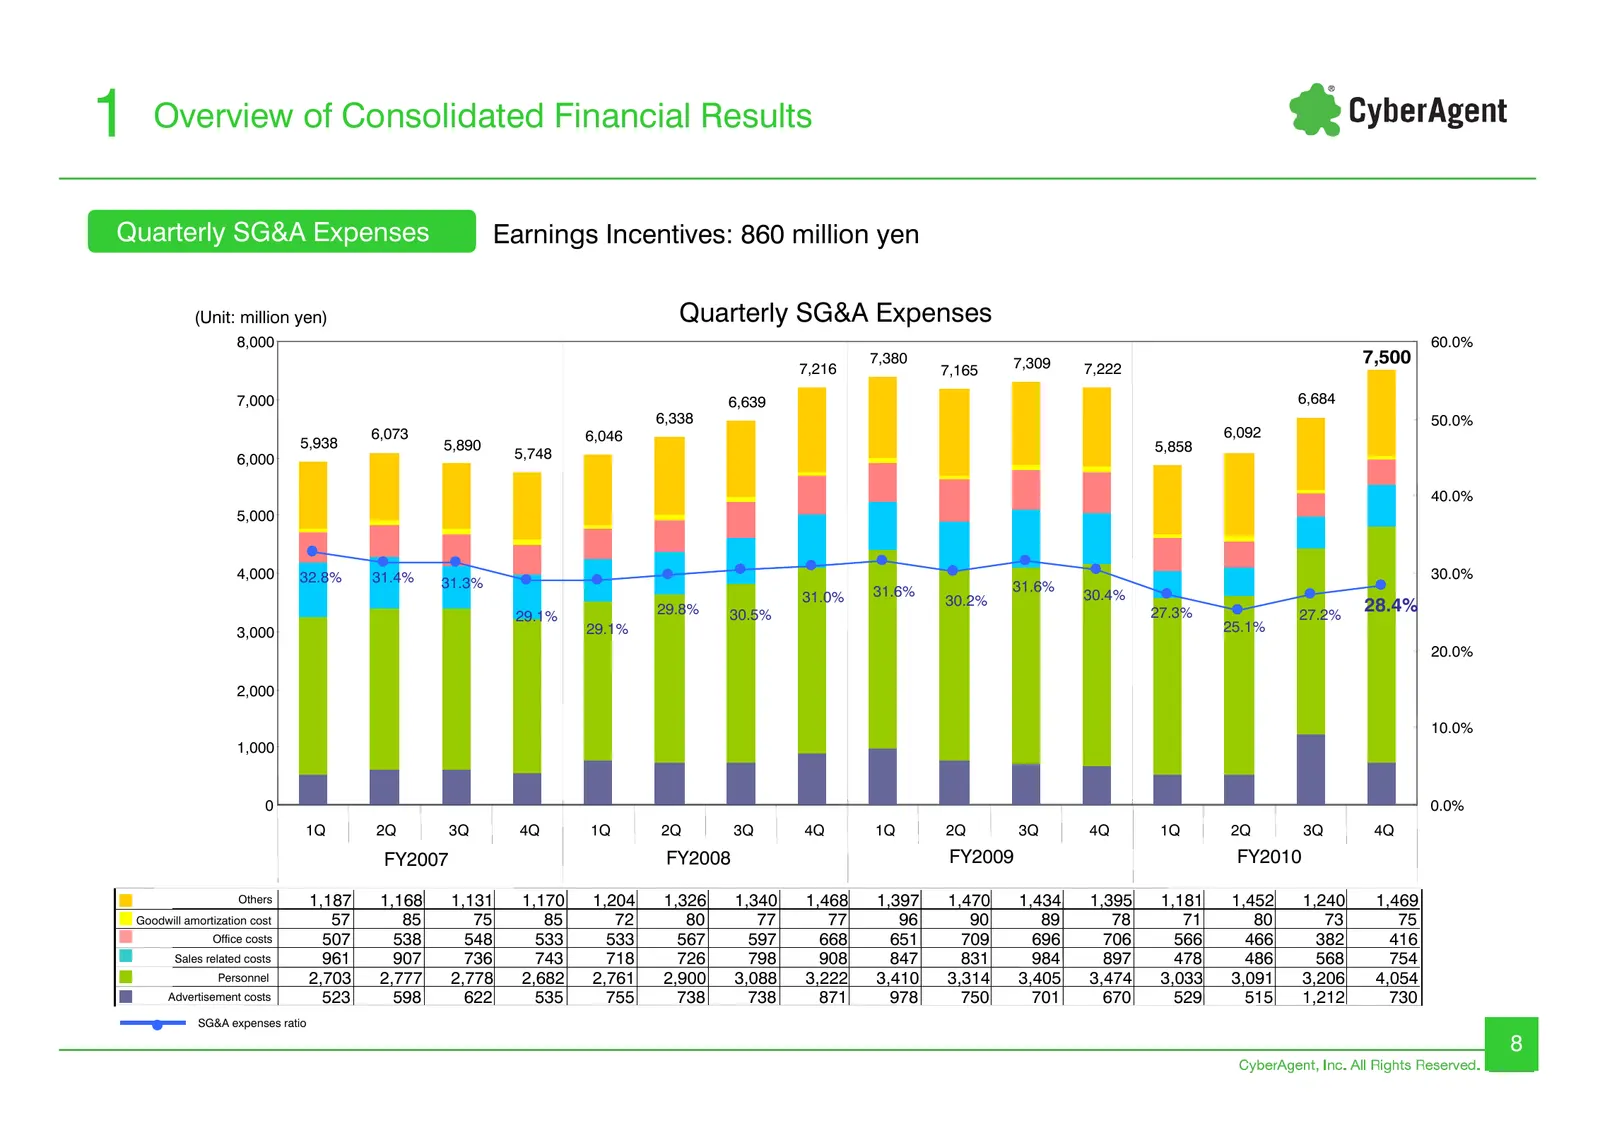
1 Overview of Consolidated Financial Results Quarterly SG&A Expenses Earnings Incentives: 860 million yen (Unit: million yen) Quarterly SG&A Expenses 8,000 60.0% 7,380 7,309 7,500 7,216 7,165 7,222 7,000 6,639 6,684 6,338 50.0% 6,073 6,046 6,092 5,938 5,890 5,858 6,000 5,748 40.0% 5,000 4,000 32.8%
Slide 9: Quarterly Operating Profit by Business Segments
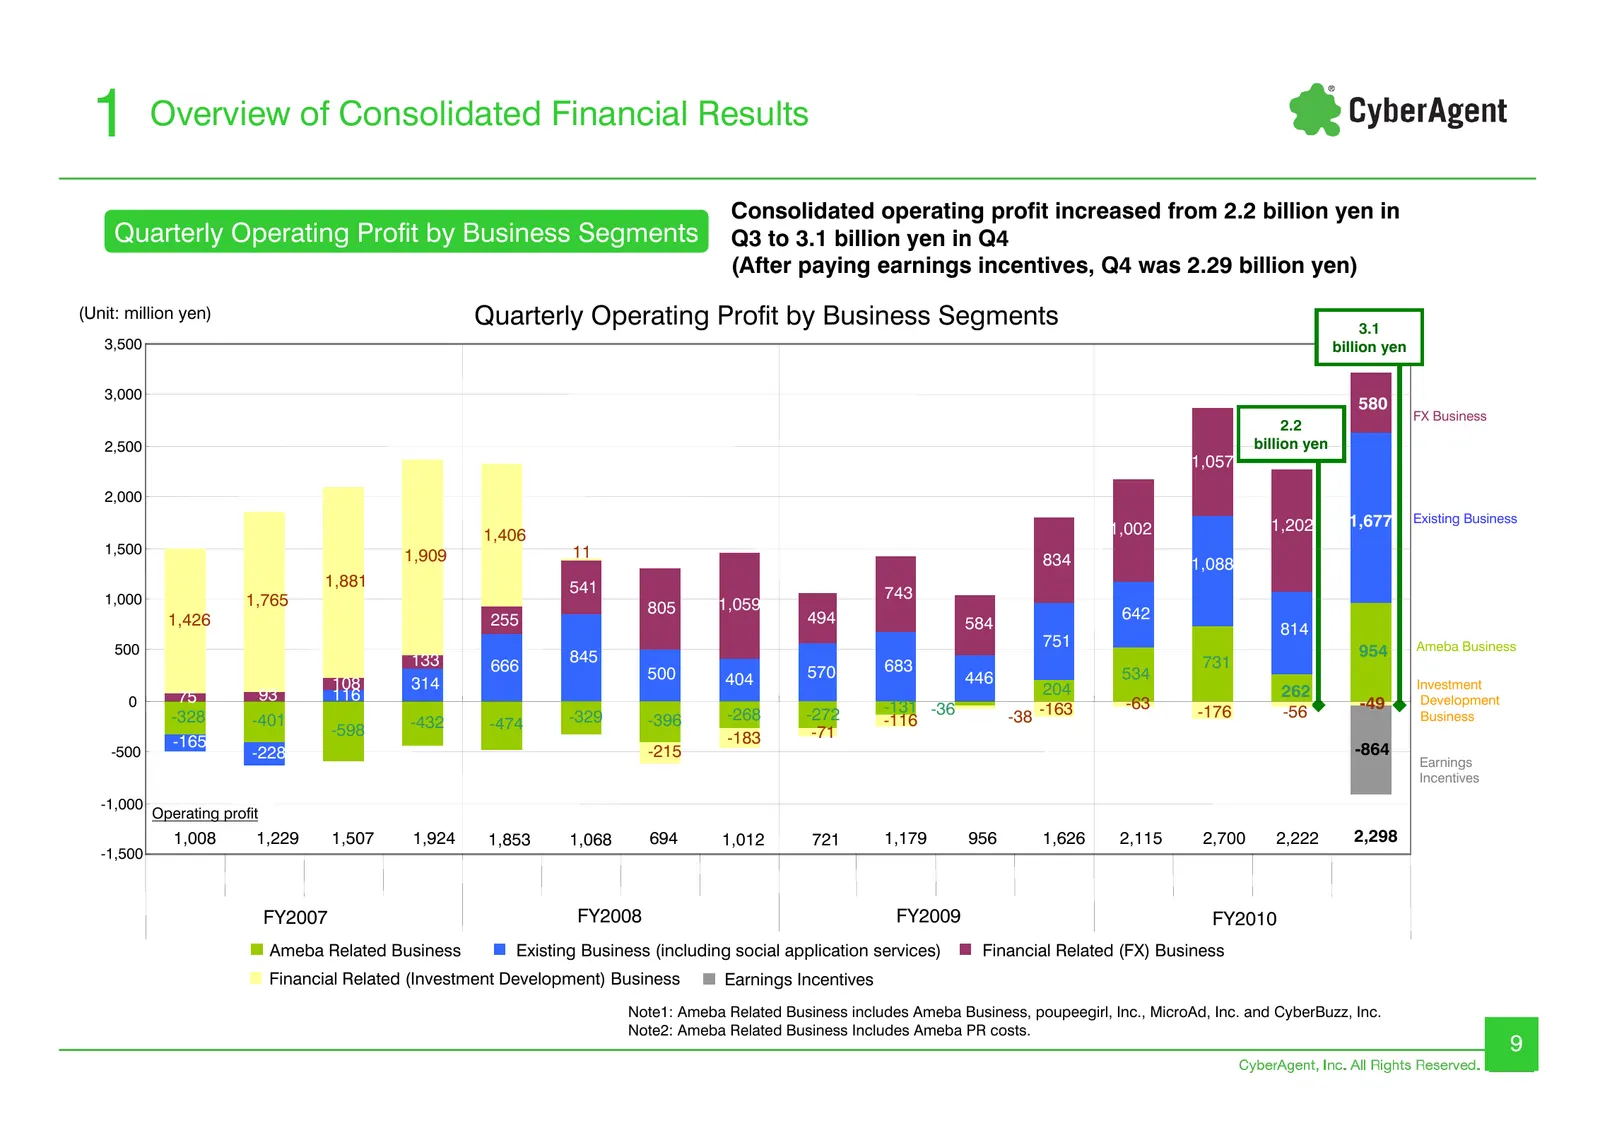
1 Overview of Consolidated Financial Results Consolidated operating profit increased from 2.2 billion yen in Quarterly Operating Profit by Business Segments Q3 to 3.1 billion yen in Q4 (After paying earnings incentives, Q4 was 2.29 billion yen) (Unit: million yen) Quarterly Operating Profit by Busin
Slide 10: Breakdown of the Operating Profit
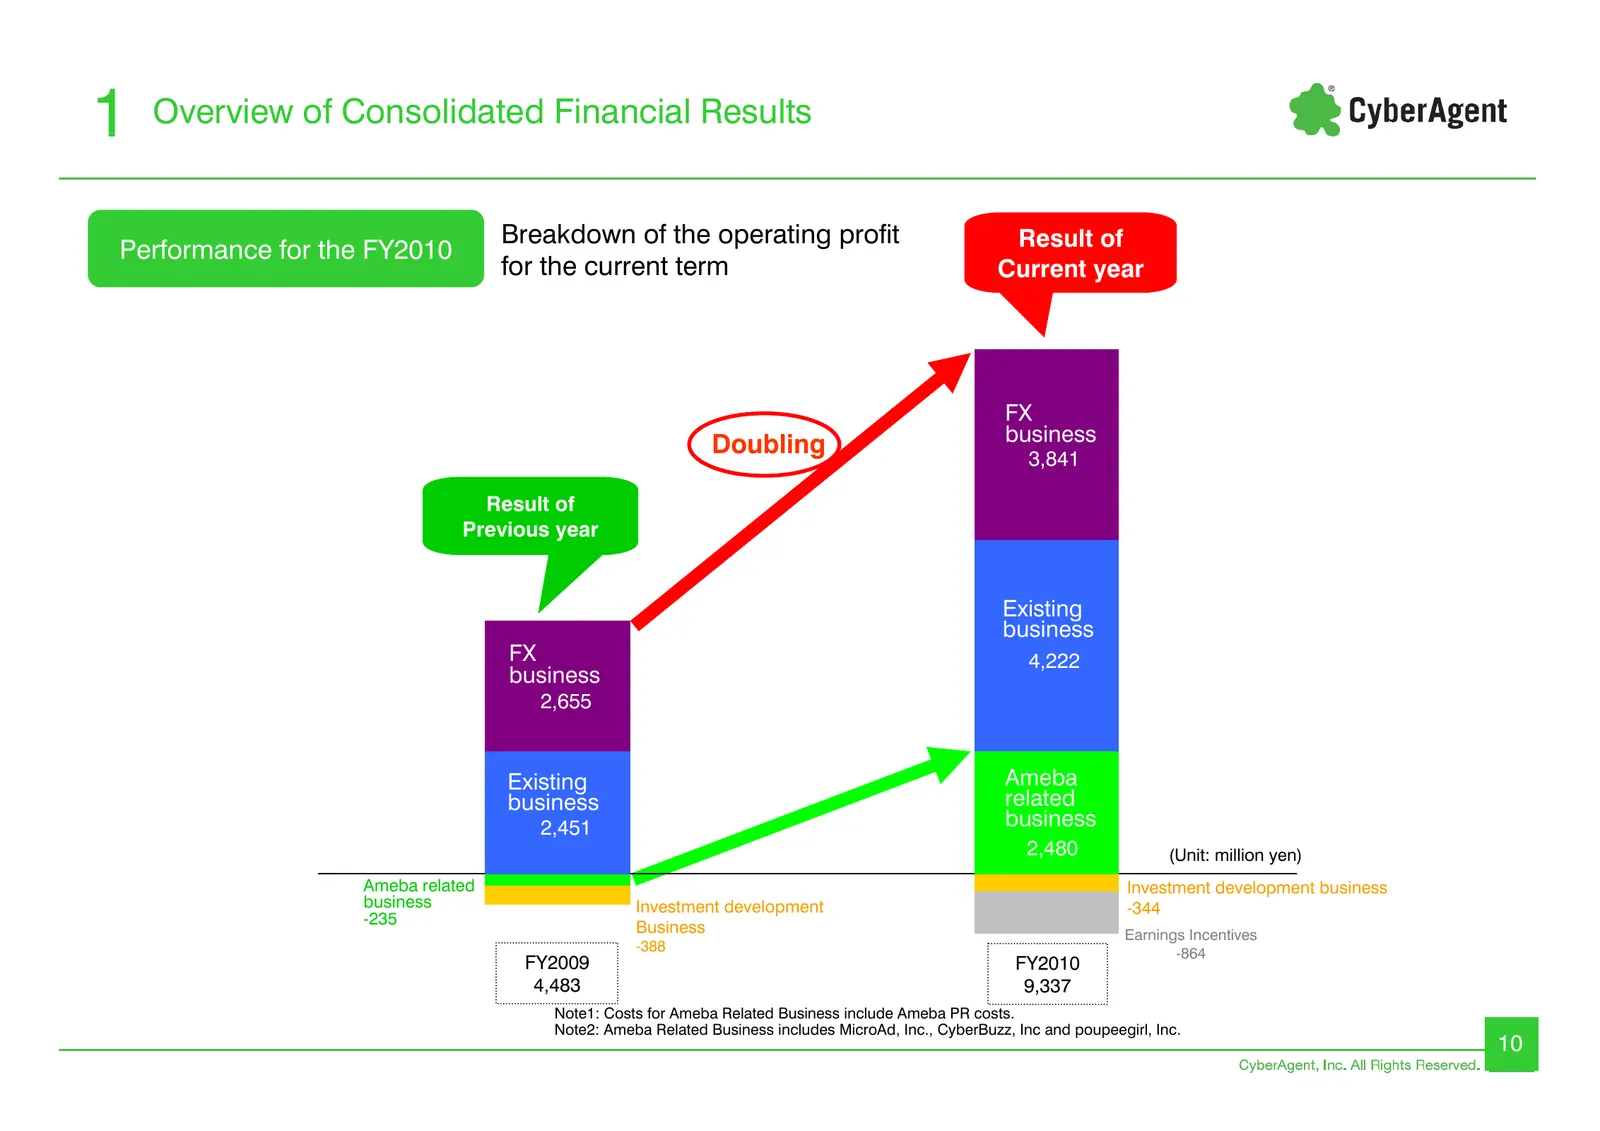
1 Overview of Consolidated Financial Results 20099 Breakdown of the operating profit Result of Performance for the FY2010 for the current term Current year FX Doubling business 3,841 Result of Previous year Existing business FX 4,222 business 2,655 Existing Ameba business related 2,451 business 2,48
Slide 11: Balance Sheet
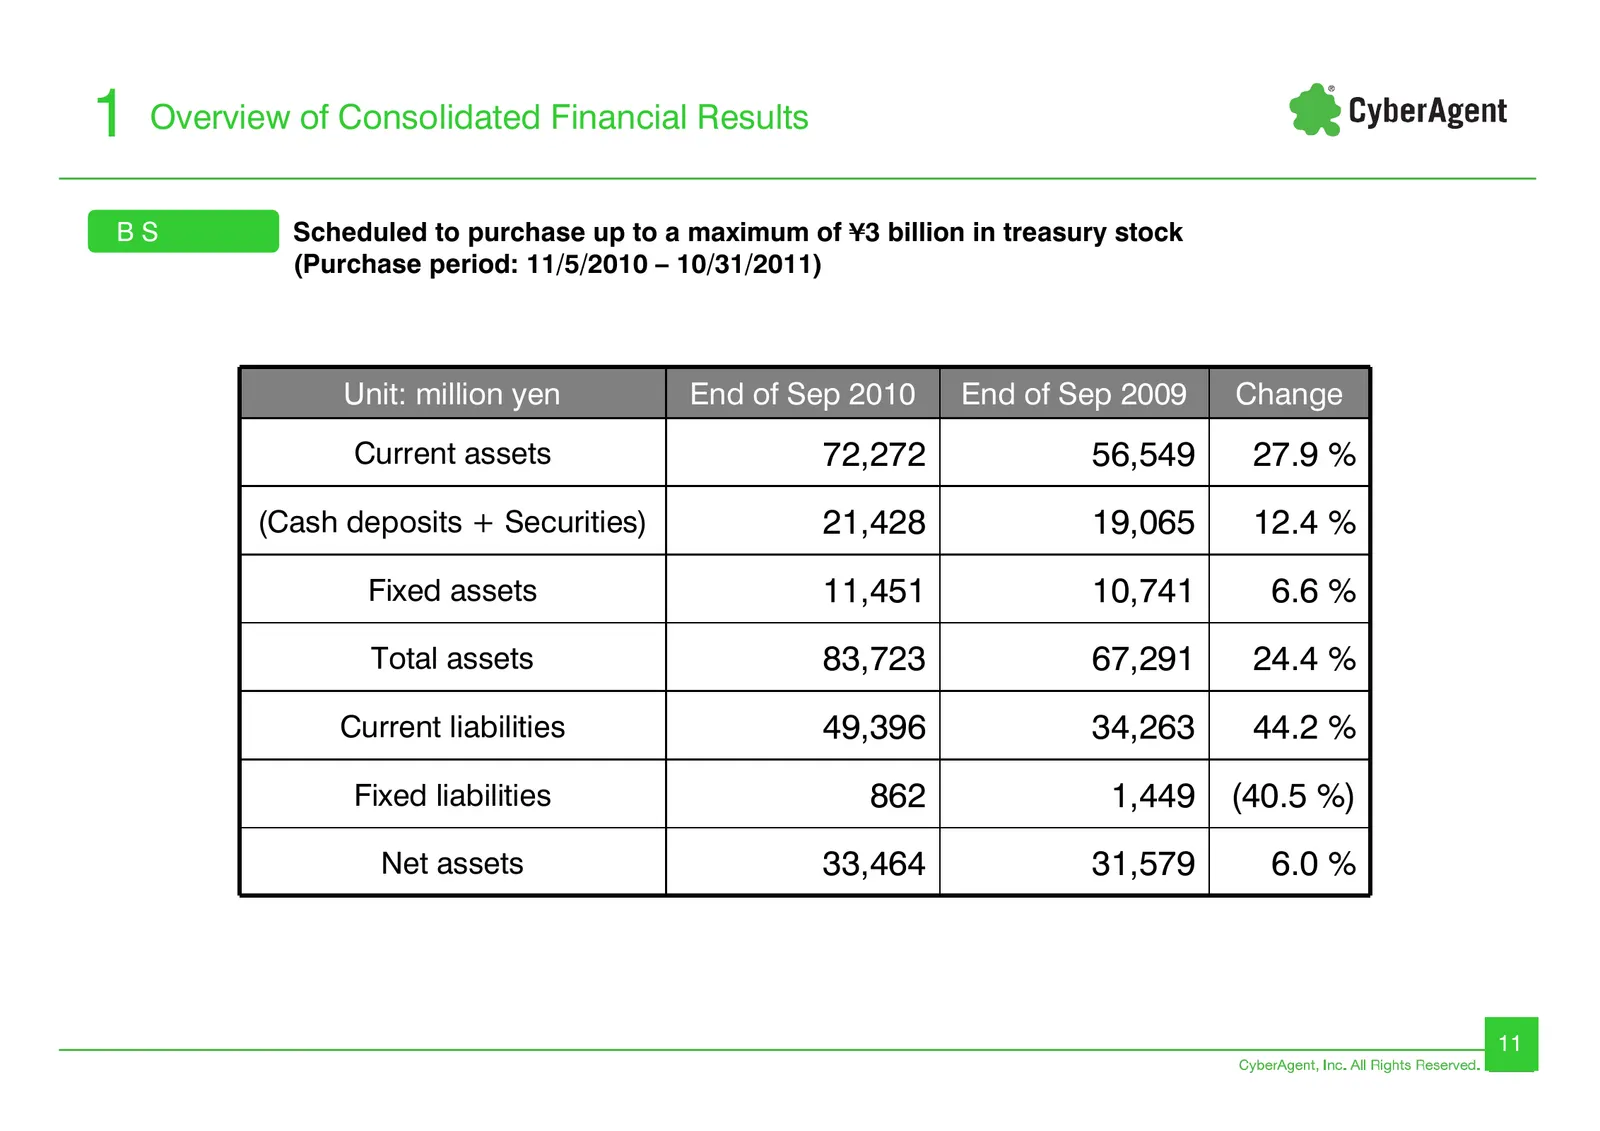
1 Overview of Consolidated Financial Results BS Scheduled to purchase up to a maximum of ¥3 billion in treasury stock (Purchase period: 11/5/2010 – 10/31/2011) Unit: million yen End of Sep 2010 End of Sep 2009 Change Current assets 72,272 56,549 27.9 % (Cash deposits + Securities) 21,428 19,065 12.4
Slide 12: Consolidated Business Forecast for the Year Ending September 2011
2 Consolidated Business Forecast Consolidated Business Forecast for the Year Ending September 2011 12
Slide 13: Consolidated Business Forecast for FY2011
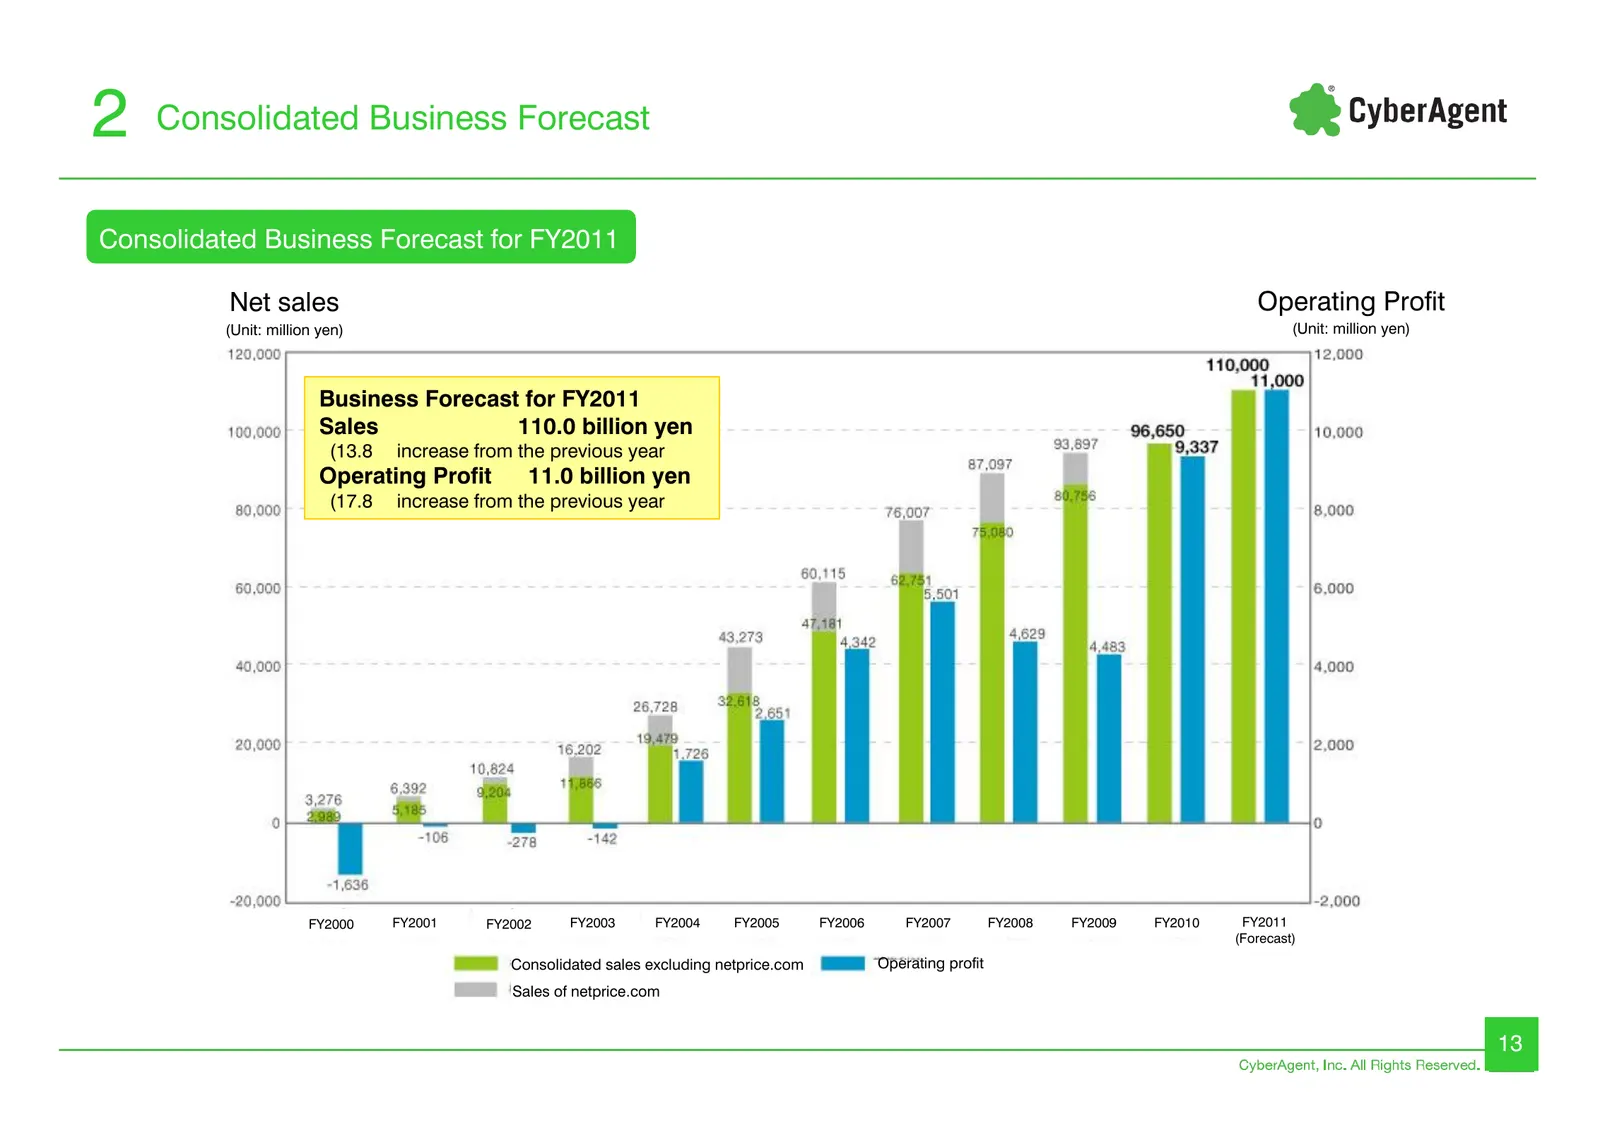
2 Consolidated Business Forecast Consolidated Business Forecast for FY2011 Net sales Operating Profit (Unit: million yen) (Unit: million yen) Business Forecast for FY2011 Sales 110.0 billion yen (13.8 increase from the previous year Operating Profit 11.0 billion yen (17.8 increase from the previous
Slide 14: Business Forecast for FY2011
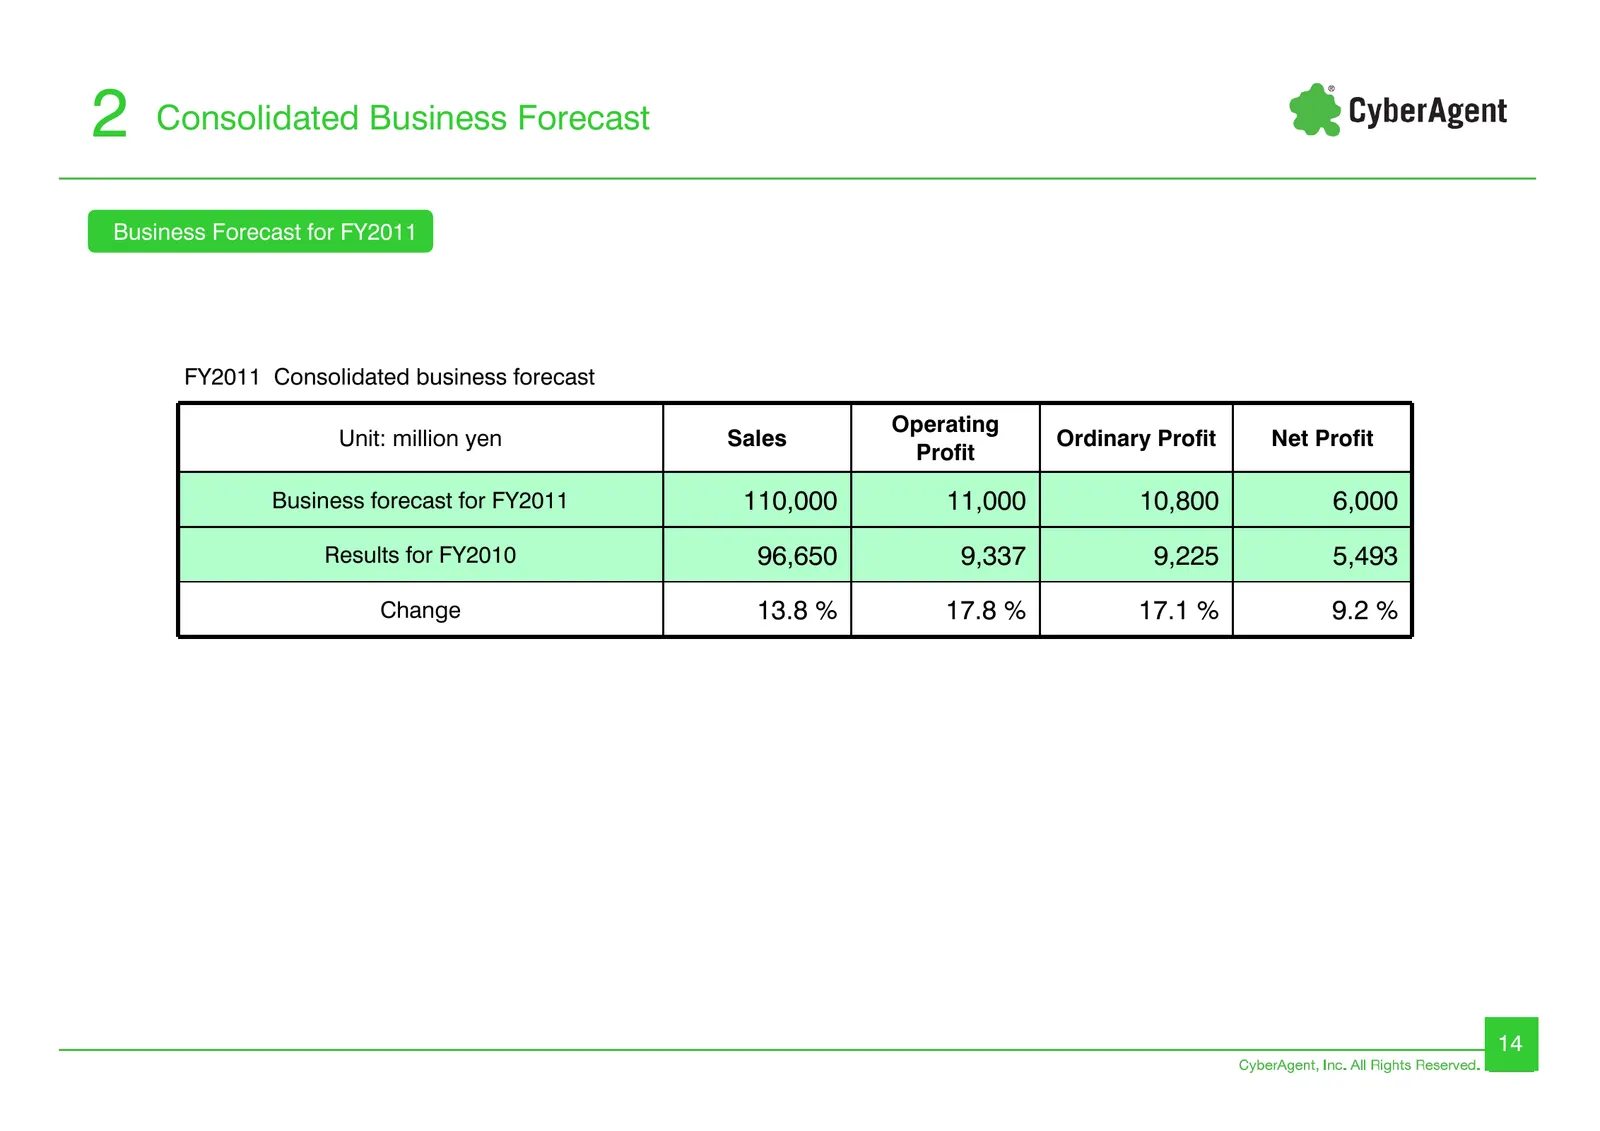
2 Consolidated Business Forecast Business Forecast for FY2011 FY2011 Consolidated business forecast Operating Unit: million yen Sales Ordinary Profit Net Profit Profit Business forecast for FY2011 110,000 11,000 10,800 6,000 Results for FY2010 96,650 9,337 9,225 5,493 Change 13.8 % 17.8 % 17.1 % 9.2
Slide 15: Dividend forecast
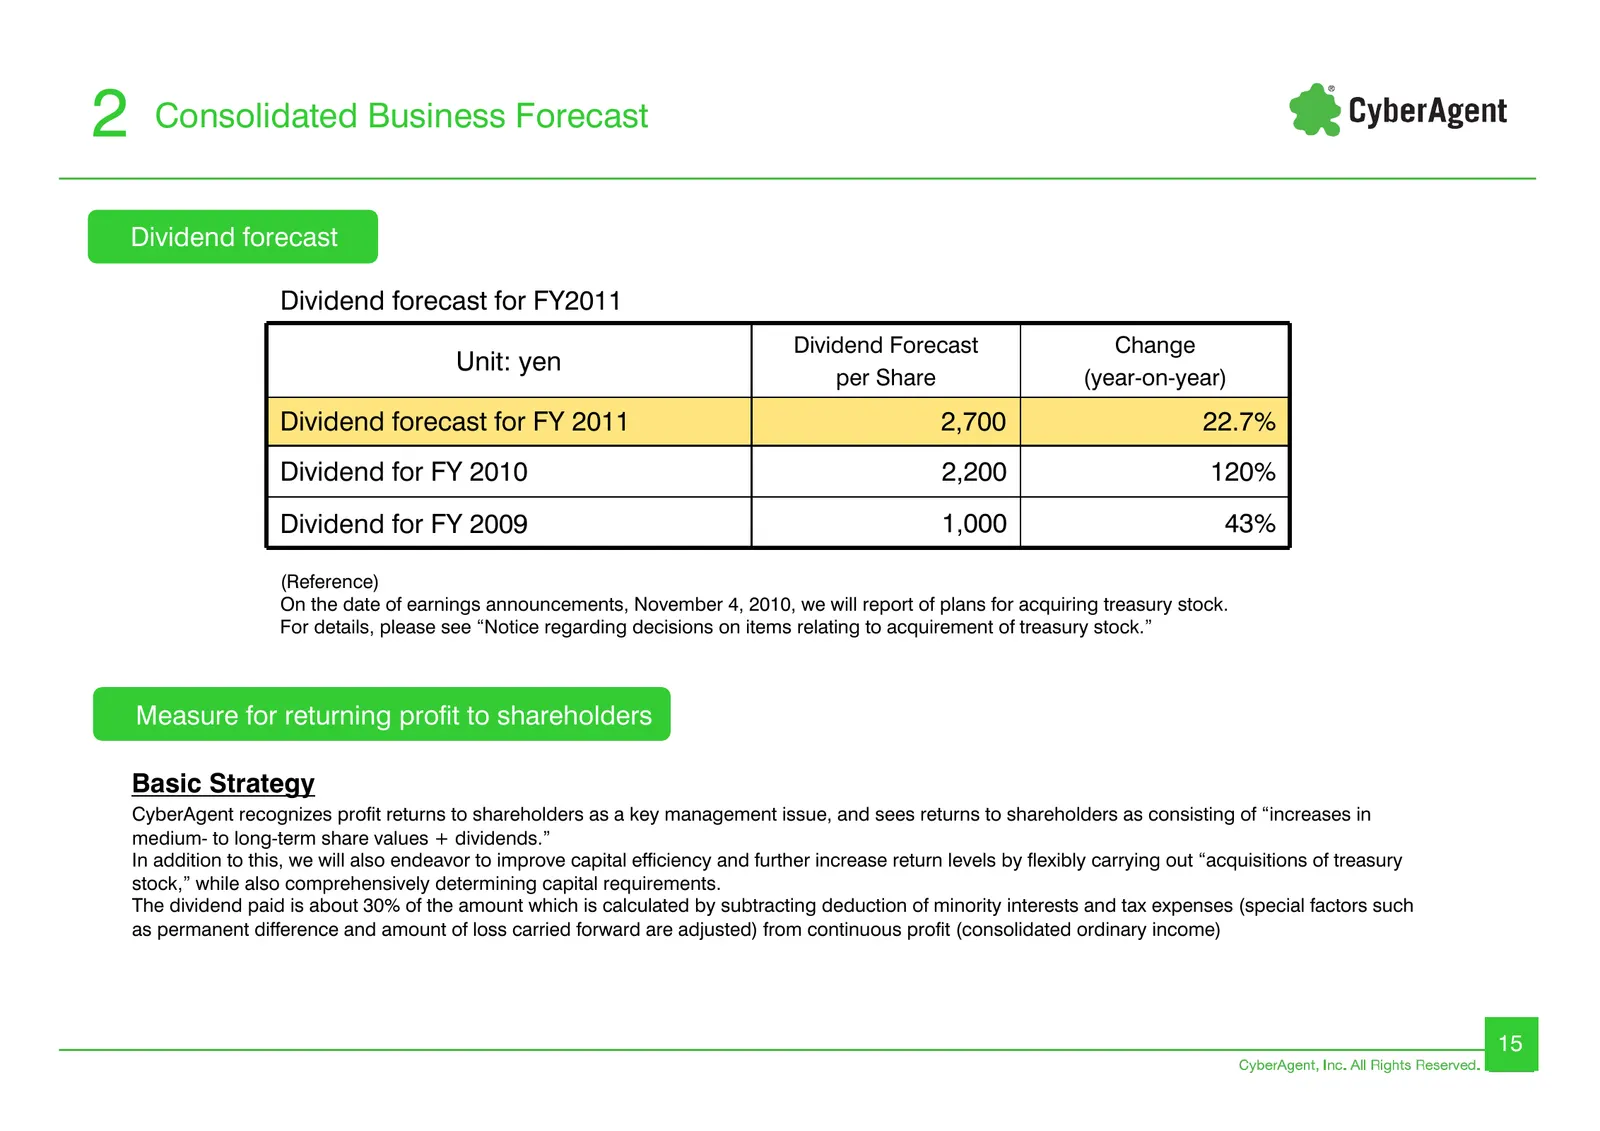
2 Consolidated Business Forecast Dividend forecast Dividend forecast for FY2011 Dividend Forecast Change Unit: yen per Share (year-on-year) Dividend forecast for FY 2011 2,700 22.7% Dividend for FY 2010 2,200 120% Dividend for FY 2009 1,000 43% (Reference) On the date of earnings announcements, Nove
Slide 16: Business forecast for FY2011 trend in operating profit
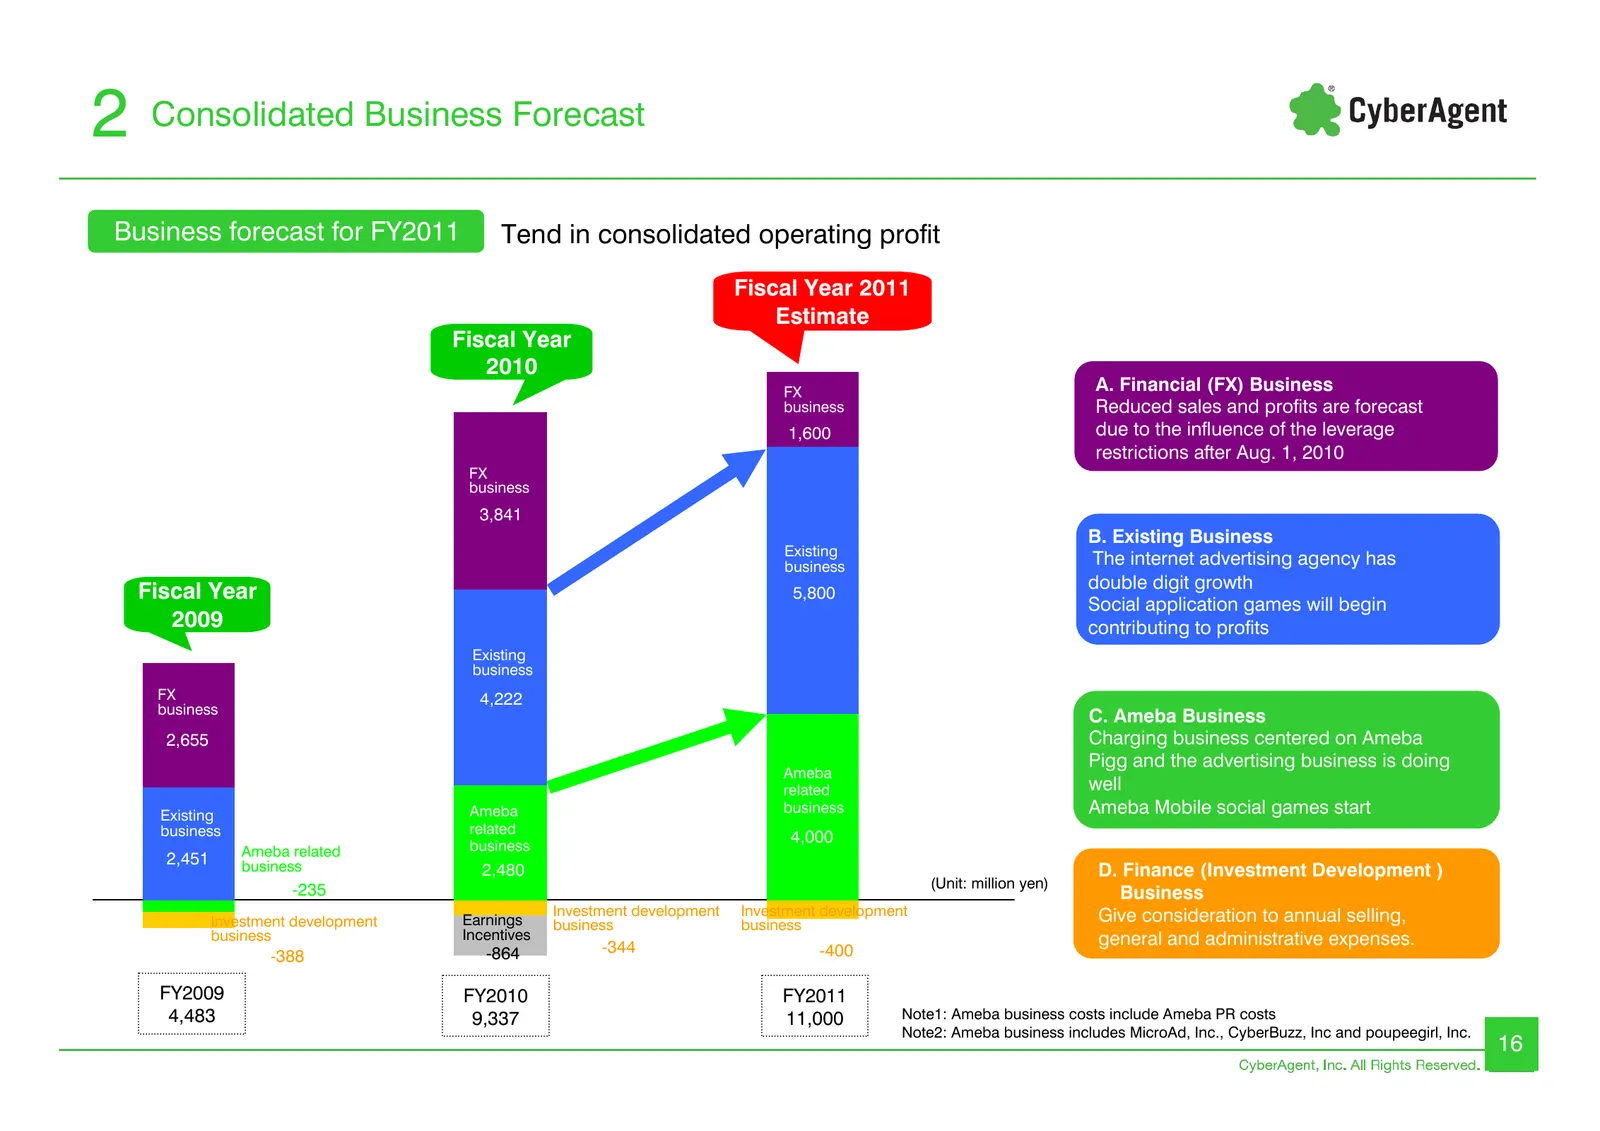
2 Consolidated Business Forecast Business 20099 forecast for FY2011 Tend in consolidated operating profit Fiscal Year 2011 Estimate Fiscal Year 2010 FX A. Financial (FX) Business business Reduced sales and profits are forecast 1,600 due to the influence of the leverage restrictions after Aug. 1, 201
Slide 17: Major Business
3 Major Business Major Business 17
Slide 18: Major Business (Internet Advertising Agency Business)
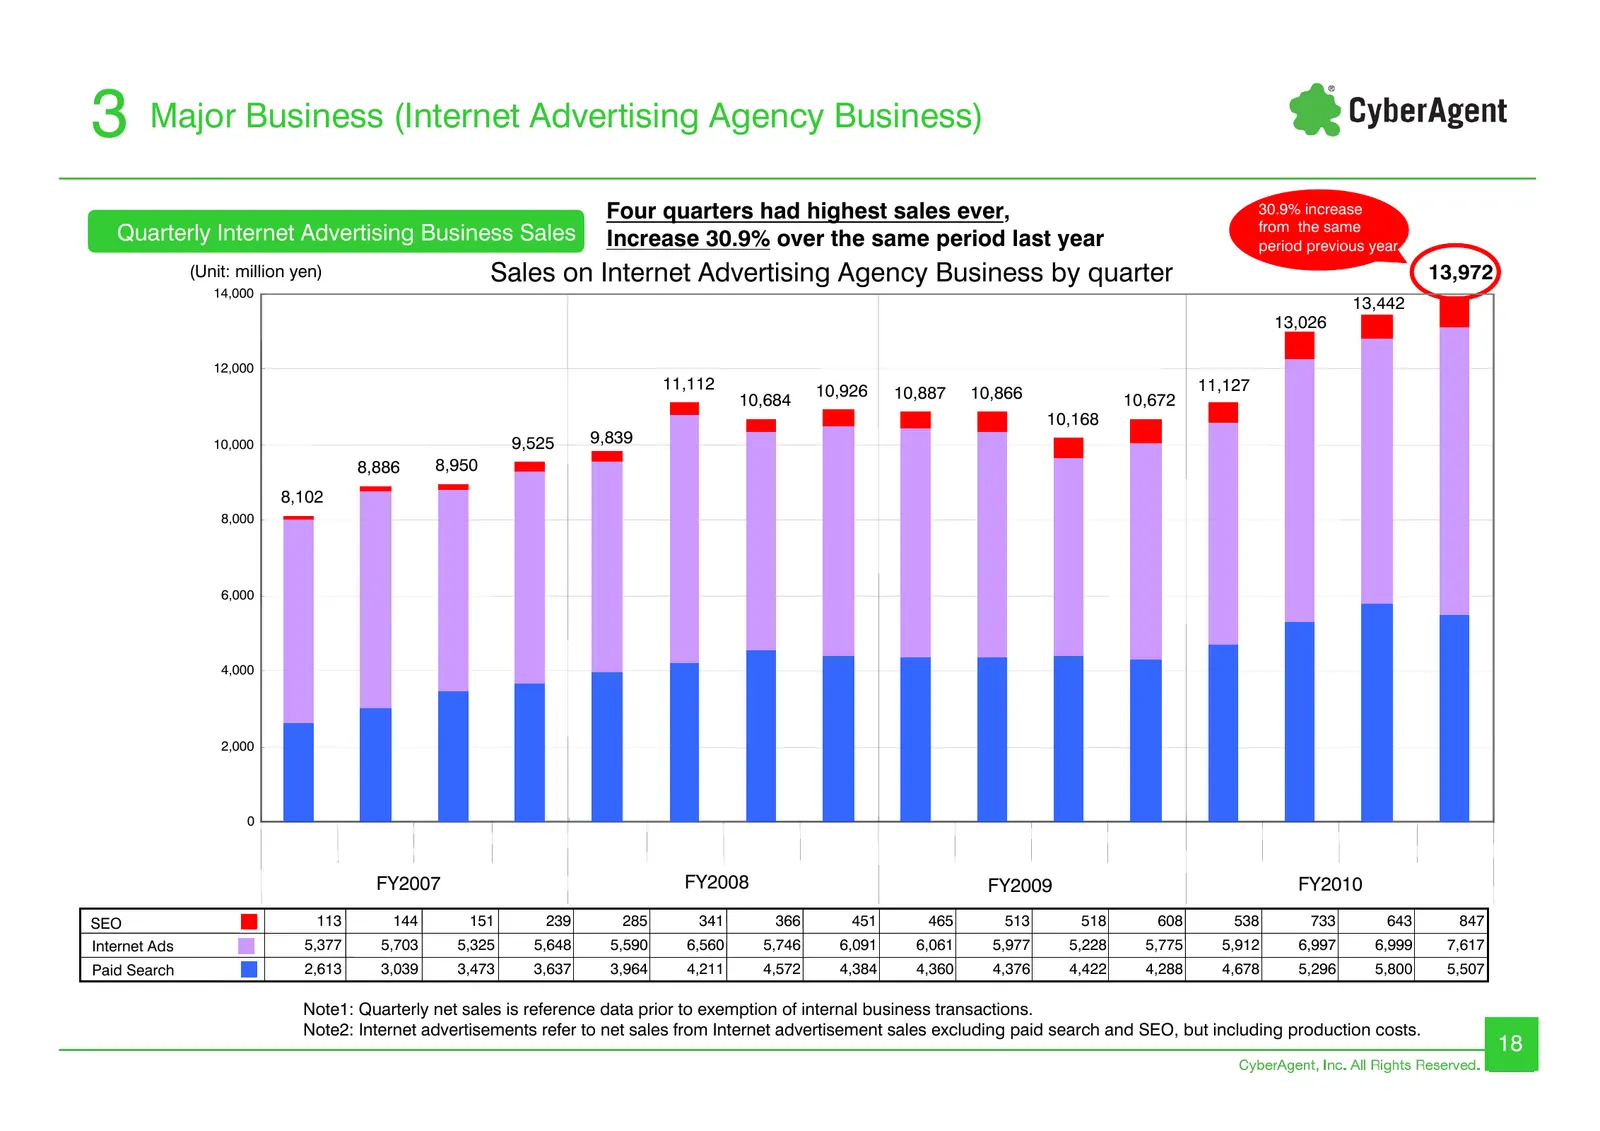
3 Major Business (Internet Advertising Agency Business) Four quarters had highest sales ever, 30.9% increase from the same Quarterly Internet Advertising Business Sales Increase 30.9% over the same period last year period previous year (Unit: million yen) Sales on Internet Advertising Agency Busines
Slide 19: Major Business (Foreign Exchange Business)
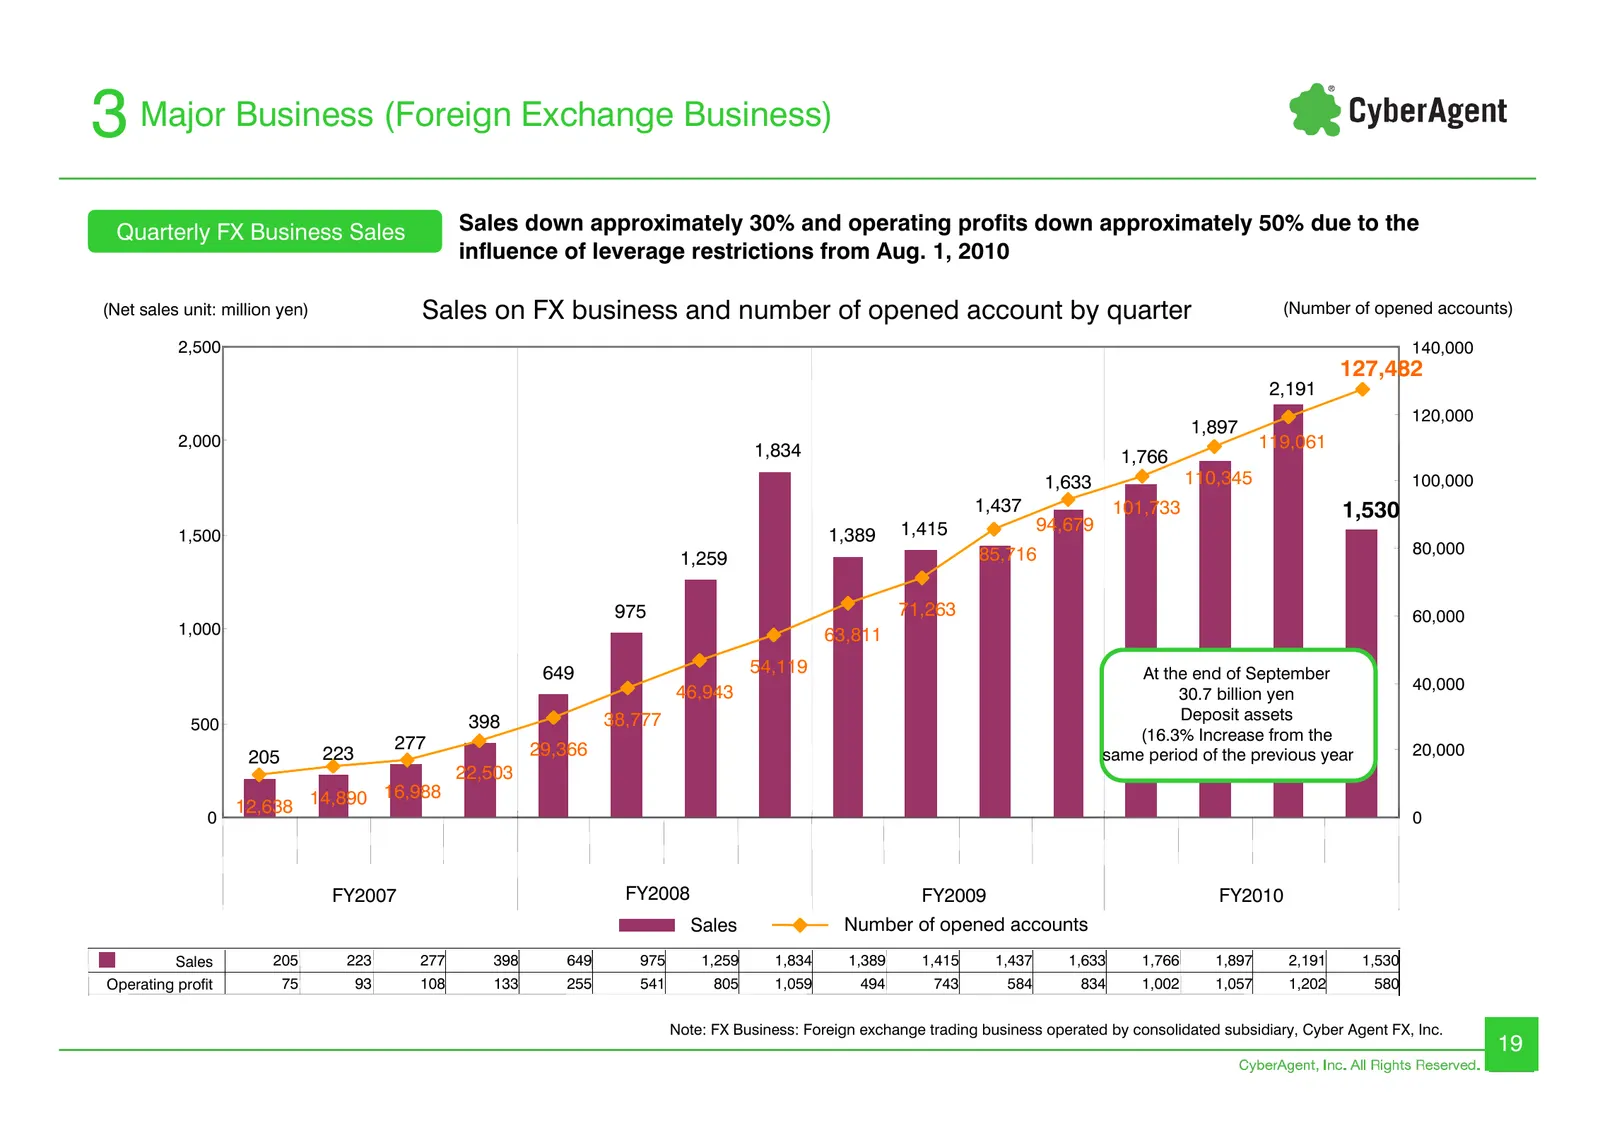
3 Major Business (Foreign Exchange Business) Quarterly FX Business Sales Sales down approximately 30% and operating profits down approximately 50% due to the influence of leverage restrictions from Aug. 1, 2010 (Net sales unit: million yen) Sales on FX business and number of opened account by quarte
Slide 20: Major Business (Internet Media Business)
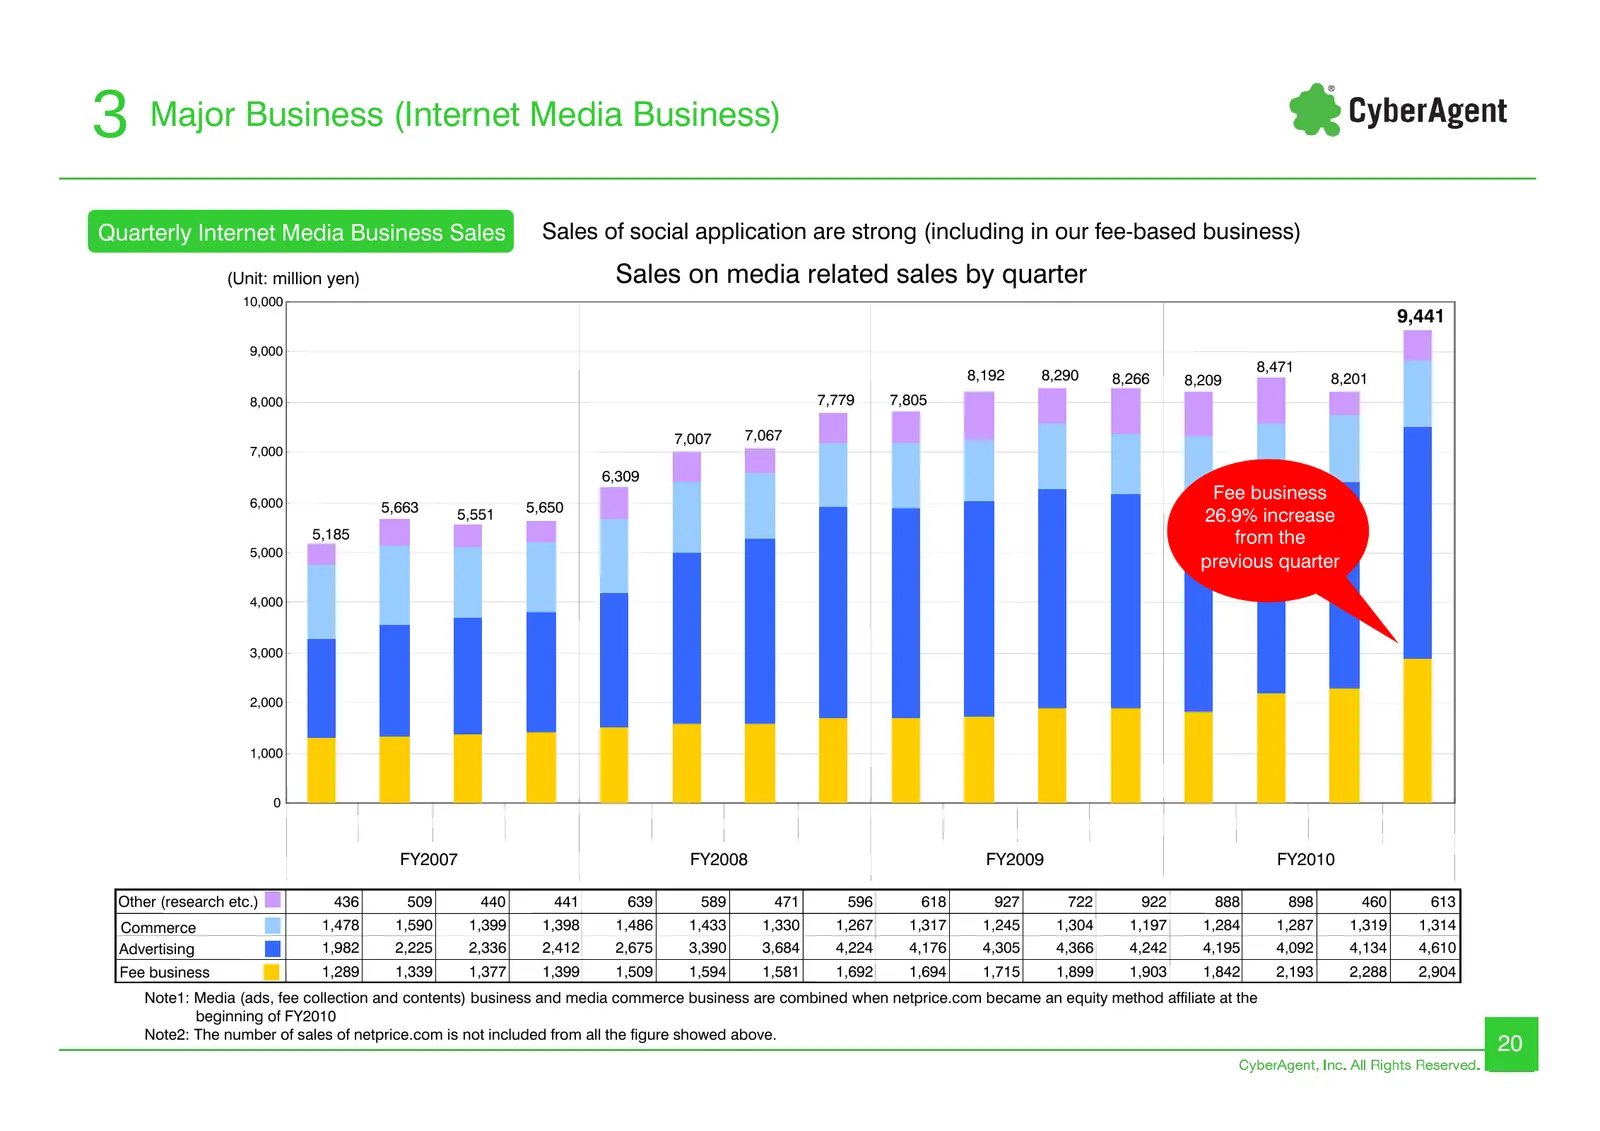
3 Major Business (Internet Media Business) Quarterly Internet Media Business Sales Sales of social application are strong (including in our fee-based business) (Unit: million yen) Sales on media related sales by quarter 10,000 9,441 9,000 8,471 8,192 8,290 8,266 8,209 8,201 8,000 7,779 7,805 7,007 7
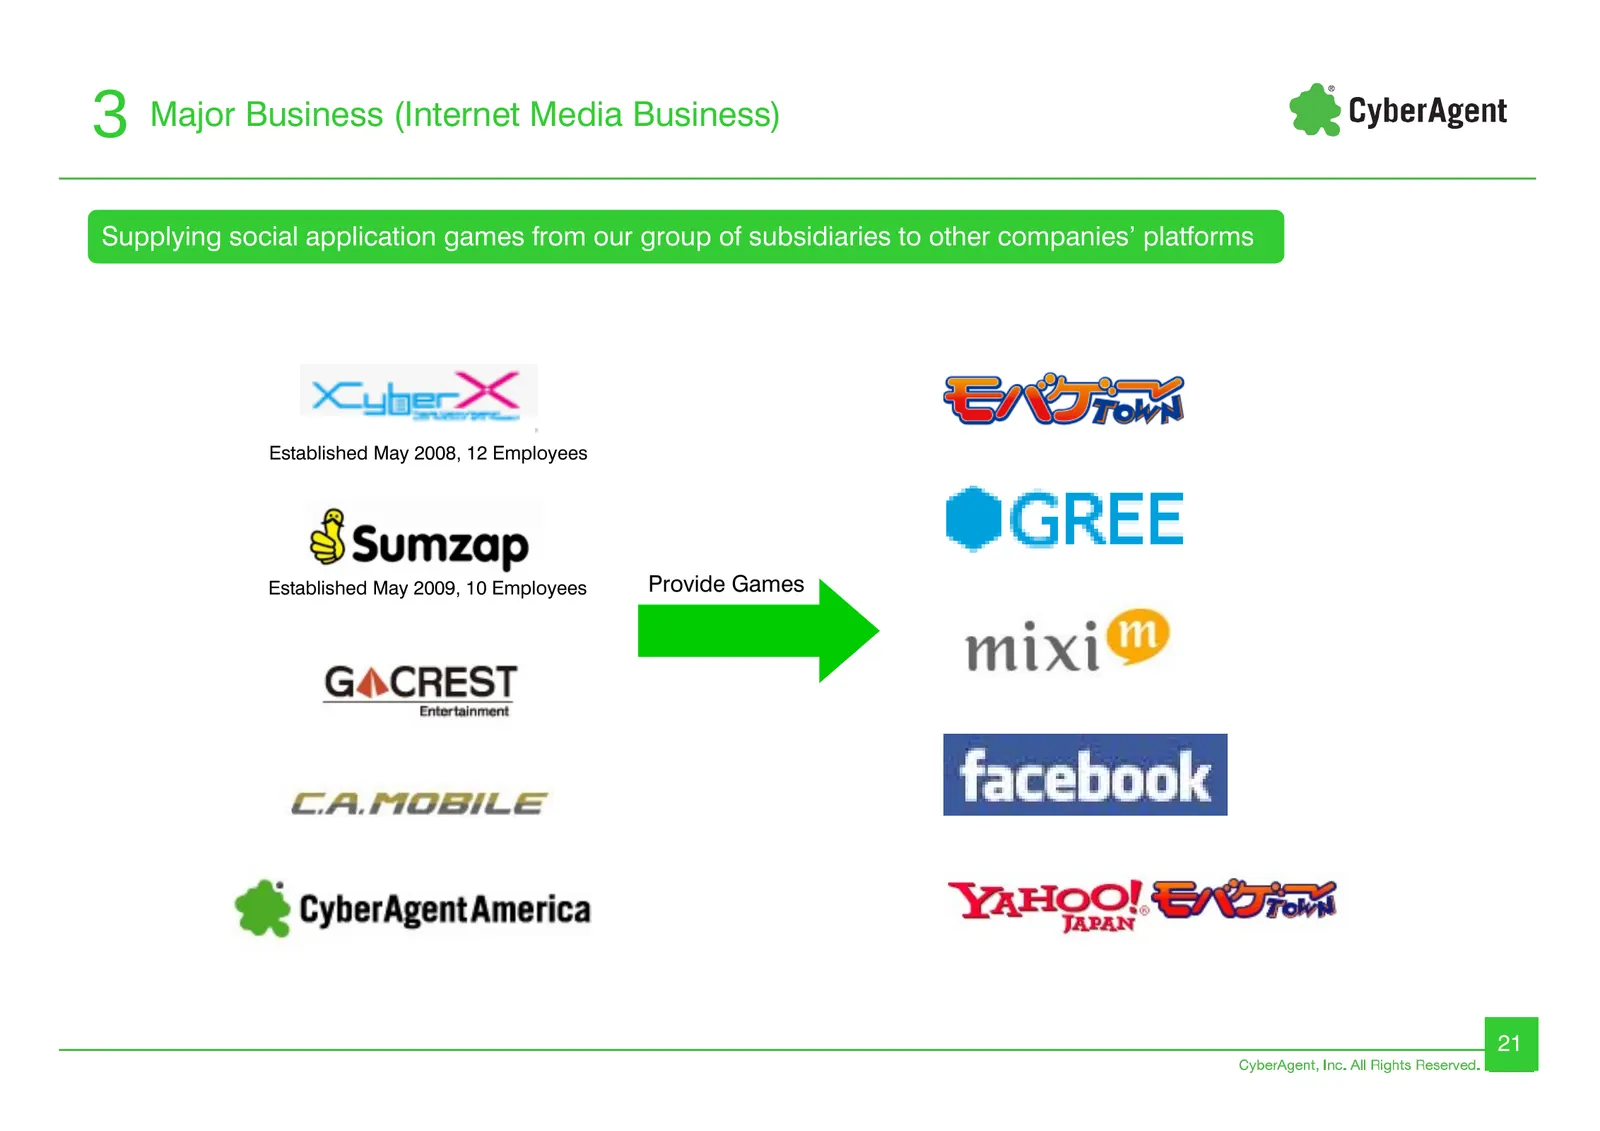
Slide 21: Supplying social application games to other platforms
3 Major Business (Internet Media Business) Supplying social application games from our group of subsidiaries to other companies’ platforms Established May 2008, 12 Employees Established May 2009, 10 Employees Provide Games 21
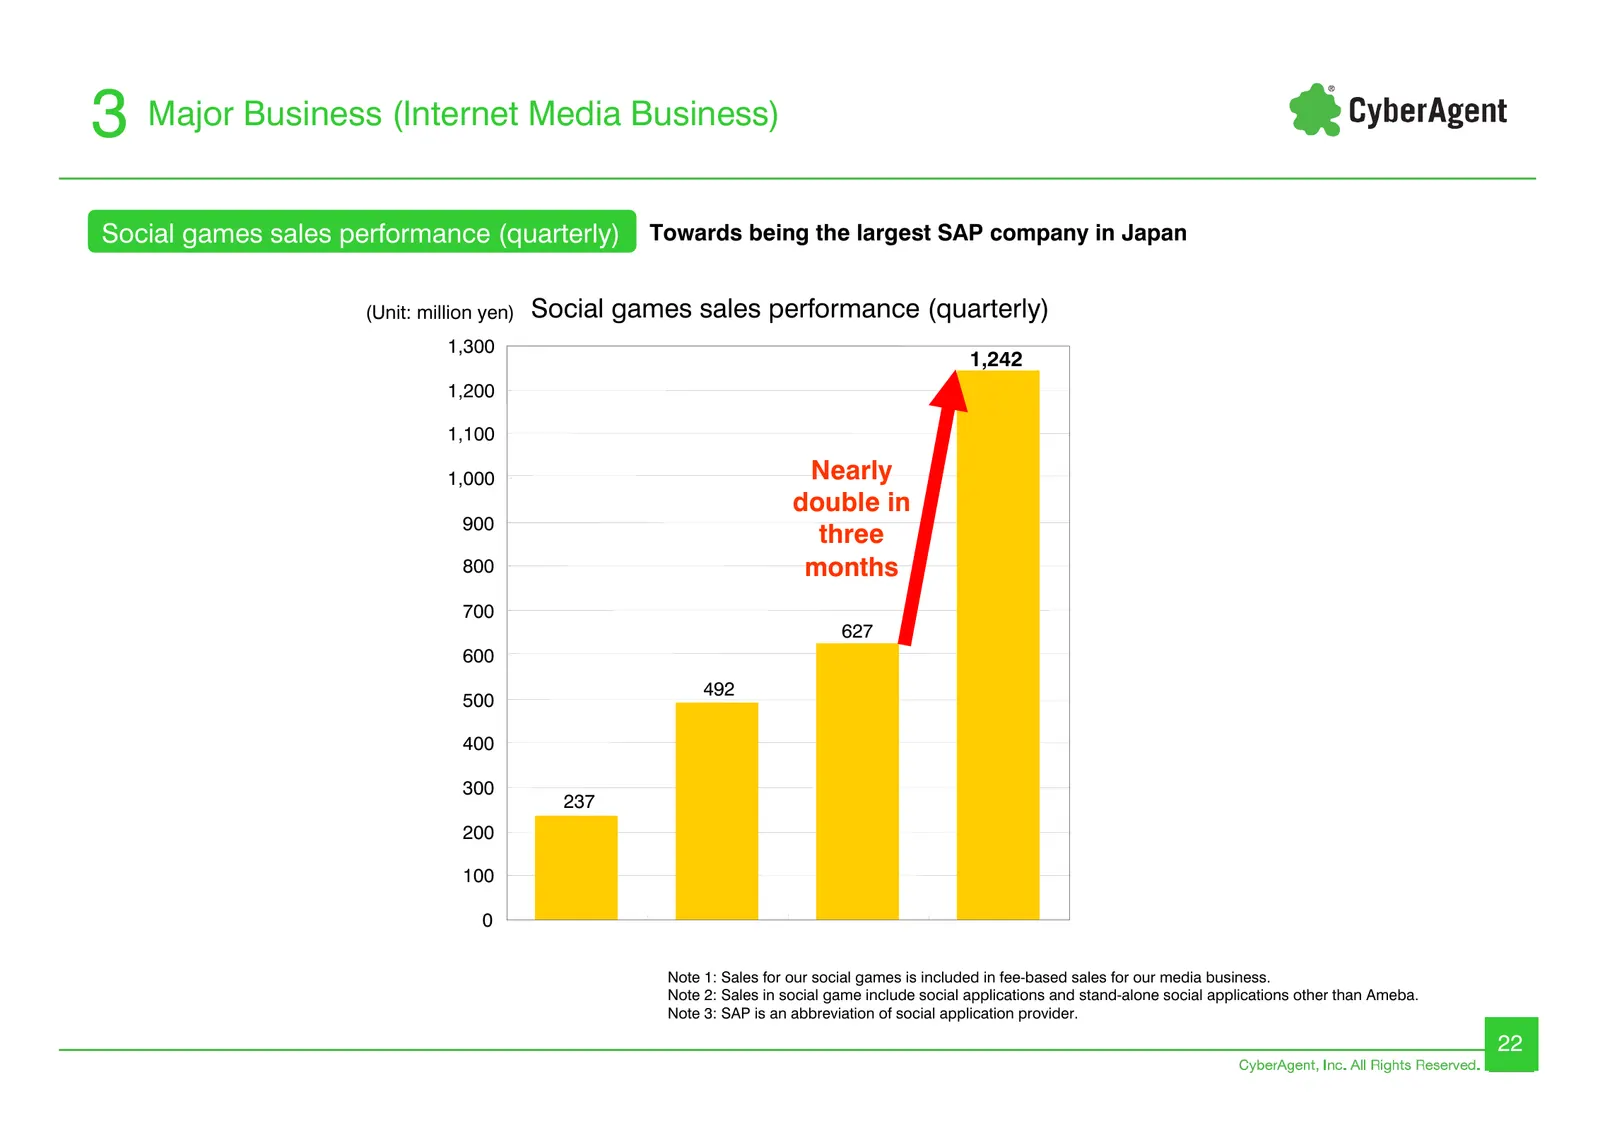
Slide 22: Social games sales performance (quarterly)
3 Major Business (Internet Media Business) Social games sales performance (quarterly) Towards being the largest SAP company in Japan (Unit: million yen) Social games sales performance (quarterly) 1,300 1,242 1,200 1,100 1,000 Nearly double in 900 three 800 months 700 627 600 492 500 400 300 237 200
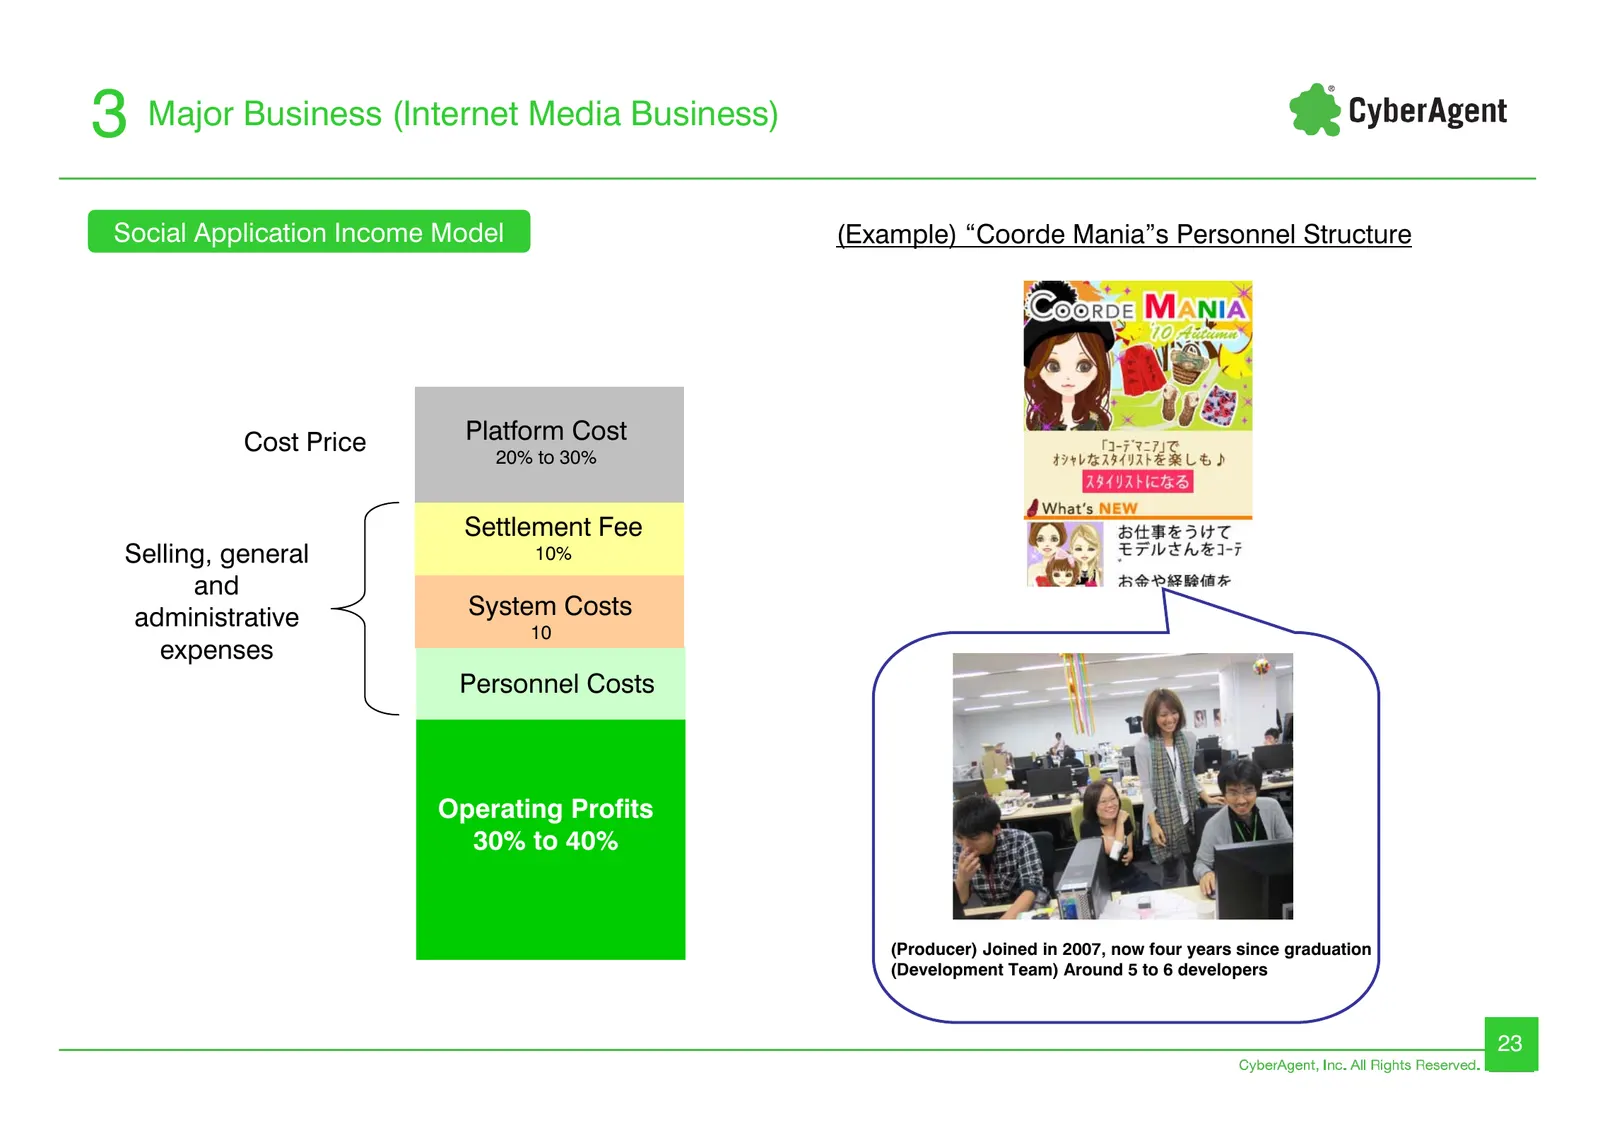
Slide 23: Social Application Income Model
3 Major Business (Internet Media Business) Social Application Income Model (Example) “Coorde Mania”s Personnel Structure Cost Price Platform Cost 20% to 30% Settlement Fee Selling, general 10% and administrative System Costs 10 expenses Personnel Costs Operating Profits 30% to 40% (Producer) Joined
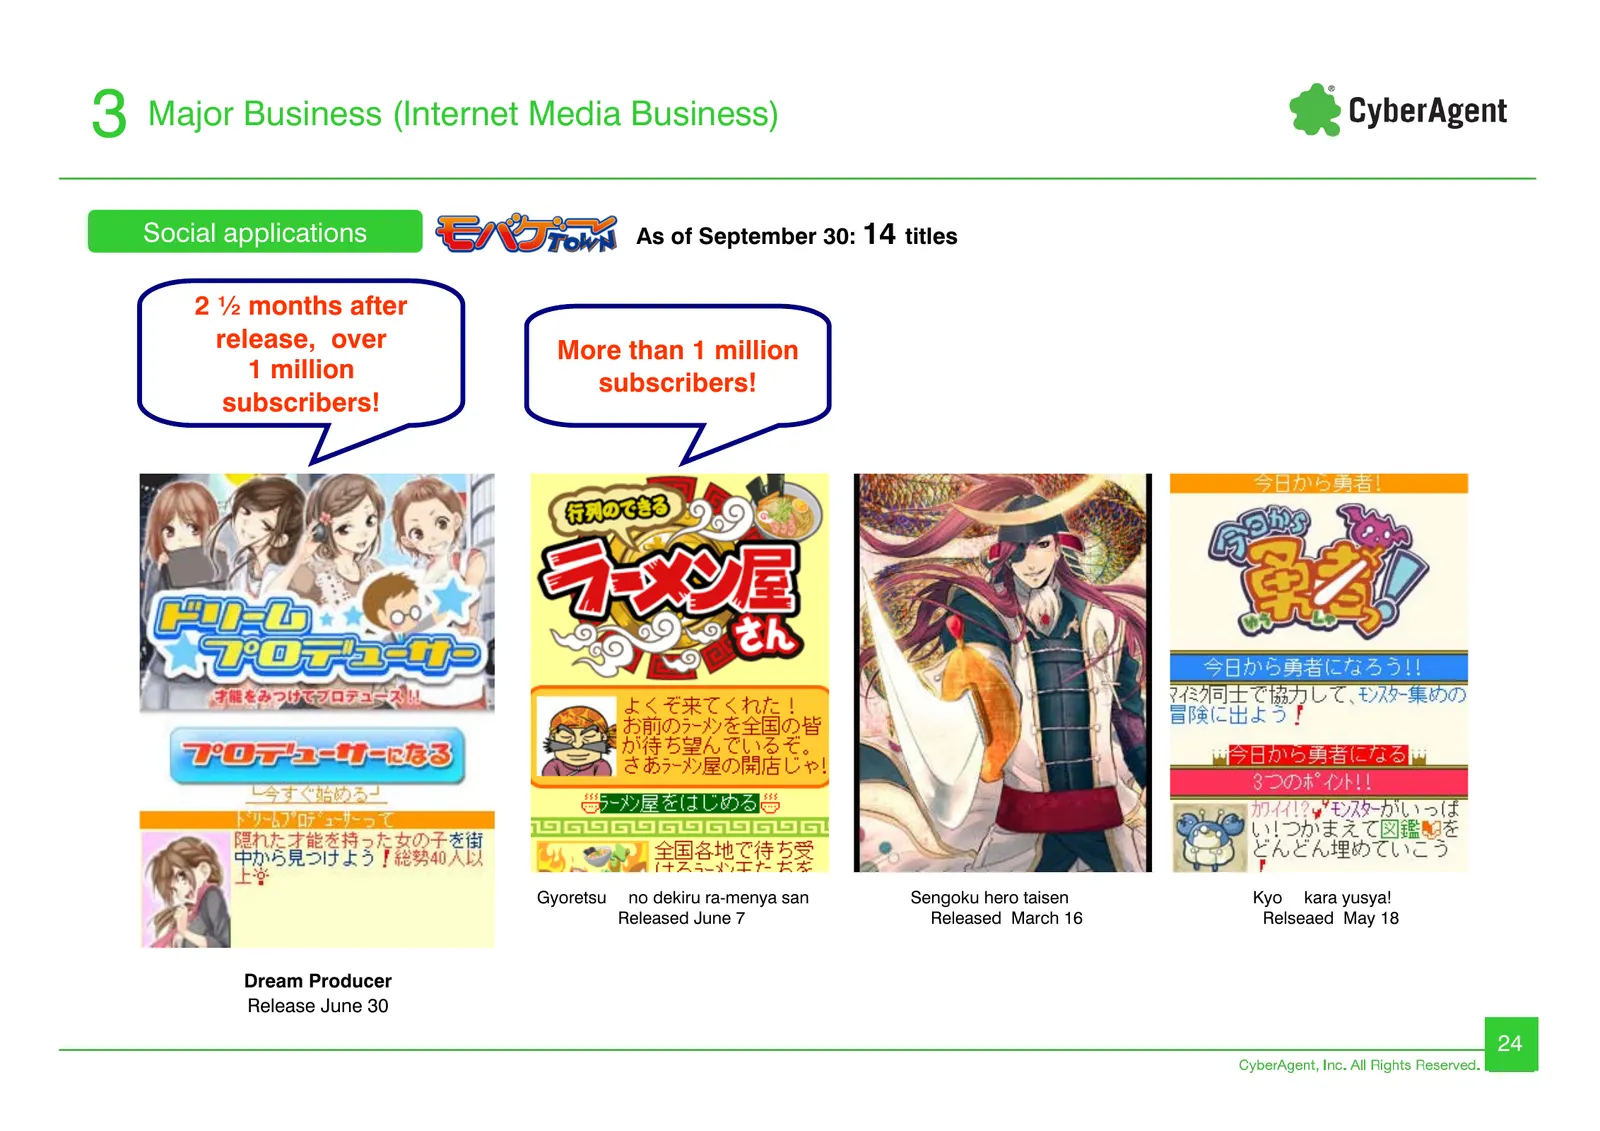
Slide 24: Social applications
3 Major Business (Internet Media Business) Social applications As of September 30: 14 titles 2 ½ months after release, over More than 1 million 1 million subscribers! subscribers! Gyoretsu no dekiru ra-menya san Sengoku hero taisen Kyo kara yusya! Released June 7 Released March 16 Relseaed May 18 Dr
Slide 25: Social applications
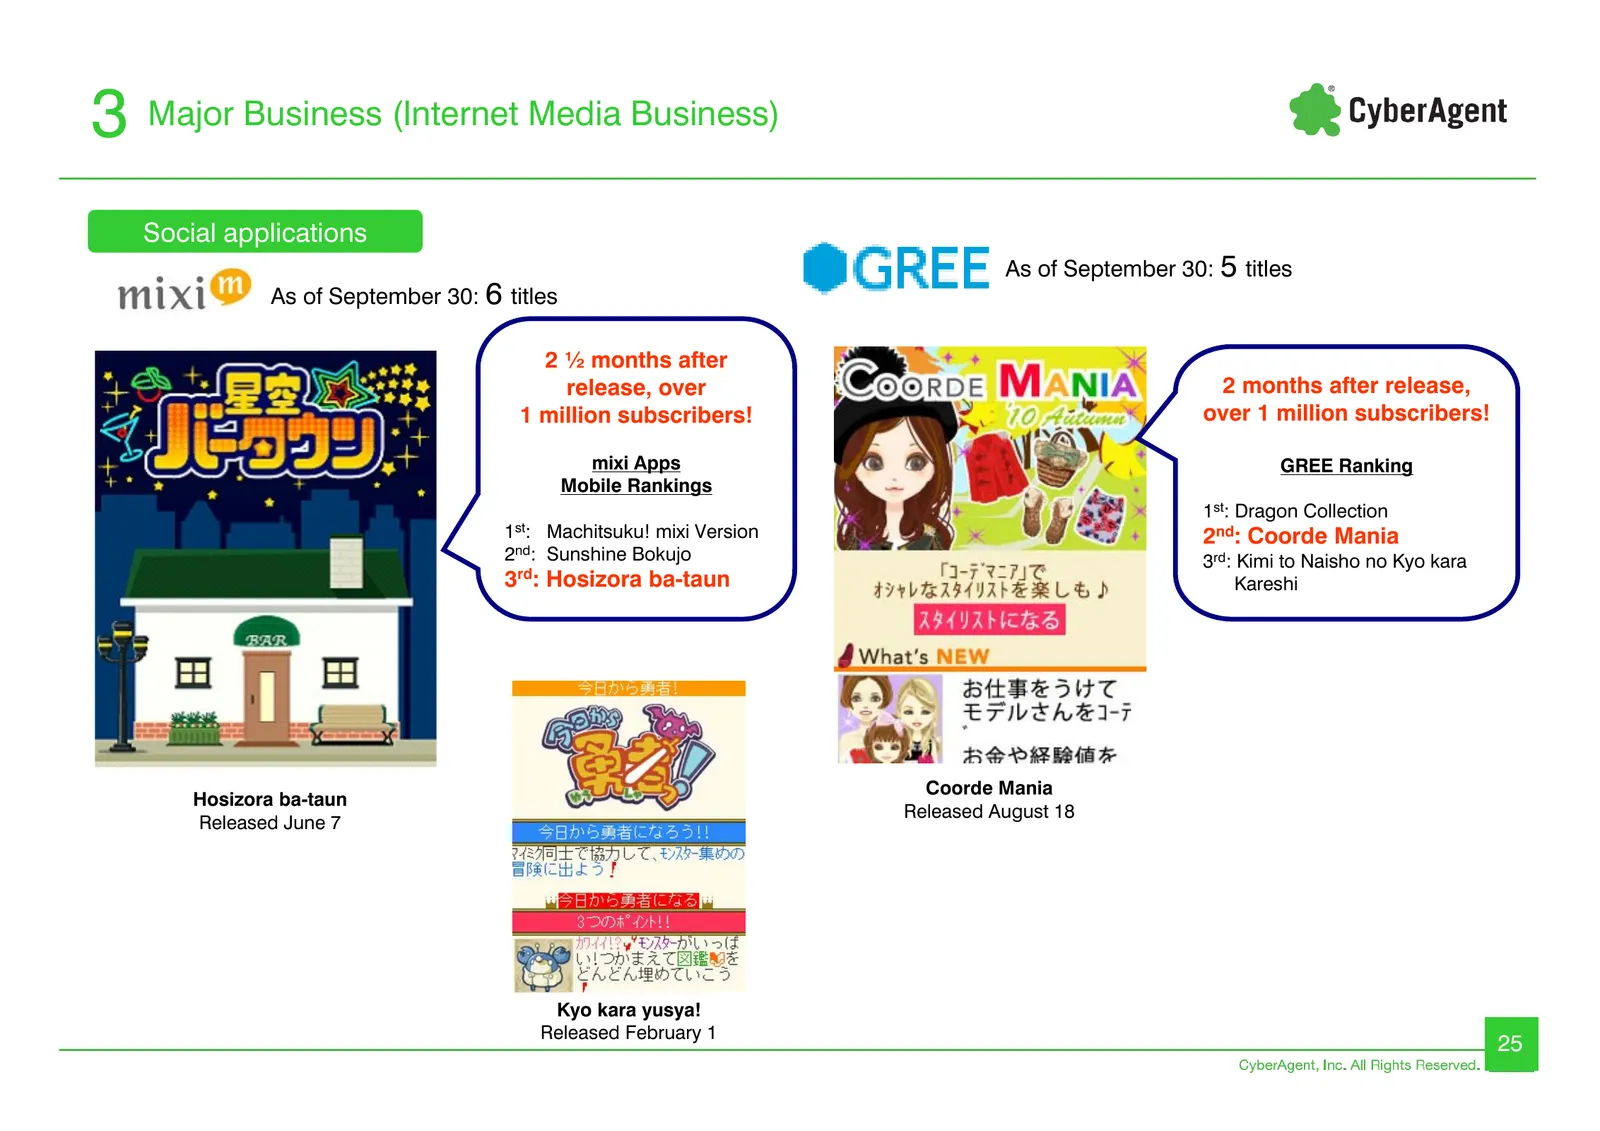
3 Major Business (Internet Media Business) Social applications As of September 30: 5 titles As of September 30: 6 titles 2 ½ months after release, over 2 months after release, 1 million subscribers! over 1 million subscribers! mixi Apps GREE Ranking Mobile Rankings 1st: Dragon Collection 1st: Machit
Slide 26: Social Application Overview
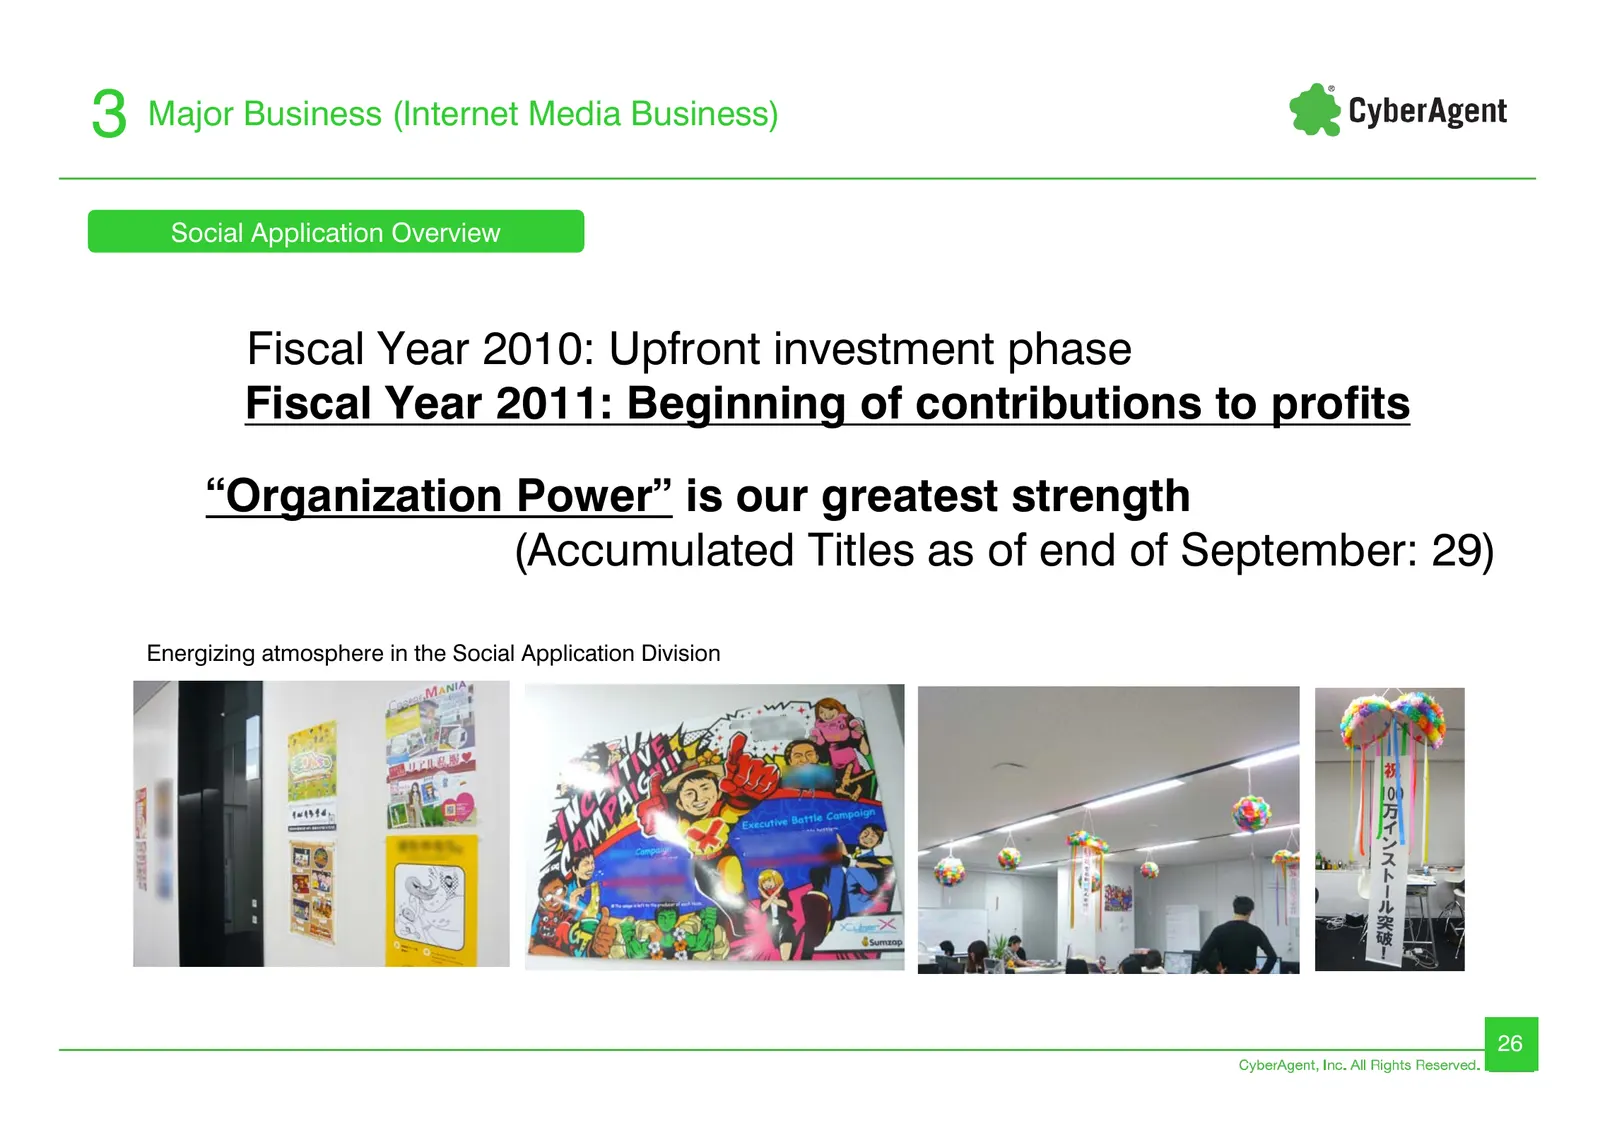
3 Major Business (Internet Media Business) Social Application Overview Fiscal Year 2010: Upfront investment phase Fiscal Year 2011: Beginning of contributions to profits “Organization Power” is our greatest strength (Accumulated Titles as of end of September: 29) Energizing atmosphere in the Social
Slide 27: Ameba Business
4 Ameba Business Ameba business 27
Slide 28: Ameba Monthly Page Views
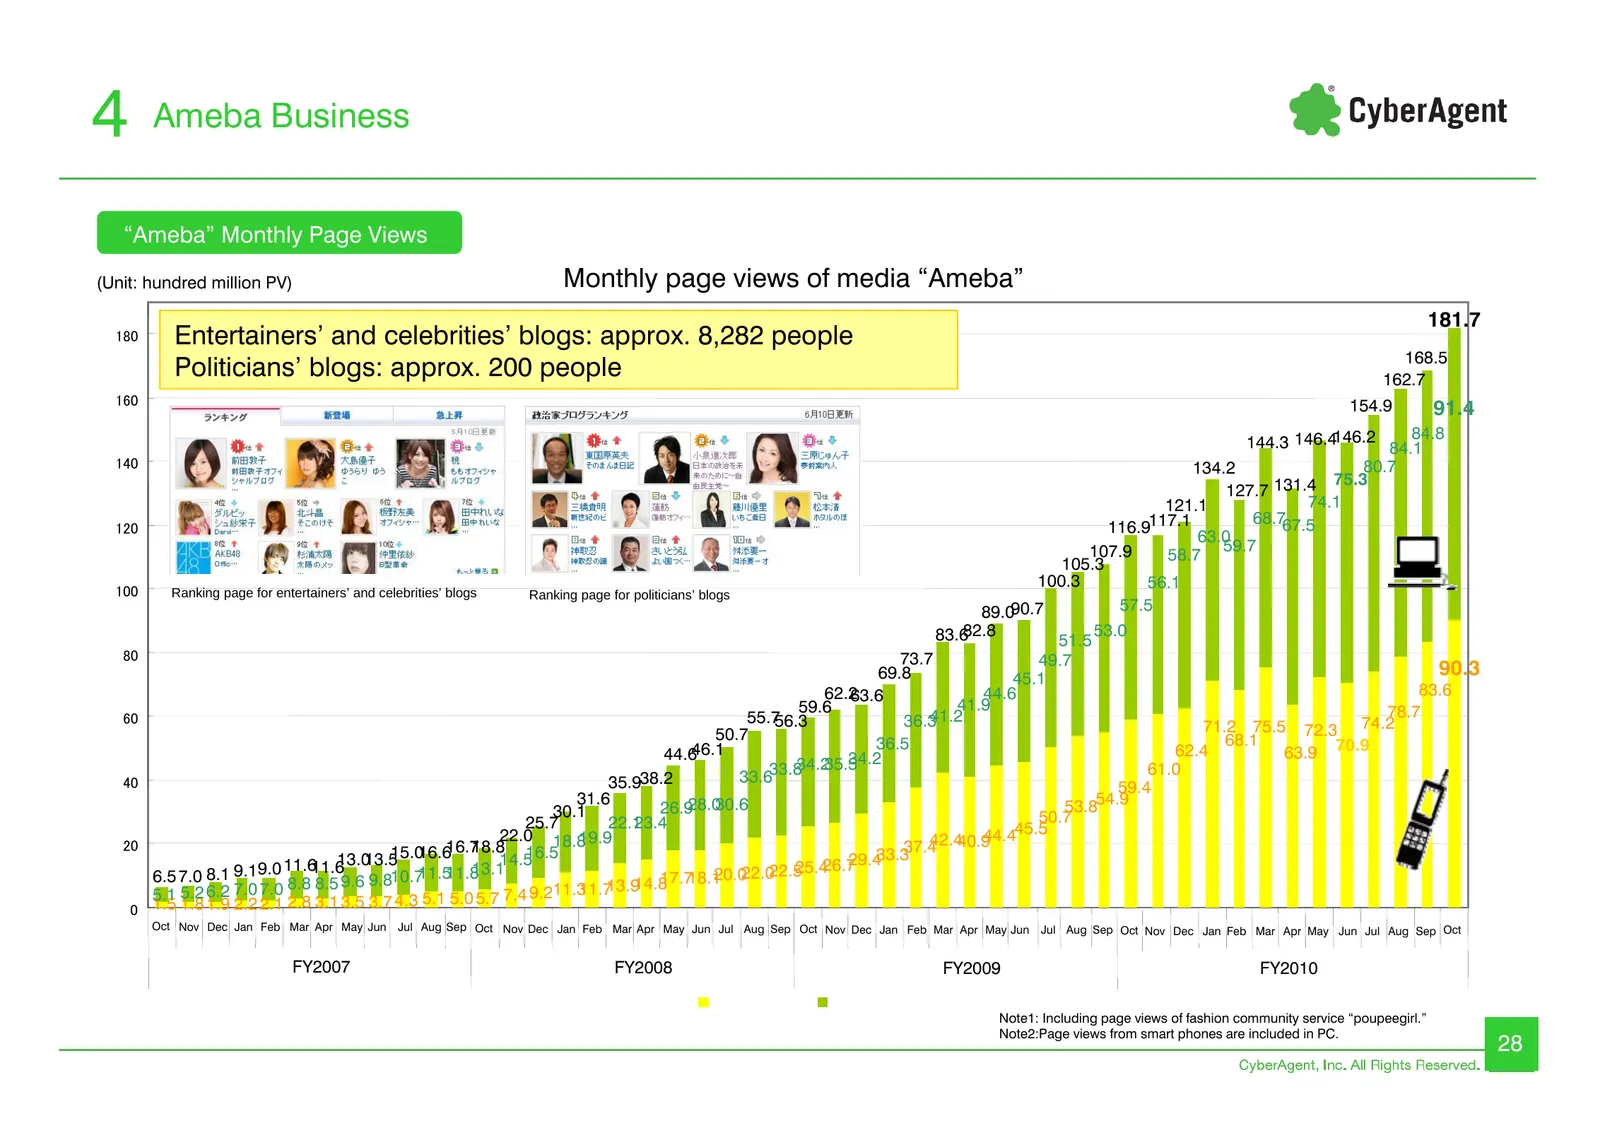
4 Ameba Business “Ameba” Monthly Page Views (Unit: hundred million PV) Monthly page views of media “Ameba” 181.7 180 Entertainers’ and celebrities’ blogs: approx. 8,282 people 168.5 Politicians’ blogs: approx. 200 people 162.7 160 154.9 91.4 84.8 144.3 146.4146.2 84.1 140 134.2 80.7 75.3 127.7 131.4
Slide 29: Monthly Number of Ameba Subscribers
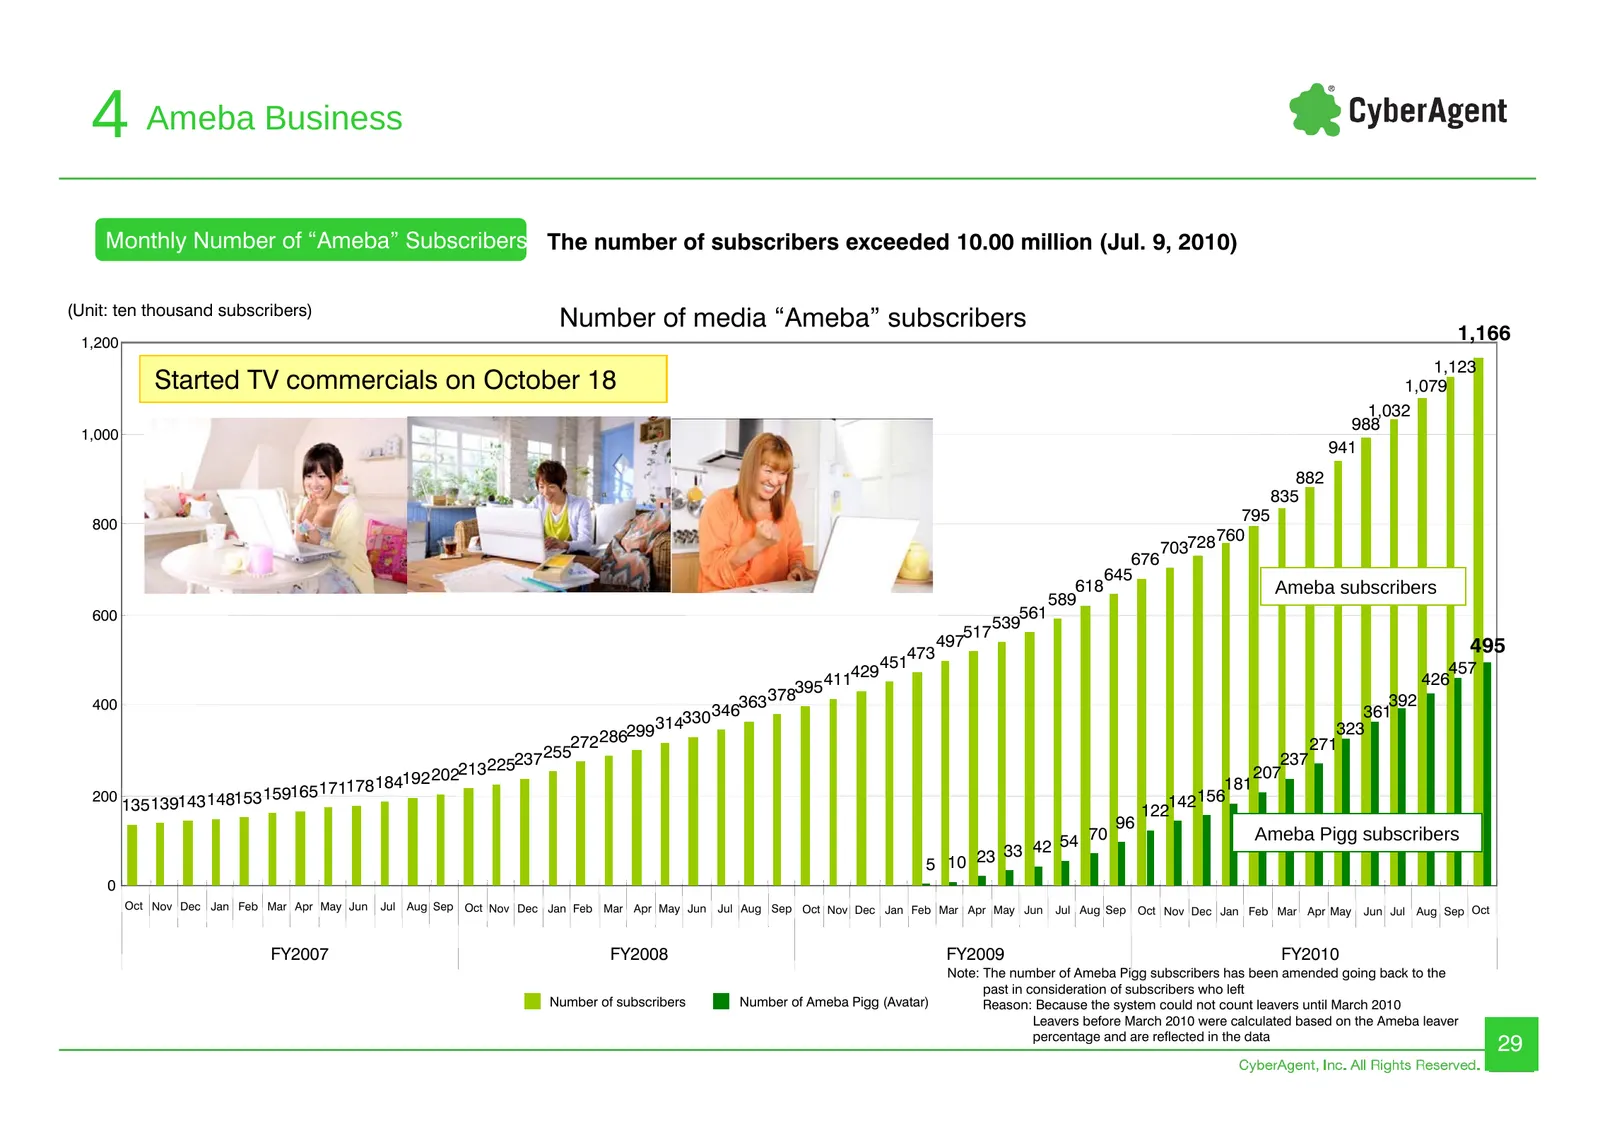
4 Ameba Business Monthly Number of “Ameba” Subscribers The number of subscribers exceeded 10.00 million (Jul. 9, 2010) (Unit: ten thousand subscribers) Number of media “Ameba” subscribers 1,200 1,166 1,123 Started TV commercials on October 18 1,079 1,032 988 1,000 941 882 835 800 795 760 703728 676
Slide 30: Quarterly Sales of Ameba Business
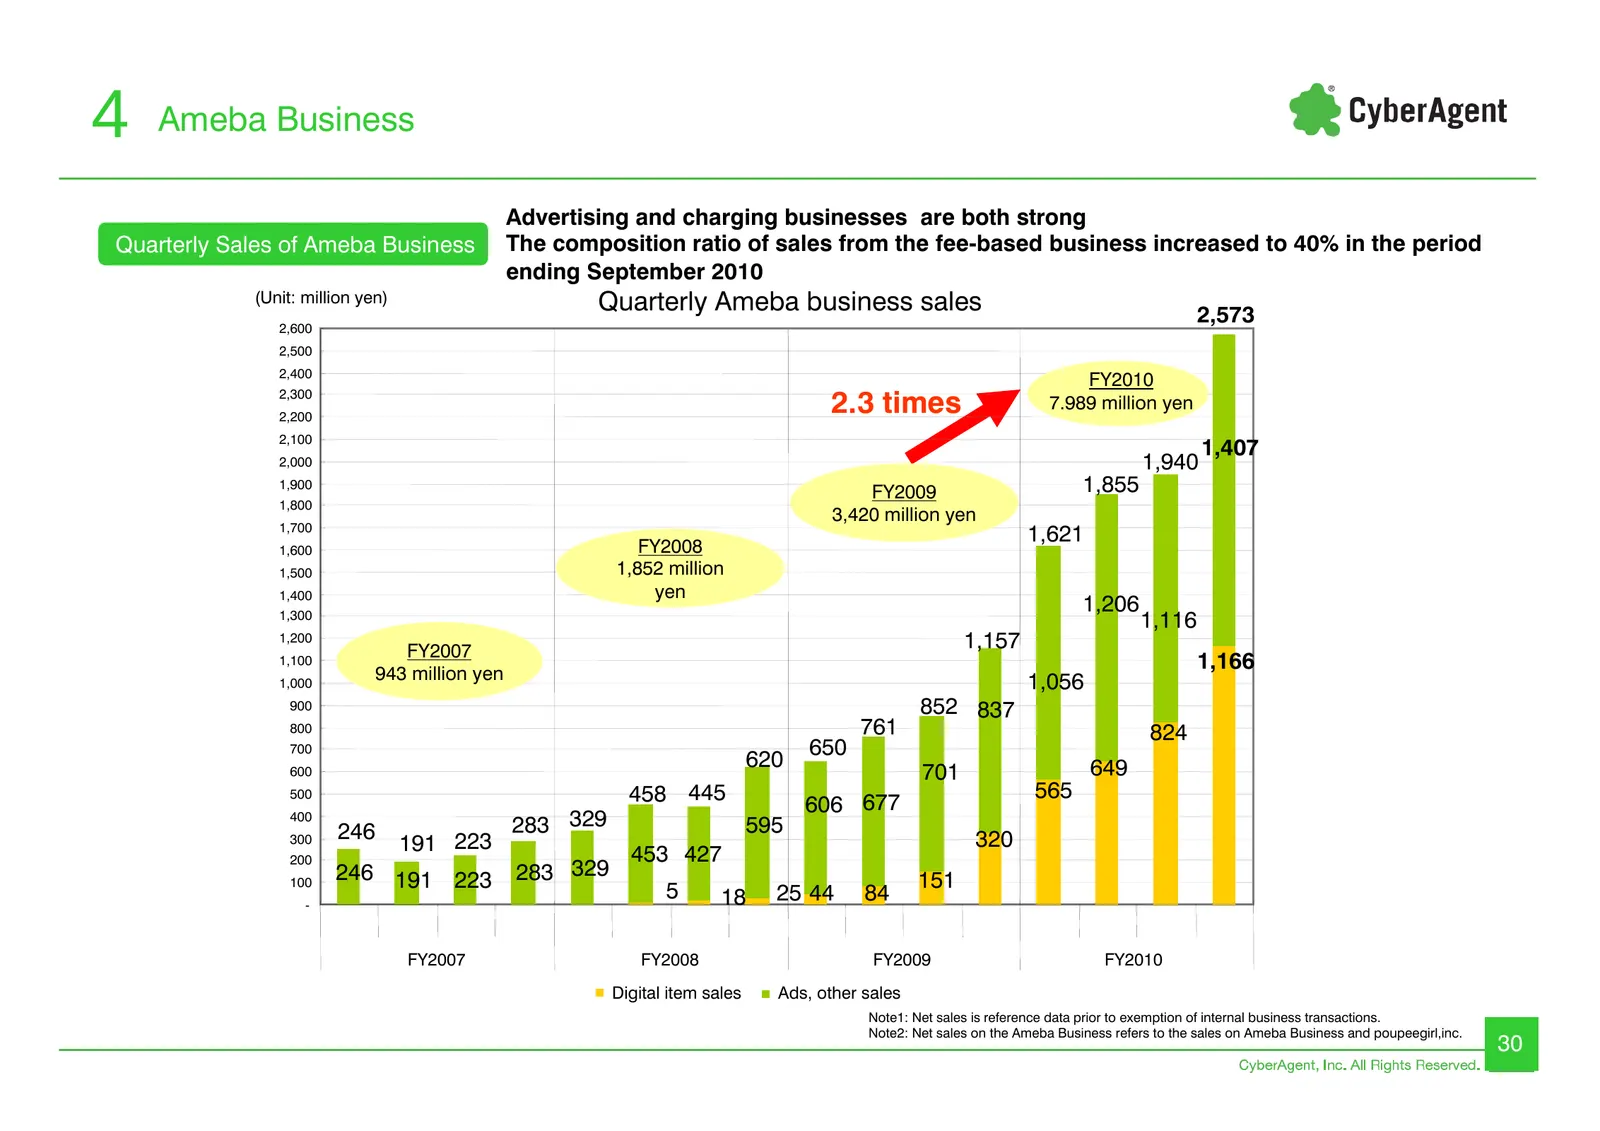
4 Ameba Business Advertising and charging businesses are both strong Quarterly Sales of Ameba Business The composition ratio of sales from the fee-based business increased to 40% in the period ending September 2010 (Unit: million yen) Quarterly Ameba business sales 2,573 2,600 2,500 2,400 FY2010 2,3
Slide 31: Quarterly Ameba Business Ads Sales
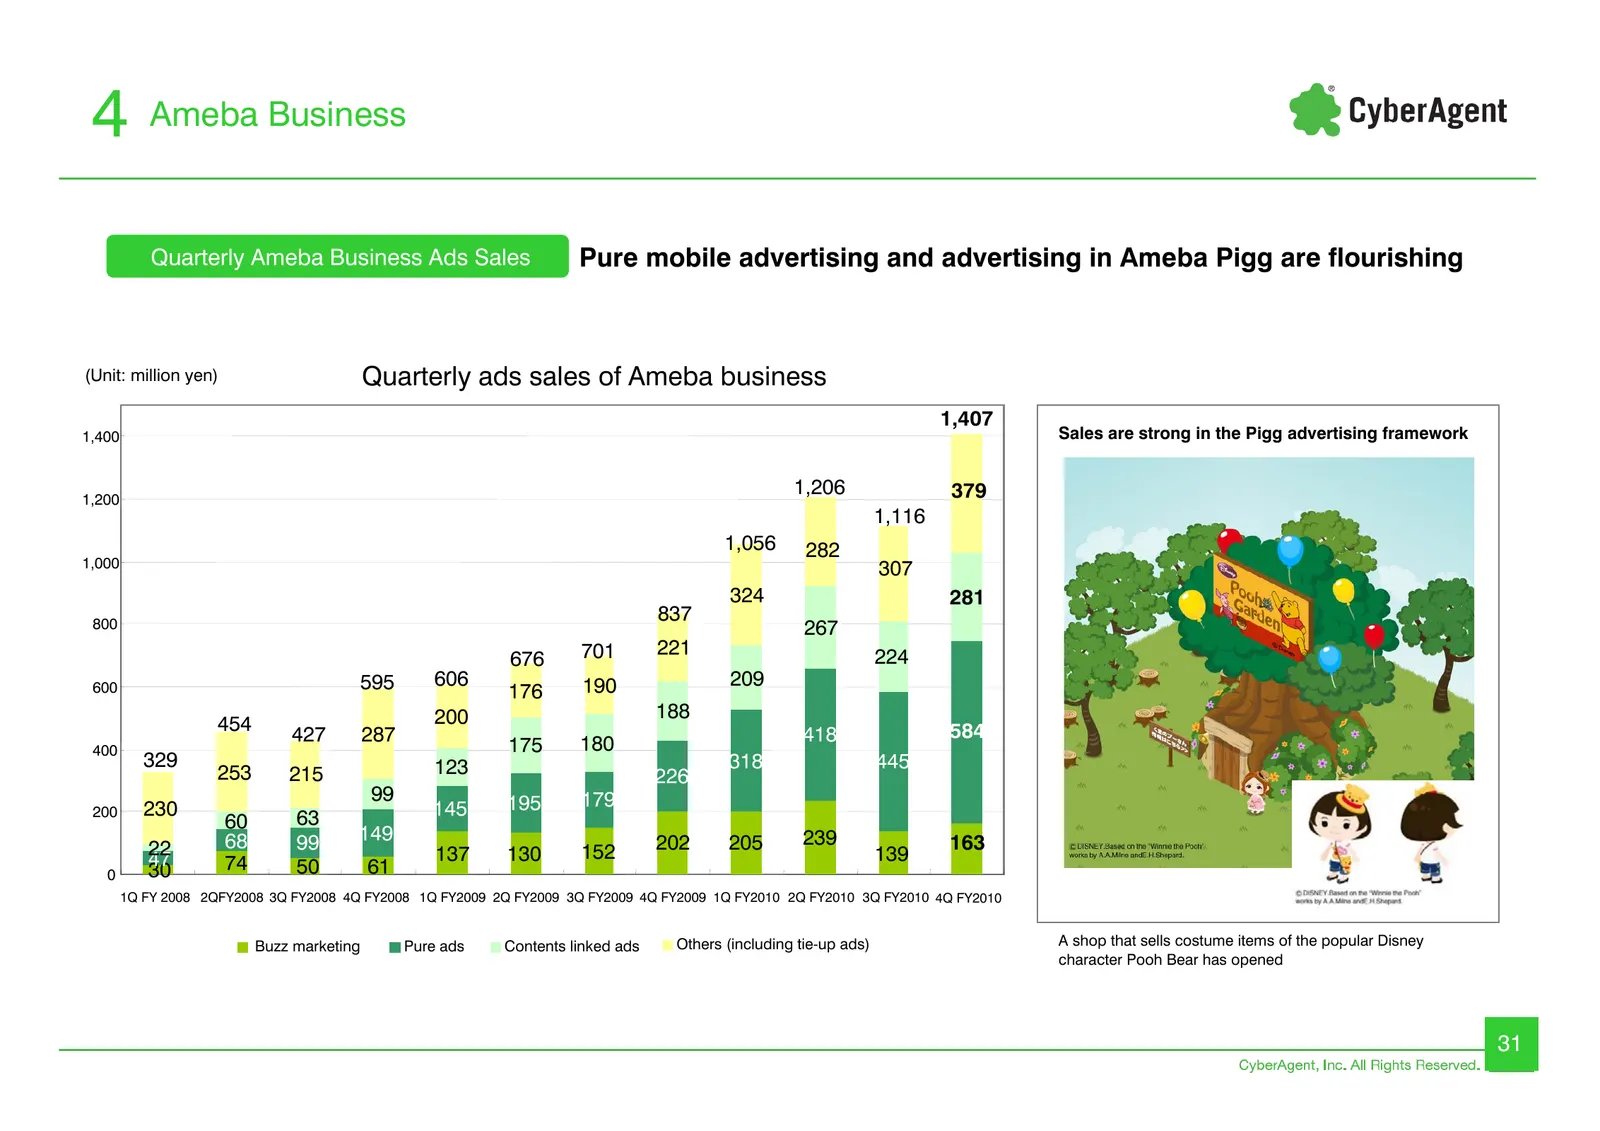
4 Ameba Business Quarterly Ameba Business Ads Sales Pure mobile advertising and advertising in Ameba Pigg are flourishing (Unit: million yen) Quarterly ads sales of Ameba business 1,407 1,400 Sales are strong in the Pigg advertising framework 1,206 379 1,200 1,116 1,056 282 1,000 307 324 281 800 837
Slide 32: Quarterly Digital Item Sales of Ameba Business
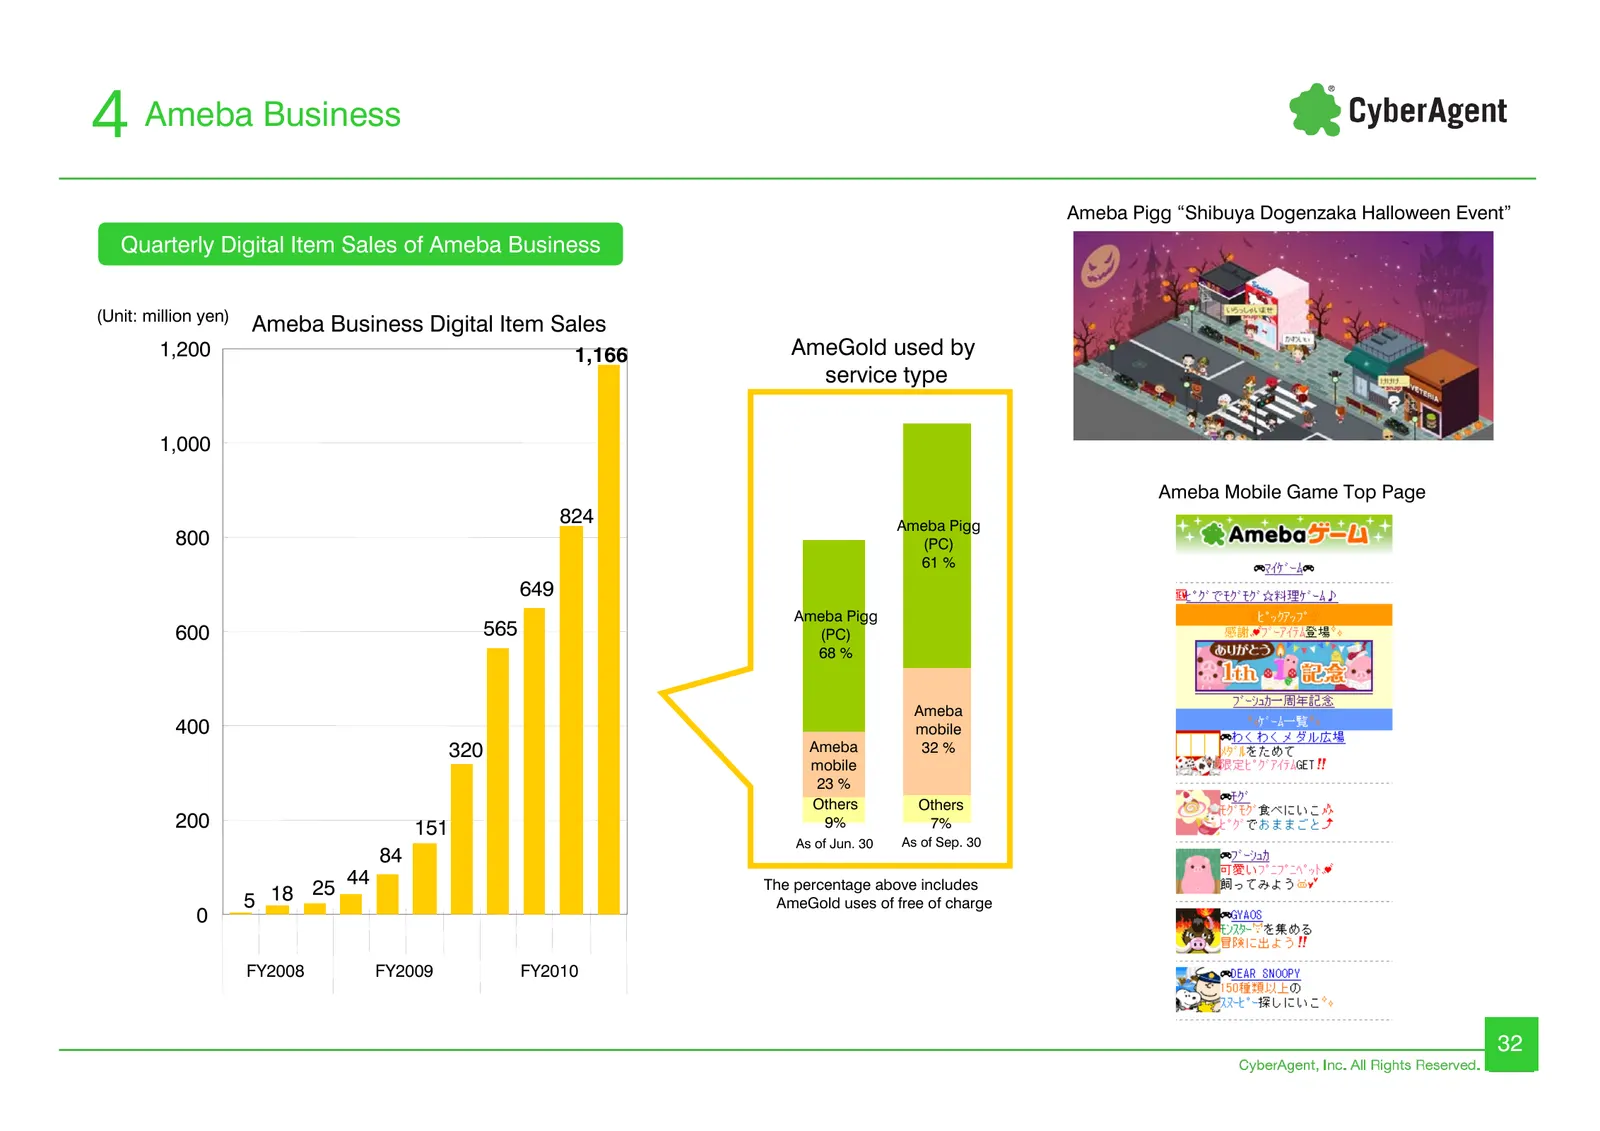
4 Ameba Business Ameba Pigg “Shibuya Dogenzaka Halloween Event” Quarterly Digital Item Sales of Ameba Business (Unit: million yen) Ameba Business Digital Item Sales 1,200 1,166 AmeGold used by service type 1,000 Ameba Mobile Game Top Page 824 Ameba Pigg 800 (PC) 61 % 649 Ameba Pigg 600 565 (PC) 68 %
Slide 33: Usage ARPU Trends (Monthly)
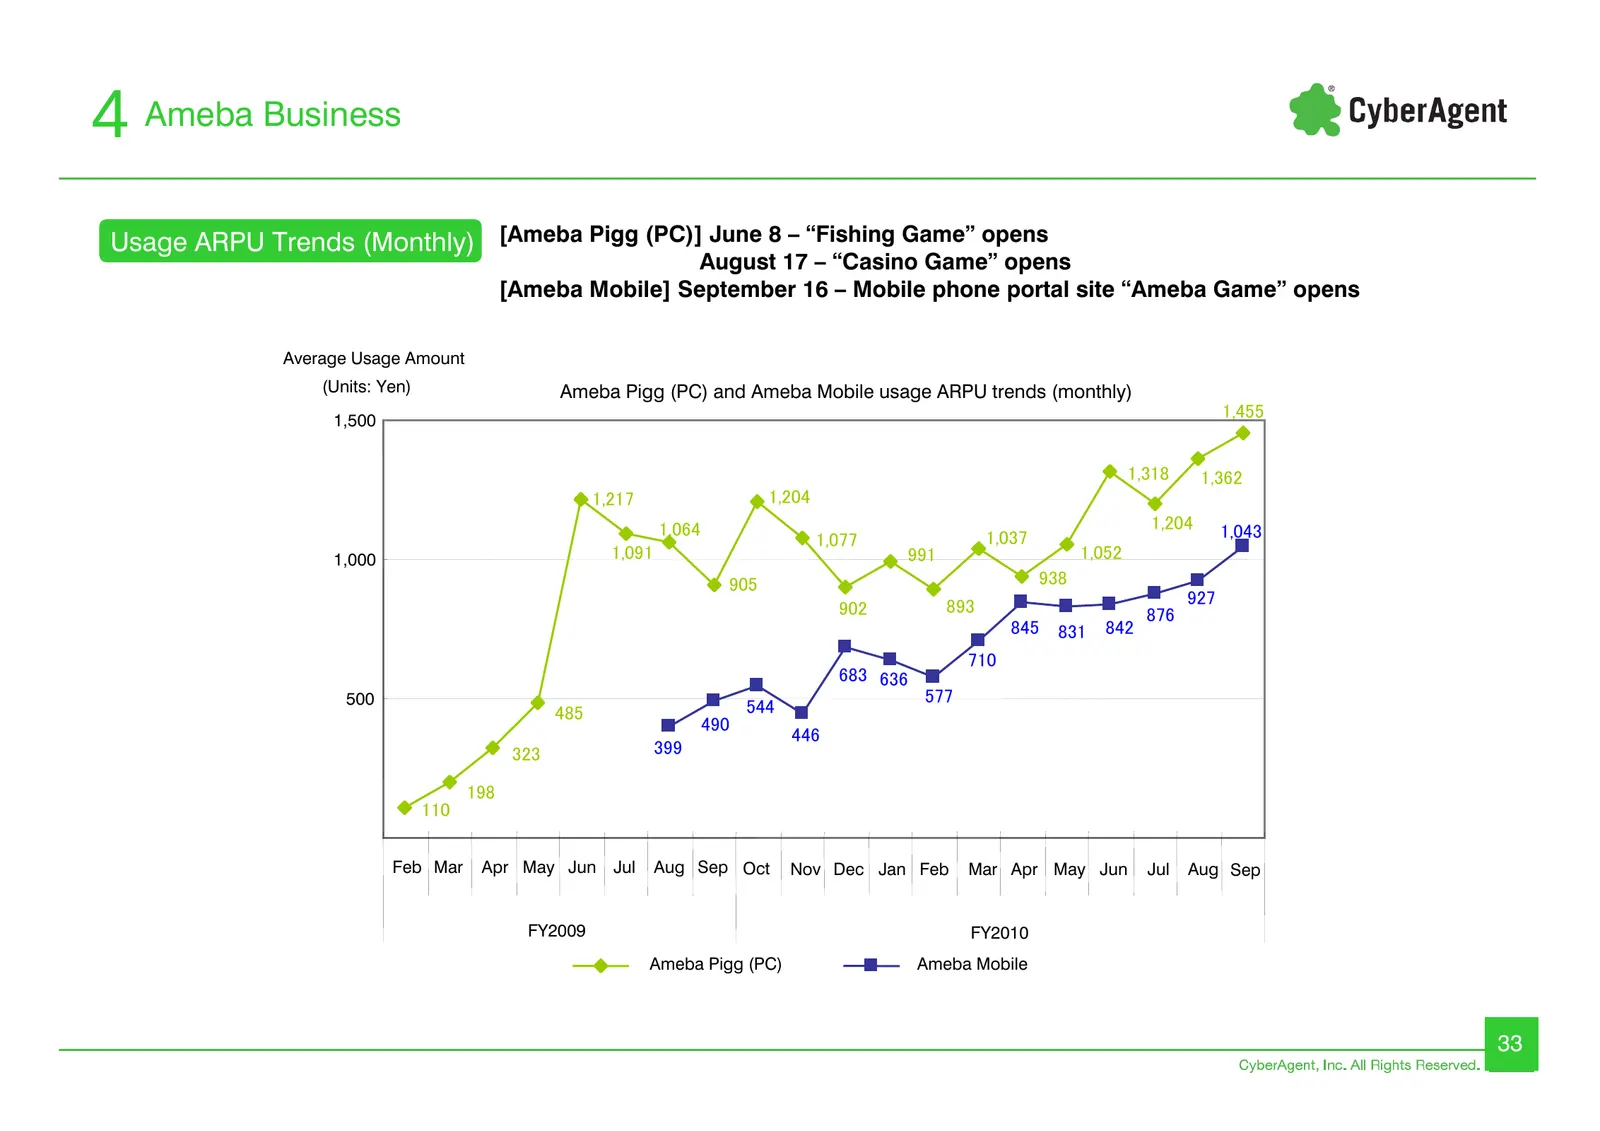
4 Ameba Business Usage ARPU Trends (Monthly) [Ameba Pigg (PC)] June 8 – “Fishing Game” opens August 17 – “Casino Game” opens [Ameba Mobile] September 16 – Mobile phone portal site “Ameba Game” opens Average Usage Amount (Units: Yen) Ameba Pigg (PC) and Ameba Mobile usage ARPU trends (monthly) 1,500
Slide 34: Ameba Pigg Casino Game and Fishing Game
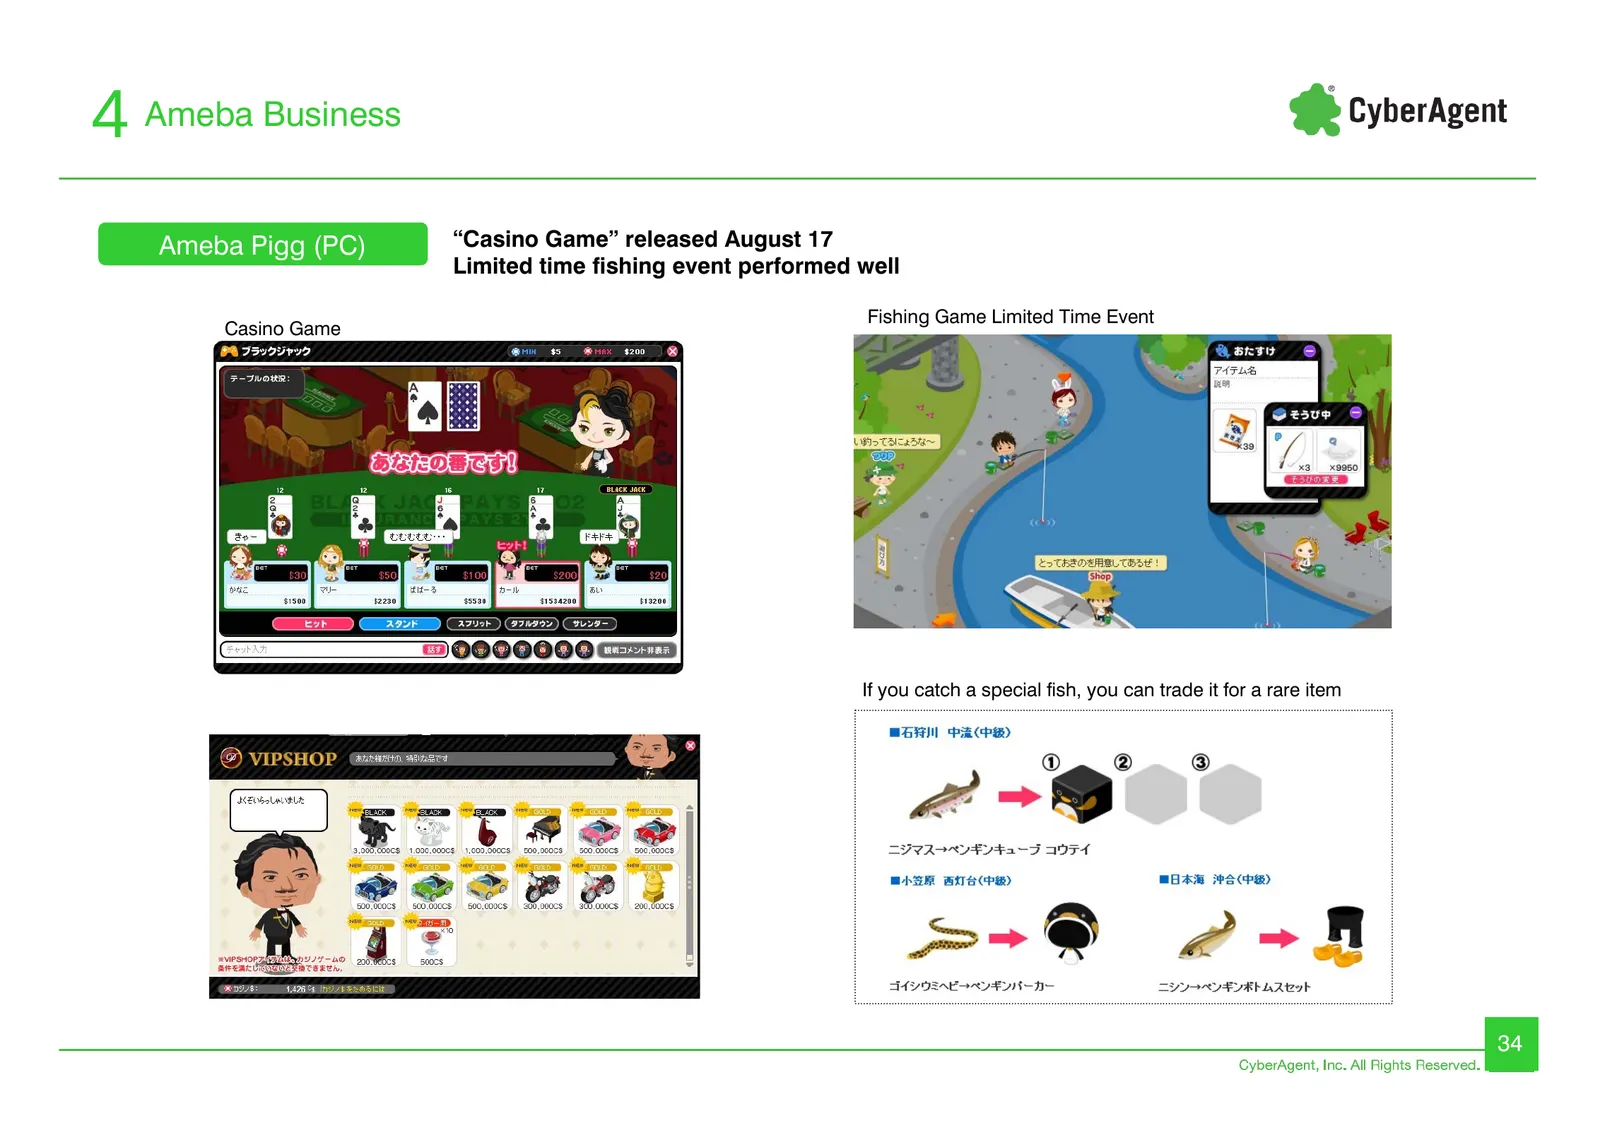
4 Ameba Business Ameba Pigg (PC) “Casino Game” released August 17 Limited time fishing event performed well Fishing Game Limited Time Event Casino Game If you catch a special fish, you can trade it for a rare item 34
Slide 35: Ameba Game mobile portal opens
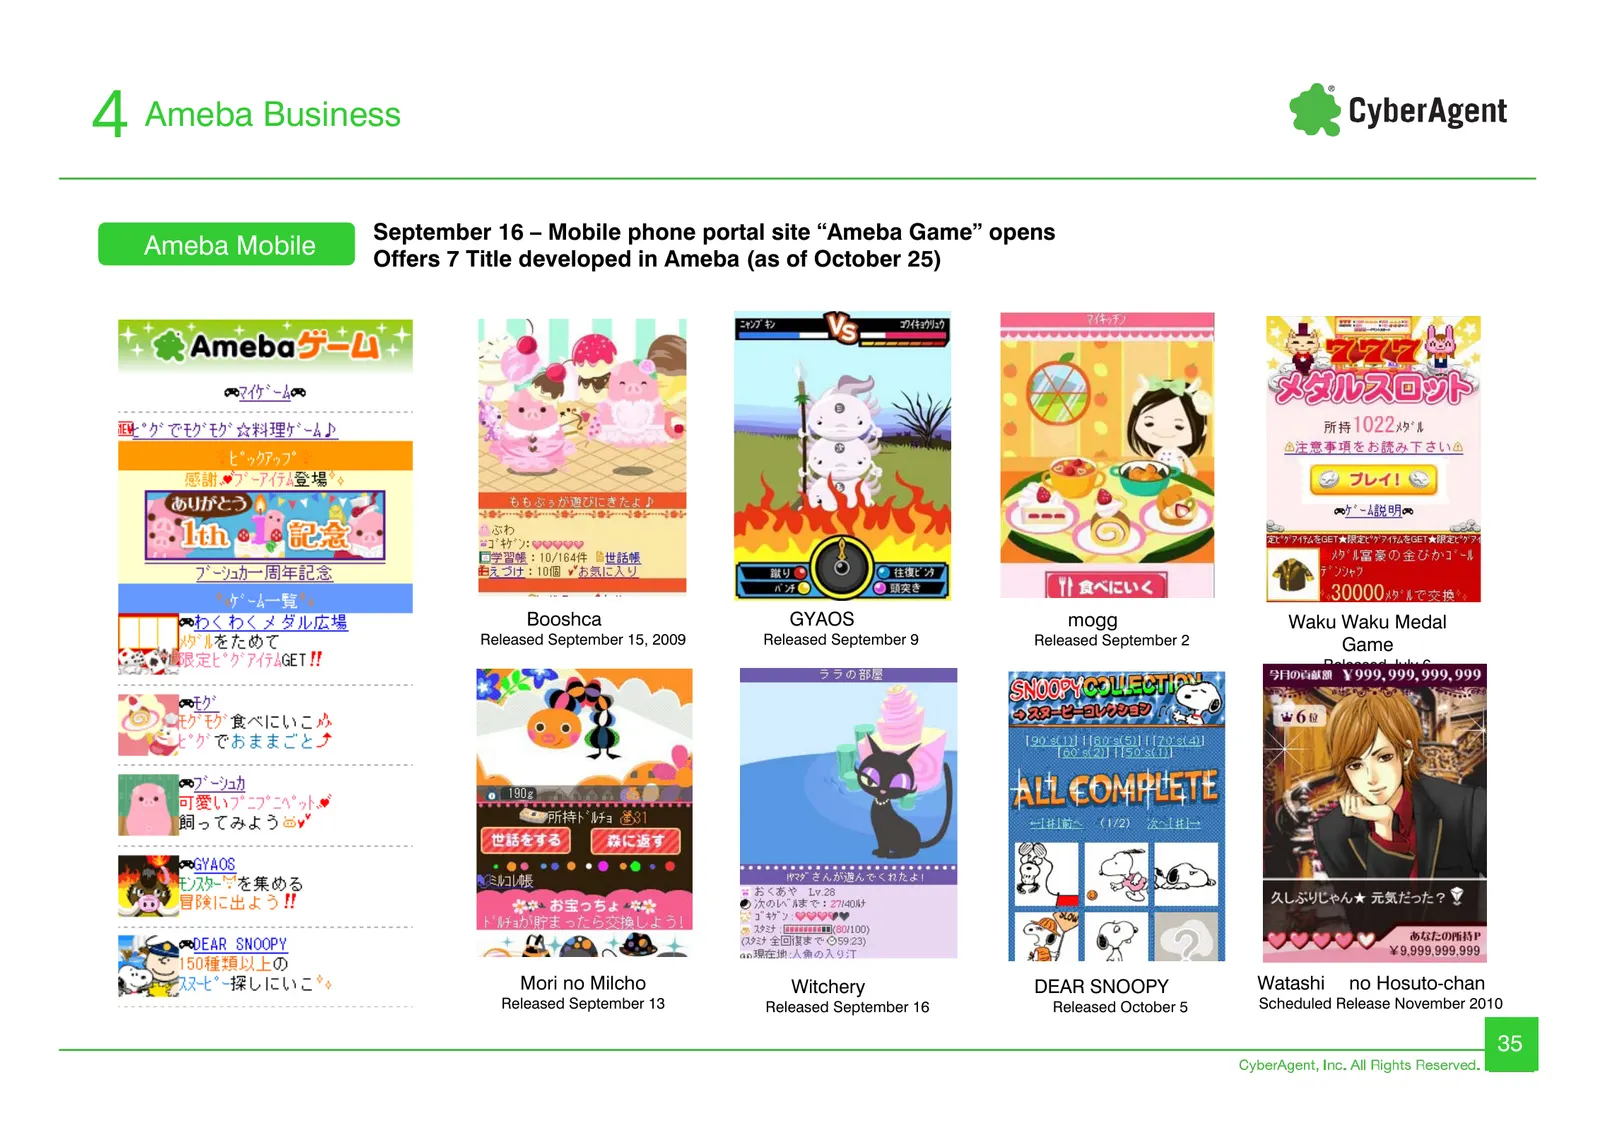
4 Ameba Business September 16 – Mobile phone portal site “Ameba Game” opens Ameba Mobile Offers 7 Title developed in Ameba (as of October 25) Booshca GYAOS mogg Waku Waku Medal Released September 15, 2009 Released September 9 Released September 2 Game Released July 6 Mori no Milcho Witchery DEAR SNO
Slide 36: Subsidiaries provide social games to Ameba Mobile
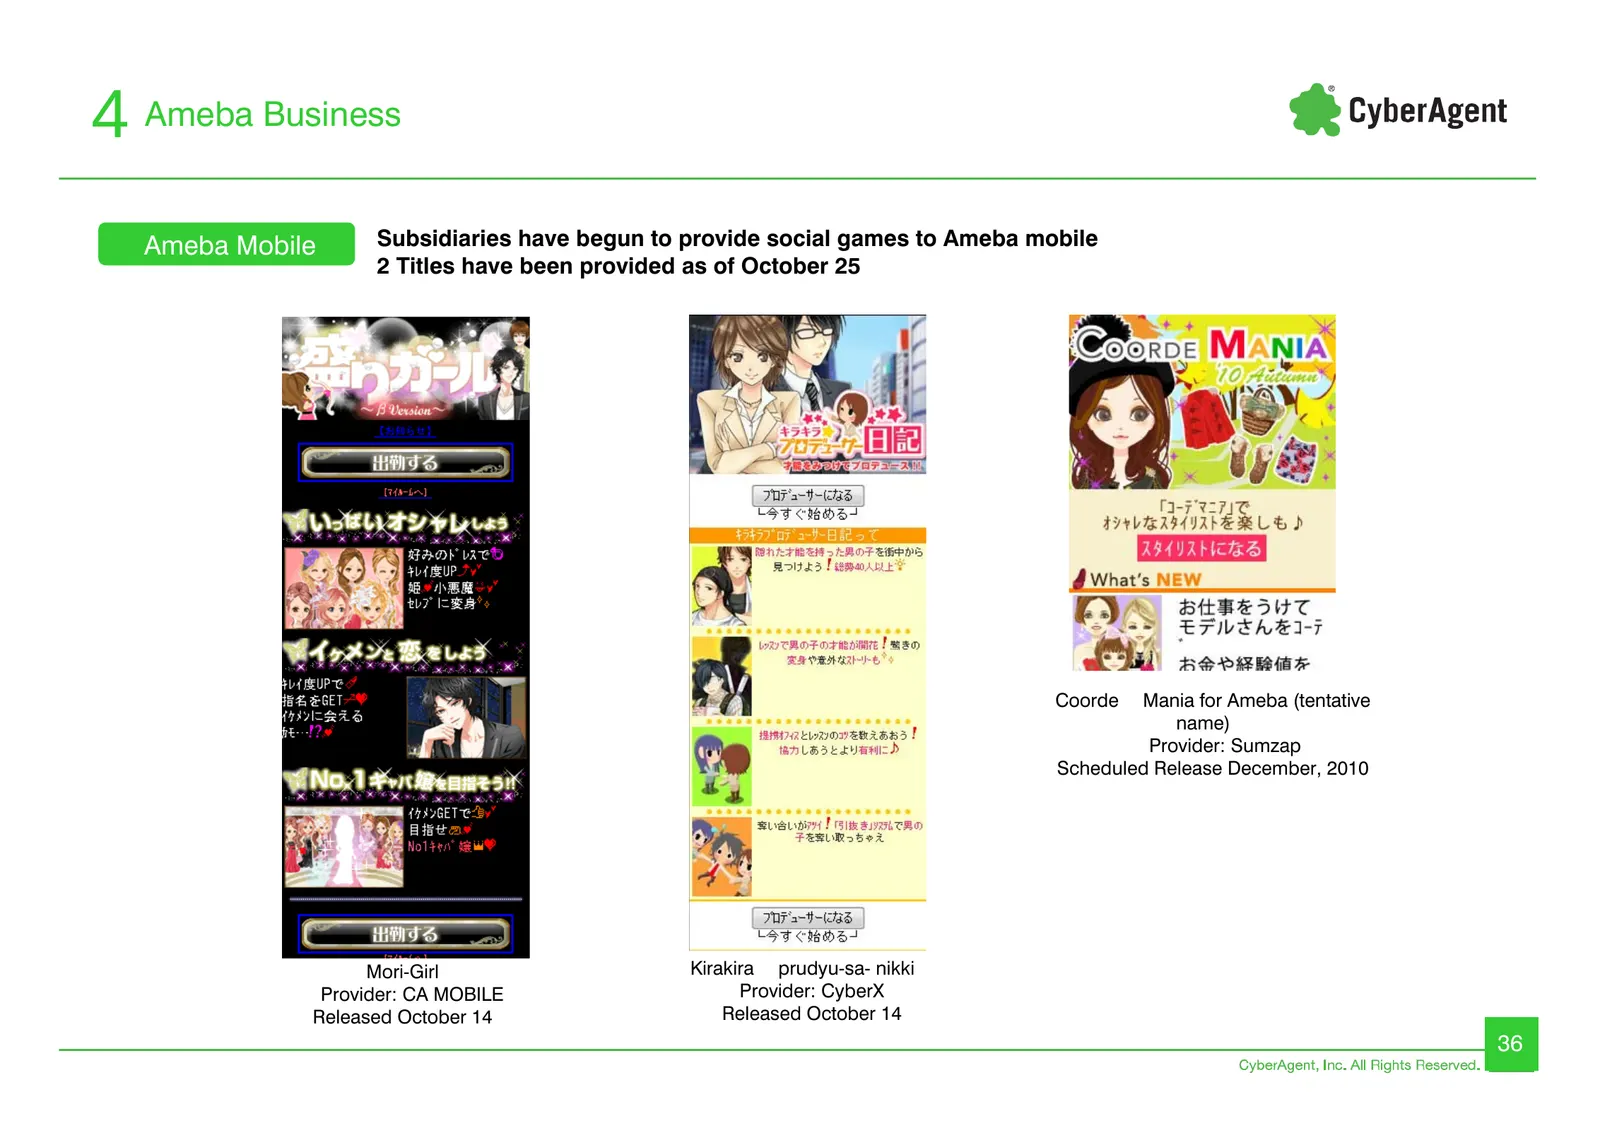
4 Ameba Business Ameba Mobile Subsidiaries have begun to provide social games to Ameba mobile 2 Titles have been provided as of October 25 Coorde Mania for Ameba (tentative name) Provider: Sumzap Scheduled Release December, 2010 Mori-Girl Kirakira prudyu-sa- nikki Provider: CA MOBILE Provider: Cyber
Slide 37: Ameba Pigg for Android
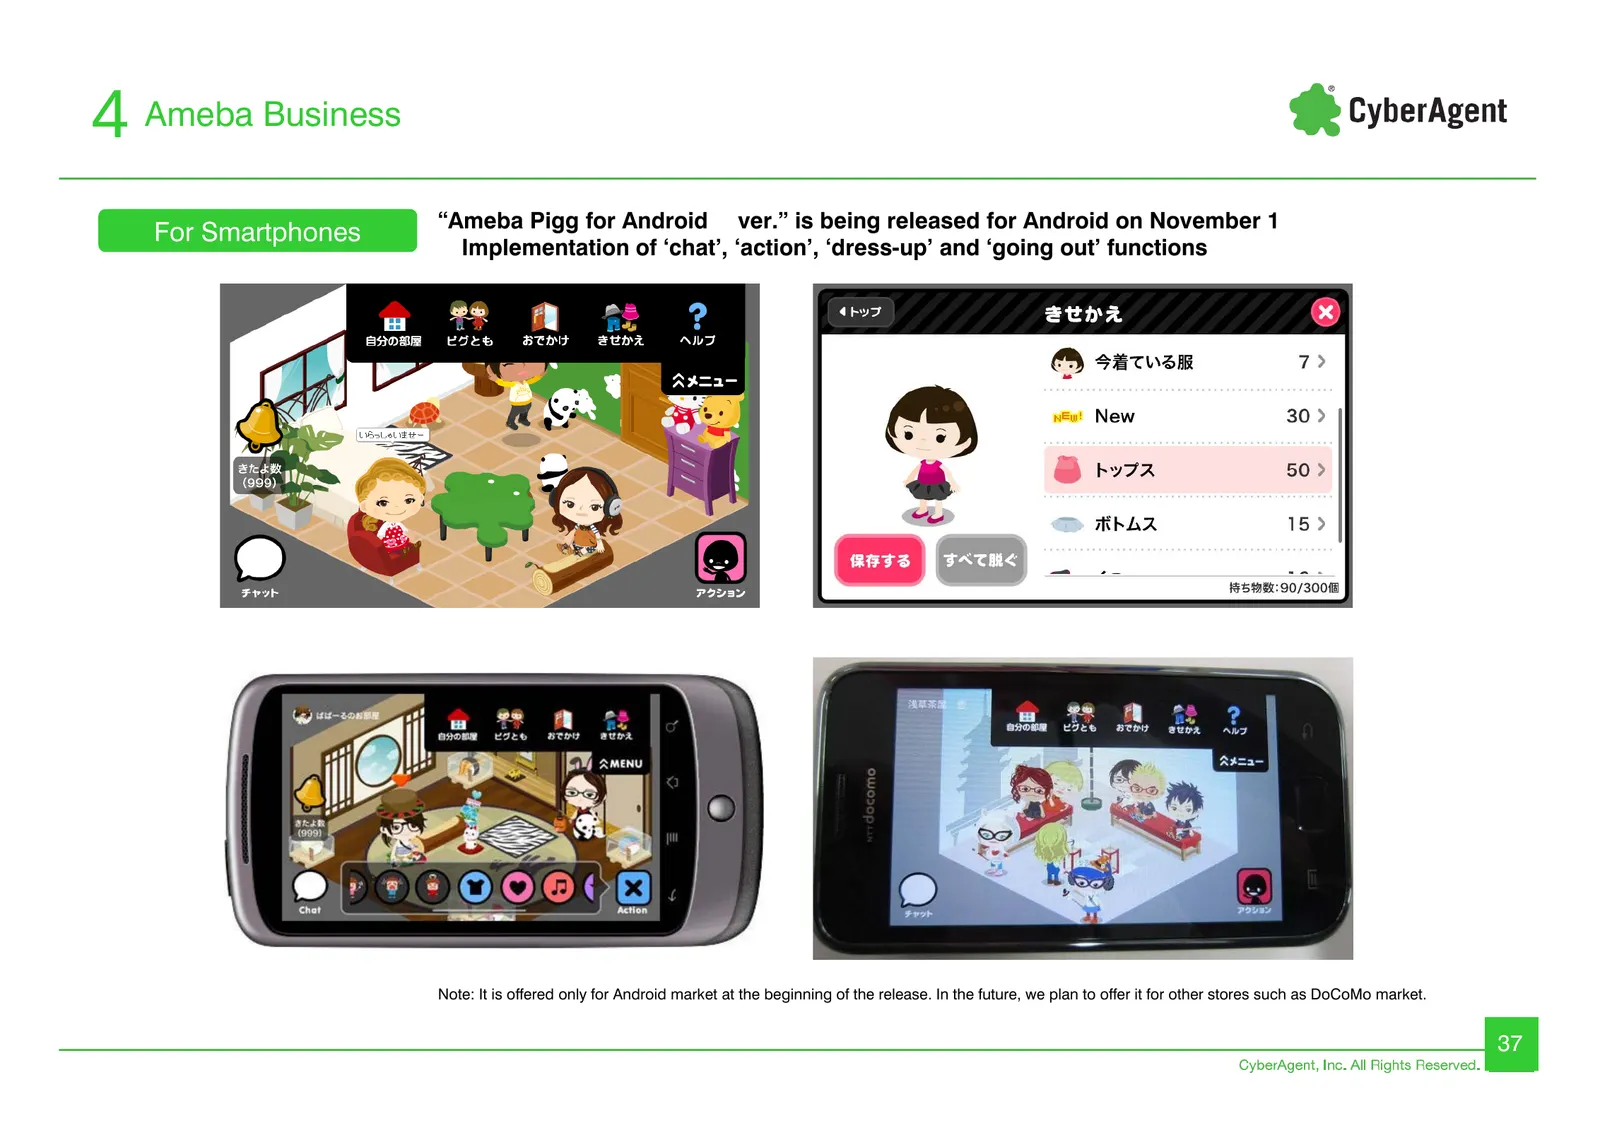
4 Ameba Business “Ameba Pigg for Android ver.” is being released for Android on November 1 For Smartphones Implementation of ‘chat’, ‘action’, ‘dress-up’ and ‘going out’ functions Note: It is offered only for Android market at the beginning of the release. In the future, we plan to offer it for othe
Slide 38: Ameba Future Strategy
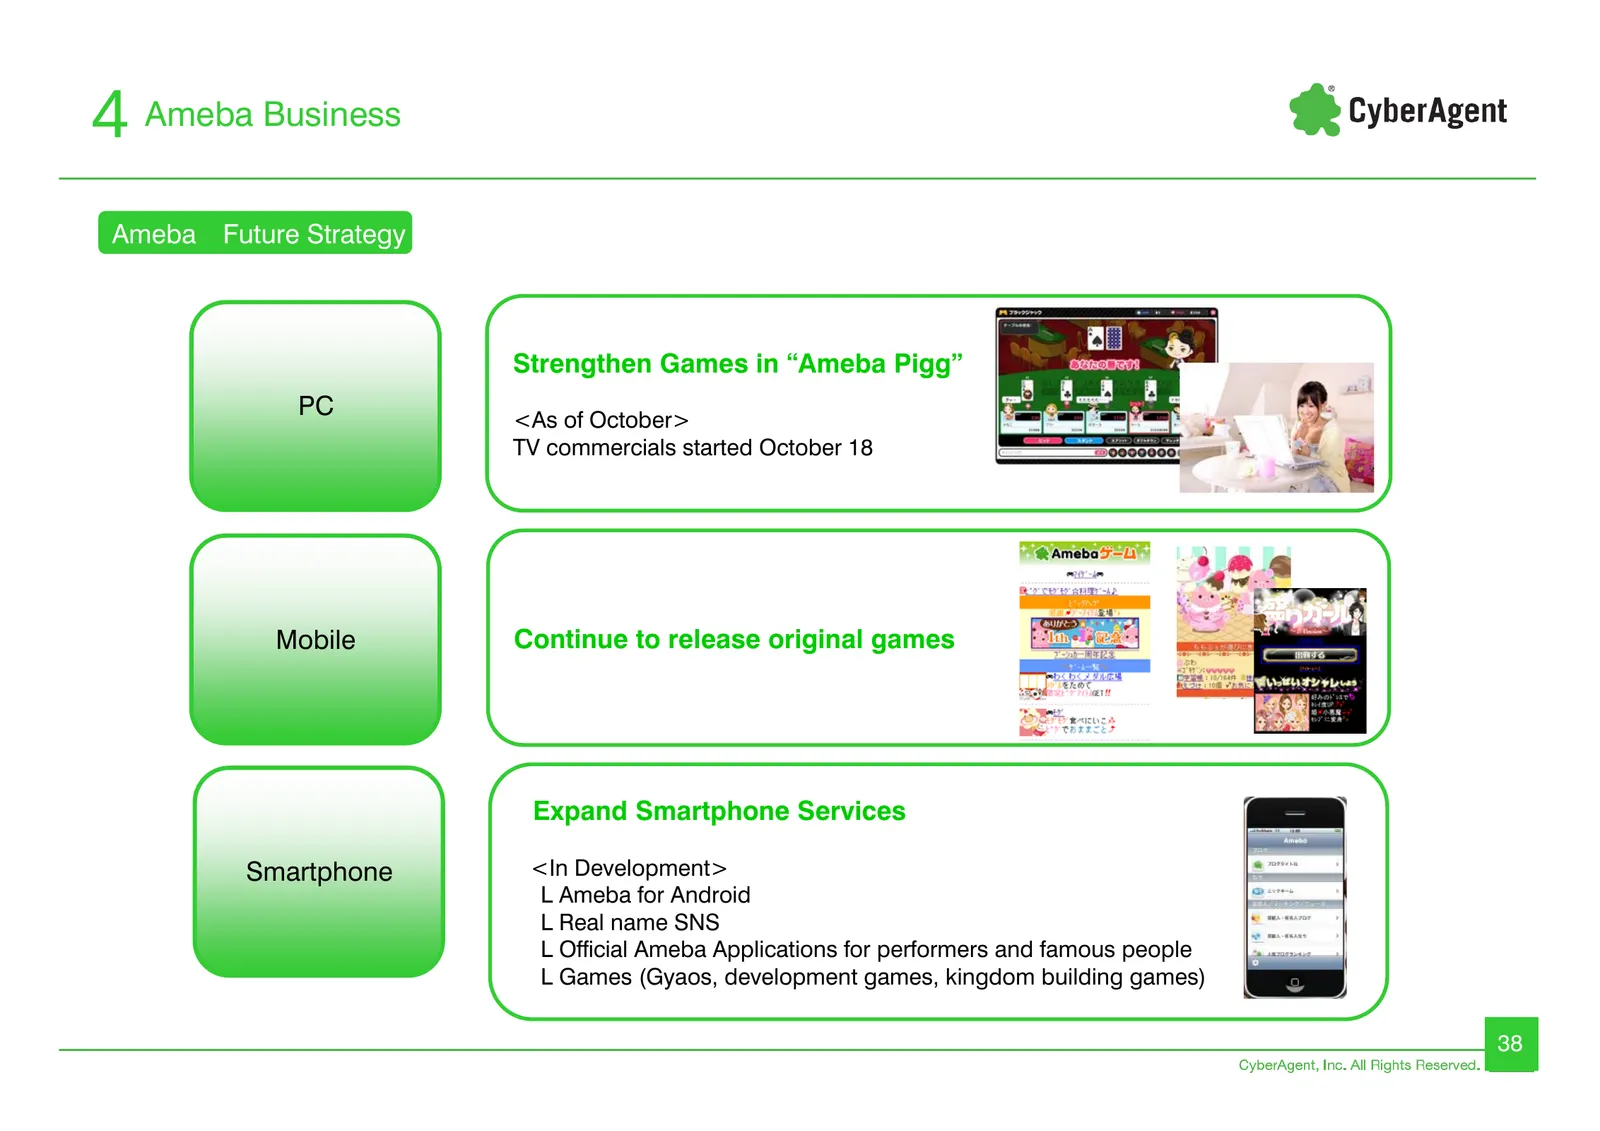
4 Ameba Business Ameba Future Strategy Strengthen Games in “Ameba Pigg” PC <As of October> TV commercials started October 18 Mobile Continue to release original games Expand Smartphone Services Smartphone <In Development> L Ameba for Android L Real name SNS L Official Ameba Applications for performe
Slide 39: Summary
5 Summary & CyberAgent Summary CyberAgent, Inc. All Rights Reserved.
Slide 40: Areas of Focus for Fiscal Year 2011
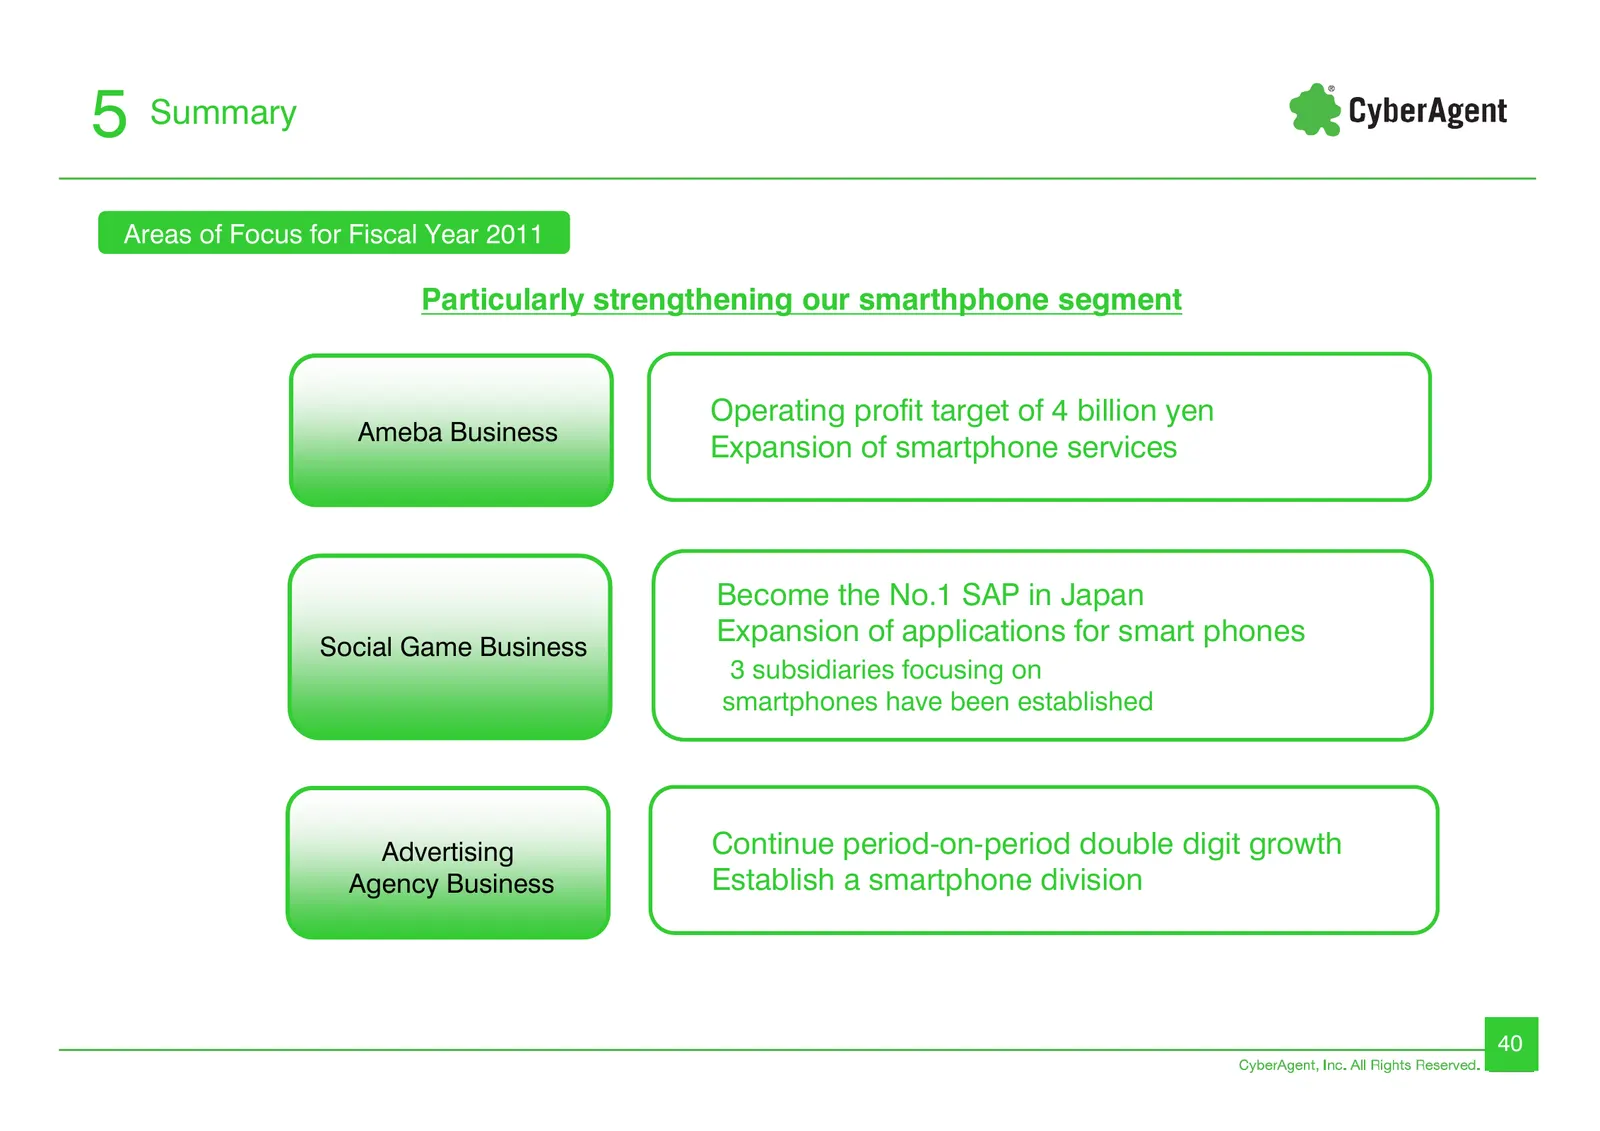
5 Summary Areas of Focus for Fiscal Year 2011 Particularly strengthening our smarthphone segment Operating profit target of 4 billion yen Ameba Business Expansion of smartphone services Become the No.1 SAP in Japan Social Game Business Expansion of applications for smart phones 3 subsidiaries focusi
Slide 41: Vaulting towards being a high-income media company centered on Ameba
5 Summary Vaulting towards being a high-income media company centered on Ameba Net sales Operating Profit (Unit: million (Unit: million yen) yen) Business Forecast for FY2011 Sales 110.0 billion yen (13.8 increase from the previous year Operating Profit 11.0 billion yen (17.8 increase from the previ
Slide 42: We Create The Company that Symbolizes the 21st Century
5 Summary We Create The Company that Symbolizes the 21st Century. 42
Source: Internet Archive copy of ir.cyberagent.co.jp
More decks from CyberAgent Incorporated
 FY2026 Earnings Presentation59 slides · Nov 16, 2026
 FY2026 Earnings Presentation60 slides · Nov 12, 2026
 FY2026 Earnings Presentation58 slides · Nov 11, 2026
 Investor Presentation (August 2026)79 slides · Aug 7, 2026
 Q3 2026 Earnings Presentation40 slides · Aug 7, 2026
 Q2 2026 Earnings Presentation39 slides · May 13, 2026