Sterling Financial Corp
Sterling Financial — Q2 2013 Earnings Presentation
27 slides from Sterling Financial's earnings presentation, Jul 30, 2013
Slide 1: Management Update Second Quarter 2013
Management Update Second Quarter 2013 NASDAQ Ticker: STSA Spokane, Washington www.sterlingfinancialcorporation.com
Slide 2: Safe Harbor
Safe Harbor (1) The Reform Act defines the term "forward-looking statements" to include: statements of management plans and objectives, statements regarding the future economic performance, and projections of revenues and other financial data, among others. The Reform Act precludes liability for ora
Slide 3: 2013 Sterling Franchise at a Glance
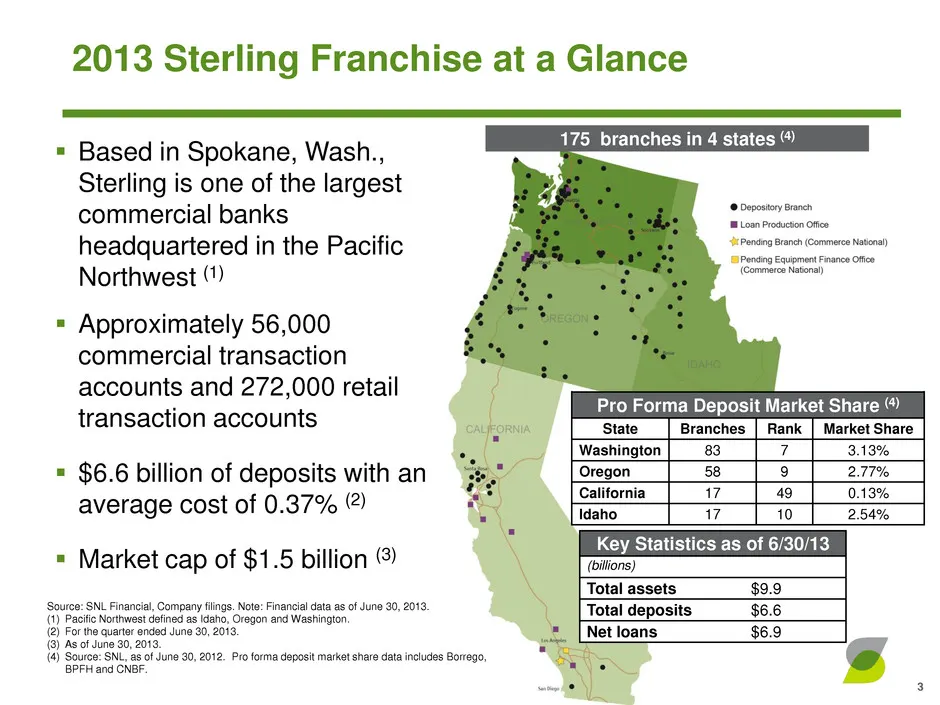
Key Statistics as of 6/30/13 (billions) Total assets $9.9 Total deposits $6.6 Net loans $6.9 2013 Sterling Franchise at a Glance 3 Based in Spokane, Wash., Sterling is one of the largest commercial banks headquartered in the Pacific Northwest (1) Approximately 56,000 commercial transaction accou
Slide 4: Key Operating Objectives and Performance Trends
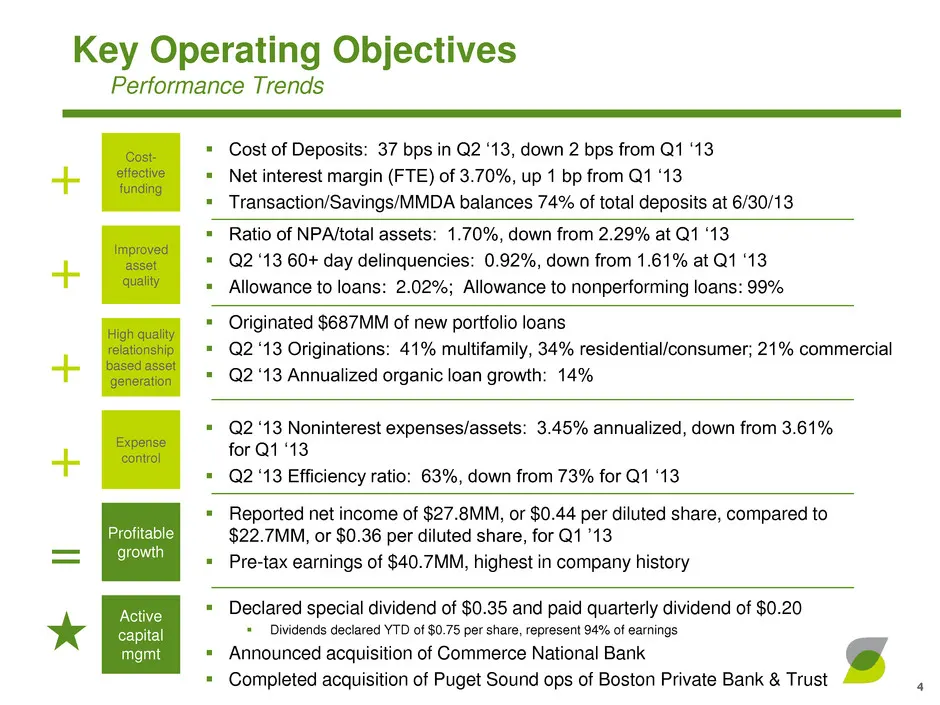
Key Operating Objectives Performance Trends Cost of Deposits: 37 bps in Q2 ‘13, down 2 bps from Q1 ‘13 Net interest margin (FTE) of 3.70%, up 1 bp from Q1 ‘13 Transaction/Savings/MMDA balances 74% of total deposits at 6/30/13 Ratio of NPA/total assets: 1.70%, down from 2.29% at Q1 ‘13 Q2 ‘
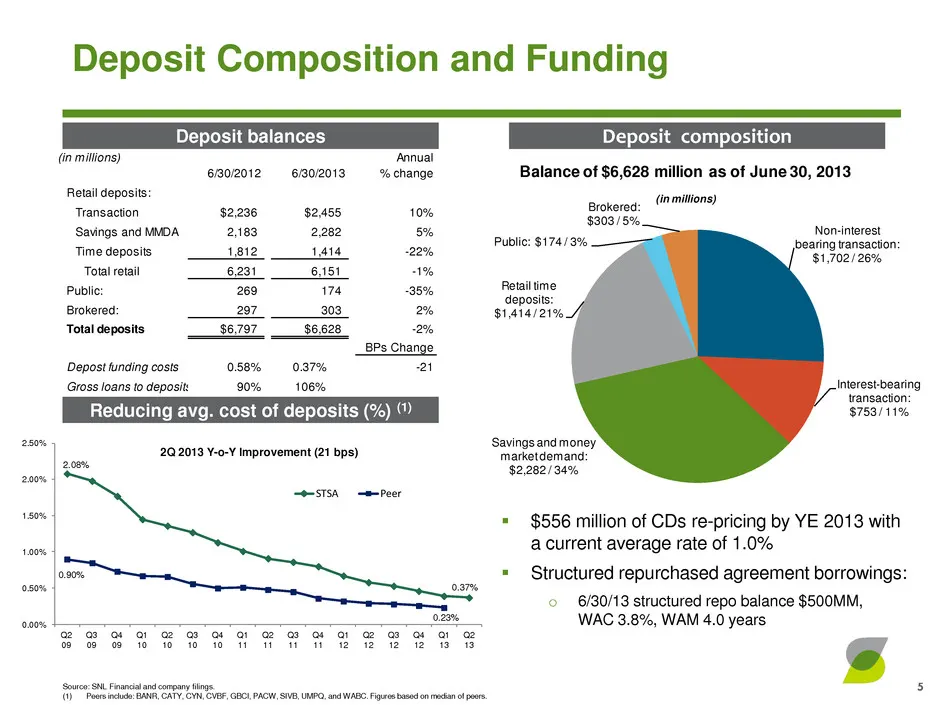
Slide 5: Deposit Composition and Funding
(in millions) 6/30/2012 6/30/2013 Annual % change Retail deposits: Transaction $2,236 $2,455 10% Savings and MMDA 2,183 2,282 5% Time deposits 1,812 1,414 -22% Total retail 6,231 6,151 -1% Public: 269 174 -35% Brokered: 297 303 2% Total deposits $6,797 $6,628 -2% BPs Change Depost funding costs 0.58
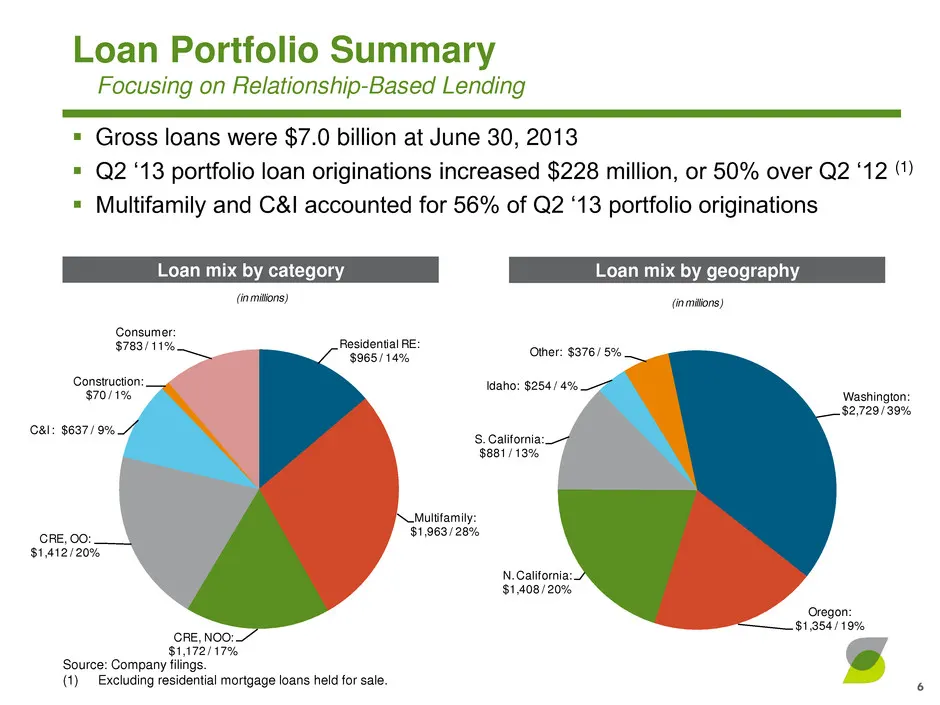
Slide 6: Loan Portfolio Summary
Washington: $2,729 / 39% Oregon: $1,354 / 19% N. California: $1,408 / 20% S. California: $881 / 13% Idaho: $254 / 4% Other: $376 / 5% (in millions) Residential RE: $965 / 14% Multifamily: $1,963 / 28% CRE, NOO: $1,172 / 17% CRE, OO: $1,412 / 20% C&I : $637 / 9% Construction: $70 / 1% Consumer: $783
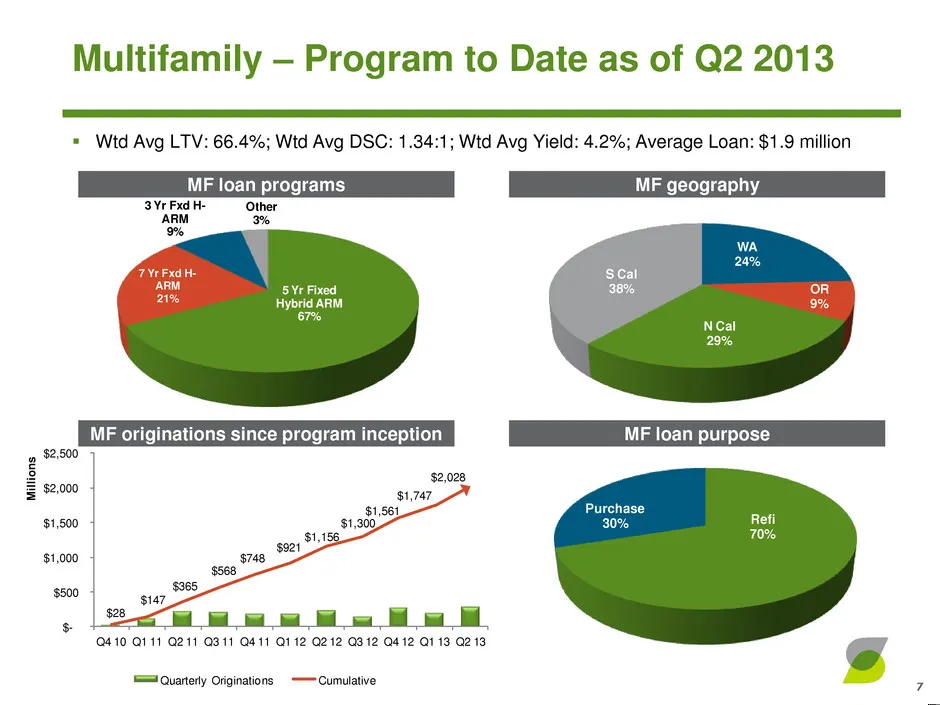
Slide 7: Multifamily Program to Date
WA 24% OR 9% N Cal 29% S Cal 38% 5 Yr Fixed Hybrid ARM 67% 7 Yr Fxd H- ARM 21% 3 Yr Fxd H- ARM 9% Other 3% Refi 70% Purchase 30% $28 $147 $365 $568 $748 $921 $1,156 $1,300 $1,561 $1,747 $2,028 $- $500 $1,000 $1,500 $2,000 $2,500 Q4 10 Q1 11 Q2 11 Q3 11 Q4 11 Q1 12 Q2 12 Q3 12 Q4 12 Q1 13 Q2 13 Mi ll
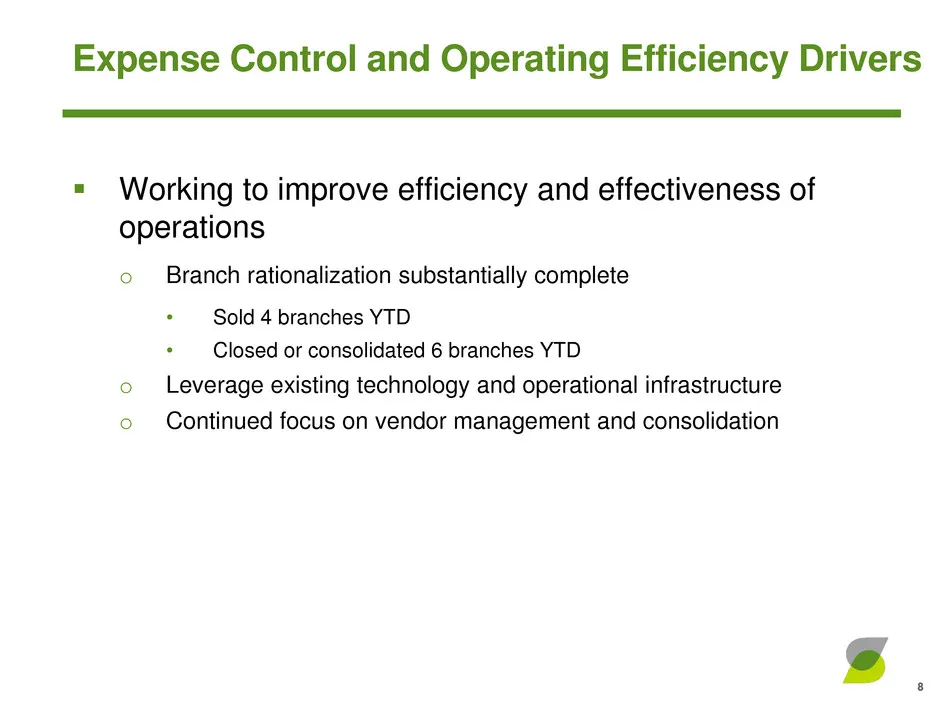
Slide 8: Expense Control and Operating Efficiency Drivers
Working to improve efficiency and effectiveness of operations o Branch rationalization substantially complete • Sold 4 branches YTD • Closed or consolidated 6 branches YTD o Leverage existing technology and operational infrastructure o Continued focus on vendor management and consolidation Expense
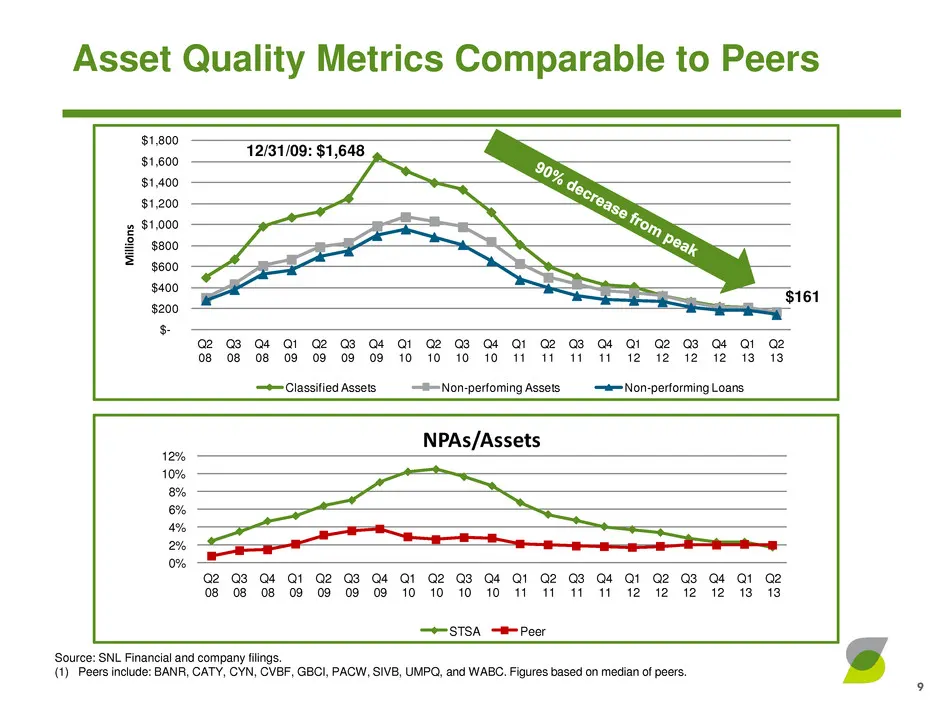
Slide 9: Asset Quality Metrics Comparable to Peers
0% 2% 4% 6% 8% 10% 12% Q2 08 Q3 08 Q4 08 Q1 09 Q2 09 Q3 09 Q4 09 Q1 10 Q2 10 Q3 10 Q4 10 Q1 11 Q2 11 Q3 11 Q4 11 Q1 12 Q2 12 Q3 12 Q4 12 Q1 13 Q2 13 NPAs/Assets STSA Peer $- $200 $400 $600 $800 $1,000 $1,200 $1,400 $1,600 $1,800 Q2 08 Q3 08 Q4 08 Q1 09 Q2 09 Q3 09 Q4 09 Q1 10 Q2 10 Q3 10 Q4 10 Q1 11
Slide 10: Summary
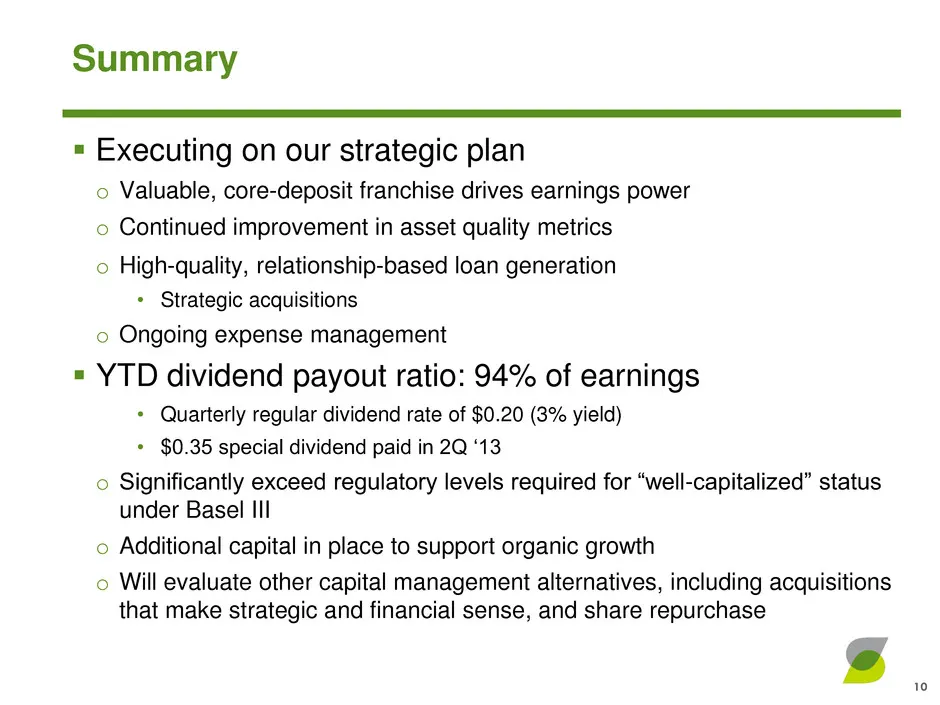
Summary Executing on our strategic plan o Valuable, core-deposit franchise drives earnings power o Continued improvement in asset quality metrics o High-quality, relationship-based loan generation • Strategic acquisitions o Ongoing expense management YTD dividend payout ratio: 94% of earnings •
Slide 11: Investor and Media Contact
NASDAQ Ticker: STSA Spokane, Washington www.sterlingfinancialcorporation.com Investor Contact Media Contact Patrick Rusnak Cara Coon Chief Financial Officer VP/Communications and Public Affairs Director (509) 227-0961 (509) 626-5348 patrick.rusnak@bankwithsterling.com cara.coon@bankwithsterling.com
Slide 12: Earnings Release Supplement
Earnings Release Supplement For the Quarter and Quarter Ended June 30, 2013
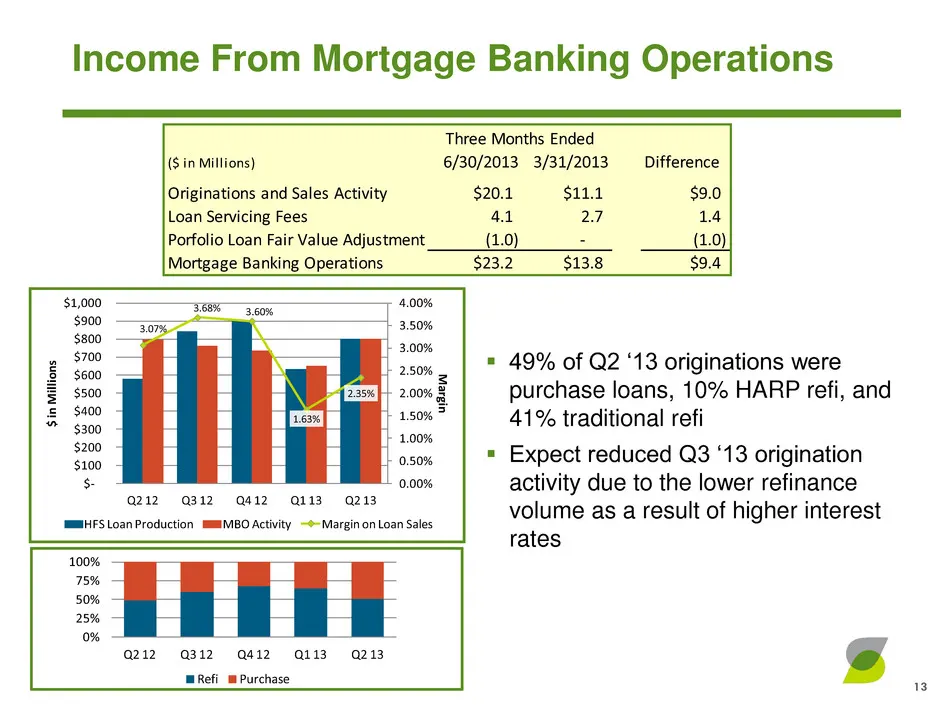
Slide 13: Income From Mortgage Banking Operations
($ in Millions) 6/30/2013 3/31/2013 Difference Originations and Sales Activity $20.1 $11.1 $9.0 Loan Servicing Fees 4.1 2.7 1.4 Porfolio Loan Fair Value Adjustment (1.0) - (1.0) Mortgage Banking Operations $23.2 $13.8 $9.4 Three Months Ended 3.07% 3.68% 3.60% 1.63% 2.35% 0.00% 0.50% 1.00% 1.50% 2.00
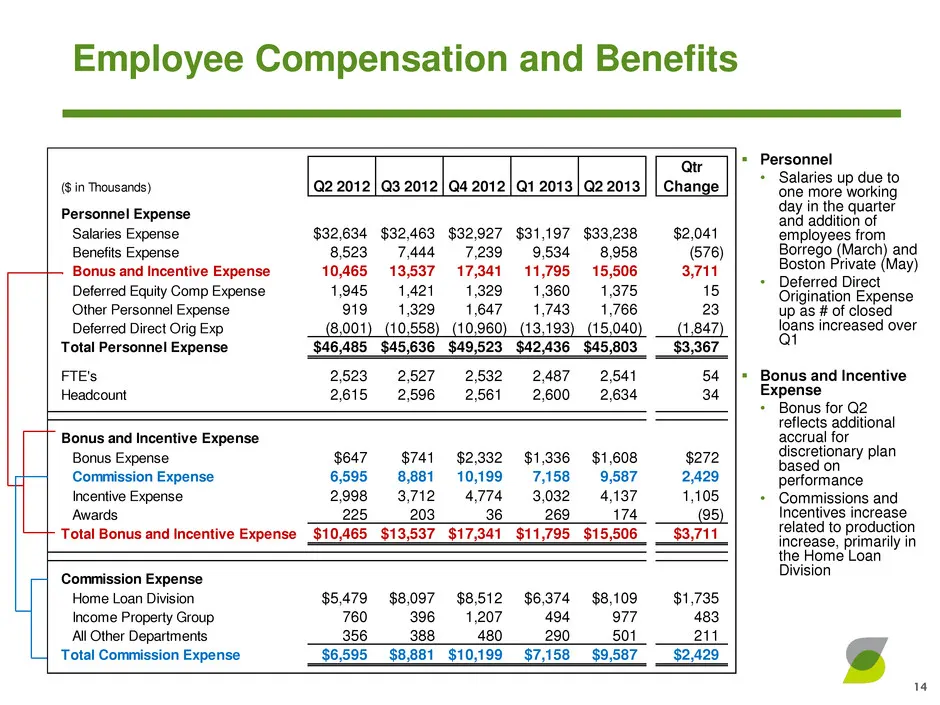
Slide 14: Personnel Expense
($ in Thousands) Q2 2012 Q3 2012 Q4 2012 Q1 2013 Q2 2013 Qtr Change Personnel Expense Salaries Expense $32,634 $32,463 $32,927 $31,197 $33,238 $2,041 Benefits Expense 8,523 7,444 7,239 9,534 8,958 (576) Bonus and Incentive Expense 10,465 13,537 17,341 11,795 15,506 3,711 Deferred Equity Comp Expense
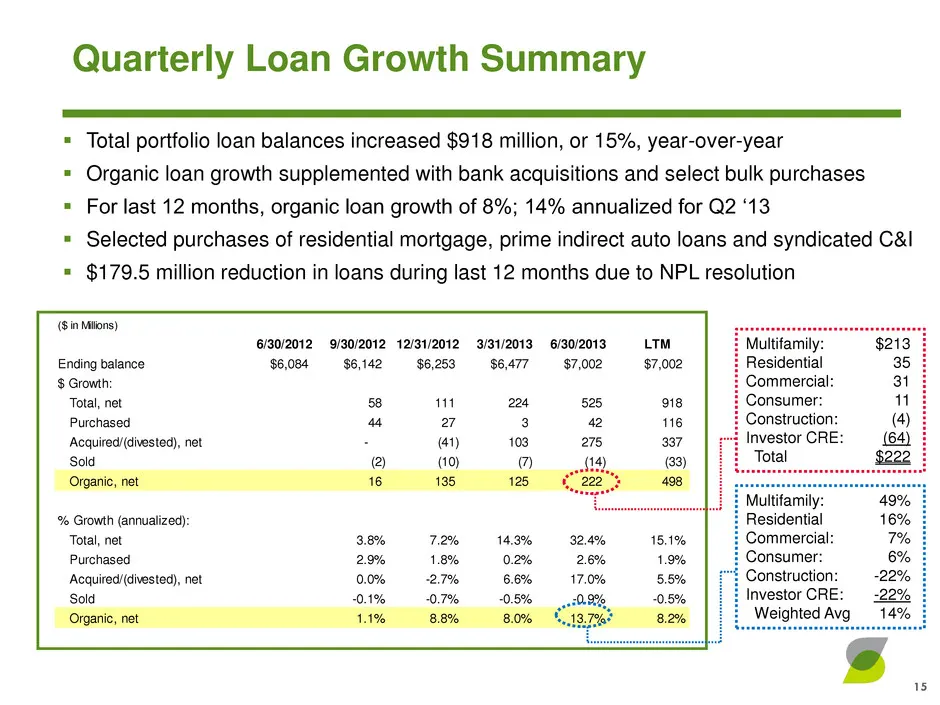
Slide 15: Quarterly Loan Growth Summary
($ in Millions) 6/30/2012 9/30/2012 12/31/2012 3/31/2013 6/30/2013 LTM Ending balance $6,084 $6,142 $6,253 $6,477 $7,002 $7,002 $ Growth: Total, net 58 111 224 525 918 Purchased 44 27 3 42 116 Acquired/(divested), net - (41) 103 275 337 Sold (2) (10) (7) (14) (33) Organic, net 16 135 125 222 498 % G
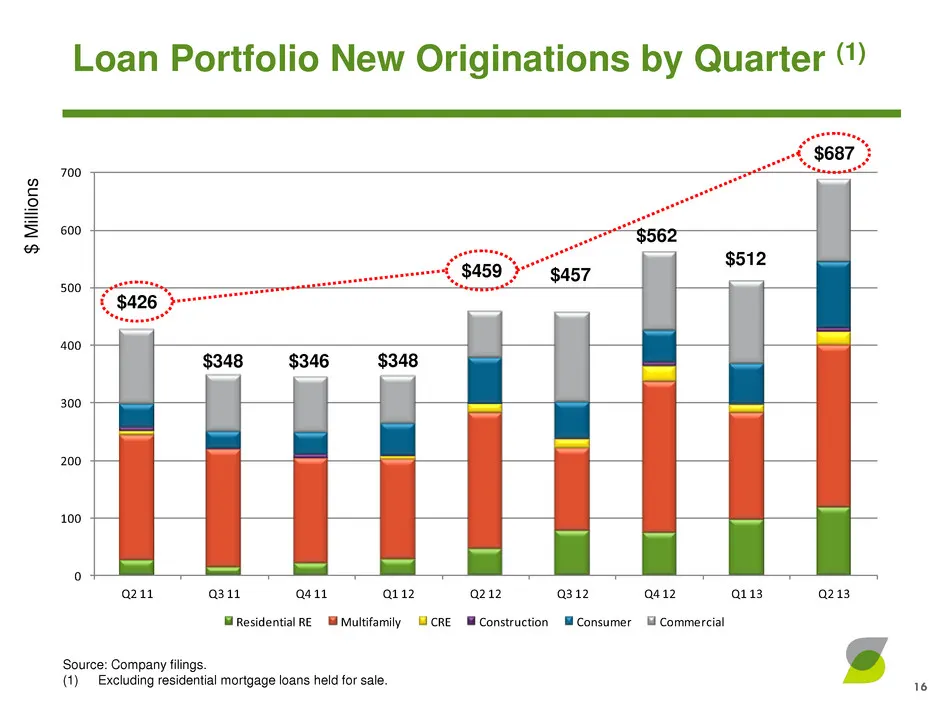
Slide 16: Loan Portfolio New Originations by Quarter
0 100 200 300 400 500 600 700 Q2 11 Q3 11 Q4 11 Q1 12 Q2 12 Q3 12 Q4 12 Q1 13 Q2 13 Residential RE Multifamily CRE Construction Consumer Commercial 16 $348 $346 $348 $426 Source: Company filings. (1) Excluding residential mortgage loans held for sale. Loan Portfolio New Originations by Quarter (1) $
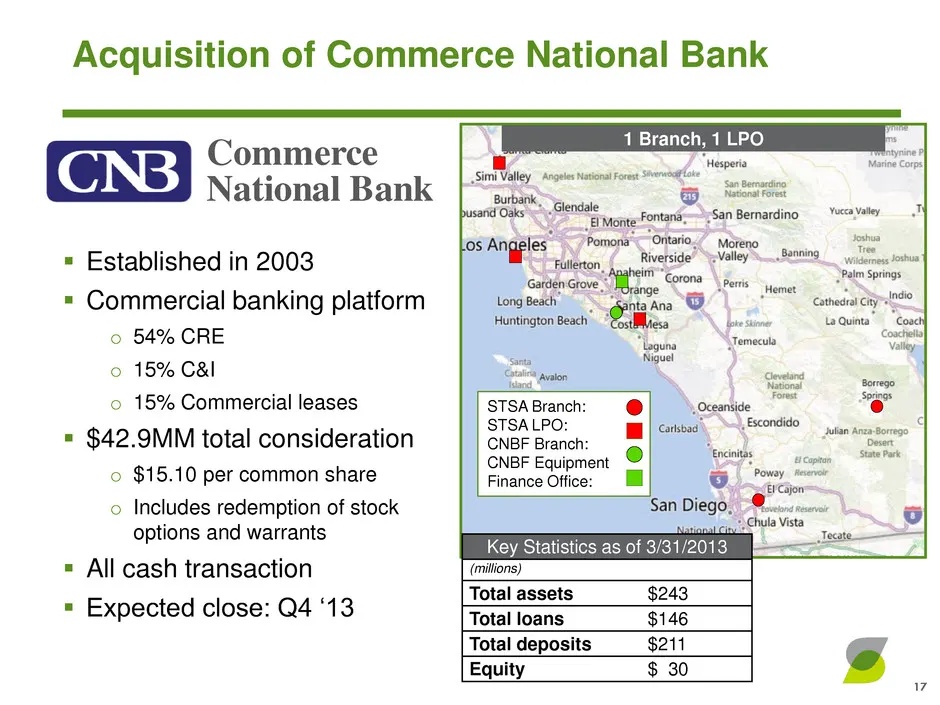
Slide 17: Acquisition of Commerce National Bank
Key Statistics as of 3/31/2013 (millions) Total assets $243 Total loans $146 Total deposits $211 Equity $ 30 Acquisition of Commerce National Bank 17 Established in 2003 Commercial banking platform o 54% CRE o 15% C&I o 15% Commercial leases $42.9MM total consideration o $15.10 per common shar
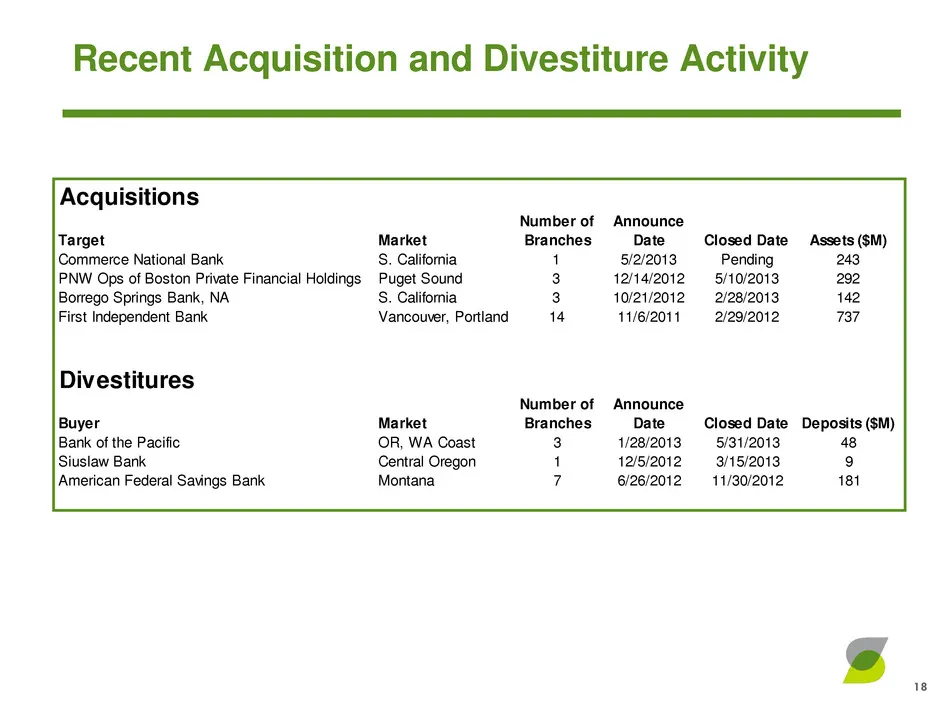
Slide 18: Recent Acquisition and Divestiture Activity
Acquisitions Target Market Number of Branches Announce Date Closed Date Assets ($M) Commerce National Bank S. California 1 5/2/2013 Pending 243 PNW Ops of Boston Private Financial Holdings Puget Sound 3 12/14/2012 5/10/2013 292 Borrego Springs Bank, NA S. California 3 10/21/2012 2/28/2013 142 First
Slide 19: Appendix
STERLING” FINANCIAL CORPORATION APPENDIX
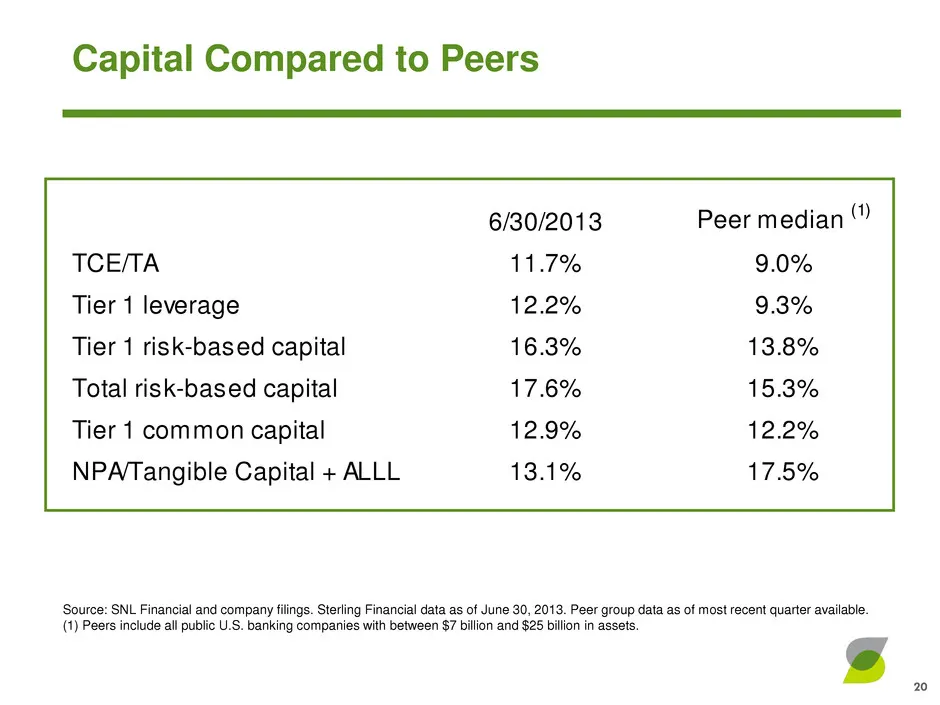
Slide 20: Capital Compared to Peers
6/30/2013 Peer median (1) TCE/TA 11.7% 9.0% Tier 1 leverage 12.2% 9.3% Tier 1 risk-based capital 16.3% 13.8% Total risk-based capital 17.6% 15.3% Tier 1 common capital 12.9% 12.2% NPA/Tangible Capital + ALLL 13.1% 17.5% Capital Compared to Peers Source: SNL Financial and company filings. Sterling Fi
Slide 21: Balance Sheet and Operating Highlights
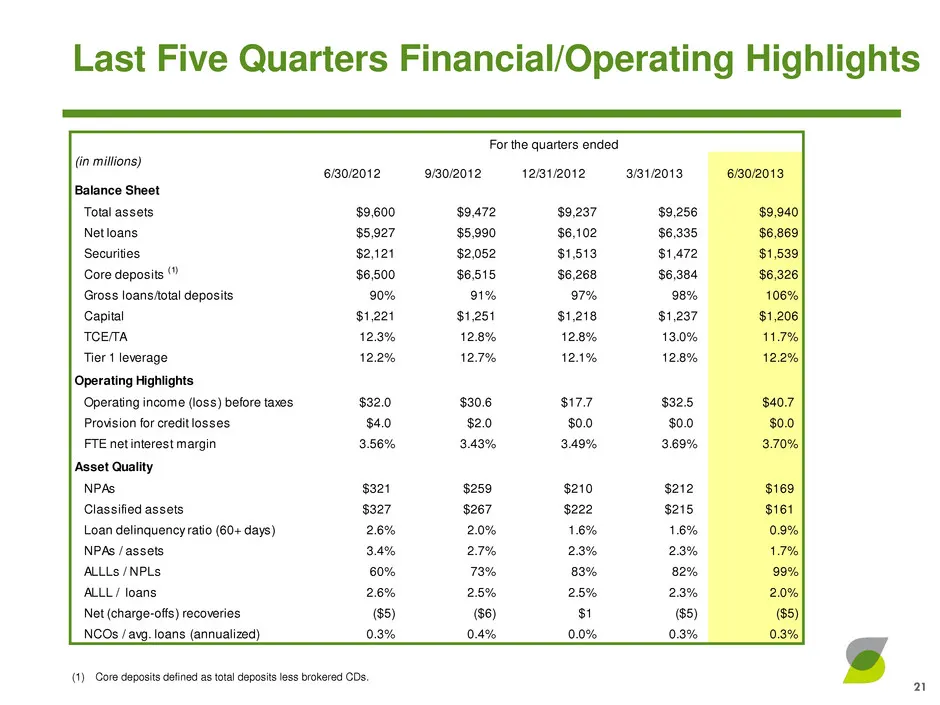
For the quarters ended (in millions) 6/30/2012 9/30/2012 12/31/2012 3/31/2013 6/30/2013 Balance Sheet Total assets $9,600 $9,472 $9,237 $9,256 $9,940 Net loans $5,927 $5,990 $6,102 $6,335 $6,869 Securities $2,121 $2,052 $1,513 $1,472 $1,539 Core deposits (1) $6,500 $6,515 $6,268 $6,384 $6,326 Gross
Slide 22: Investment Portfolio Overview
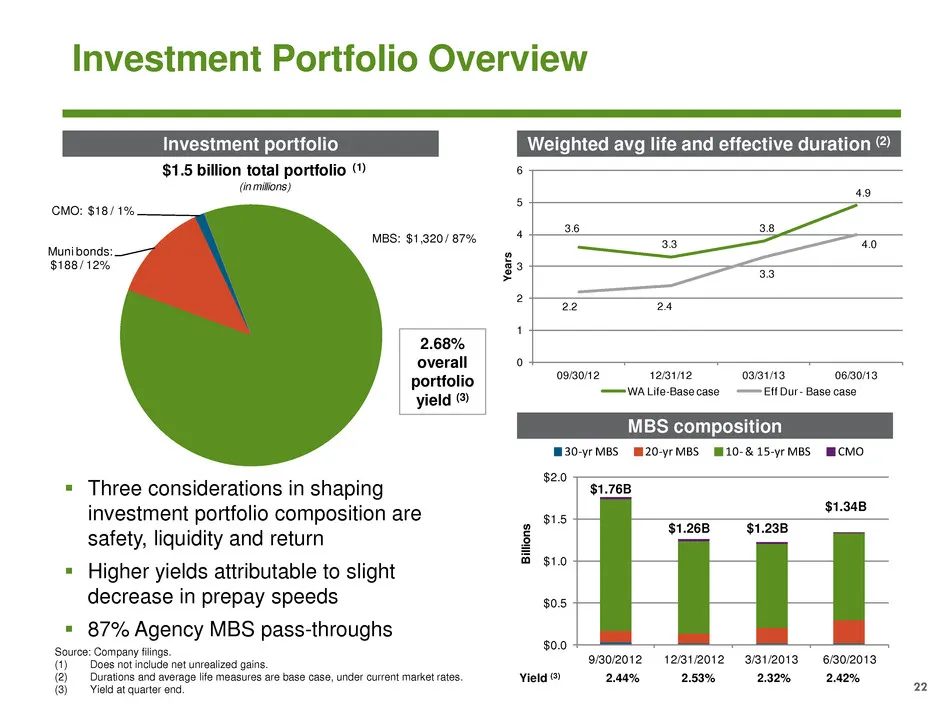
$0.0 $0.5 $1.0 $1.5 $2.0 9/30/2012 12/31/2012 3/31/2013 6/30/2013 Bi llio ns 30-yr MBS 20-yr MBS 10- & 15-yr MBS CMO 3.6 3.3 3.8 4.9 2.2 2.4 3.3 4.0 0 1 2 3 4 5 6 09/30/12 12/31/12 03/31/13 06/30/13 Ye ar s WA Life-Base case Eff Dur - Base case MBS: $1,320 / 87% Muni bonds: $188 / 12% CMO: $18 / 1%
Slide 23: Loan Portfolio – CRE Non-Owner-Occupied
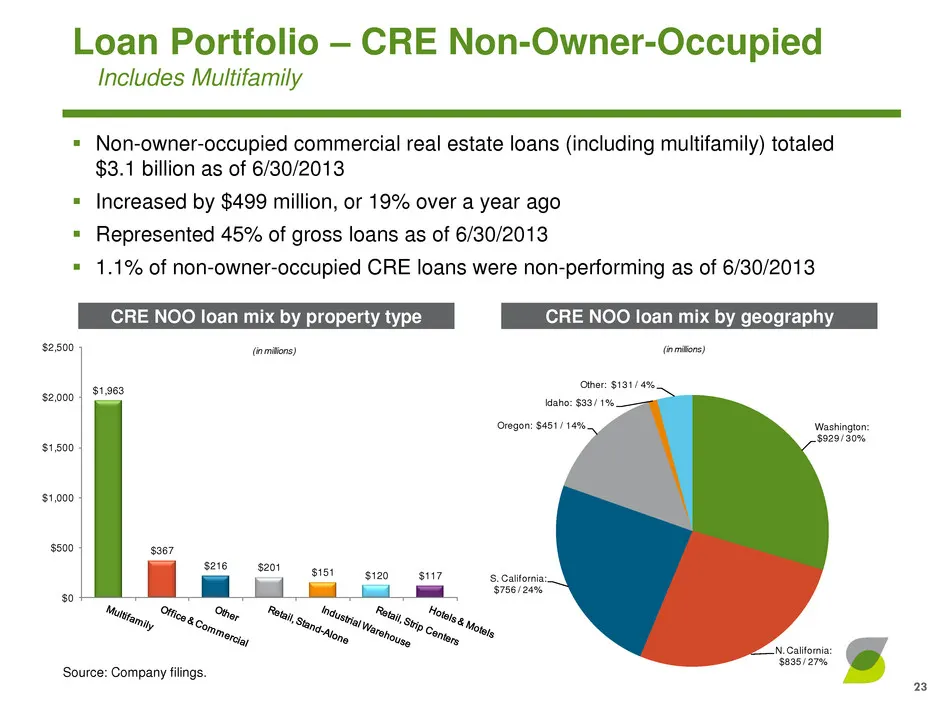
Washington: $929 / 30% N. California: $835 / 27% S. California: $756 / 24% Oregon: $451 / 14% Idaho: $33 / 1% Other: $131 / 4% (in millions) $1,963 $367 $216 $201 $151 $120 $117 $0 $500 $1,000 $1,500 $2,000 $2,500 (in millions) Loan Portfolio – CRE Non-Owner-Occupied Includes Multifamily Non-owner
Slide 24: Loan Portfolio – CRE Owner-Occupied
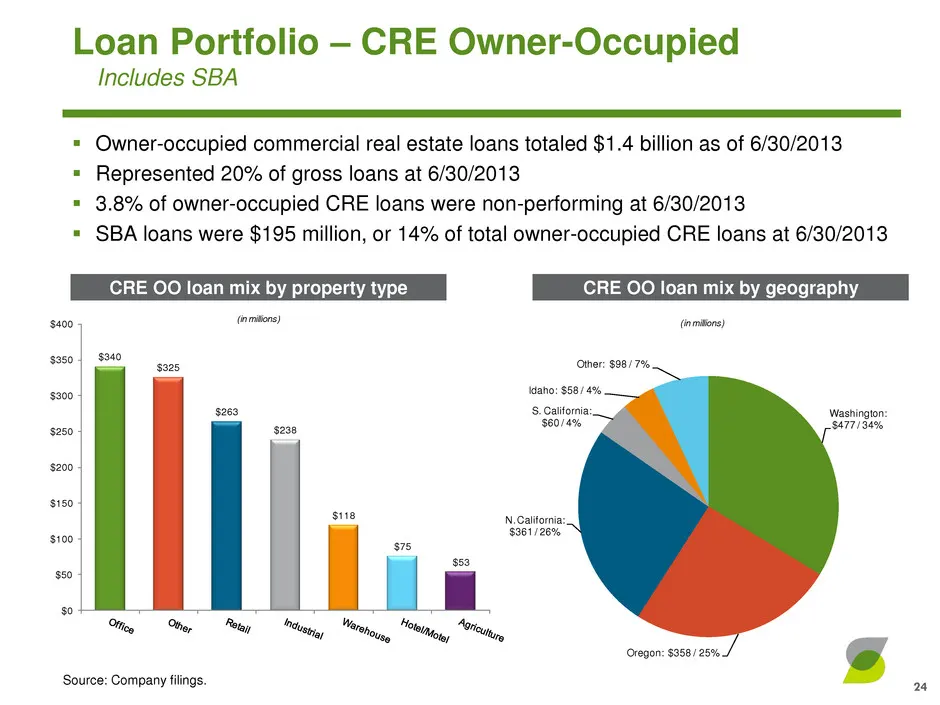
Washington: $477 / 34% Oregon: $358 / 25% N. California: $361 / 26% S. California: $60 / 4% Idaho: $58 / 4% Other: $98 / 7% (in millions)$340 $325 $263 $238 $118 $75 $53 $0 $50 $100 $150 $200 $250 $300 $350 $400 (in millions) Loan Portfolio – CRE Owner-Occupied Includes SBA Owner-occupied commerci
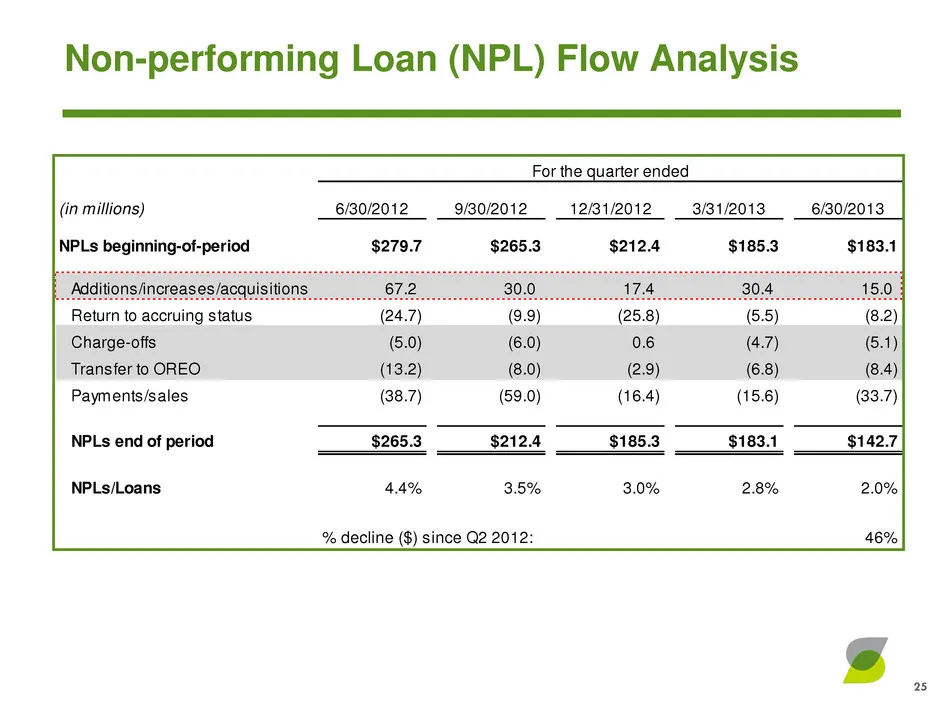
Slide 25: Non-performing Loan Flow Analysis
(in millions) 6/30/2012 9/30/2012 12/31/2012 3/31/2013 6/30/2013 NPLs beginning-of-period $279.7 $265.3 $212.4 $185.3 $183.1 Additions/increases/acquisitions 67.2 30.0 17.4 30.4 15.0 Return to accruing status (24.7) (9.9) (25.8) (5.5) (8.2) Charge-offs (5.0) (6.0) 0.6 (4.7) (5.1) Transfer to OREO (1
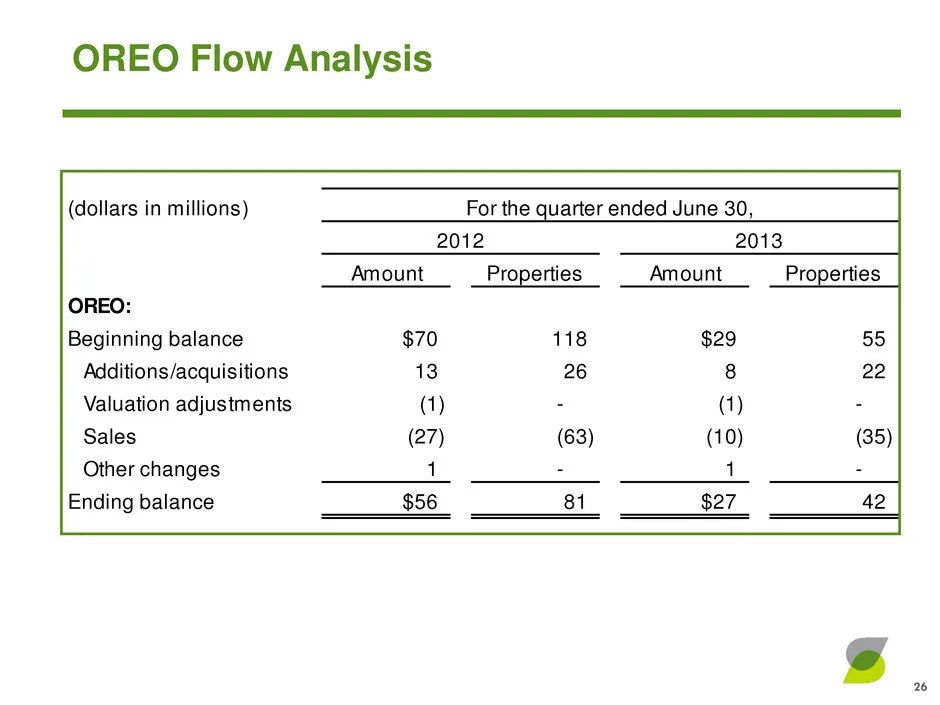
Slide 26: OREO Flow Analysis
(dollars in millions) Amount Properties Amount Properties OREO: Beginning balance $70 118 $29 55 Additions/acquisitions 13 26 8 22 Valuation adjustments (1) - (1) - Sales (27) (63) (10) (35) Other changes 1 - 1 - Ending balance $56 81 $27 42 2012 2013 For the quarter ended June 30, OREO Flow Analysi
Slide 27: Investor and Media Contact
NASDAQ Ticker: STSA Spokane, Washington www.sterlingfinancialcorporation.com Investor Contact Media Contact Patrick Rusnak Cara Coon Chief Financial Officer VP/Communications and Public Affairs Director (509) 227-0961 (509) 626-5348 patrick.rusnak@bankwithsterling.com cara.coon@bankwithsterling.com
Source: SEC EDGAR · 8-K filed Jul 30, 2013
More decks from Sterling Financial Corp
 Q3 2013 Earnings Presentation6 slides · Oct 24, 2013
 Merger or Acquisition (September 2013)20 slides · Sep 12, 2013
 Merger or Acquisition (September 2013)20 slides · Sep 12, 2013
 Q2 2013 Earnings Presentation8 slides · Jul 25, 2013
 Q1 2013 Earnings Presentation30 slides · May 7, 2013
 Q1 2013 Earnings Presentation6 slides · Apr 24, 2013