STORE Capital — Q1 2017 Earnings Presentation
20 slides from STORE Capital's earnings presentation, May 4, 2017
Slide 1: About STORE Capital
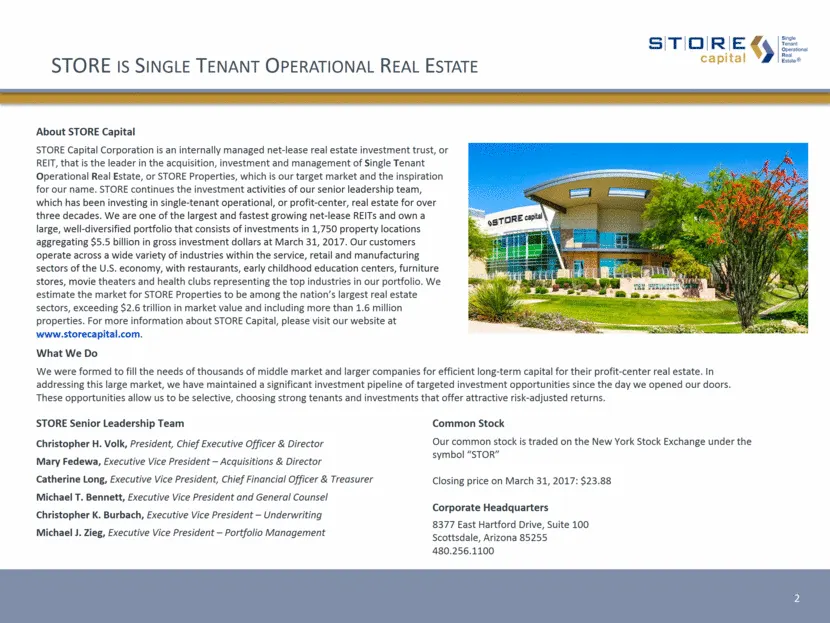
STORE is Single Tenant Operational Real Estate About STORE Capital STORE Capital Corporation is an internally managed net-lease real estate investment trust, or REIT, that is the leader in the acquisition, investment and management of Single Tenant Operational Real Estate, or STORE Properties, which
Slide 2: STORE is a Growth REIT addressing a Large Market
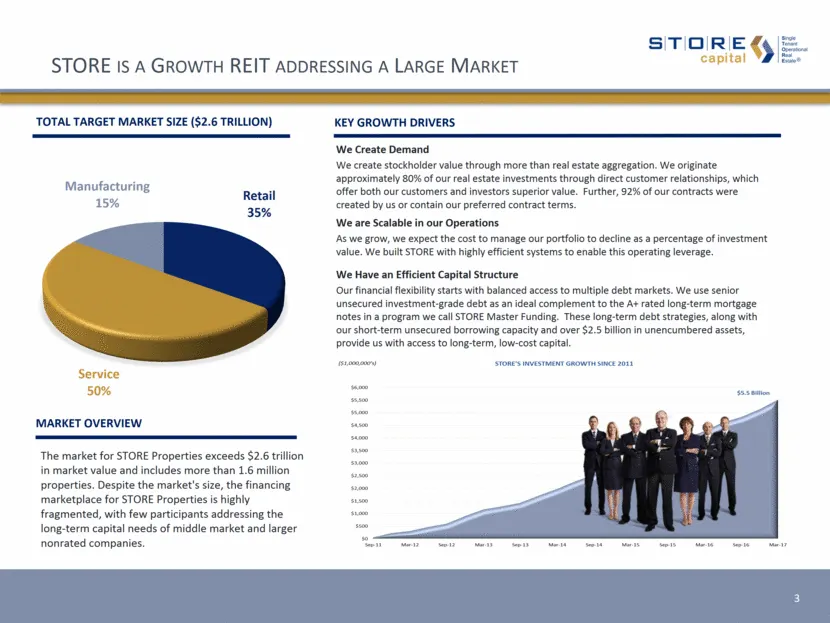
STORE is a Growth REIT addressing a Large Market TOTAL TARGET MARKET SIZE ($2.6 TRILLION) KEY GROWTH DRIVERS We Create Demand We create stockholder value through more than real estate aggregation. We originate approximately 80% of our real estate investments through direct customer relationships, wh
Slide 3: Condensed Consolidated Statements of Income
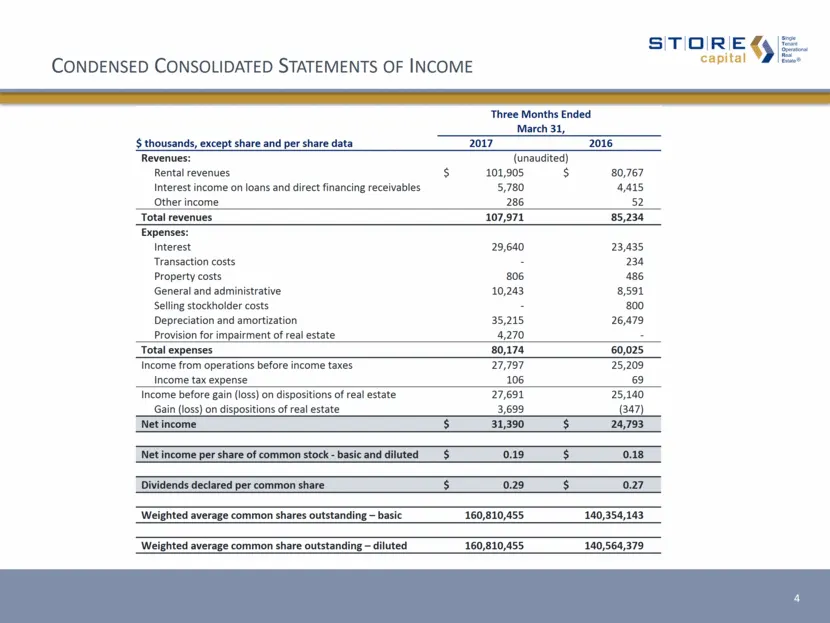
Condensed Consolidated Statements of Income 4 Three Months Ended March 31, $ thousands, except share and per share data 2017 2016 Revenues: (unaudited) Rental revenues $ 101,905 $ 80,767 Interest income on loans and direct financing receivables 5,780 4,415 Other income 286 52 Total revenues 107,971
Slide 4: Funds From Operations and Adjusted Funds from Operations
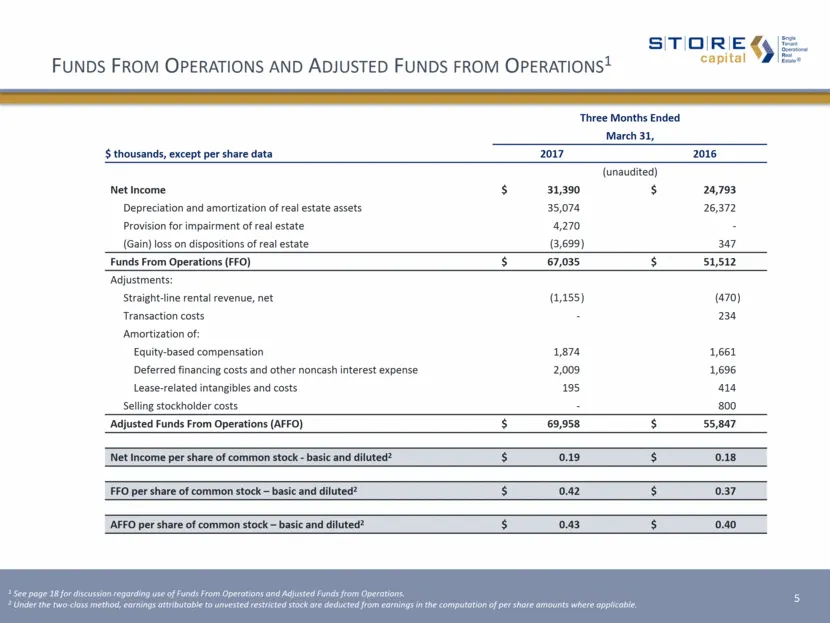
Funds From Operations and Adjusted Funds from Operations1 Three Months Ended March 31, $ thousands, except per share data 2017 2016 (unaudited) Net Income $ 31,390 $ 24,793 Depreciation and amortization of real estate assets 35,074 26,372 Provision for impairment of real estate 4,270 - (Gain) loss o
Slide 5: Condensed Consolidated Balance Sheets
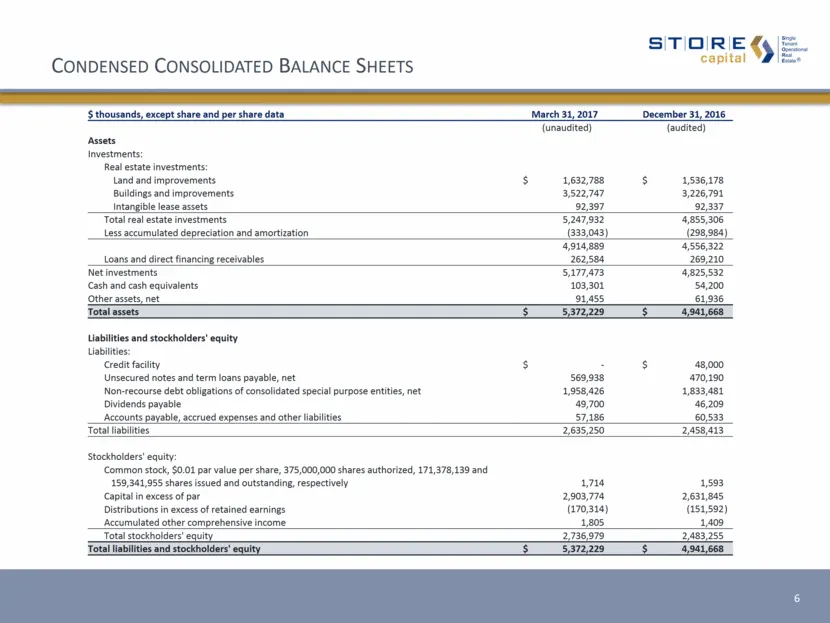
Condensed Consolidated Balance Sheets $ thousands, except share and per share data March 31, 2017 December 31, 2016 (unaudited) (audited) Assets Investments: Real estate investments: Land and improvements $ 1,632,788 $ 1,536,178 Buildings and improvements 3,522,747 3,226,791 Intangible lease assets
Slide 6: Adjusted Debt to Adjusted EBITDA
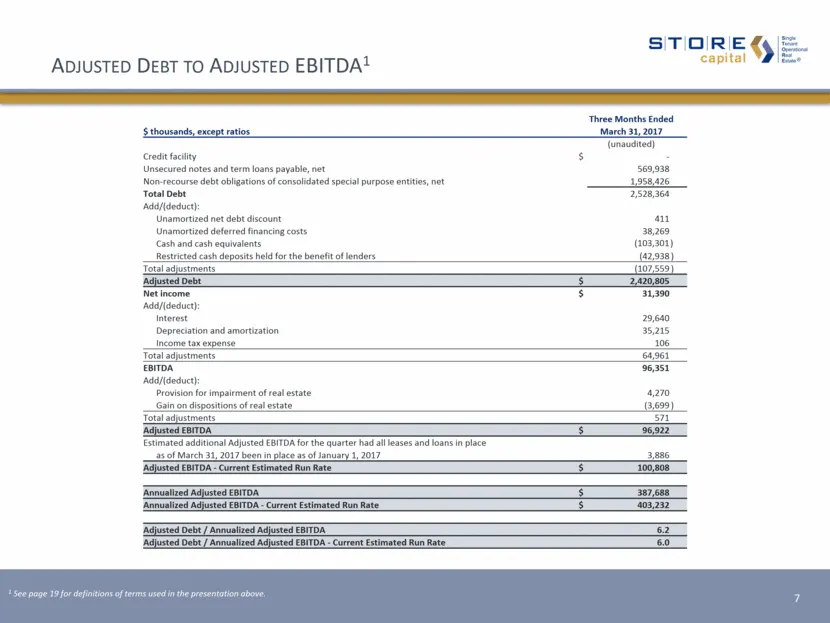
Adjusted Debt to Adjusted EBITDA1 Three Months Ended $ thousands, except ratios March 31, 2017 (unaudited) Credit facility $ - Unsecured notes and term loans payable, net 569,938 Non-recourse debt obligations of consolidated special purpose entities, net 1,958,426 Total Debt 2,528,364 Add/(deduct):
Slide 7: Debt Summary and Maturities
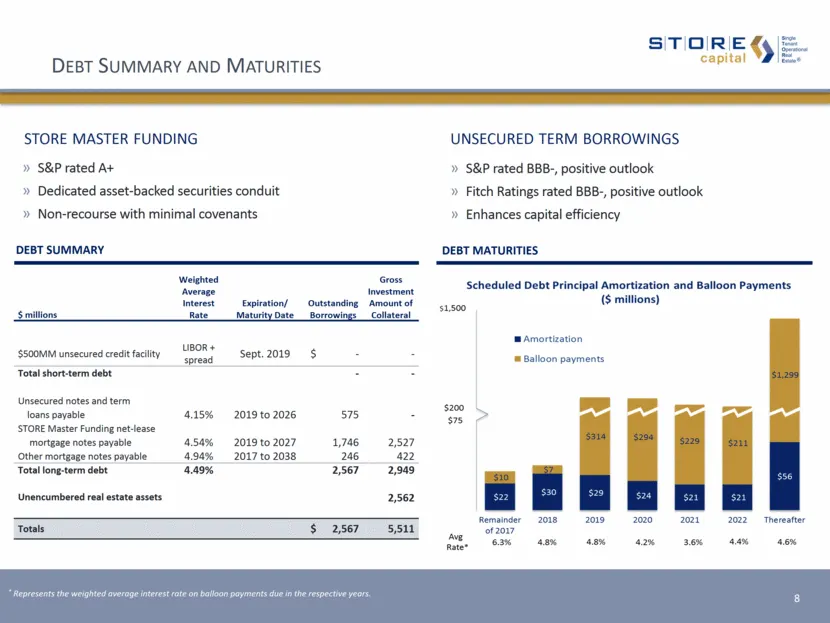
Debt Summary and Maturities 8 Debt summary $ millions Weighted Average Interest Rate Expiration/ Maturity Date Outstanding Borrowings Gross Investment Amount of Collateral $500MM unsecured credit facility LIBOR + spread Sept. 2019 $ - - Total short-term debt - - Unsecured notes and term loans payabl
Slide 8: Portfolio at a Glance
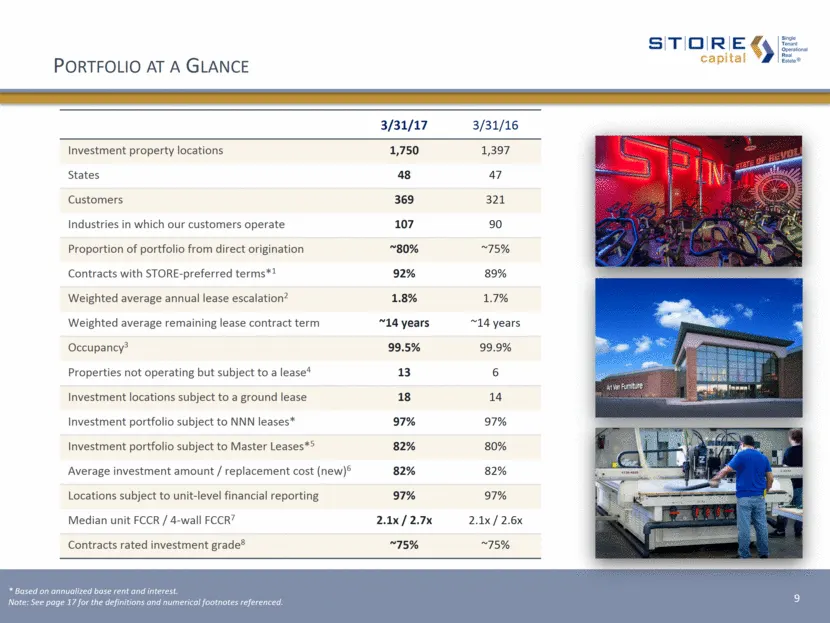
* Based on annualized base rent and interest. Note: See page 17 for the definitions and numerical footnotes referenced. Portfolio at a Glance 3/31/17 3/31/16 Investment property locations 1,750 1,397 States 48 47 Customers 369 321 Industries in which our customers operate 107 90 Proportion of portfo
Slide 9: Portfolio Contract Quality
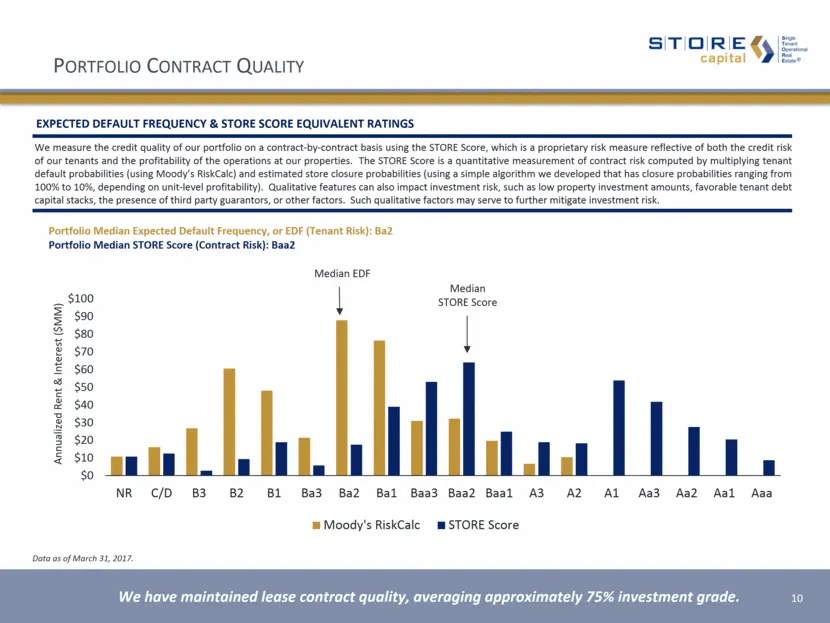
Portfolio Contract Quality Expected default frequency & STORE score equivalent Ratings We measure the credit quality of our portfolio on a contract-by-contract basis using the STORE Score, which is a proprietary risk measure reflective of both the credit risk of our tenants and the profitability of
Slide 10: Diversification Across Customers and Concepts
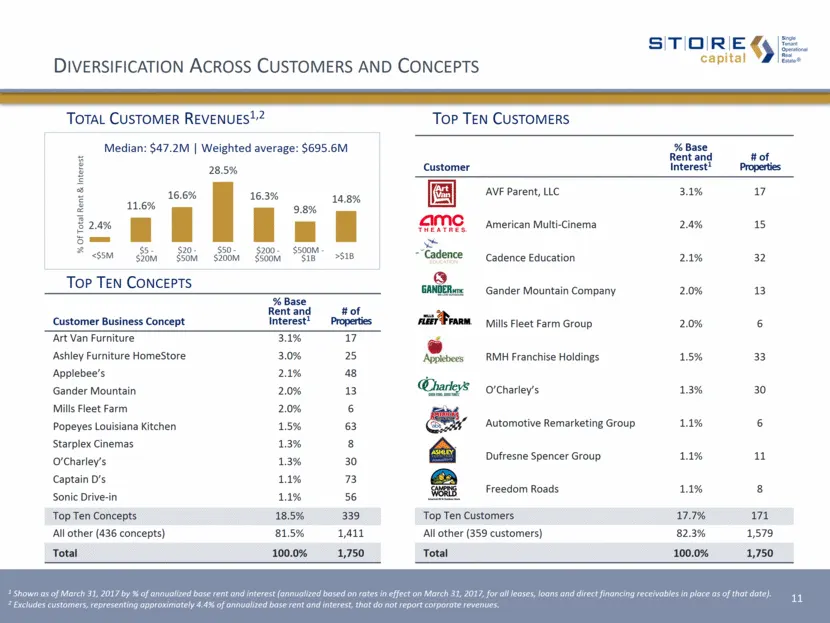
Diversification Across Customers and Concepts Total Customer Revenues1,2 Top Ten Concepts Customer Business Concept % Base Rent and Interest1 # of Properties Art Van Furniture 3.1% 17 Ashley Furniture HomeStore 3.0% 25 Applebee’s 2.1% 48 Gander Mountain 2.0% 13 Mills Fleet Farm 2.0% 6 Popeyes Louisi
Slide 11: Diversification Across Industries
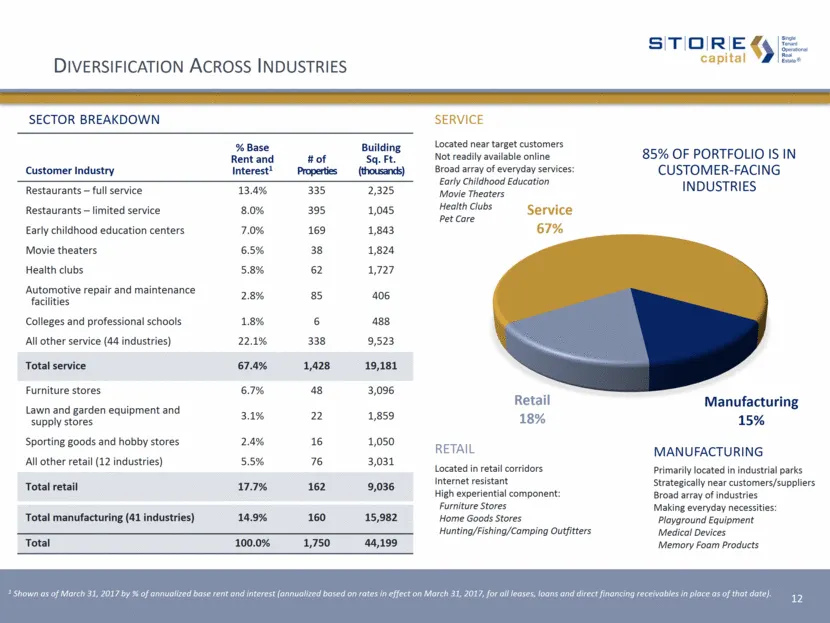
Diversification Across Industries 12 1 Shown as of March 31, 2017 by % of annualized base rent and interest (annualized based on rates in effect on March 31, 2017, for all leases, loans and direct financing receivables in place as of that date). sector breakdown Customer Industry % Base Rent and Int
Slide 12: Diversification Across Geographies
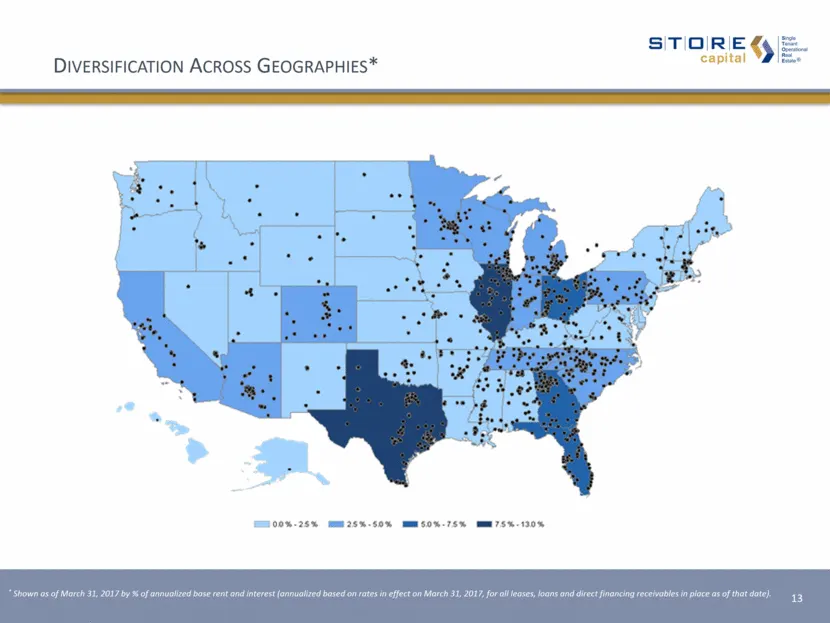
Diversification Across Geographies* 13 * Shown as of March 31, 2017 by % of annualized base rent and interest (annualized based on rates in effect on March 31, 2017, for all leases, loans and direct financing receivables in place as of that date).
Slide 13: Contract Expirations and Occupancy
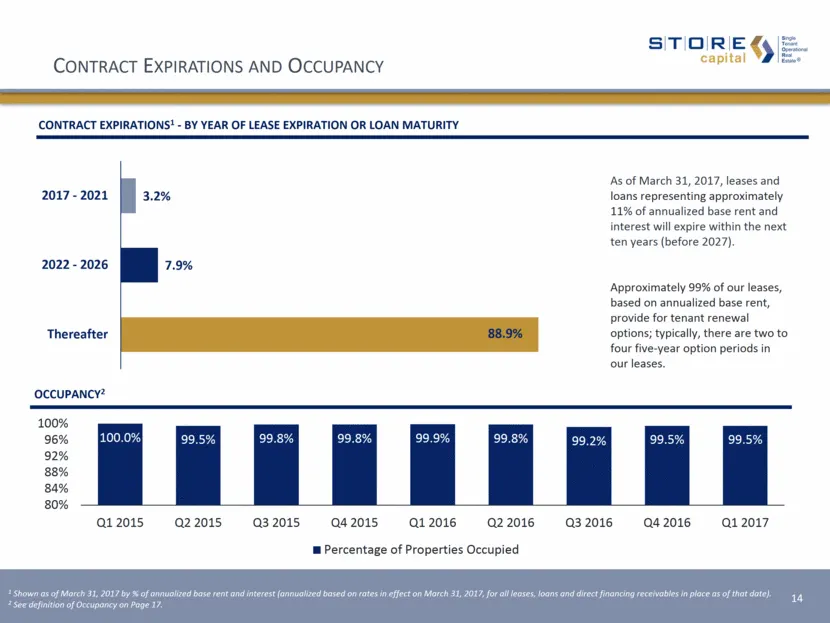
Contract Expirations and Occupancy CONTRACT EXPIRATIONS1 - by year of lease expiration or loan maturity As of March 31, 2017, leases and loans representing approximately 11% of annualized base rent and interest will expire within the next ten years (before 2027). Approximately 99% of our leases, bas
Slide 14: Rent Escalations
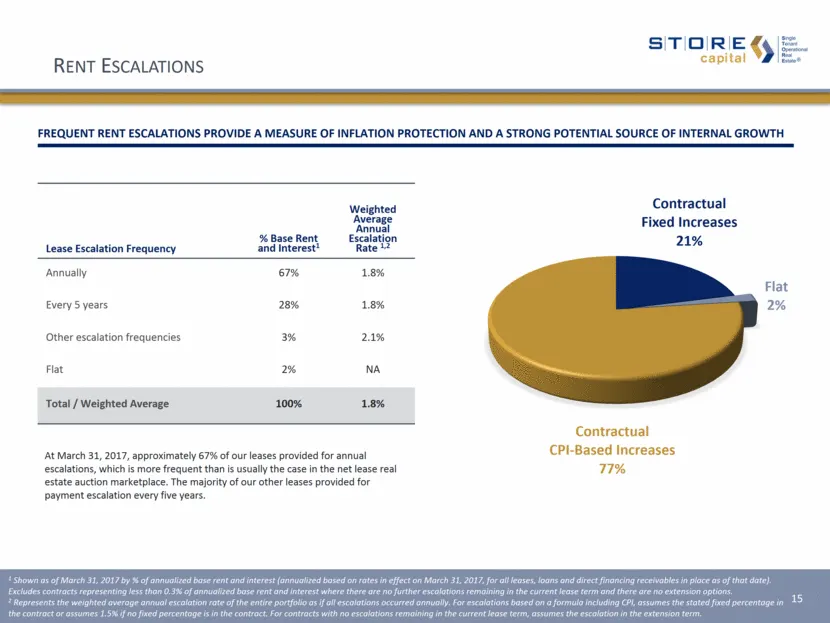
Rent Escalations FREQUENT RENT ESCALATIONS PROVIDE A MEASURE OF INFLATION PROTECTION AND A STRONG POTENTIAL SOURCE OF INTERNAL GROWTH Lease Escalation Frequency % Base Rent and Interest1 Weighted Average Annual Escalation Rate 1,2 Annually 67% 1.8% Every 5 years 28% 1.8% Other escalation frequencies
Slide 15: 2017 Guidance
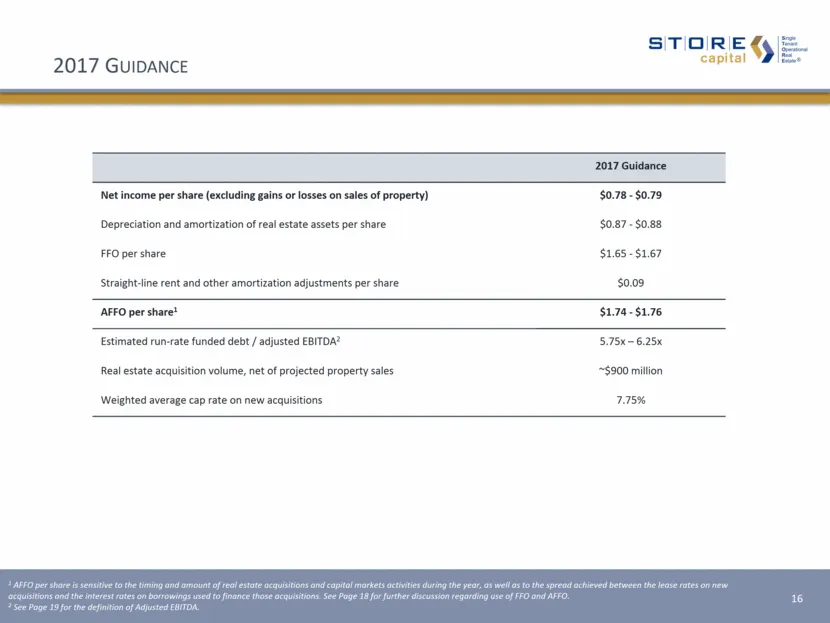
2017 Guidance 2017 Guidance Net income per share (excluding gains or losses on sales of property) $0.78 - $0.79 Depreciation and amortization of real estate assets per share $0.87 - $0.88 FFO per share $1.65 - $1.67 Straight-line rent and other amortization adjustments per share $0.09 AFFO per share
Slide 16: Definitions and Footnotes
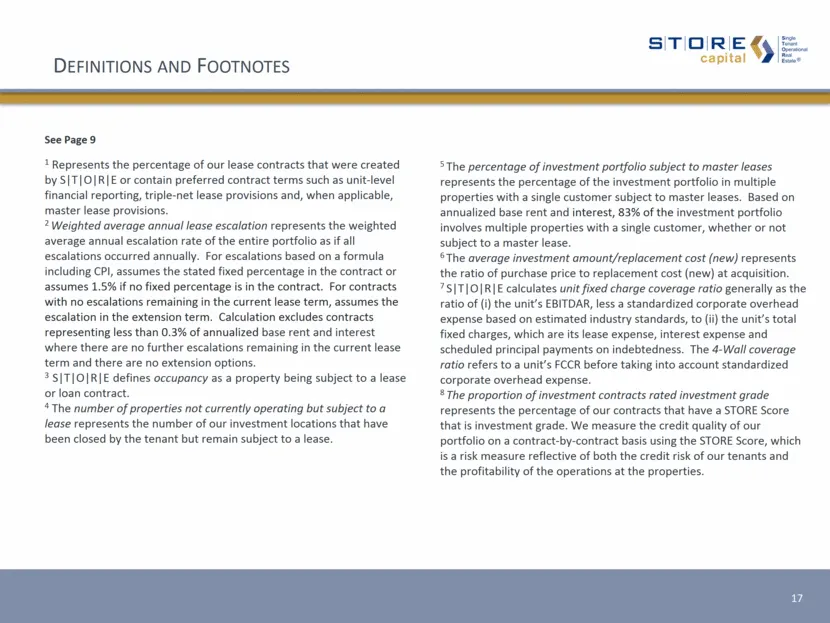
Definitions and Footnotes 17 See Page 9 1 Represents the percentage of our lease contracts that were created by S T O R E or contain preferred contract terms such as unit-level financial reporting, triple-net lease provisions and, when applicable, master lease provisions. 2 Weighted average annual l
Slide 17: Supplemental Reporting Measures
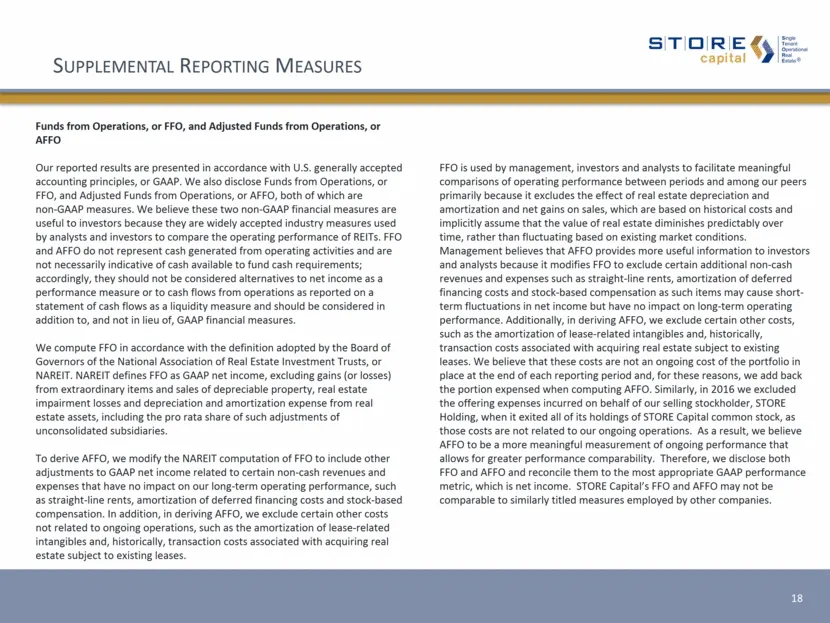
Supplemental Reporting Measures Funds from Operations, or FFO, and Adjusted Funds from Operations, or AFFO Our reported results are presented in accordance with U.S. generally accepted accounting principles, or GAAP. We also disclose Funds from Operations, or FFO, and Adjusted Funds from Operations,
Slide 18: Supplemental Reporting Measures
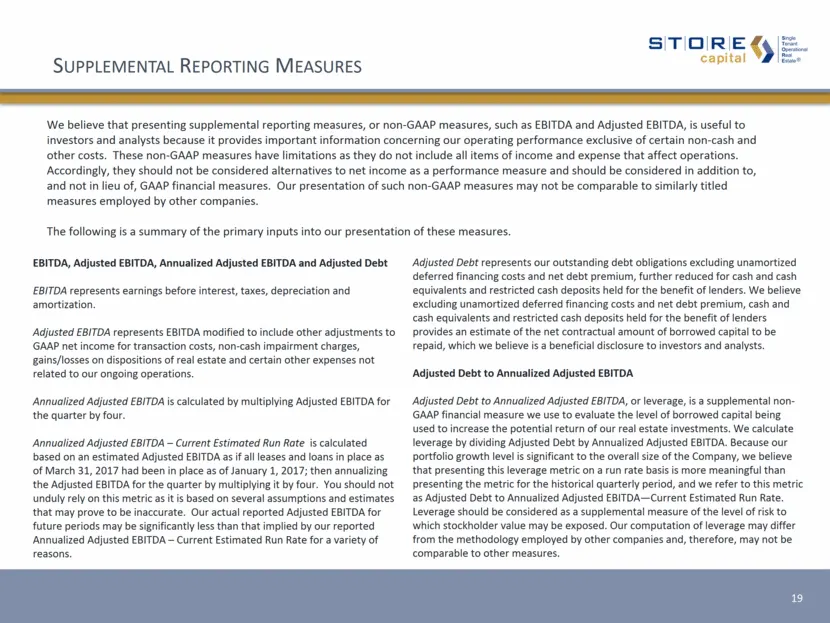
Supplemental Reporting Measures We believe that presenting supplemental reporting measures, or non-GAAP measures, such as EBITDA and Adjusted EBITDA, is useful to investors and analysts because it provides important information concerning our operating performance exclusive of certain non-cash and o
Slide 19: Forward-Looking Statements
20 Forward-Looking Statements Certain statements contained in this document that are not historical facts contain forward-looking statements within the meaning of Section 27A of the Securities Act of 1933, as amended, and within the meaning of Section 21E of the Securities Exchange Act of 1934, as a
Slide 20: Forward-Looking Statements
STORE =. FORWARD-LOOKING STATEMENTS. capital WIE Forward-Looking Statements Certain statements contained in this document that are not torical facts contain forward-looking statements within the ‘meaning of Section 27A ofthe Securities Act of 1933, as ‘amended, and within the meaning of Section 21€
Source: SEC EDGAR · 8-K filed May 4, 2017
More decks from STORE Capital Corp
 Q2 2023 Earnings Presentation10 slides · Aug 4, 2023
 Q2 2022 Earnings Presentation26 slides · Aug 3, 2022
 Q2 2022 Earnings Presentation22 slides · Aug 3, 2022
 Q1 2022 Earnings Presentation26 slides · May 4, 2022
 Q1 2022 Earnings Presentation22 slides · May 4, 2022
 Q4 2021 Earnings Presentation33 slides · Feb 23, 2022