Oceanic Iron Ore Corp. · TSXV:FEO
Oceanic Iron Ore — Investor Presentation (January 2013)
41 slides from Oceanic Iron Ore's investor presentation, January 2013
Slide 1: Investor Presentation
n OCEANIC rRON -ORE CORP WWW.OCEANICIRONORE.COM TSX:V-FEO OTCQX - FEOVF Investor Presentation
Slide 2: Cautionary Notes
Cautionary Notes This presentation includes certain "Forward-Looking Statements” as that term is used in applicable securities law. All statements included herein, other than statements of historical fact, including, without limitation, statements regarding potential mineralization and resources, ex
Slide 3: Corporate Overview
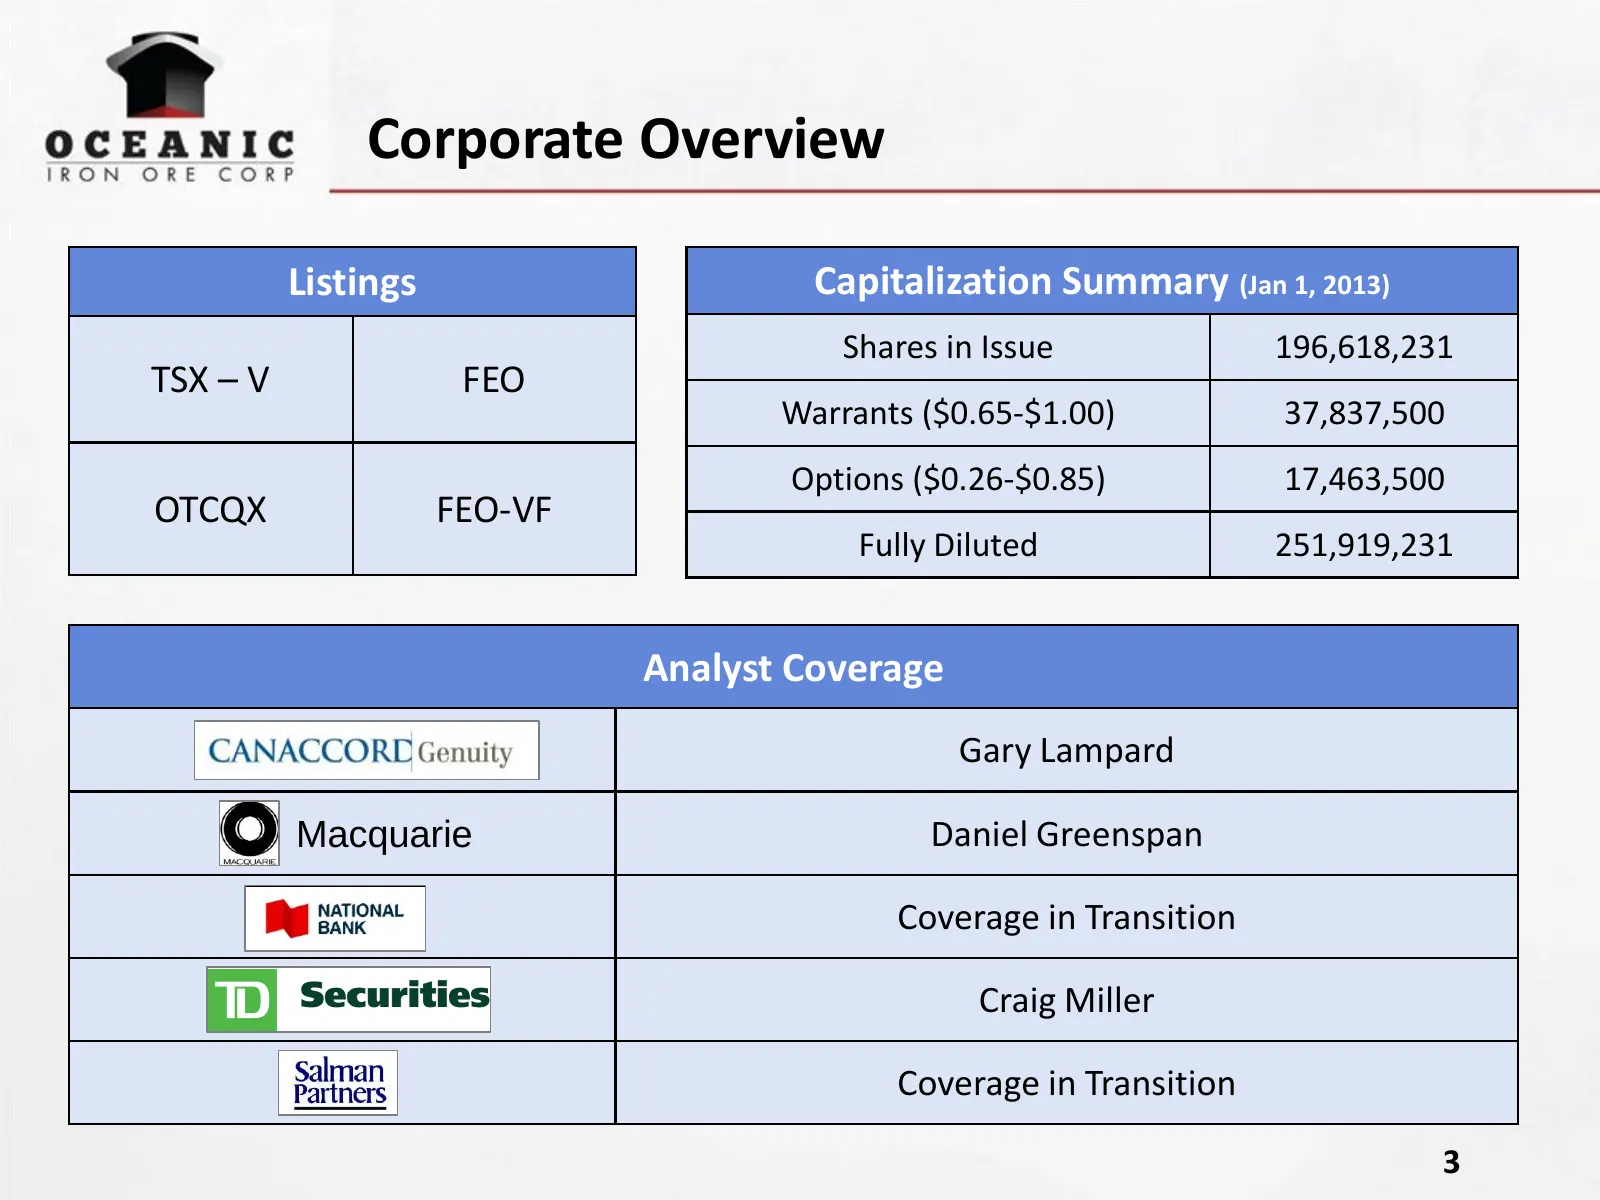
Corporate Overview Listings Capitalization Summary (Jan 1, 2013) Shares in Issue 196,618,231 TSX – V FEO Warrants ($0.65-$1.00) 37,837,500 Options ($0.26-$0.85) 17,463,500 OTCQX FEO-VF Fully Diluted 251,919,231 Analyst Coverage Gary Lampard Macquarie Daniel Greenspan Coverage in Transition Craig Mil
Slide 4: Company Overview
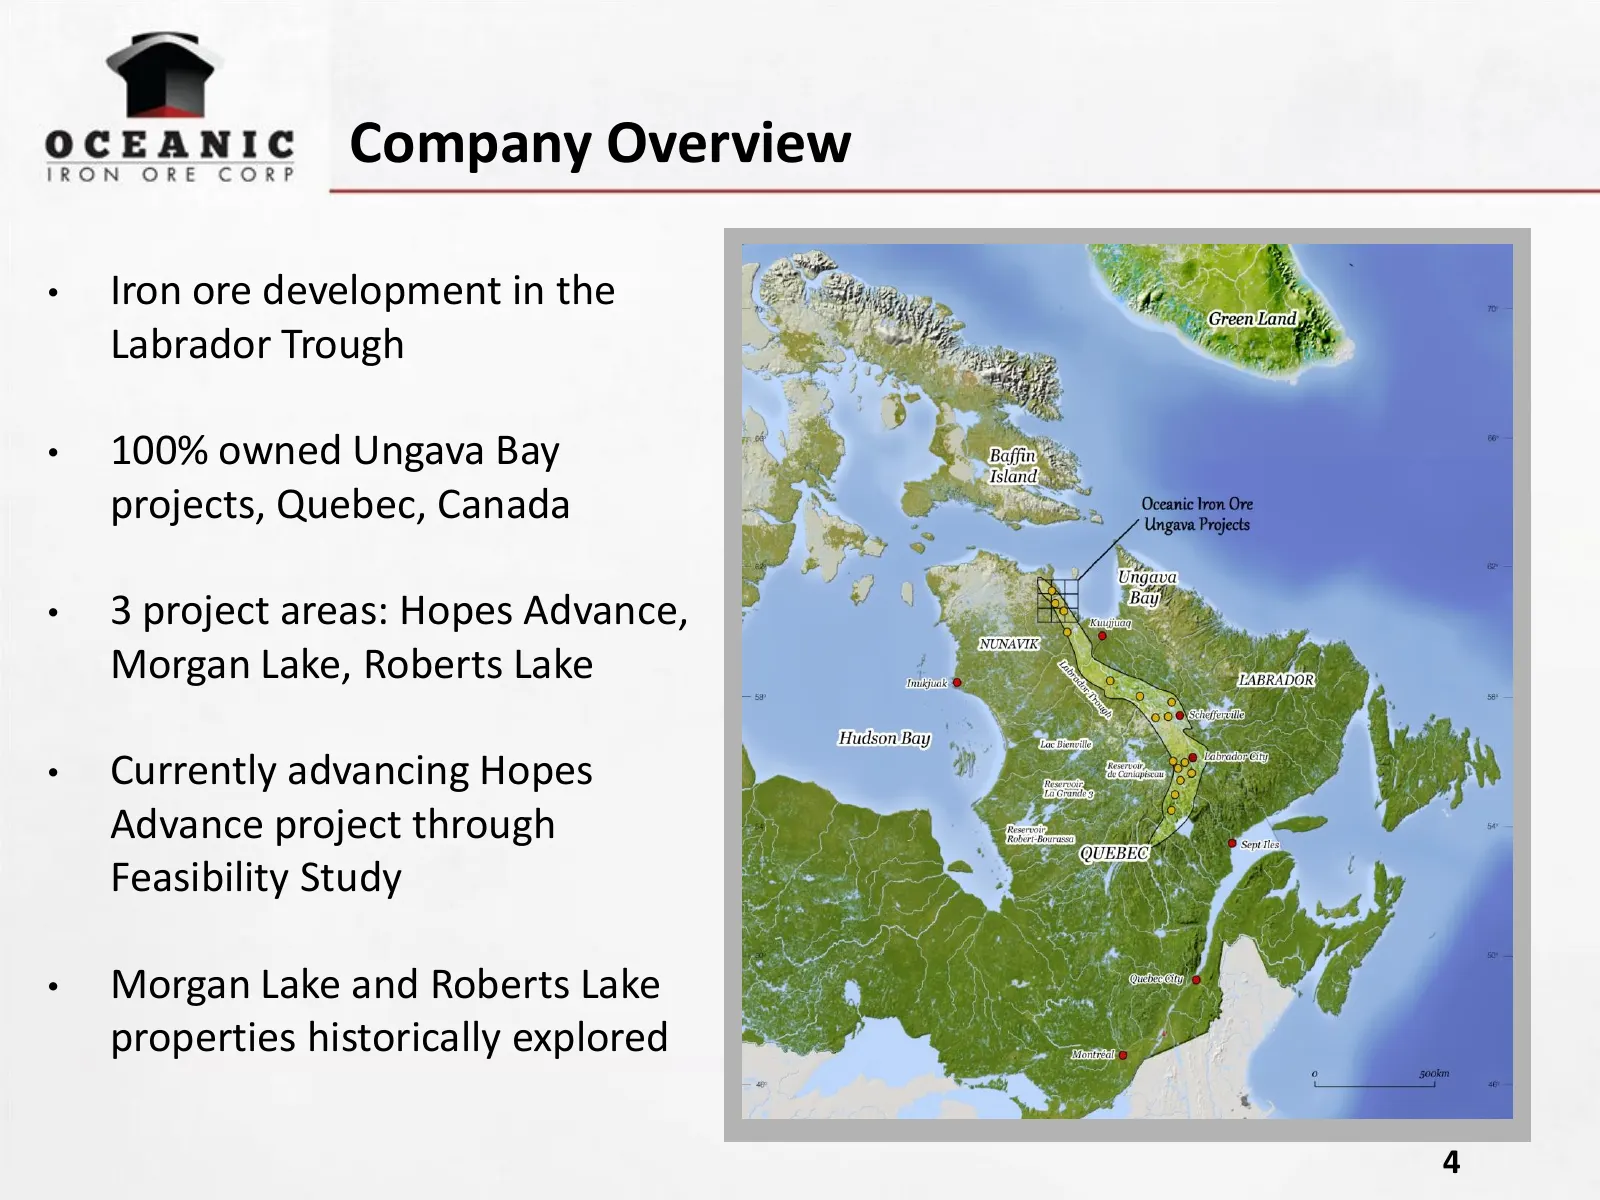
Company Overview • Iron ore development in the Labrador Trough • 100% owned Ungava Bay projects, Quebec, Canada • 3 project areas: Hopes Advance, Morgan Lake, Roberts Lake • Currently advancing Hopes Advance project through Feasibility Study • Morgan Lake and Roberts Lake properties historically exp
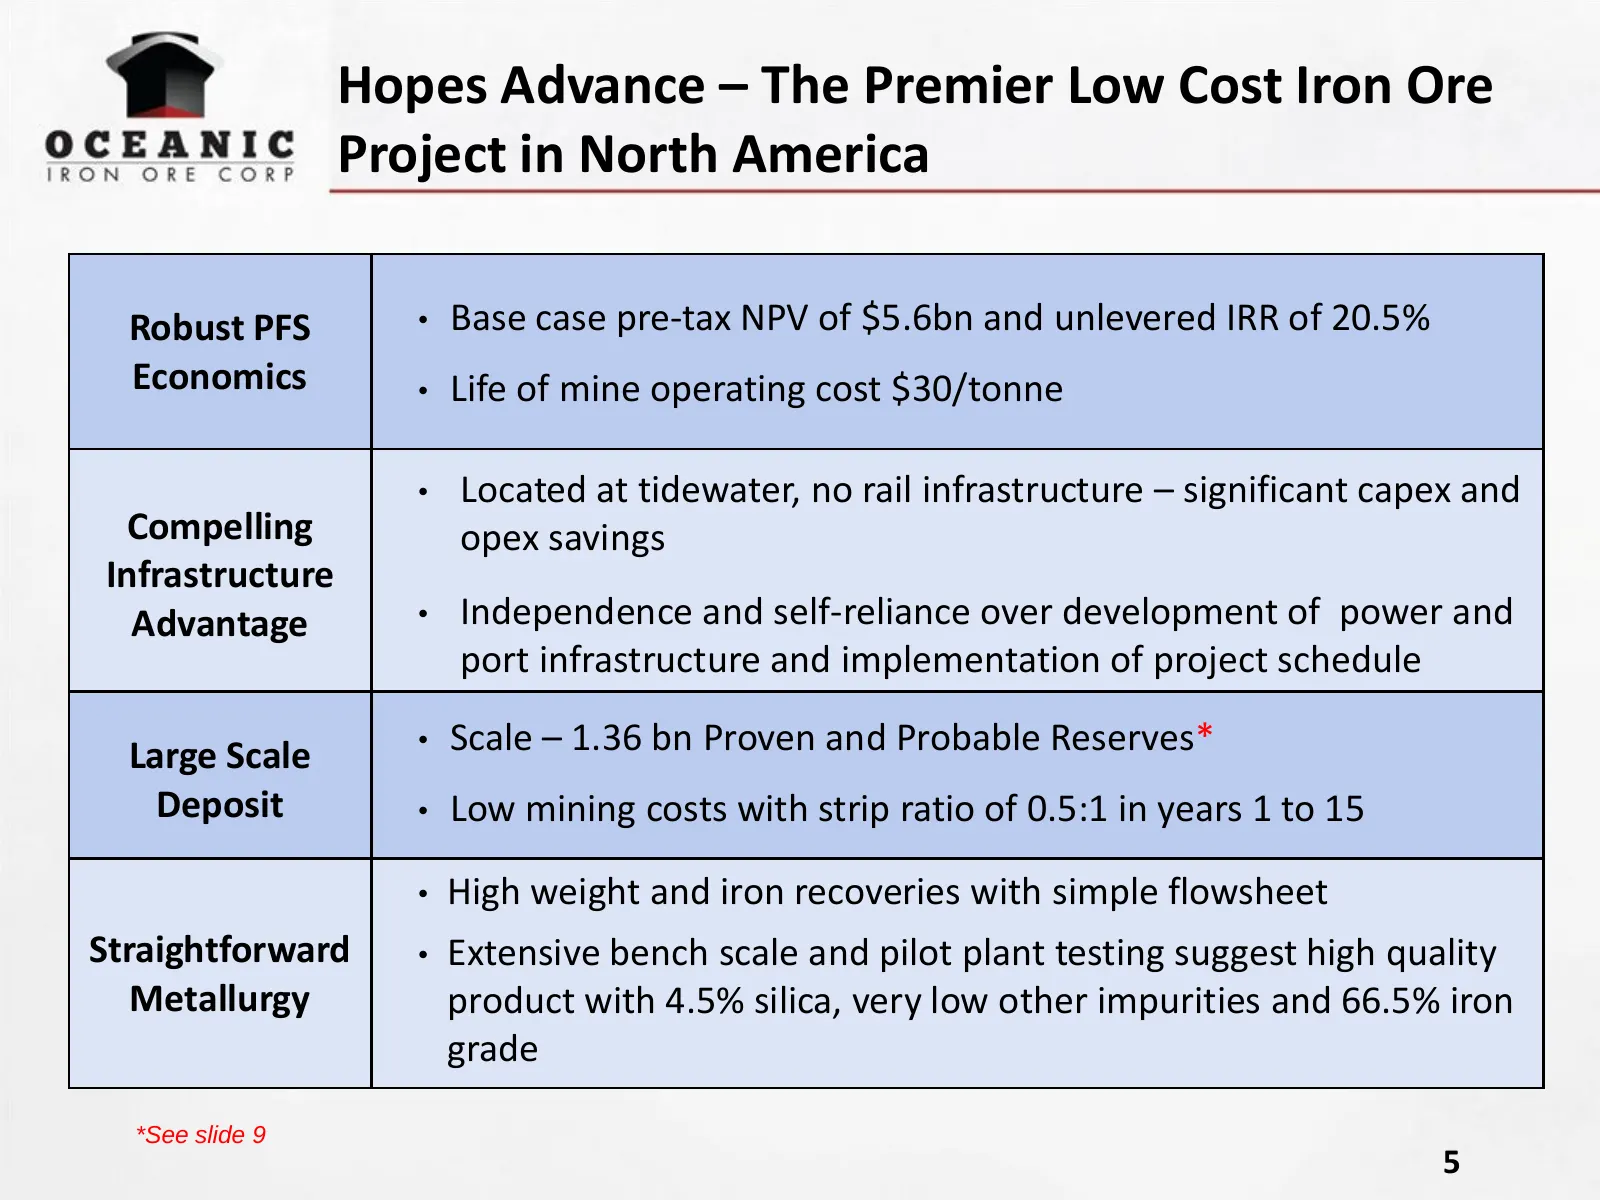
Slide 5: Hopes Advance – The Premier Low Cost Iron Ore Project in North America
Hopes Advance – The Premier Low Cost Iron Ore Project in North America Robust PFS • Base case pre-tax NPV of $5.6bn and unlevered IRR of 20.5% Economics • Life of mine operating cost $30/tonne • Located at tidewater, no rail infrastructure – significant capex and Compelling opex savings Infrastructu
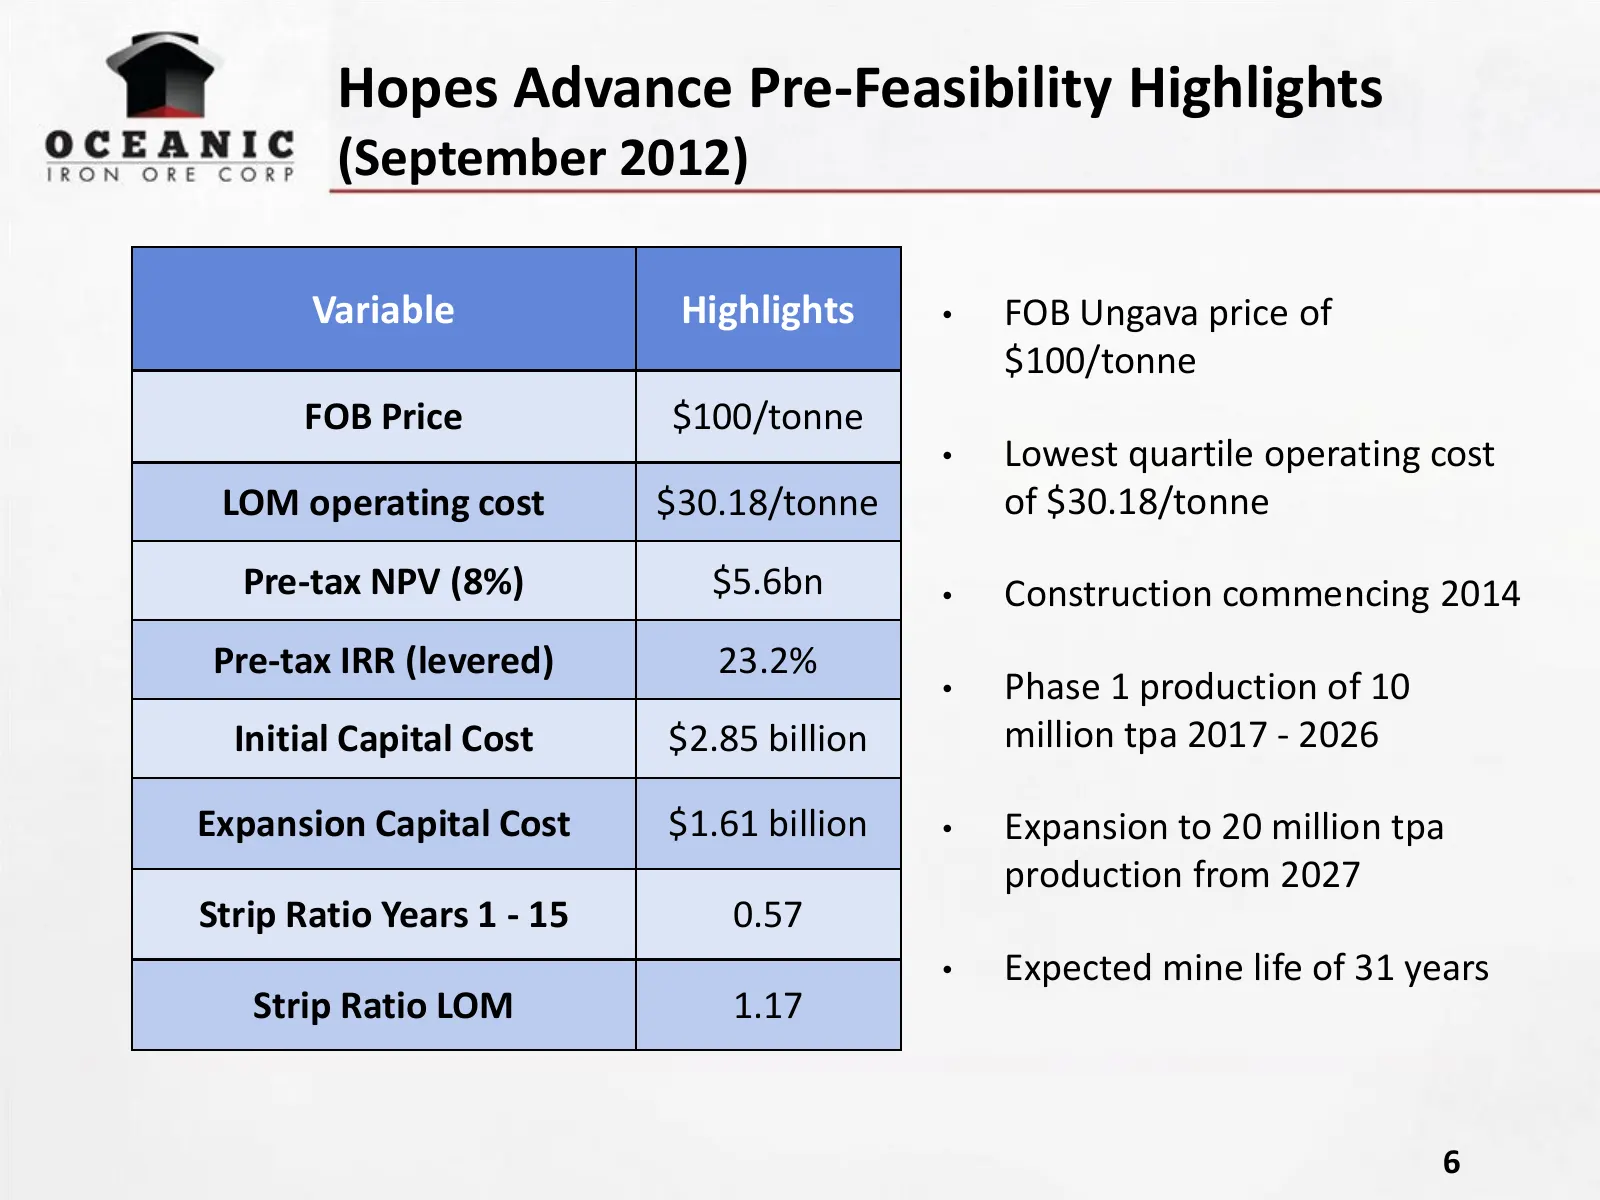
Slide 6: Hopes Advance Pre-Feasibility Highlights
Hopes Advance Pre-Feasibility Highlights (September 2012) Variable Highlights • FOB Ungava price of $100/tonne FOB Price $100/tonne • Lowest quartile operating cost LOM operating cost $30.18/tonne of $30.18/tonne Pre-tax NPV (8%) $5.6bn • Construction commencing 2014 Pre-tax IRR (levered) 23.2% • Ph
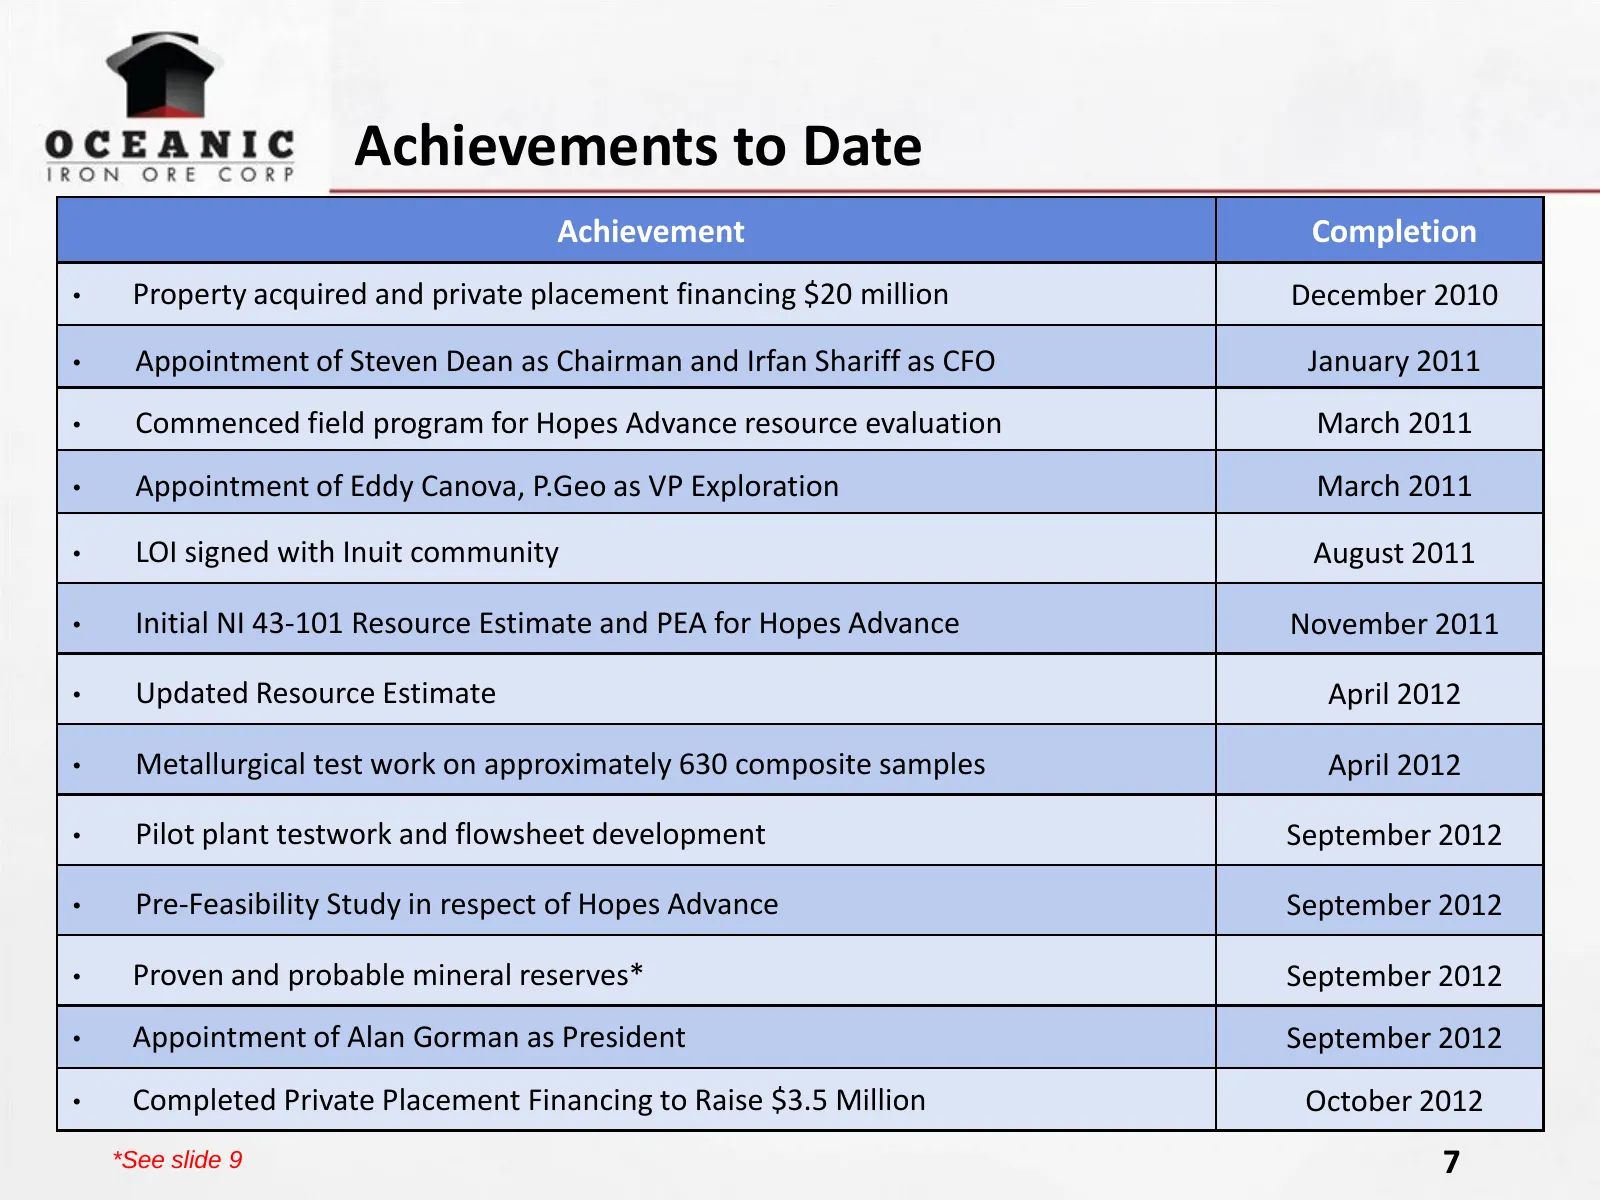
Slide 7: Achievements to Date
Achievements to Date Achievement Completion • Property acquired and private placement financing $20 million December 2010 • Appointment of Steven Dean as Chairman and Irfan Shariff as CFO January 2011 • Commenced field program for Hopes Advance resource evaluation March 2011 • Appointment of Eddy Ca
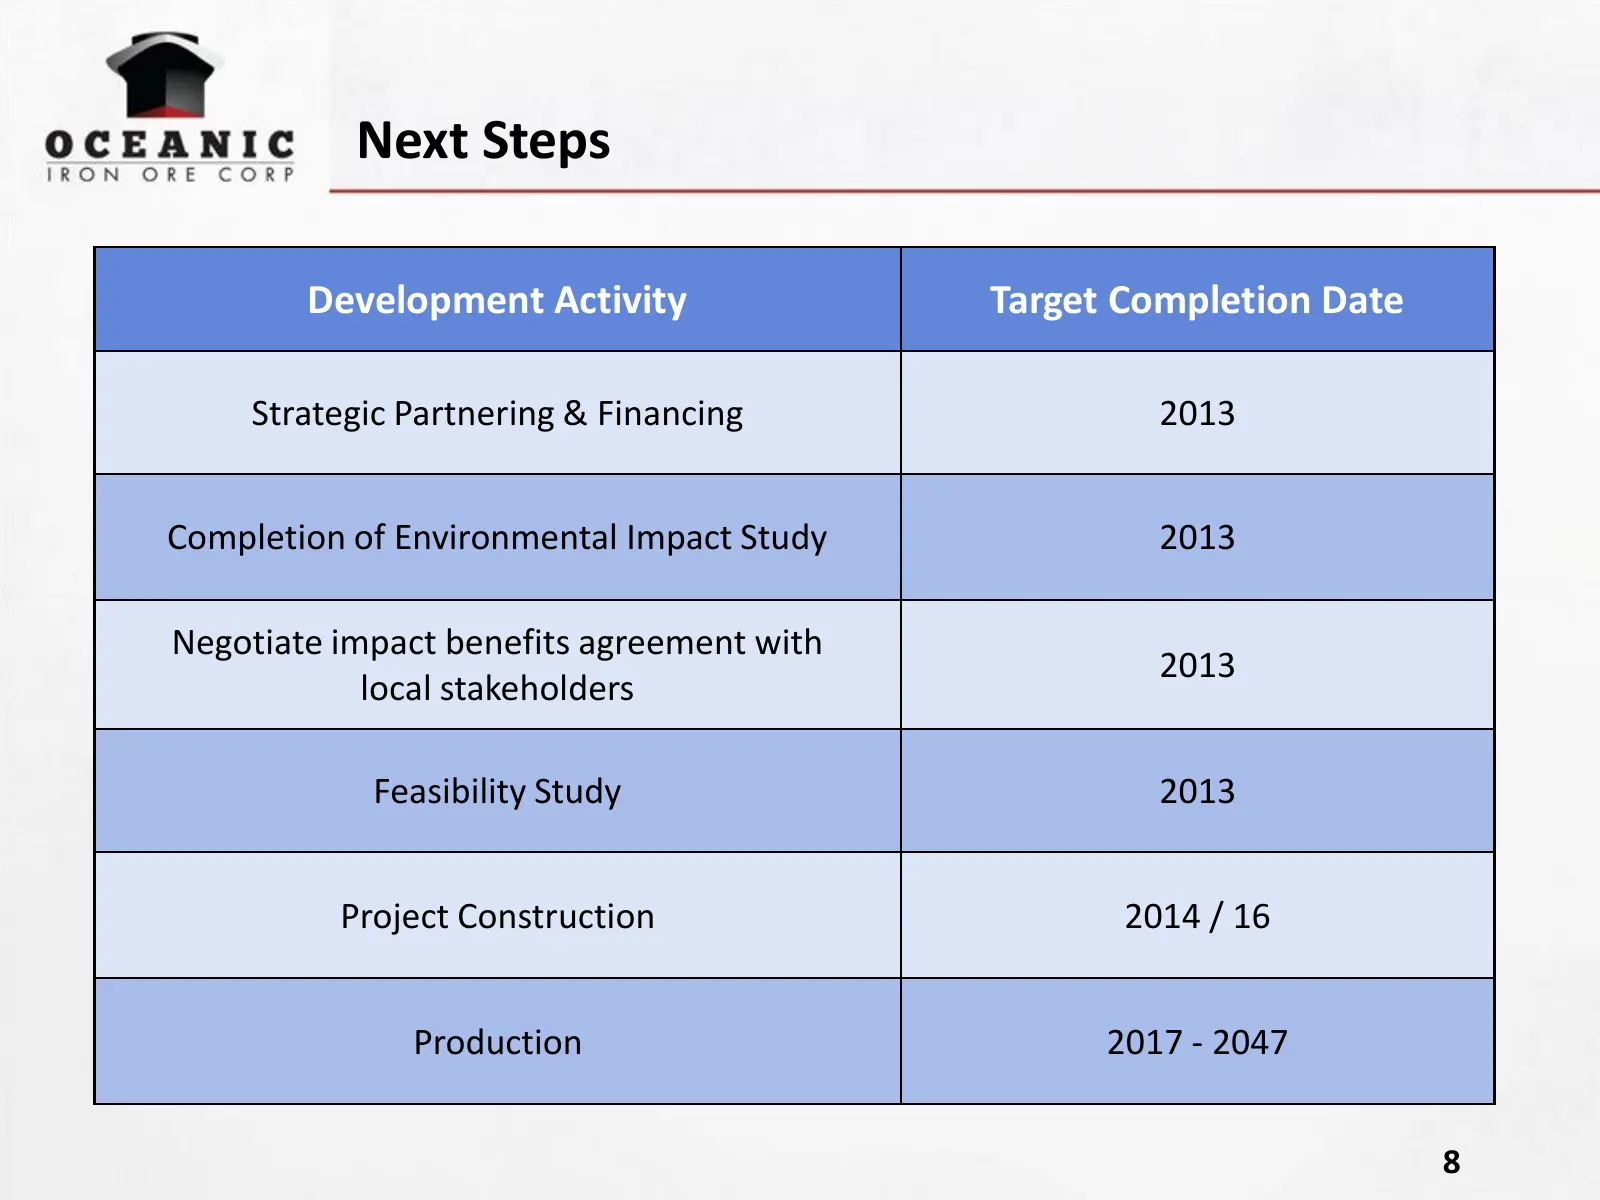
Slide 8: Next Steps
Next Steps Development Activity Target Completion Date Strategic Partnering & Financing 2013 Completion of Environmental Impact Study 2013 Negotiate impact benefits agreement with 2013 local stakeholders Feasibility Study 2013 Project Construction 2014 / 16 Production 2017 - 2047 8
Slide 9: Hopes Advance Mineral Reserve
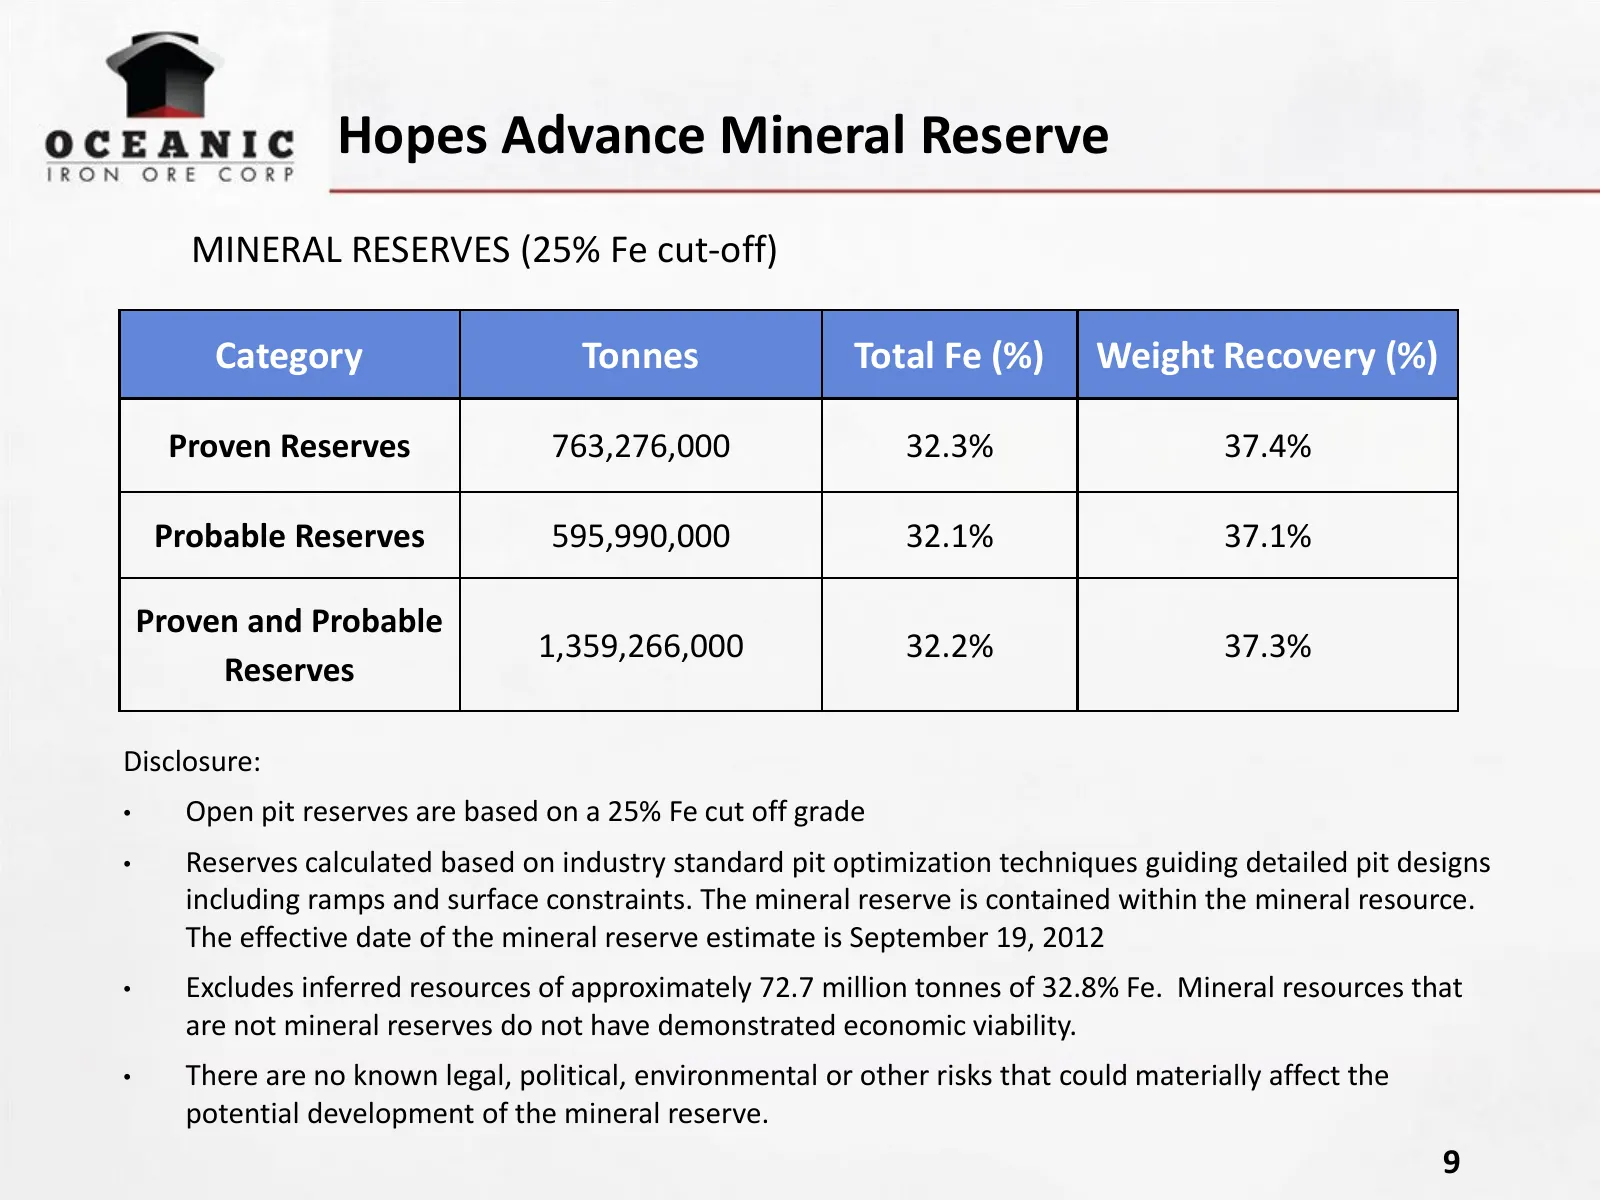
Hopes Advance Mineral Reserve MINERAL RESERVES (25% Fe cut-off) Category Tonnes Total Fe (%) Weight Recovery (%) Proven Reserves 763,276,000 32.3% 37.4% Probable Reserves 595,990,000 32.1% 37.1% Proven and Probable 1,359,266,000 32.2% 37.3% Reserves Disclosure: • Open pit reserves are based on a 25%
Slide 10: Hopes Advance Images
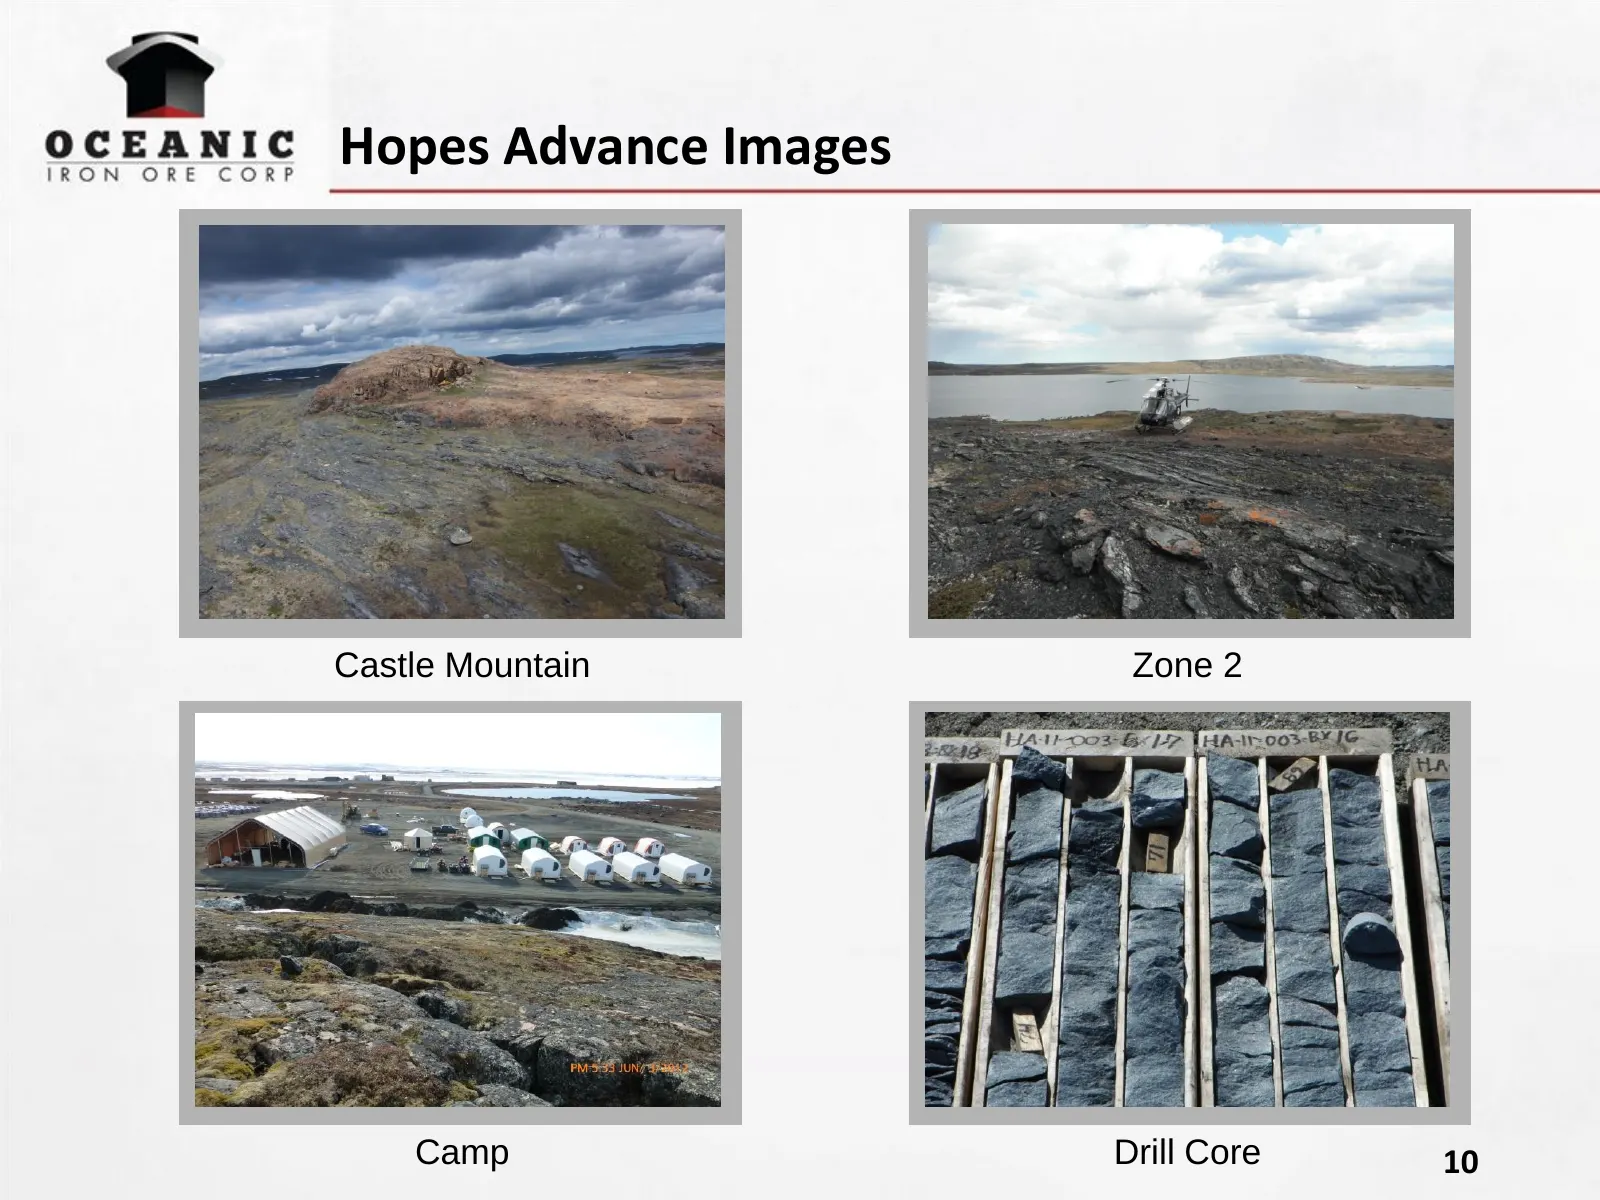
Hopes Advance Images Castle Mountain Zone 2 Camp Drill Core 10
Slide 11: Hopes Advance Metallurgy
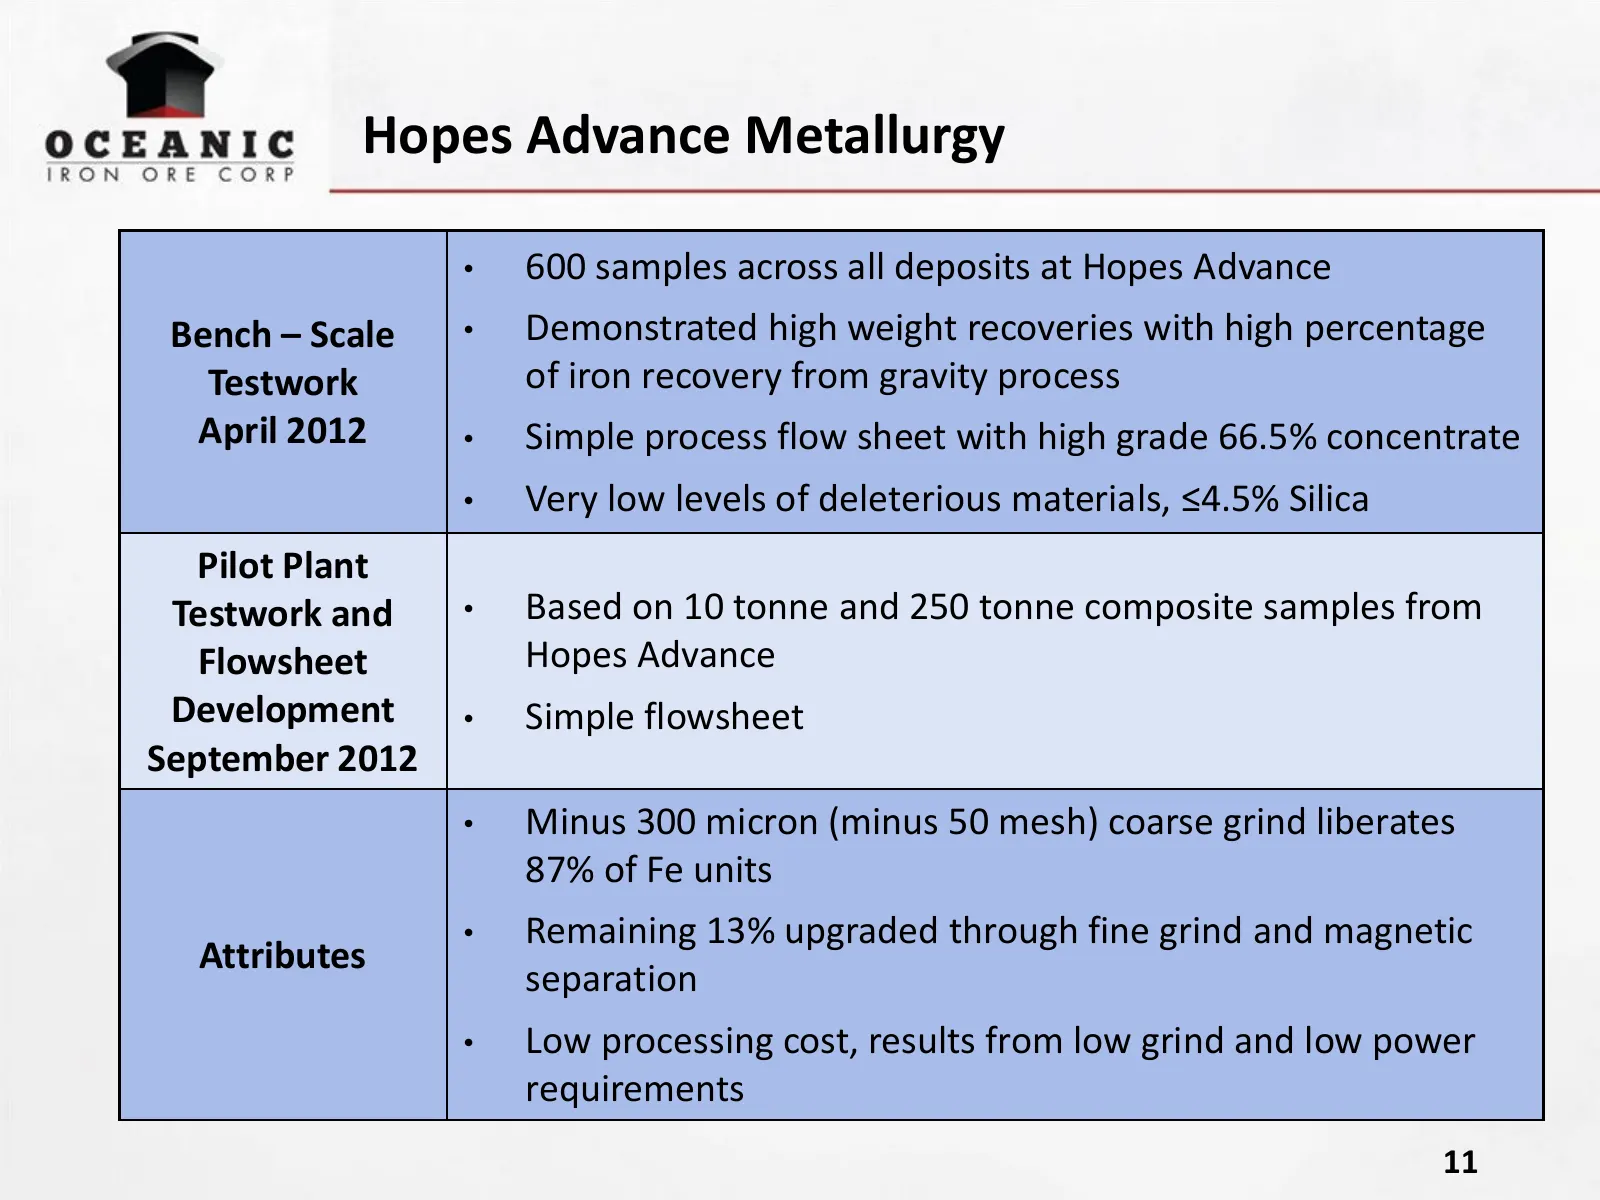
Hopes Advance Metallurgy • 600 samples across all deposits at Hopes Advance Bench – Scale • Demonstrated high weight recoveries with high percentage Testwork of iron recovery from gravity process April 2012 • Simple process flow sheet with high grade 66.5% concentrate • Very low levels of deleteriou
Slide 12: Hopes Advance Flowsheet – Simple Metallurgy
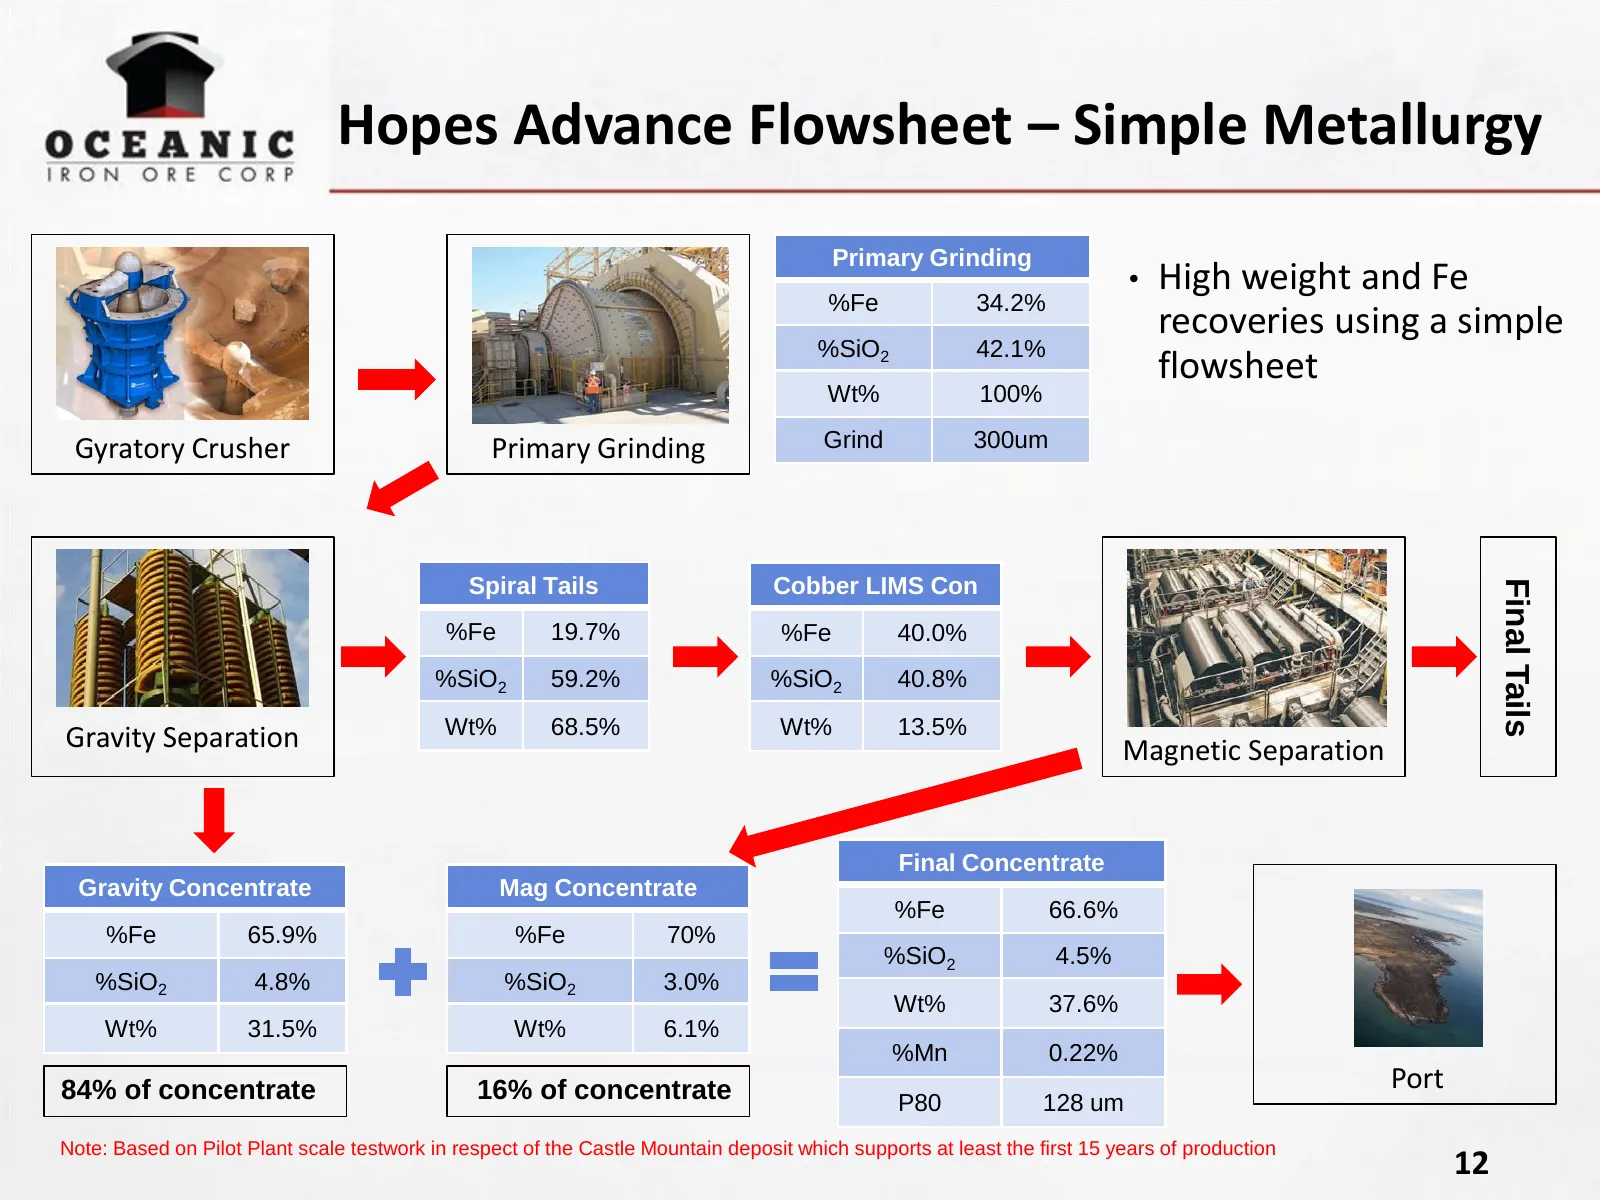
Hopes Advance Flowsheet – Simple Metallurgy Primary Grinding • High weight and Fe %Fe 34.2% recoveries using a simple %SiO2 42.1% flowsheet Wt% 100% Gyratory Crusher Primary Grinding Grind 300um Spiral Tails Cobber LIMS Con Final Tails %Fe 19.7% %Fe 40.0% %SiO2 59.2% %SiO2 40.8% Wt% 68.5% Wt% 13.5%
Slide 13: Excellent Product Chemistry
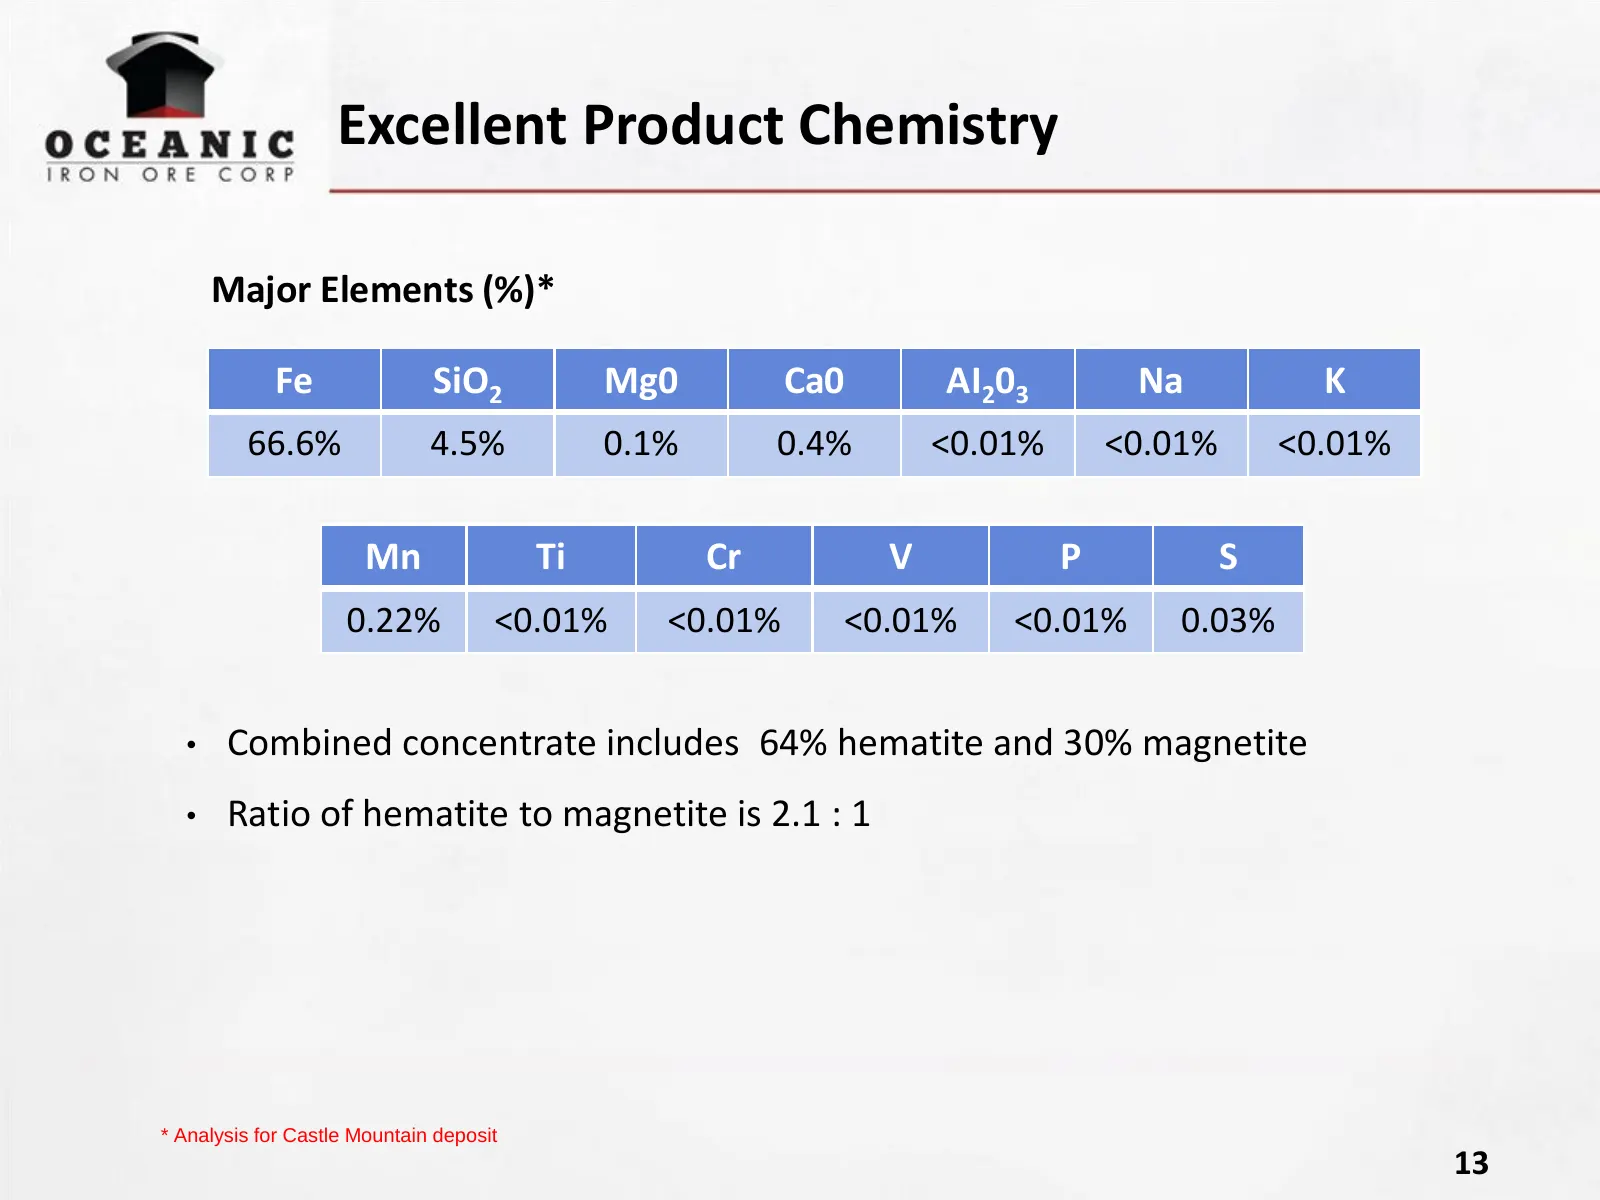
Excellent Product Chemistry Major Elements (%)* Fe SiO2 Mg0 Ca0 AI203 Na K 66.6% 4.5% 0.1% 0.4% <0.01% <0.01% <0.01% Mn Ti Cr V P S 0.22% <0.01% <0.01% <0.01% <0.01% 0.03% • Combined concentrate includes 64% hematite and 30% magnetite • Ratio of hematite to magnetite is 2.1 : 1 * Analysis for Castle
Slide 14: High Quality Product
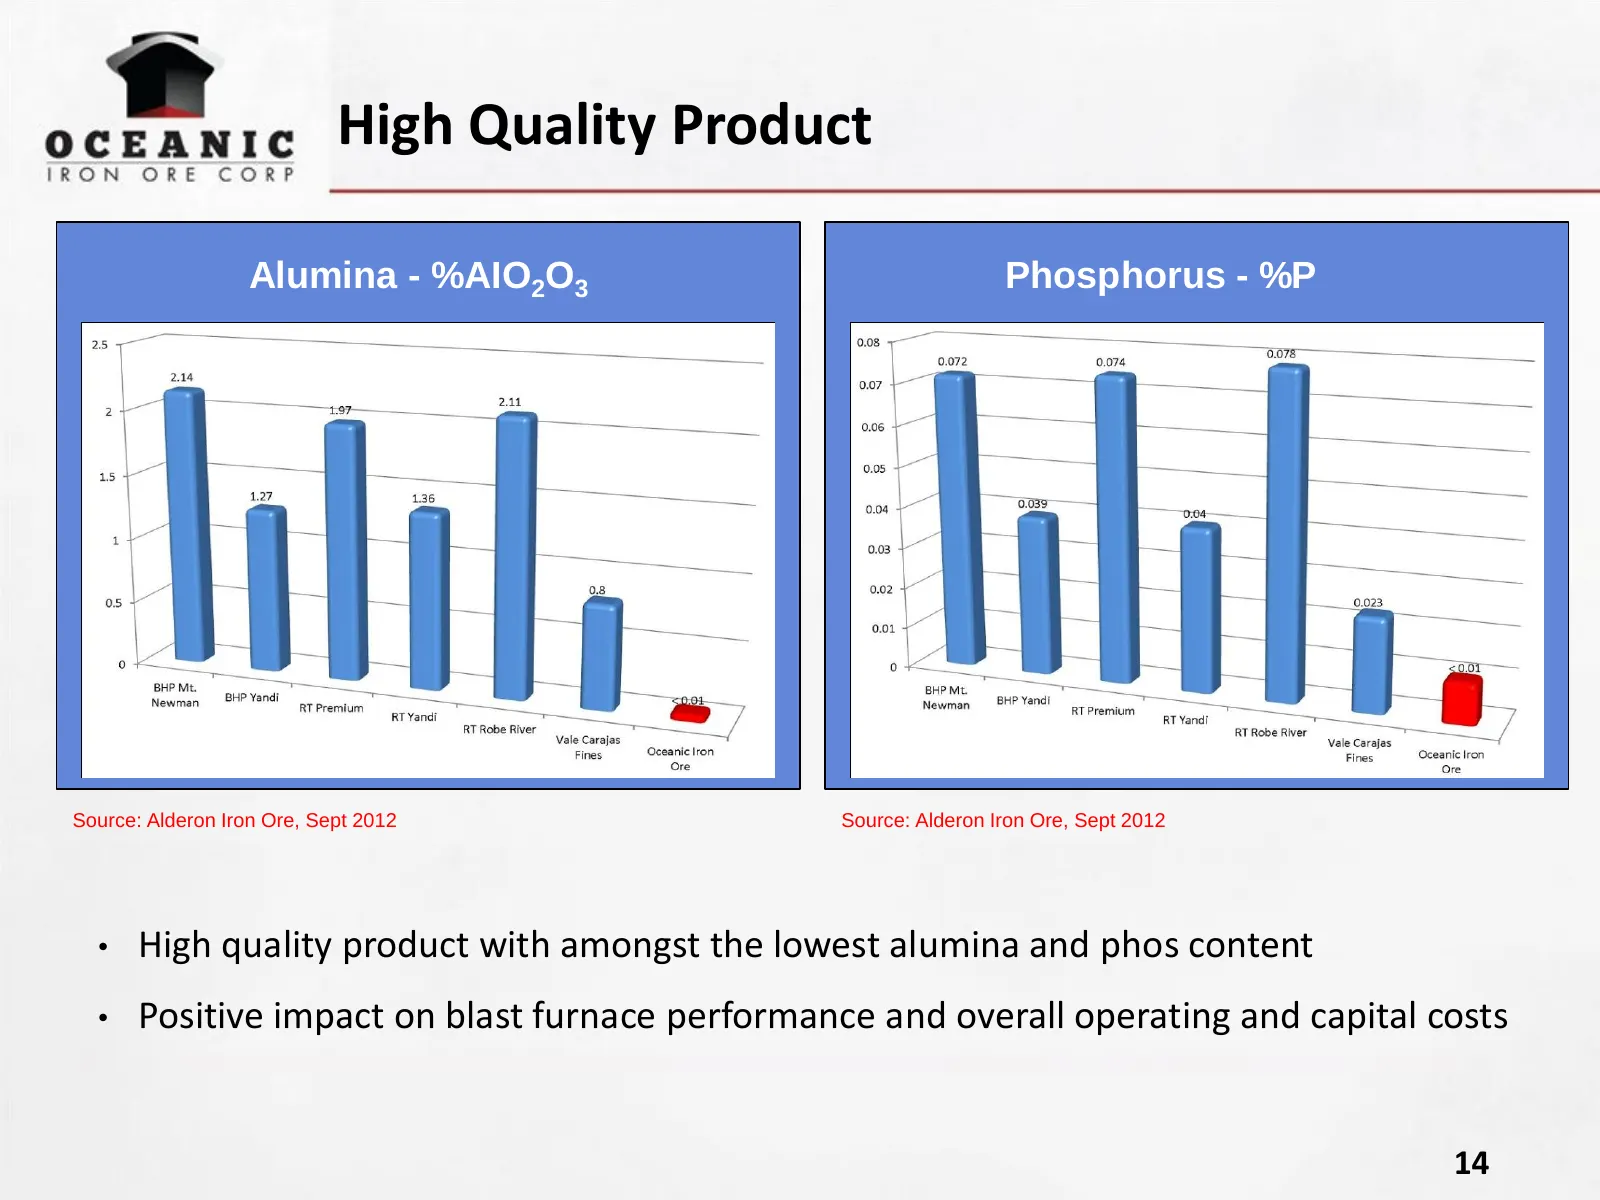
High Quality Product Alumina - %AIO2O3 Phosphorus - %P Source: Alderon Iron Ore, Sept 2012 Source: Alderon Iron Ore, Sept 2012 • High quality product with amongst the lowest alumina and phos content • Positive impact on blast furnace performance and overall operating and capital costs 14
Slide 15: Hopes Advance Site Layout
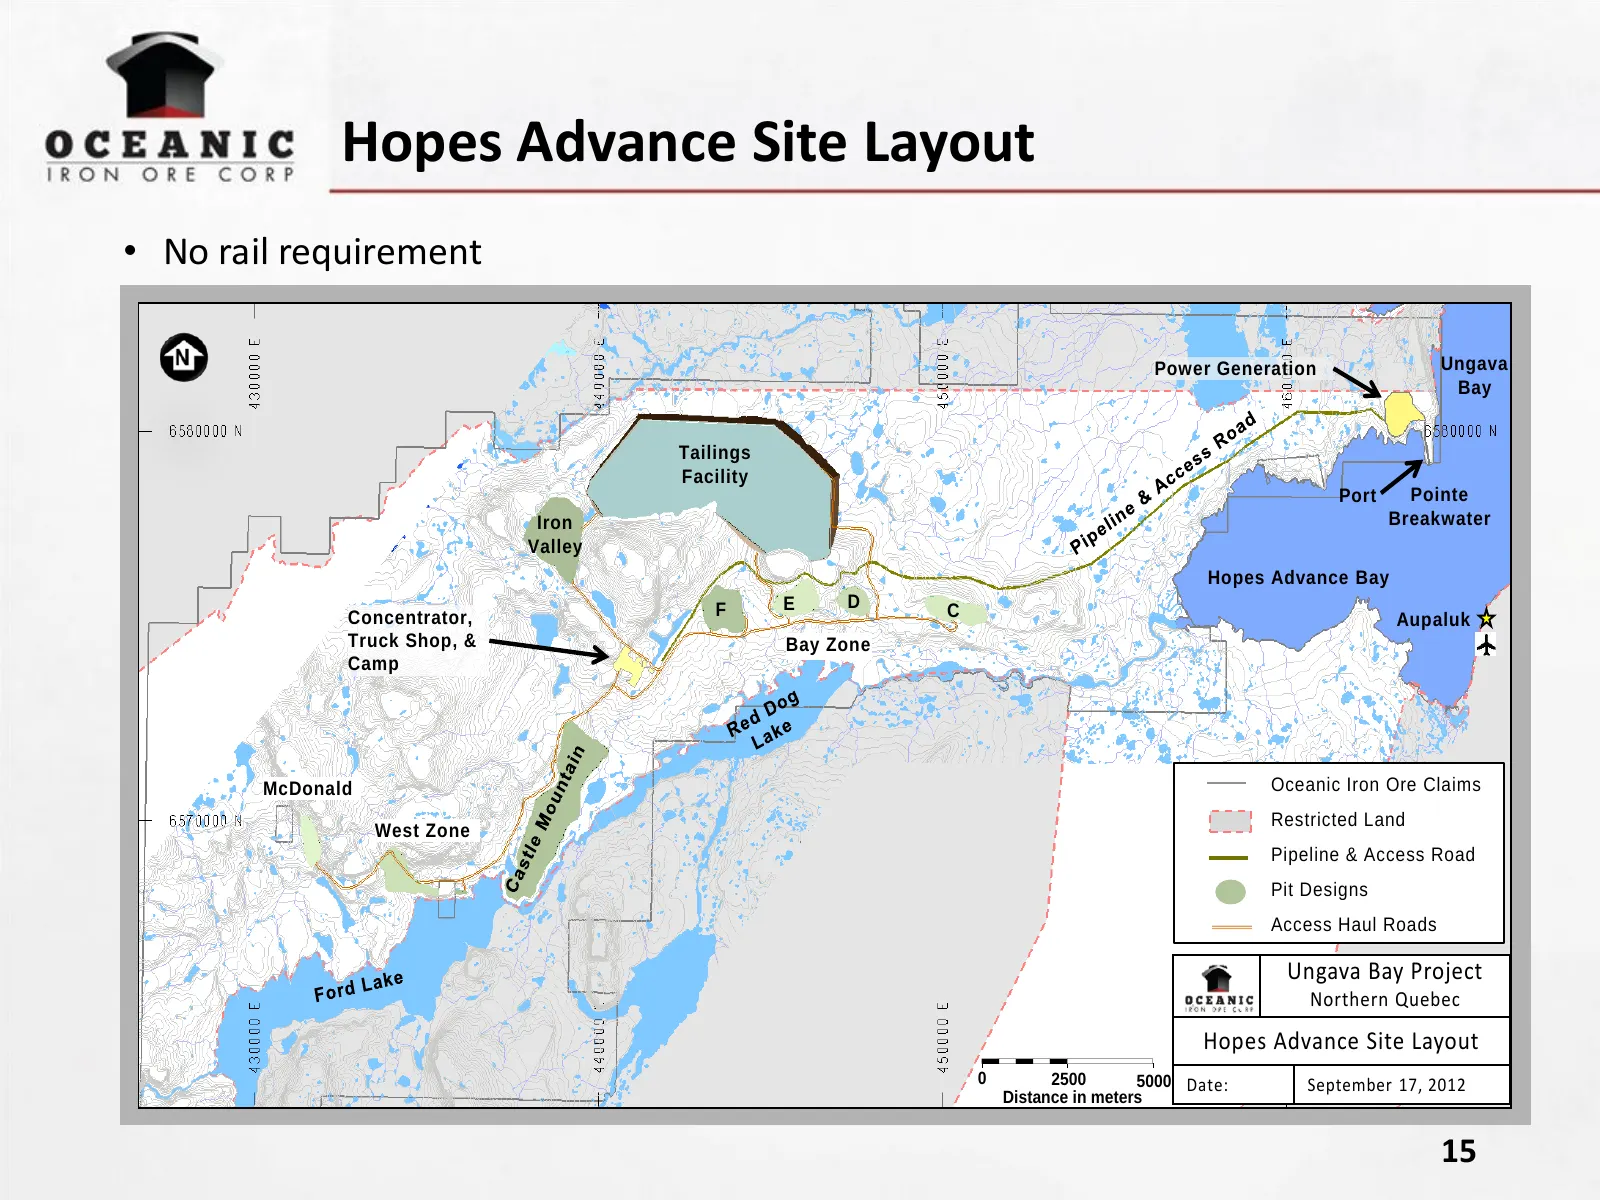
Hopes Advance Site Layout • No rail requirement Power Generation Ungava Bay Tailings Facility Port Pointe Iron Breakwater Valley Hopes Advance Bay F E D C Concentrator, Aupaluk Truck Shop, & Bay Zone Camp McDonald Oceanic Iron Ore Claims Restricted Land West Zone Pipeline & Access Road Pit Designs A
Slide 16: Port & Shipping Logistics
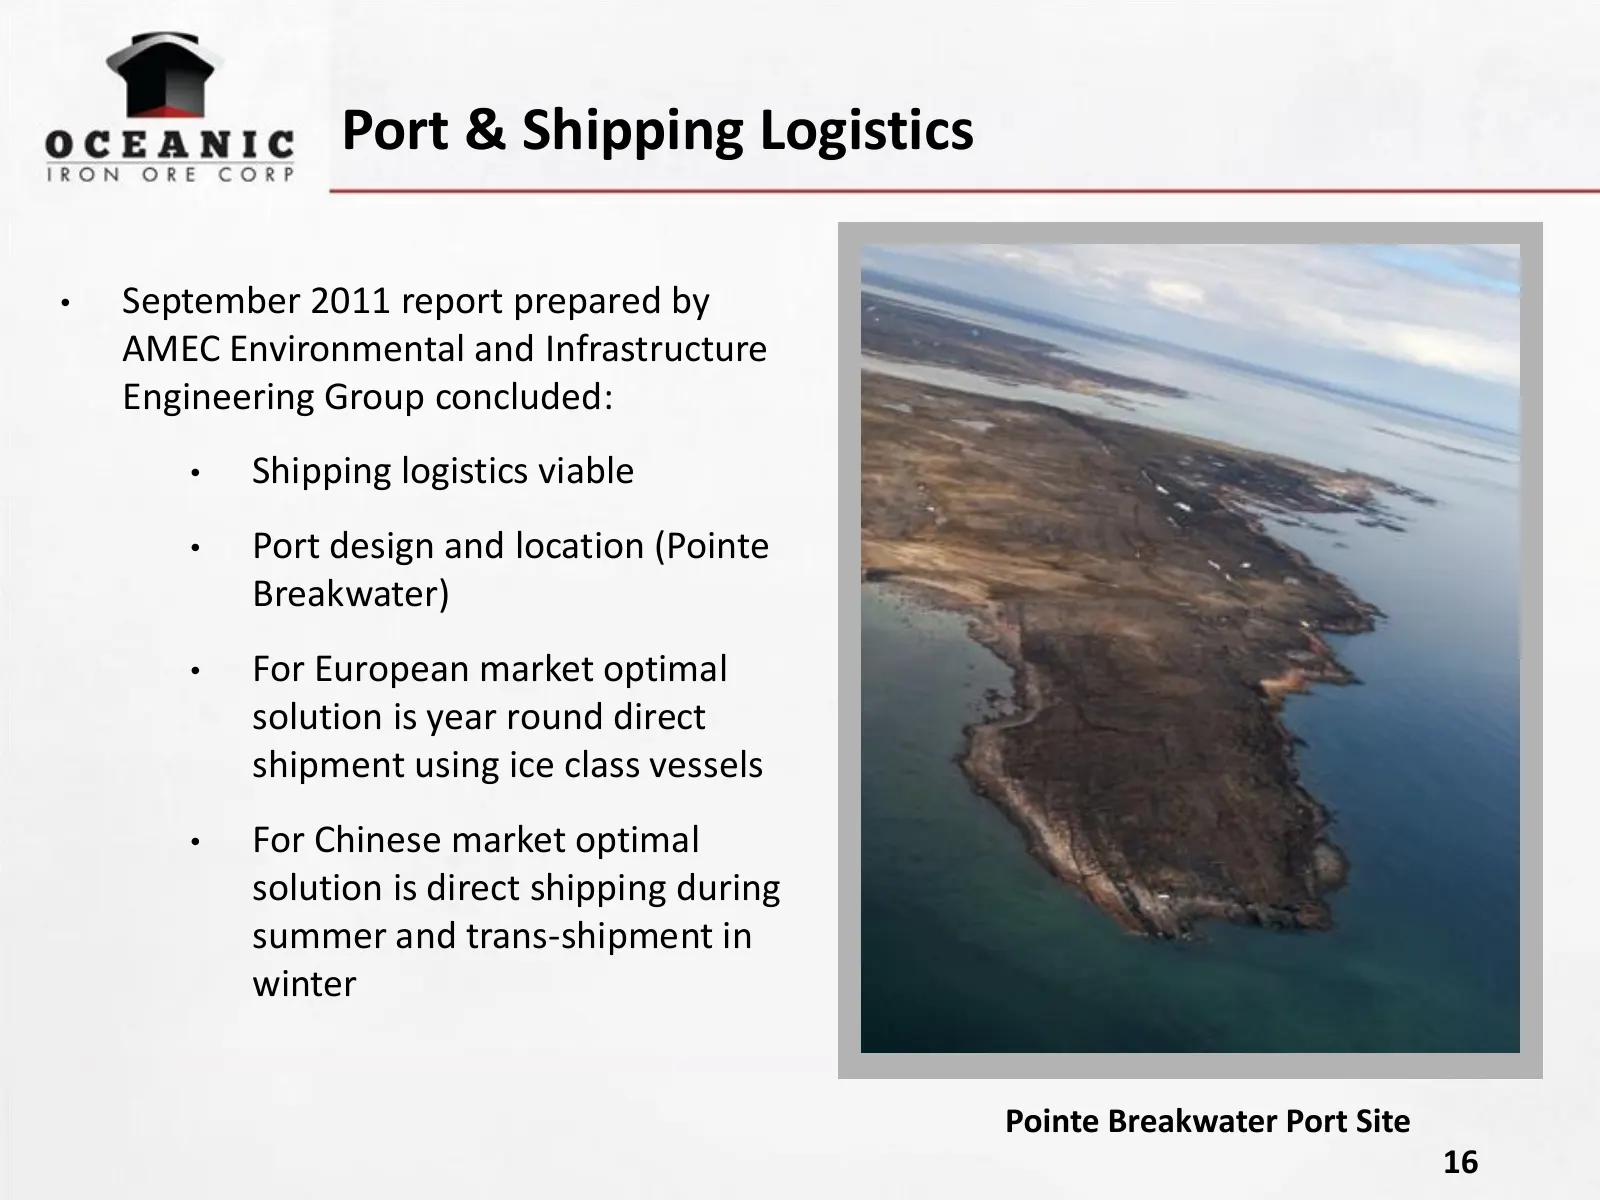
Port & Shipping Logistics • September 2011 report prepared by AMEC Environmental and Infrastructure Engineering Group concluded: • Shipping logistics viable • Port design and location (Pointe Breakwater) • For European market optimal solution is year round direct shipment using ice class vessels • F
Slide 17: Viable Year-Round Shipping Routes
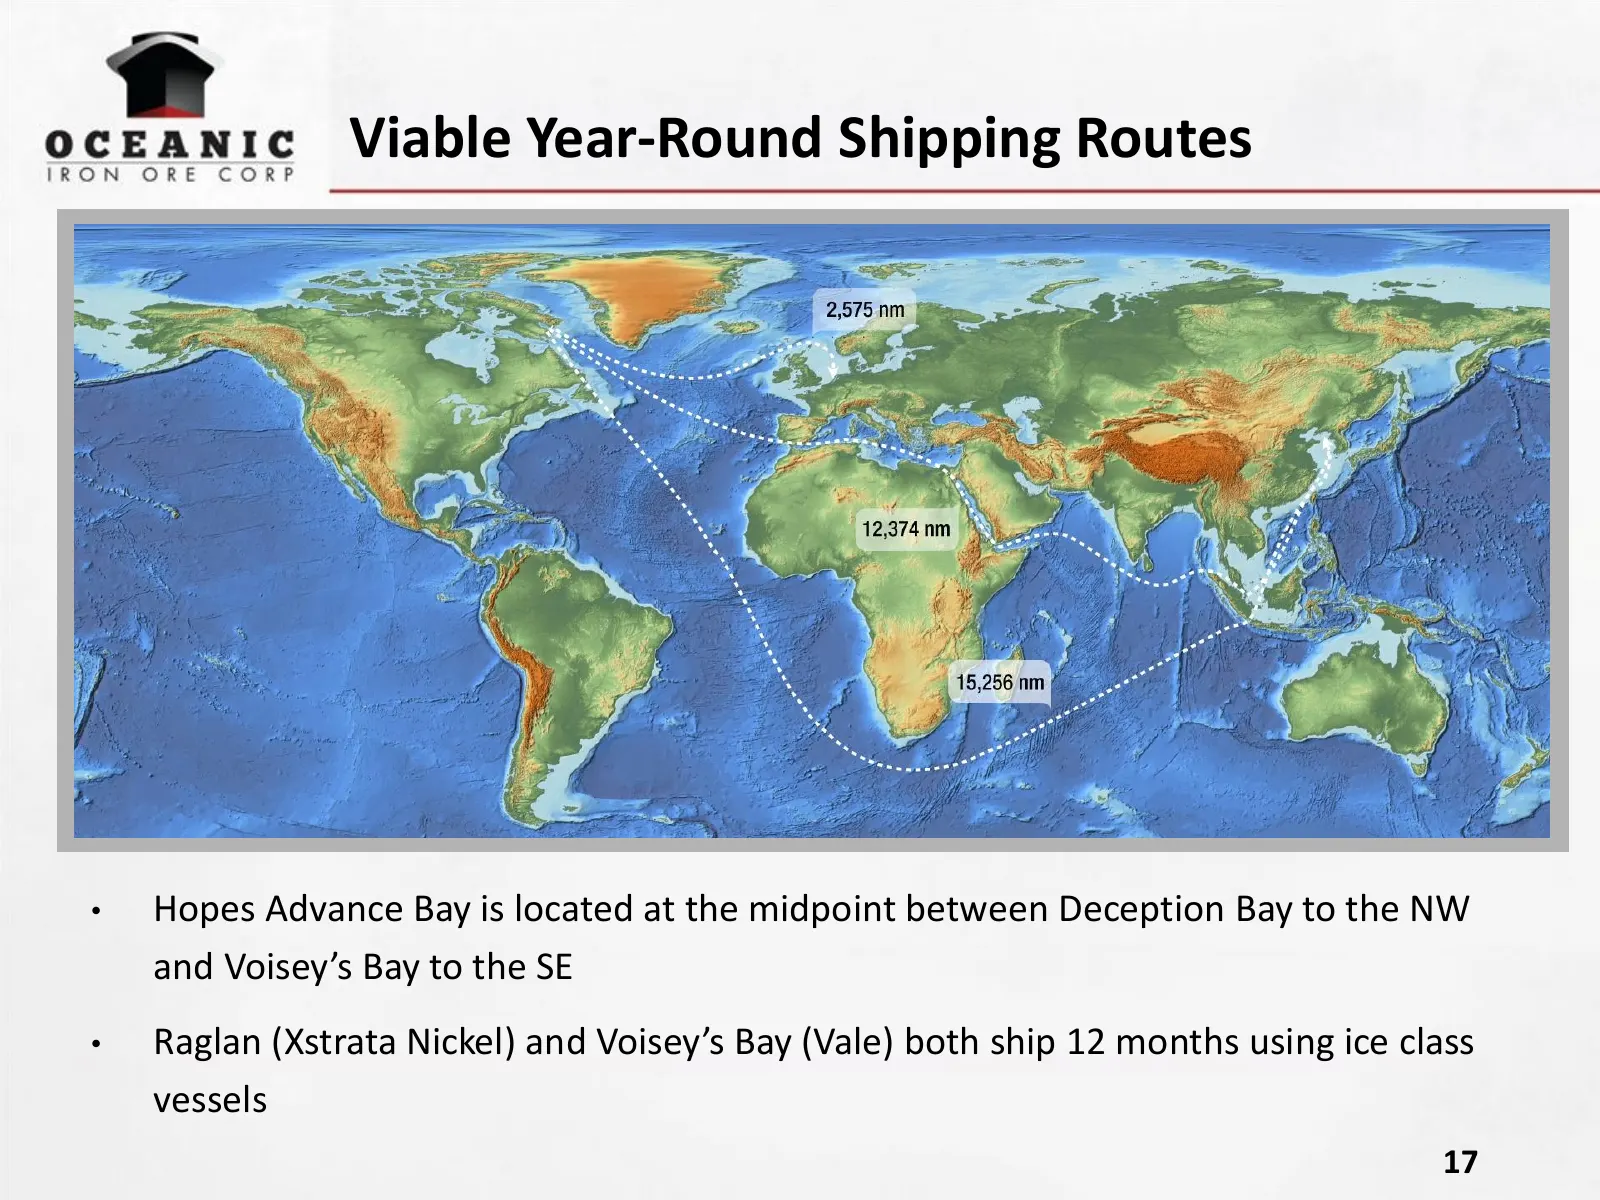
Viable Year-Round Shipping Routes • Hopes Advance Bay is located at the midpoint between Deception Bay to the NW and Voisey’s Bay to the SE • Raglan (Xstrata Nickel) and Voisey’s Bay (Vale) both ship 12 months using ice class vessels 17
Slide 18: Social and Environmental Considerations
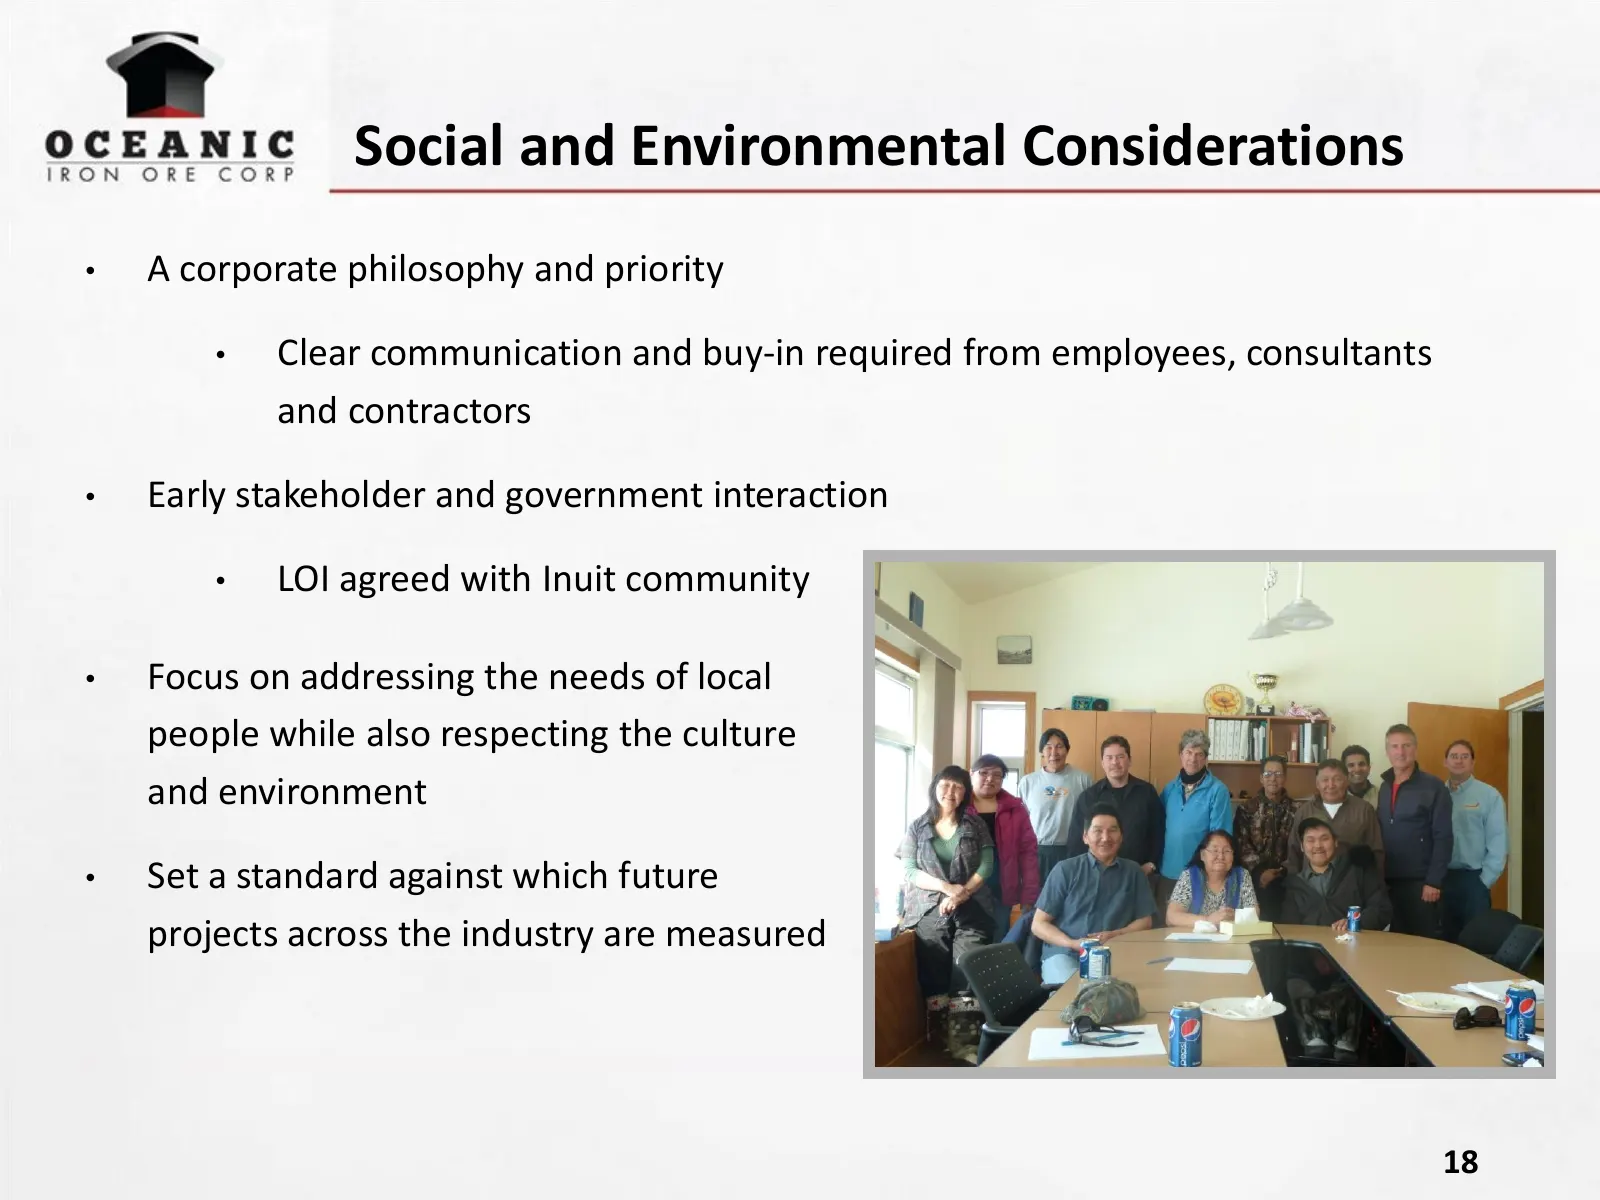
Social and Environmental Considerations • A corporate philosophy and priority • Clear communication and buy-in required from employees, consultants and contractors • Early stakeholder and government interaction • LOI agreed with Inuit community • Focus on addressing the needs of local people while a
Slide 19: 250 mtpa Production Underwater at $100/tonne
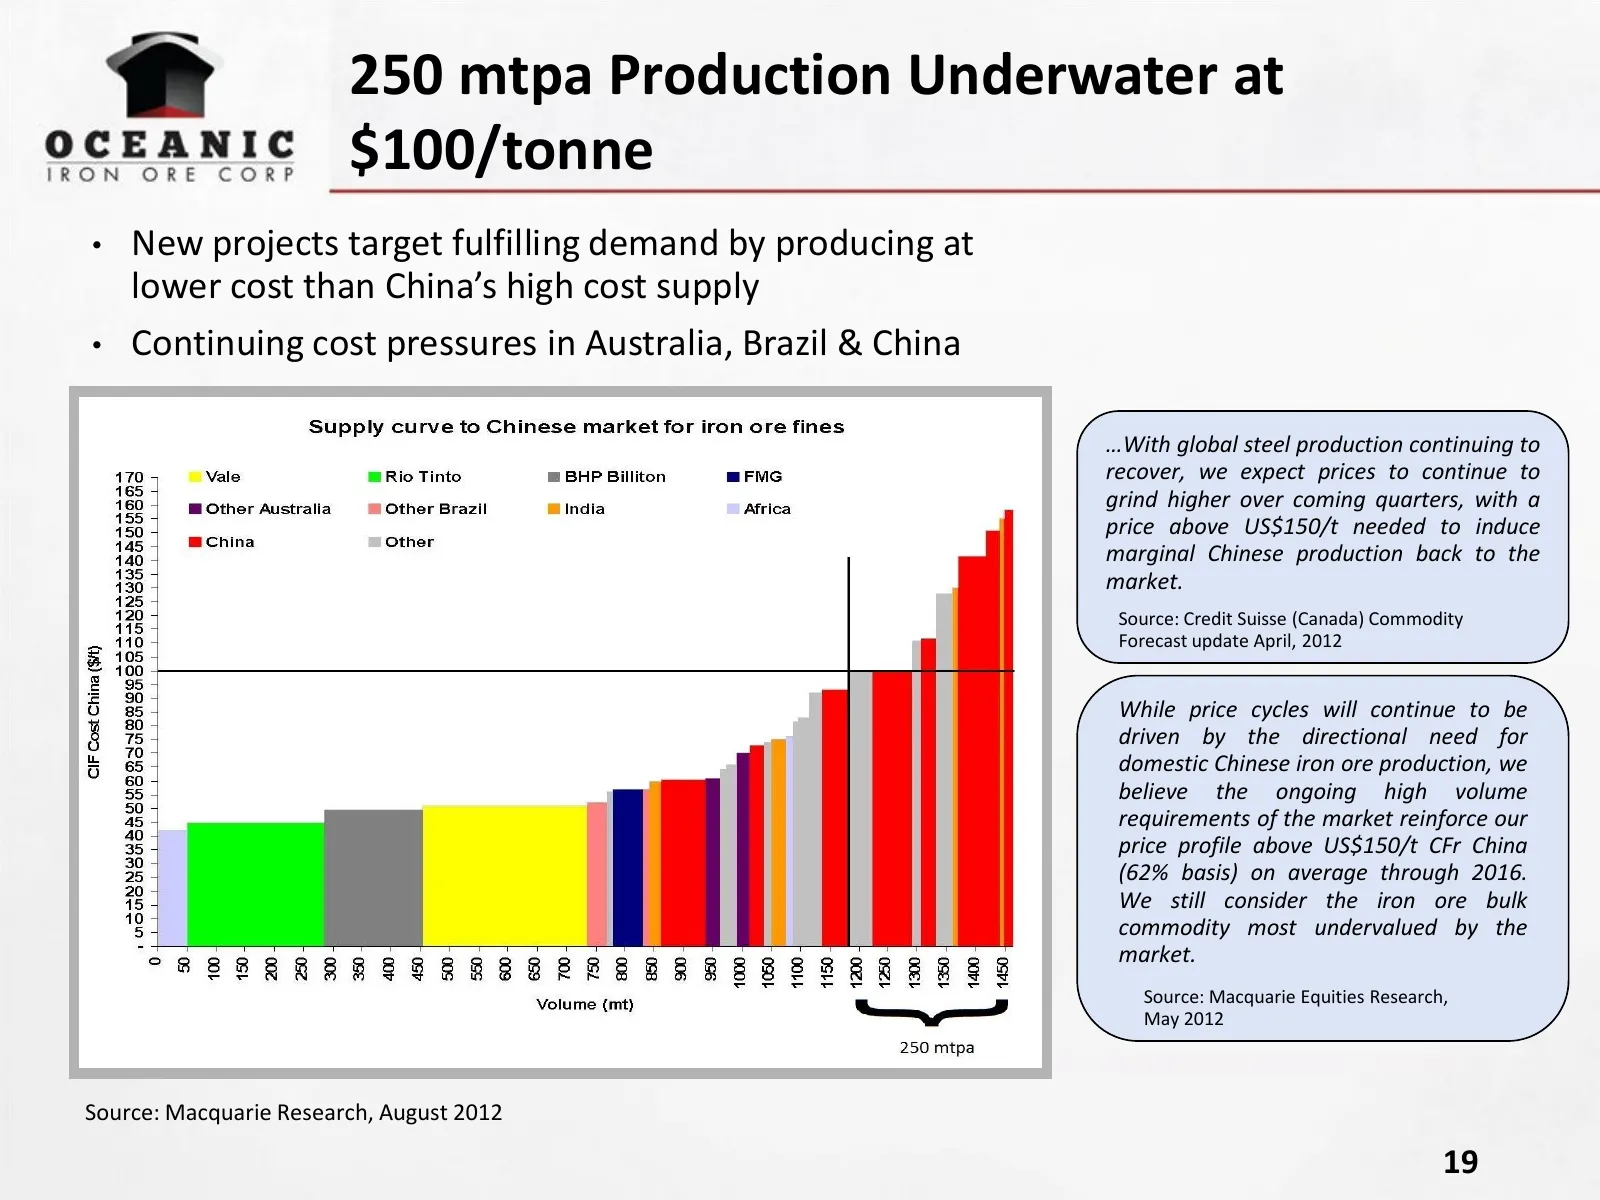
250 mtpa Production Underwater at $100/tonne • New projects target fulfilling demand by producing at lower cost than China’s high cost supply • Continuing cost pressures in Australia, Brazil & China …With global steel production continuing to recover, we expect prices to continue to grind higher ove
Slide 20: Price Rebound - Cost Supply Curve Fundamentals Kick-In
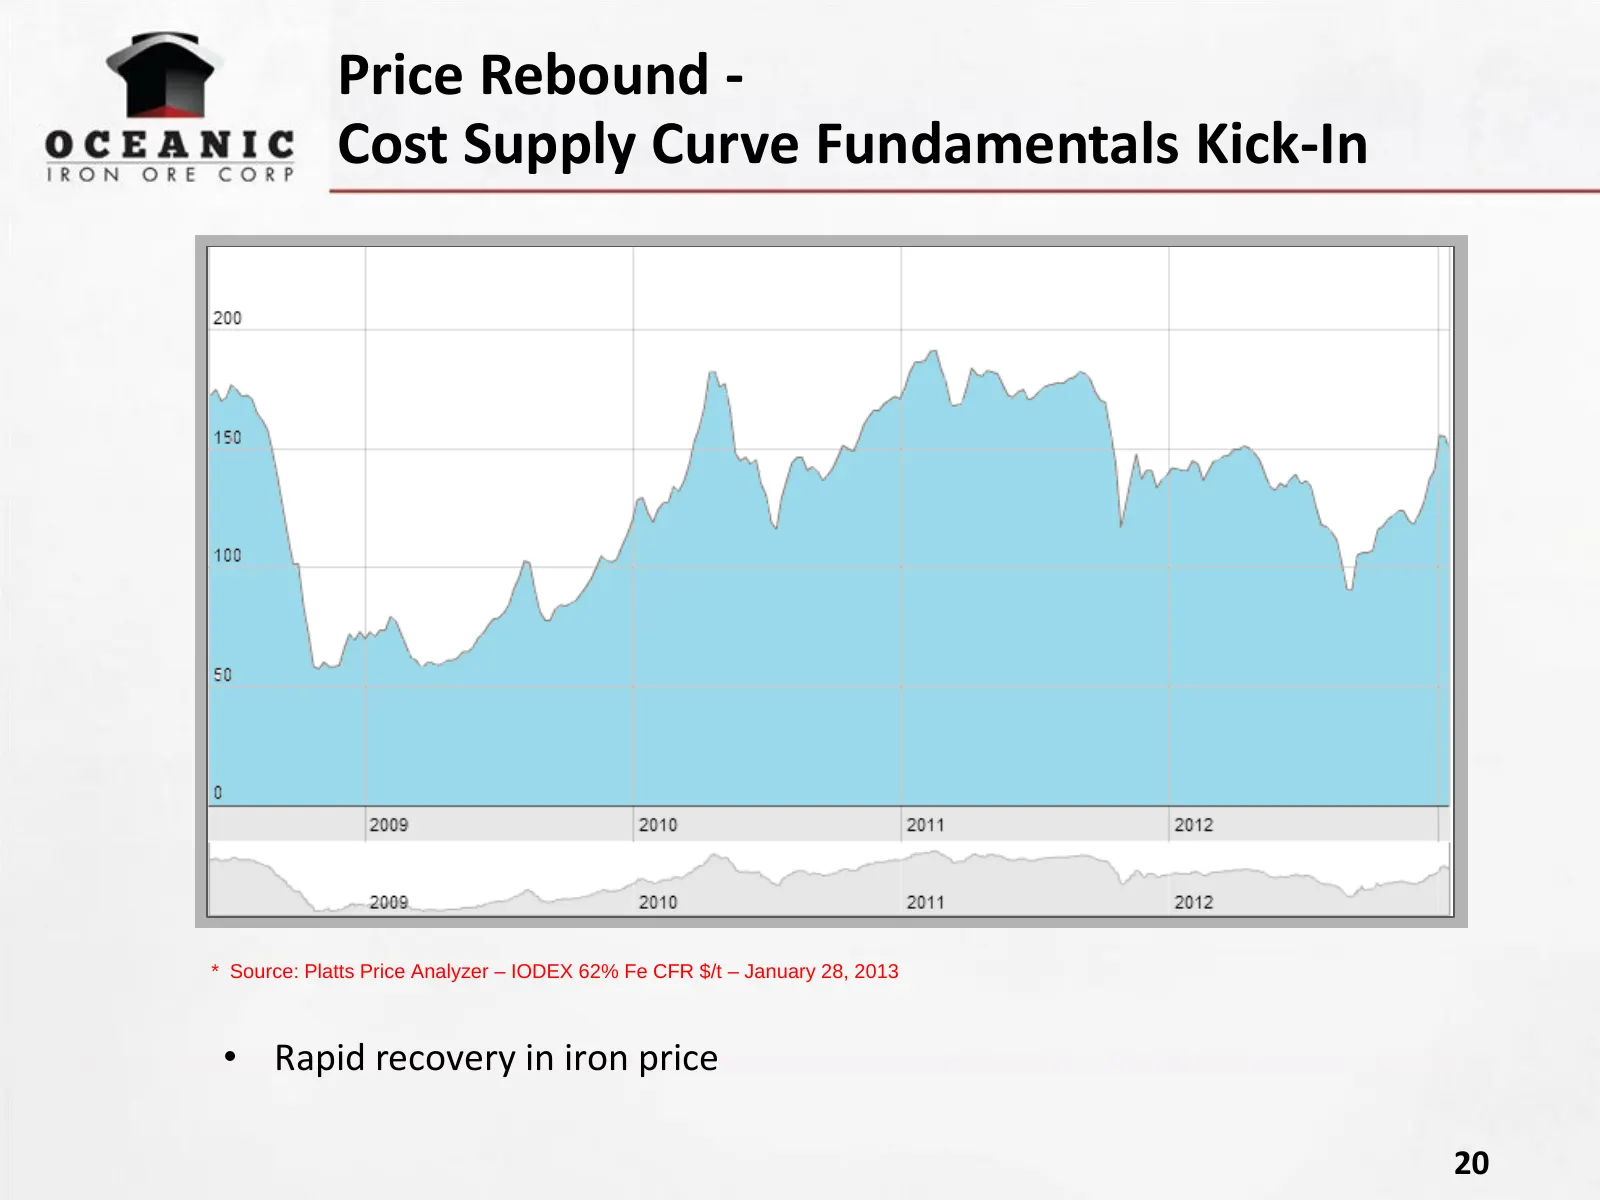
Price Rebound - Cost Supply Curve Fundamentals Kick-In * Source: Platts Price Analyzer – IODEX 62% Fe CFR $/t – January 28, 2013 • Rapid recovery in iron price 20
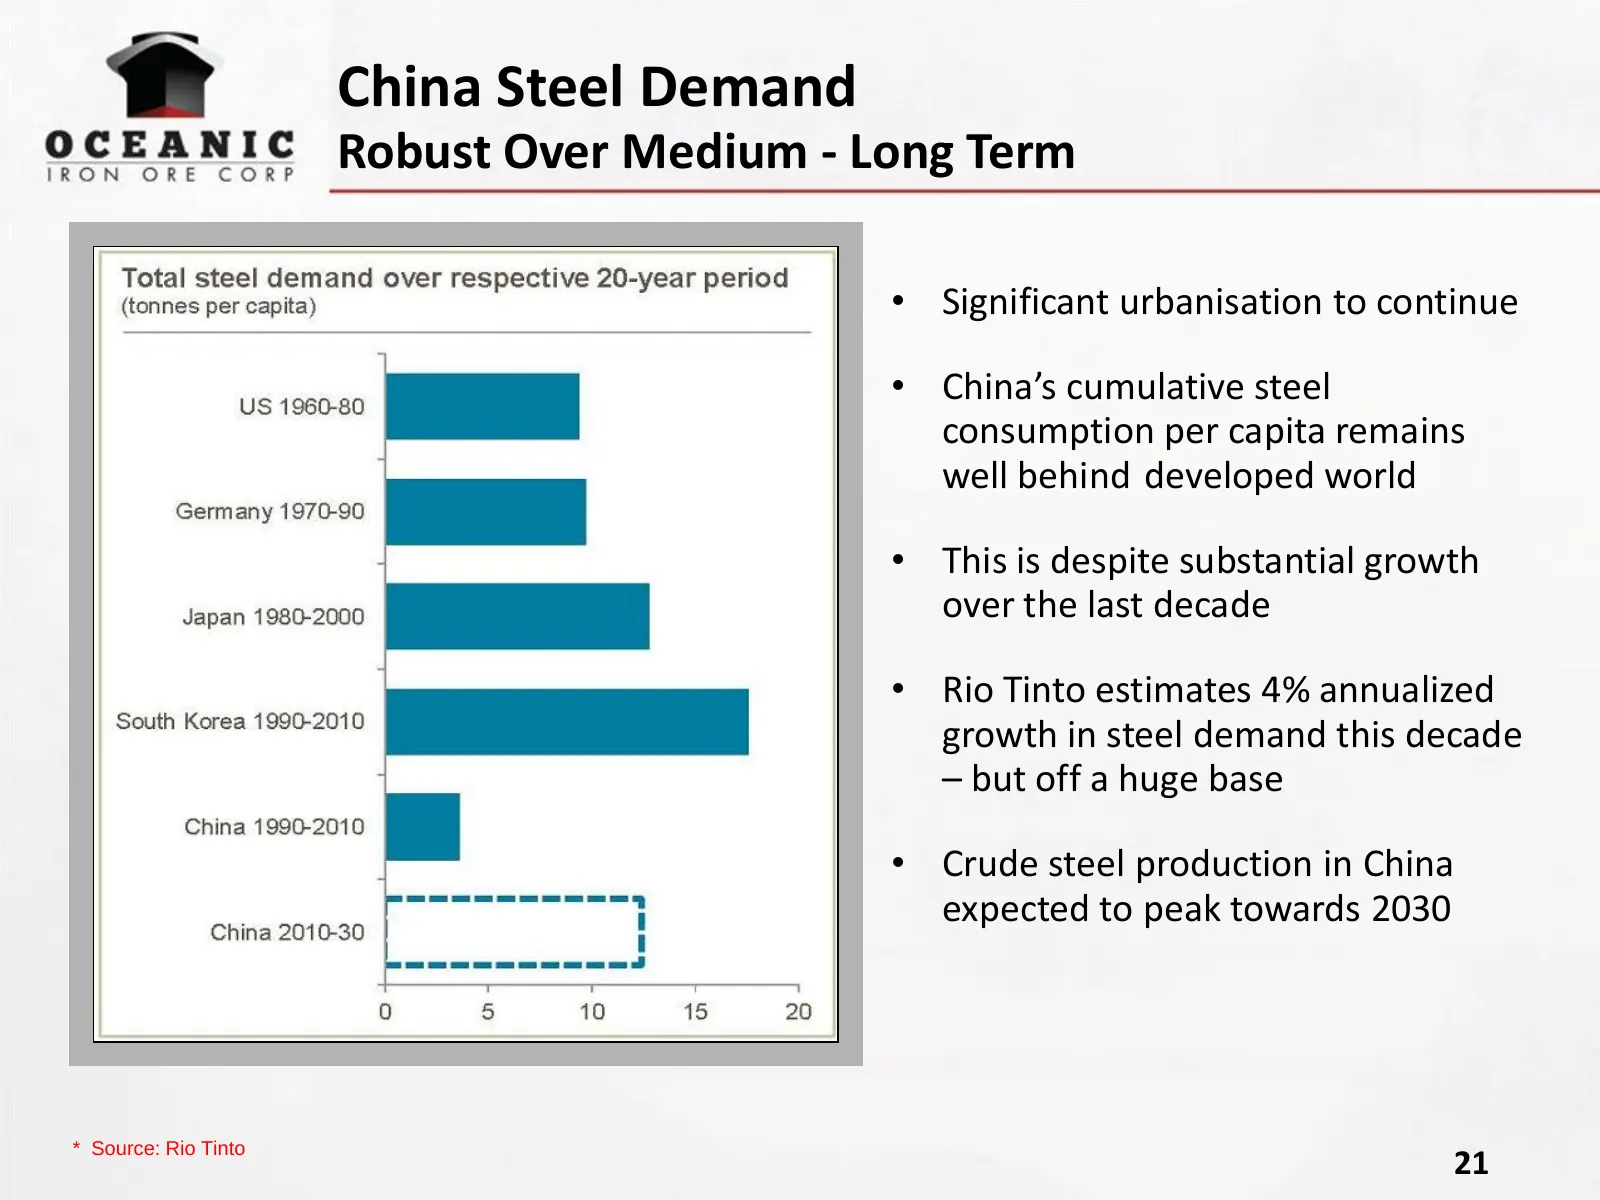
Slide 21: China Steel Demand
China Steel Demand Robust Over Medium - Long Term • Significant urbanisation to continue • China’s cumulative steel consumption per capita remains well behind developed world • This is despite substantial growth over the last decade • Rio Tinto estimates 4% annualized growth in steel demand this dec
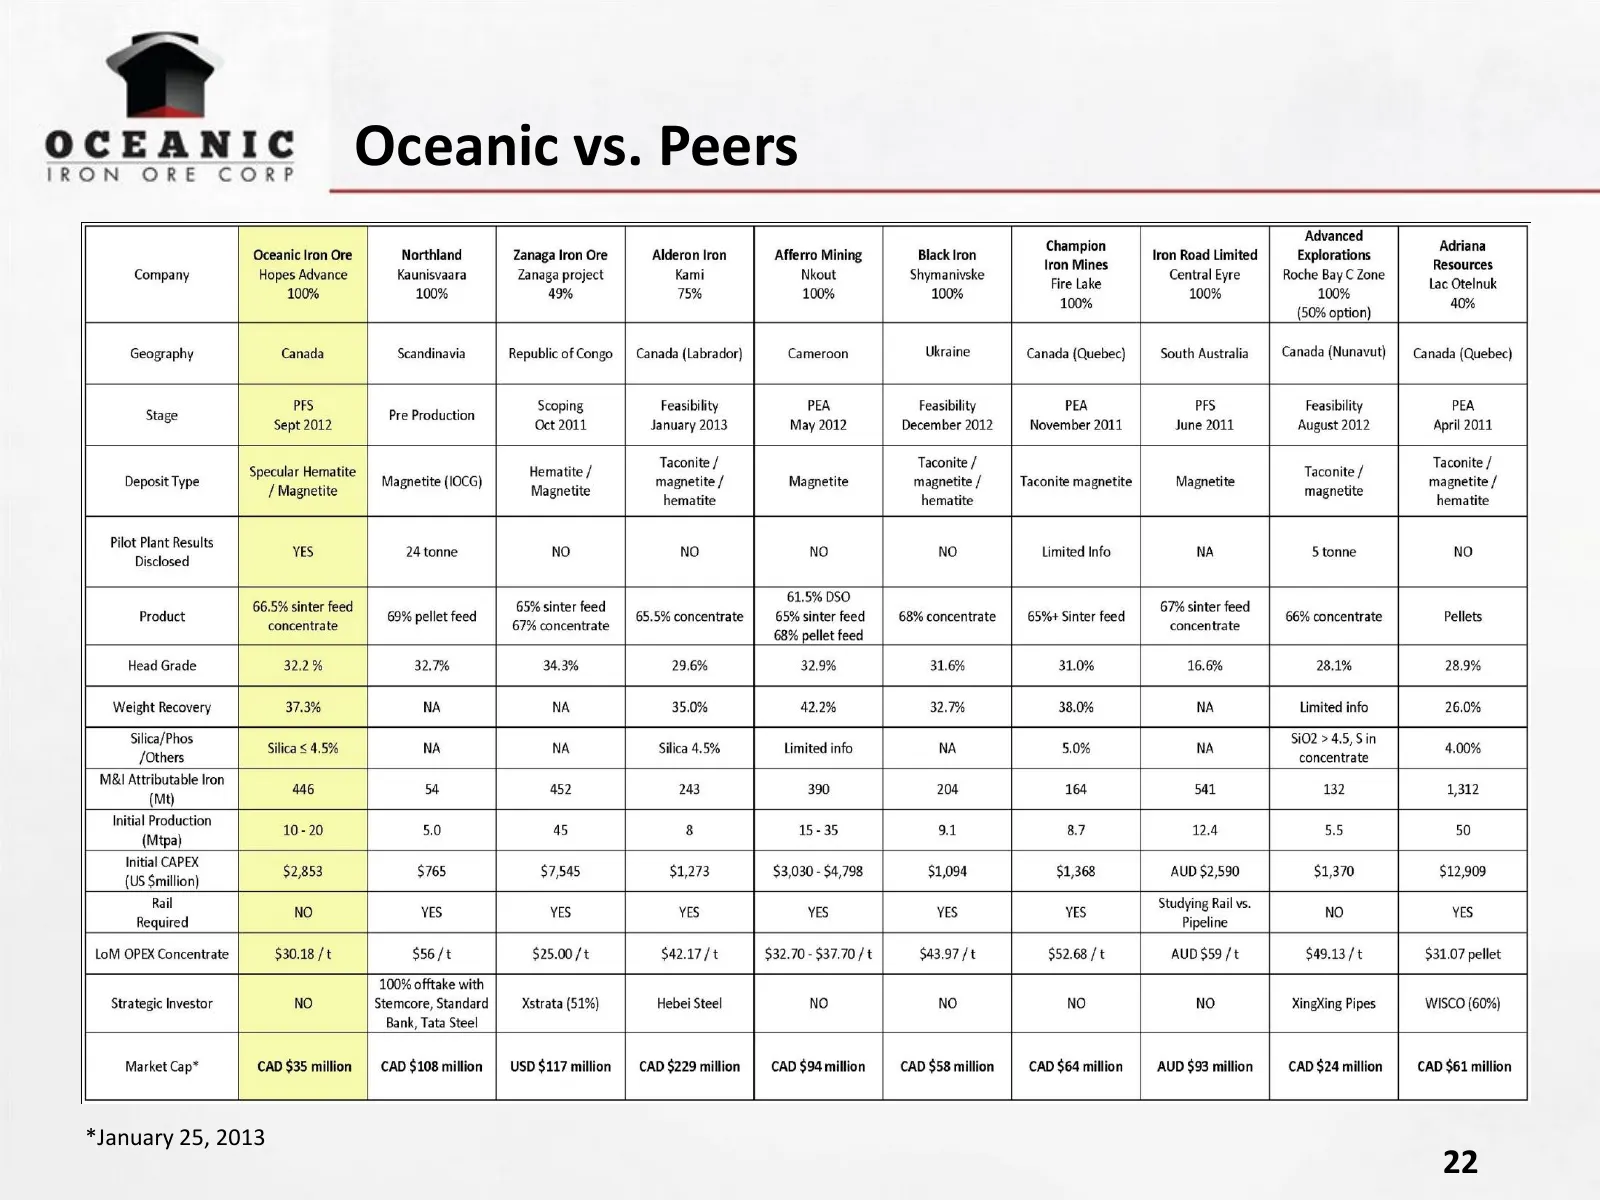
Slide 22: Oceanic vs. Peers
Oceanic vs. Peers *January 25, 2013 22
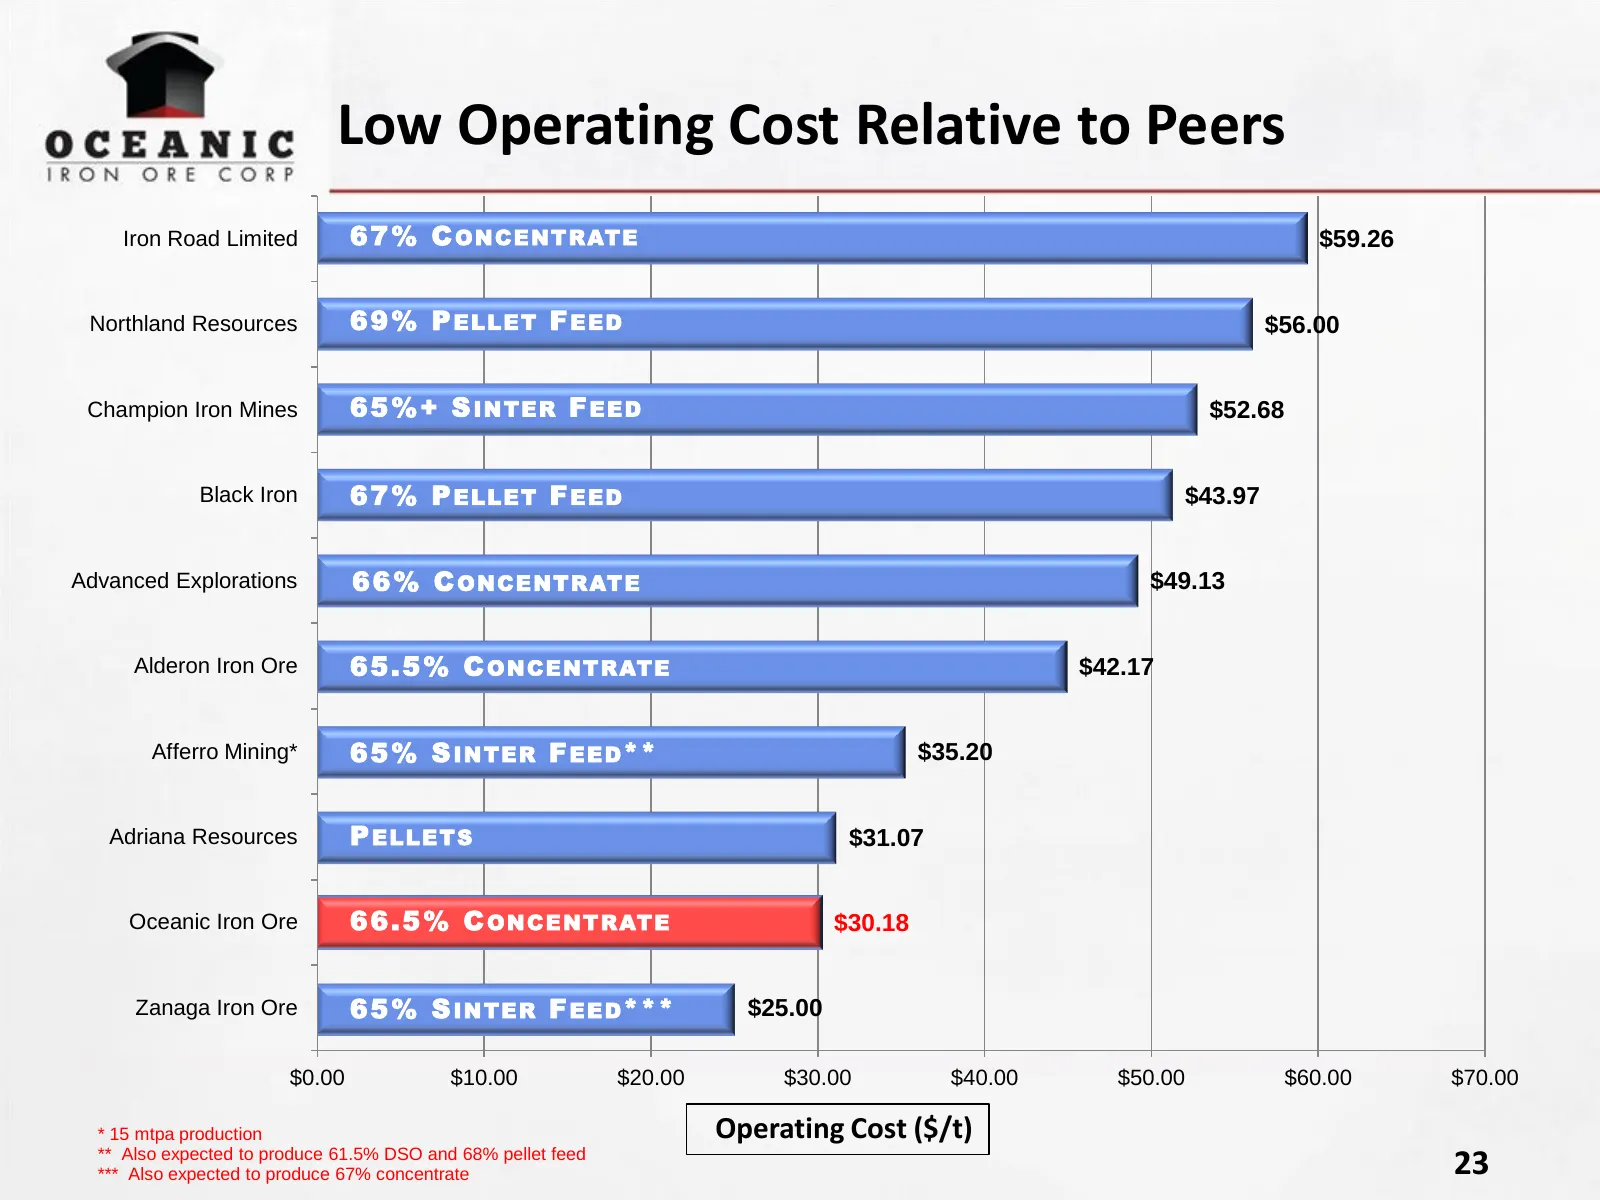
Slide 23: Low Operating Cost Relative to Peers
Low Operating Cost Relative to Peers Iron Road Limited 6 7 % C O N CE N T RAT E $59.26 Northland Resources 6 9 % P E LLE T F E E D $56.00 Champion Iron Mines 6 5 %+ S IN T E R F E E D $52.68 Black Iron 6 7 % P E LLE T F E E D $43.97 Advanced Explorations 6 6 % C O N CE N T RAT E $49.13 Alderon Iron
Slide 24: Hopes Advance – The Premier Iron Ore Development Project
Hopes Advance – The Premier Iron Ore Development Project • Exceptional large scale resource in low risk jurisdiction • Low cost producer: $30/tonne life of mine • High grade (66.5%) premium iron concentrate for seaborne market • Fast track development schedule independent of 3rd party infrastructure
Slide 25: Appendices
APPENDICES
Slide 26: Board of Directors
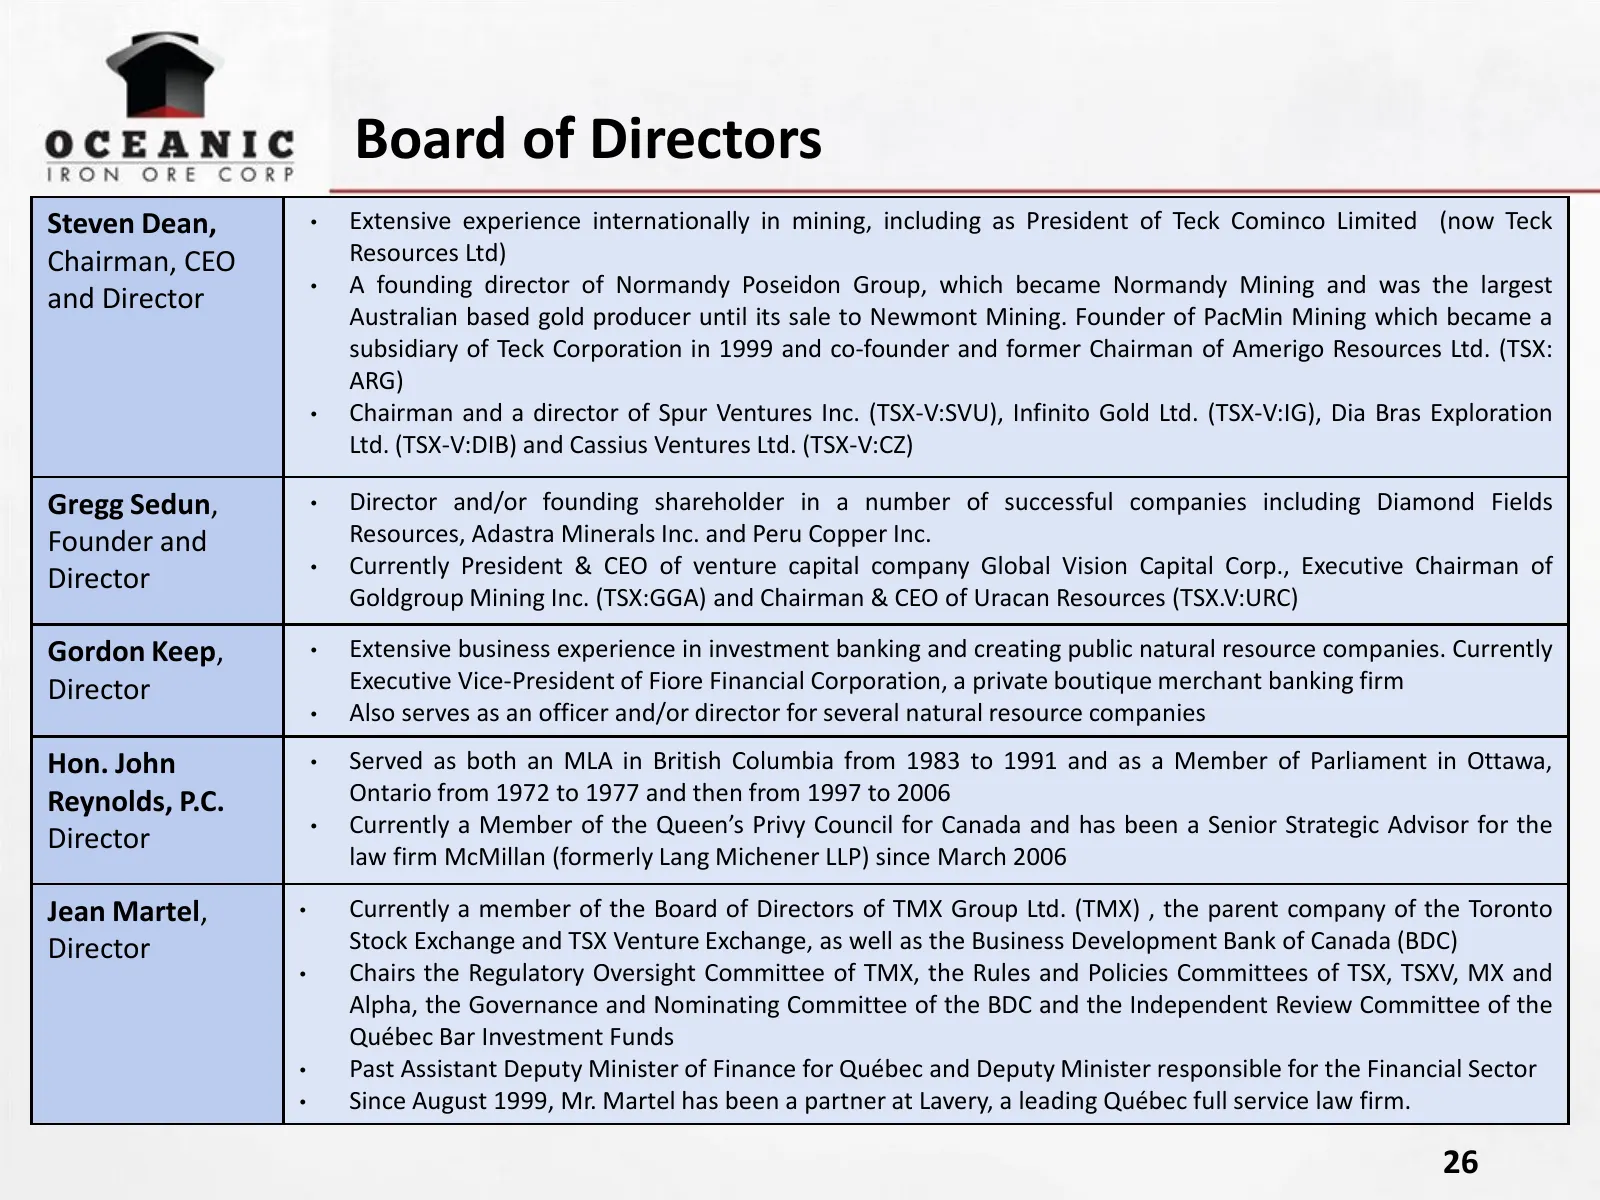
Board of Directors Steven Dean, • Extensive experience internationally in mining, including as President of Teck Cominco Limited (now Teck Chairman, CEO Resources Ltd) • A founding director of Normandy Poseidon Group, which became Normandy Mining and was the largest and Director Australian based gol
Slide 27: Management Team
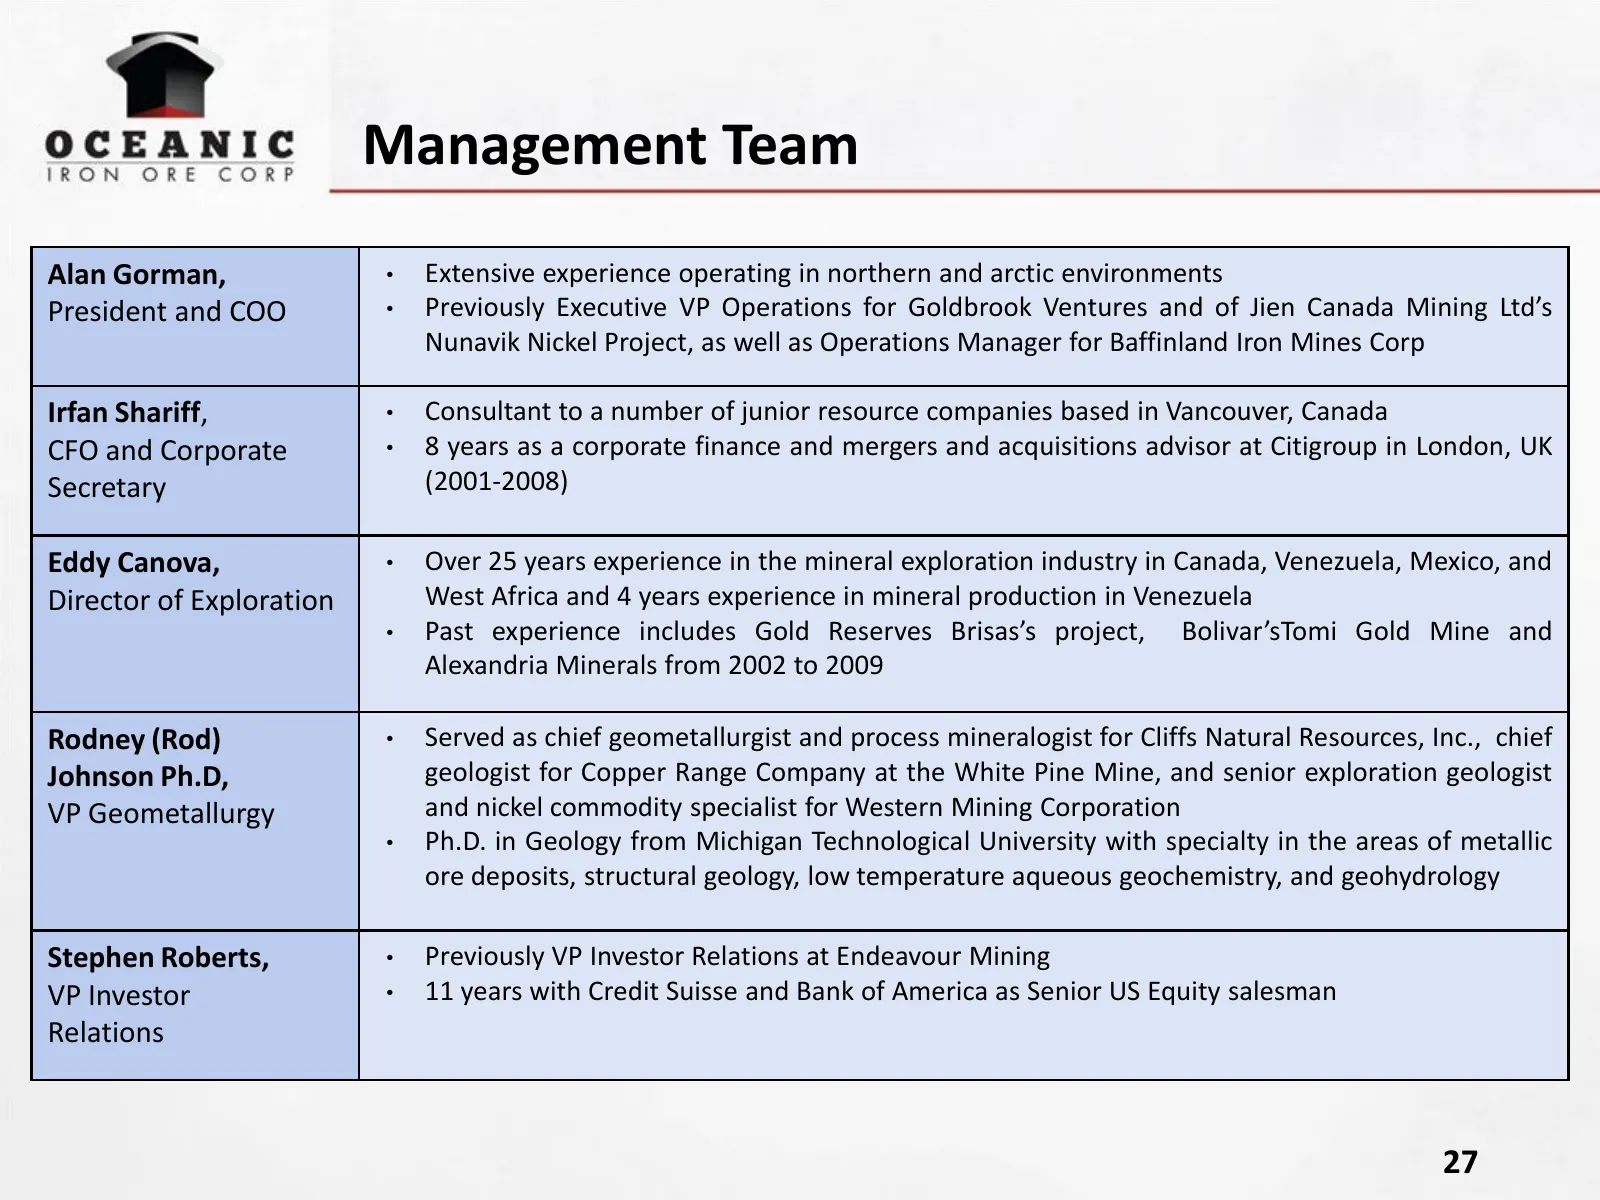
Management Team Alan Gorman, • Extensive experience operating in northern and arctic environments President and COO • Previously Executive VP Operations for Goldbrook Ventures and of Jien Canada Mining Ltd’s Nunavik Nickel Project, as well as Operations Manager for Baffinland Iron Mines Corp Irfan S
Slide 28: Ungava Property Project Areas
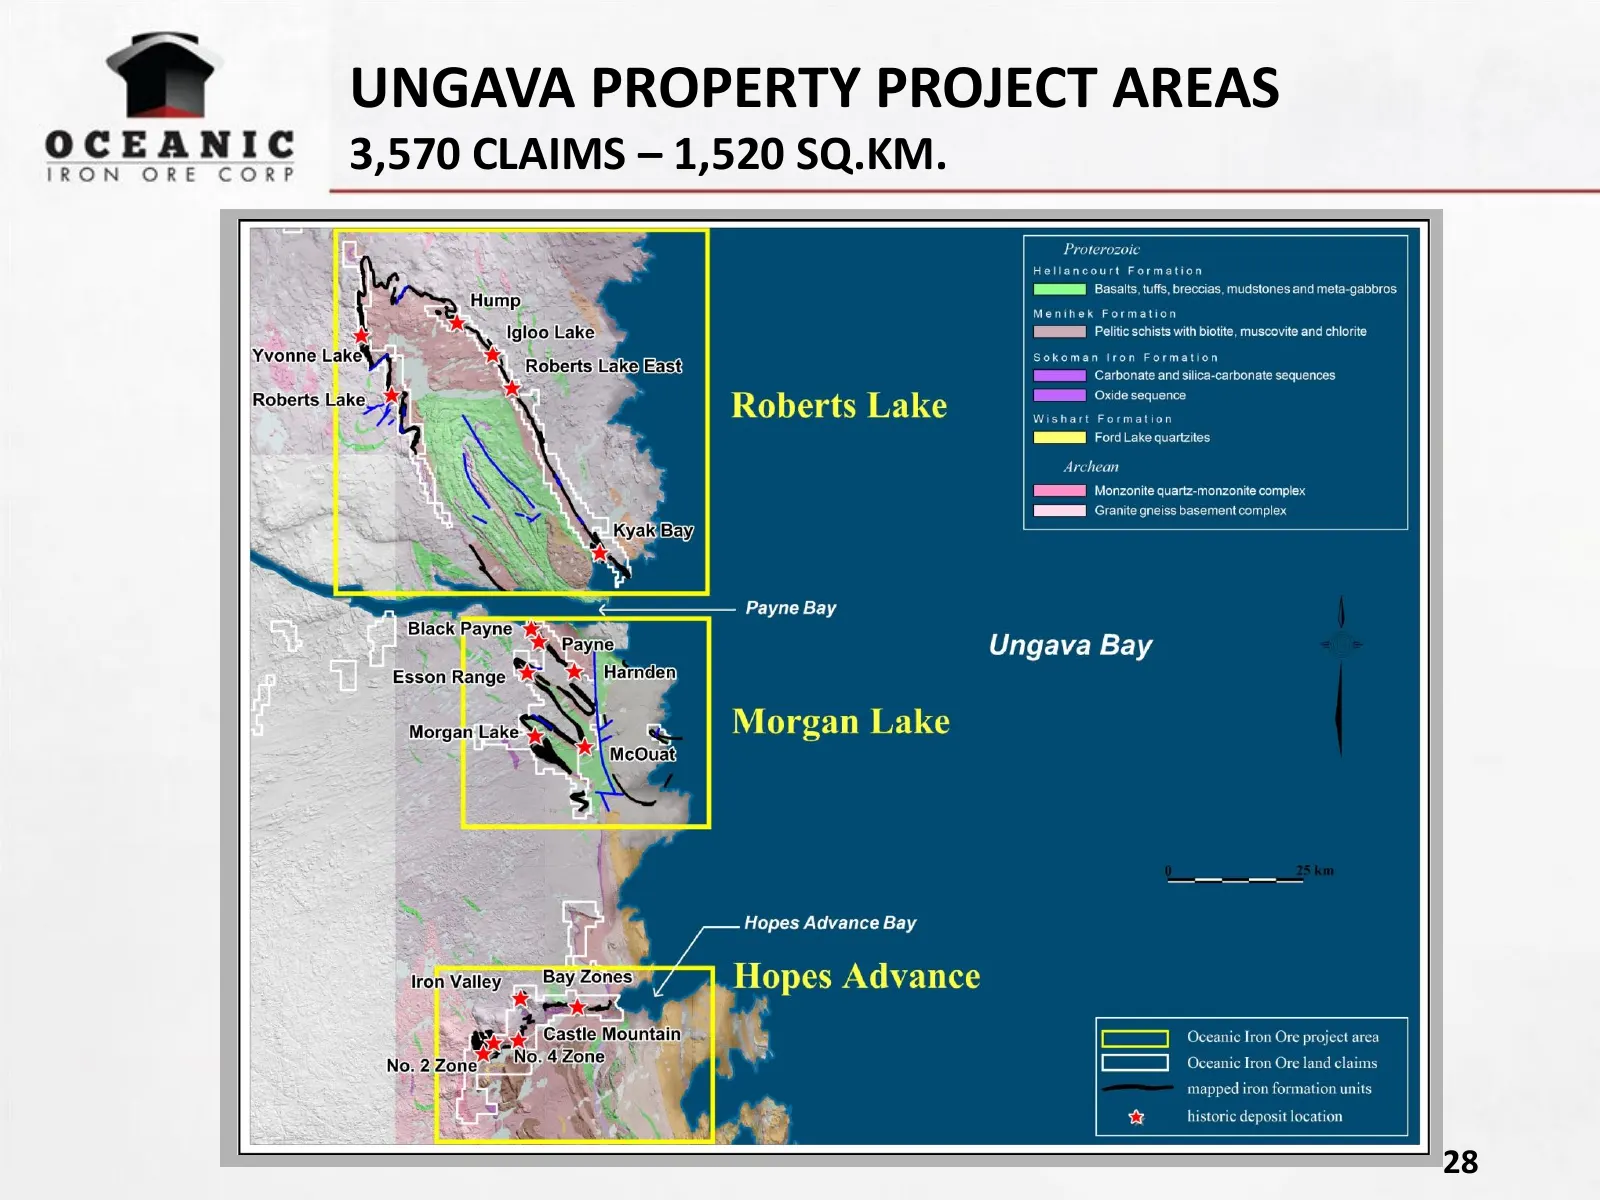
UNGAVA PROPERTY PROJECT AREAS 3,570 CLAIMS – 1,520 SQ.KM. 28
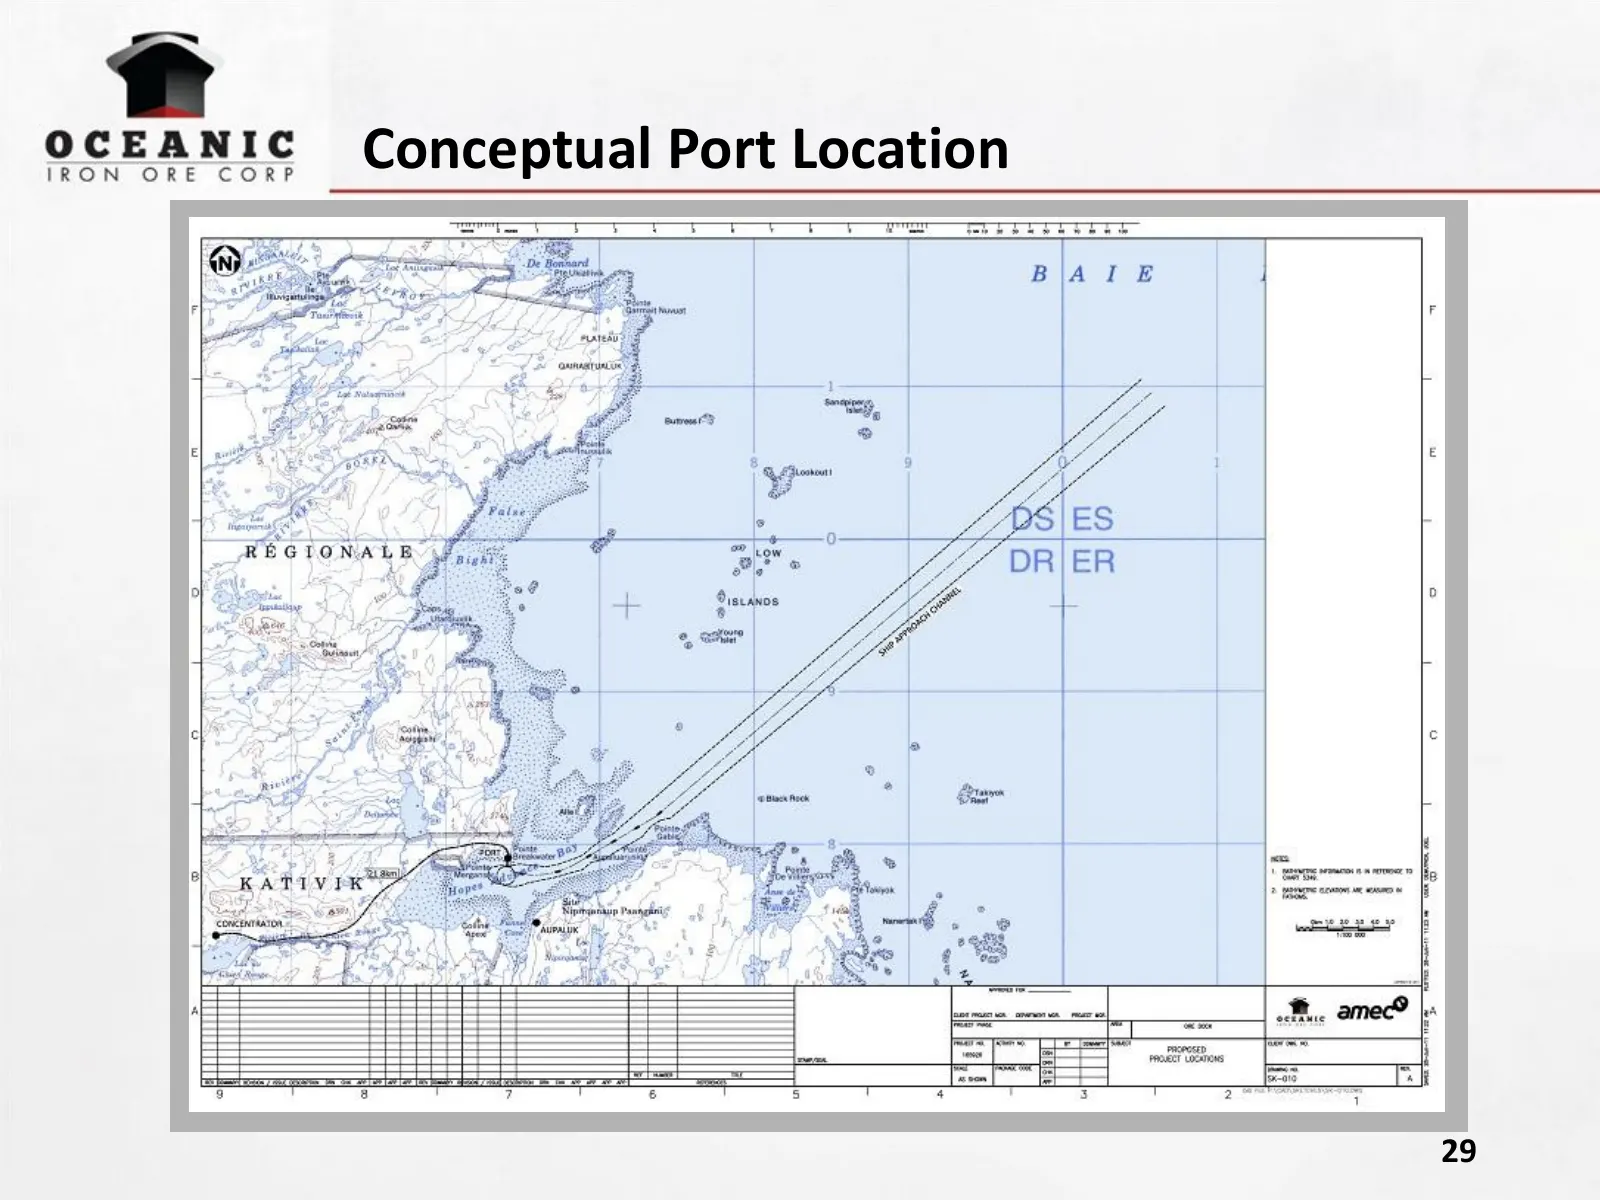
Slide 29: Conceptual Port Location
Conceptual Port Location 29
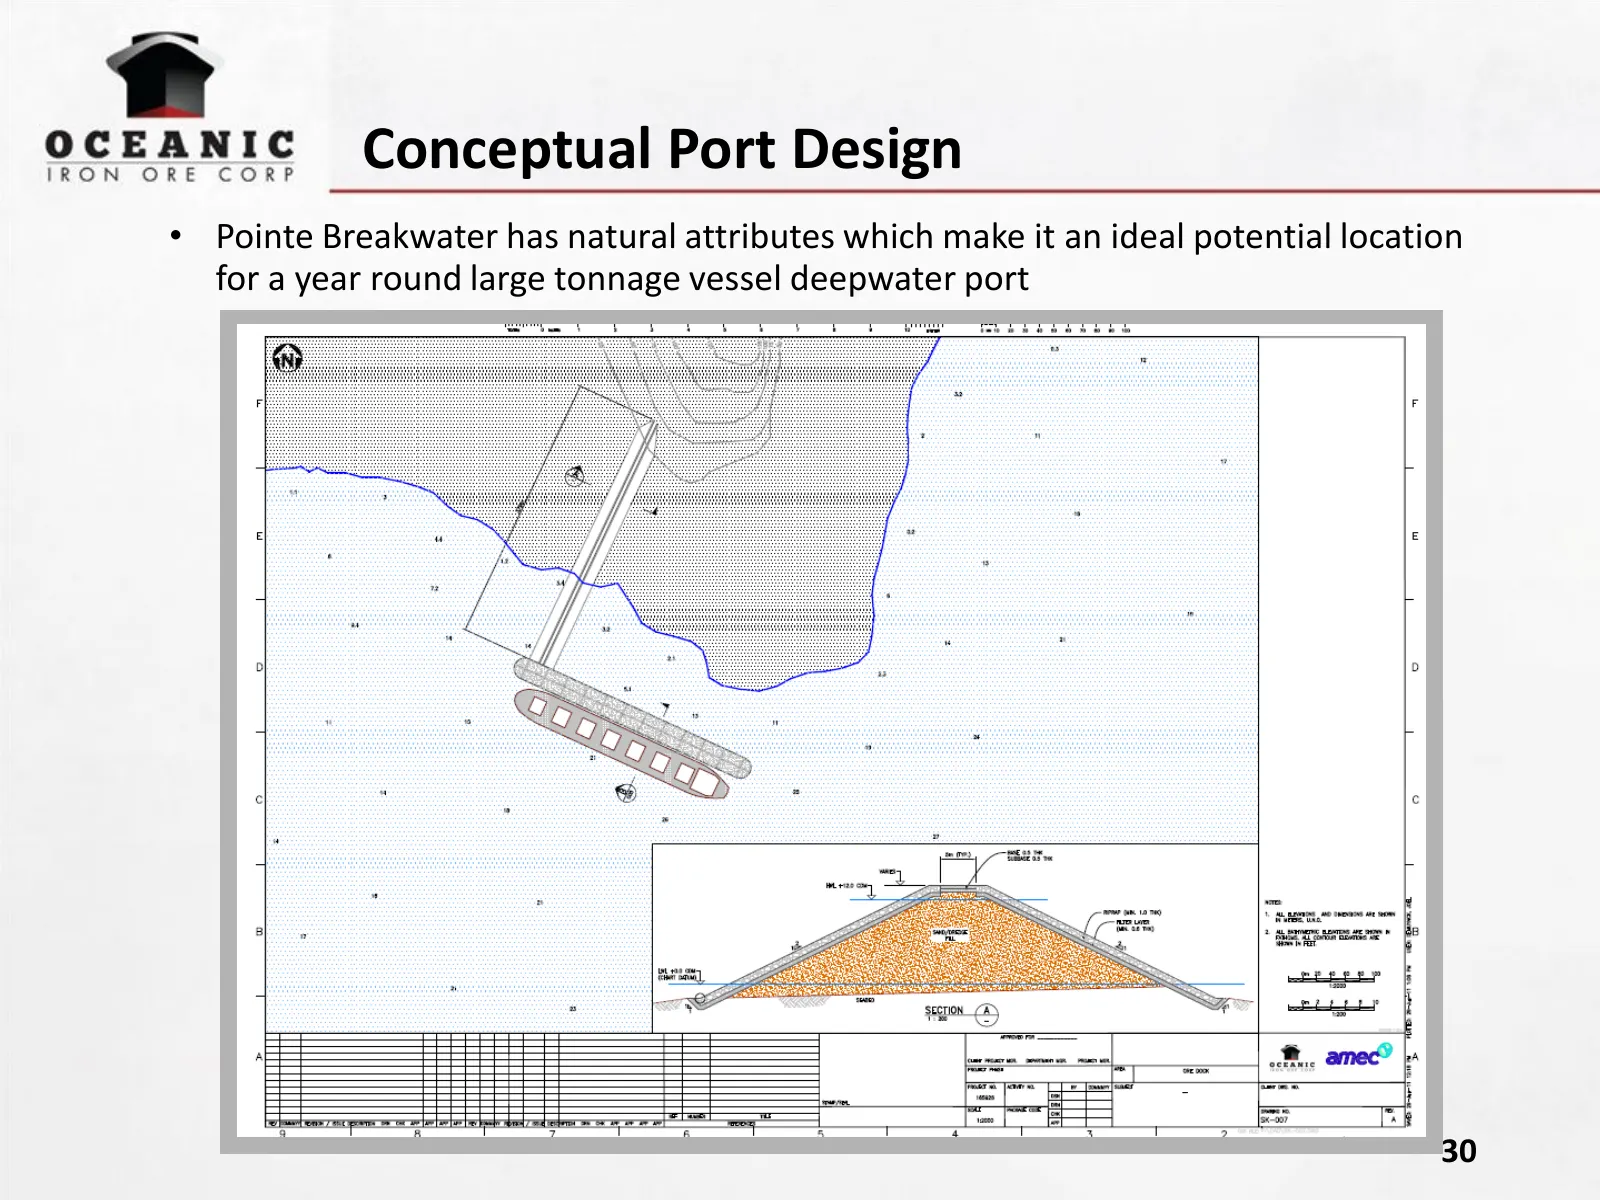
Slide 30: Conceptual Port Design
Conceptual Port Design • Pointe Breakwater has natural attributes which make it an ideal potential location for a year round large tonnage vessel deepwater port 30
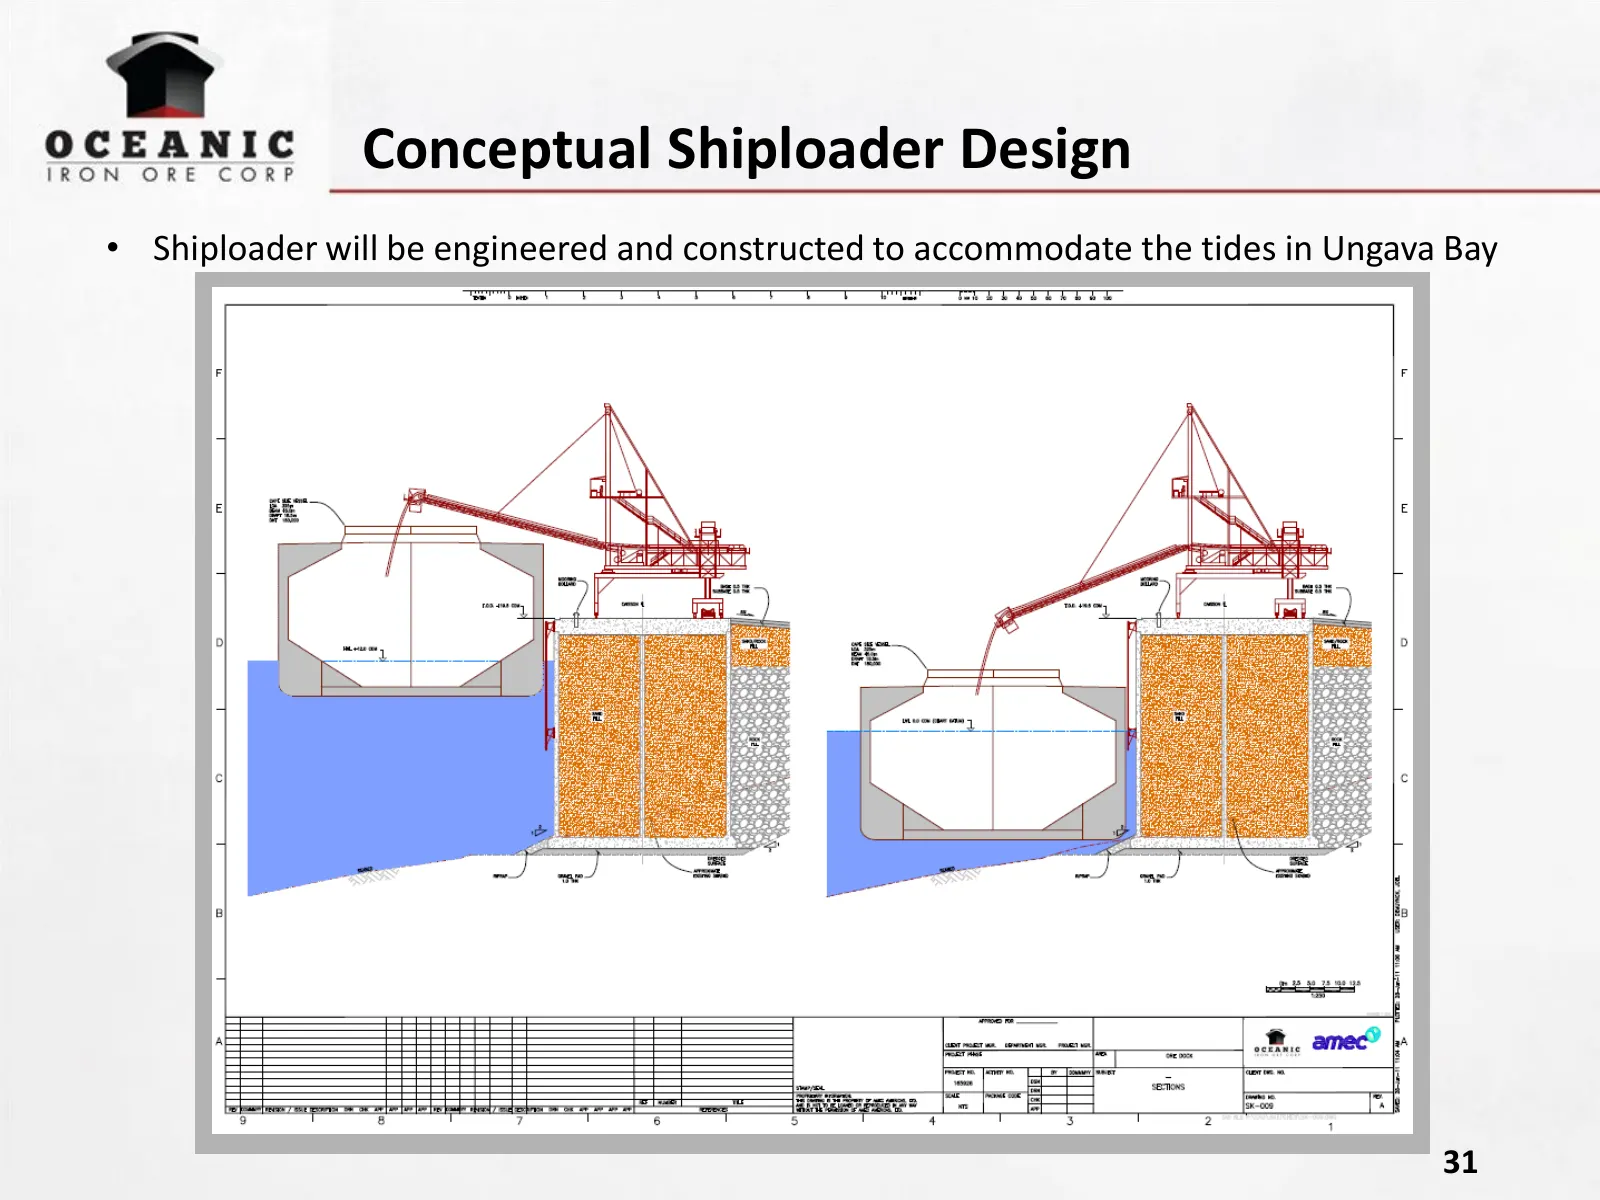
Slide 31: Conceptual Shiploader Design
Conceptual Shiploader Design • Shiploader will be engineered and constructed to accommodate the tides in Ungava Bay 31
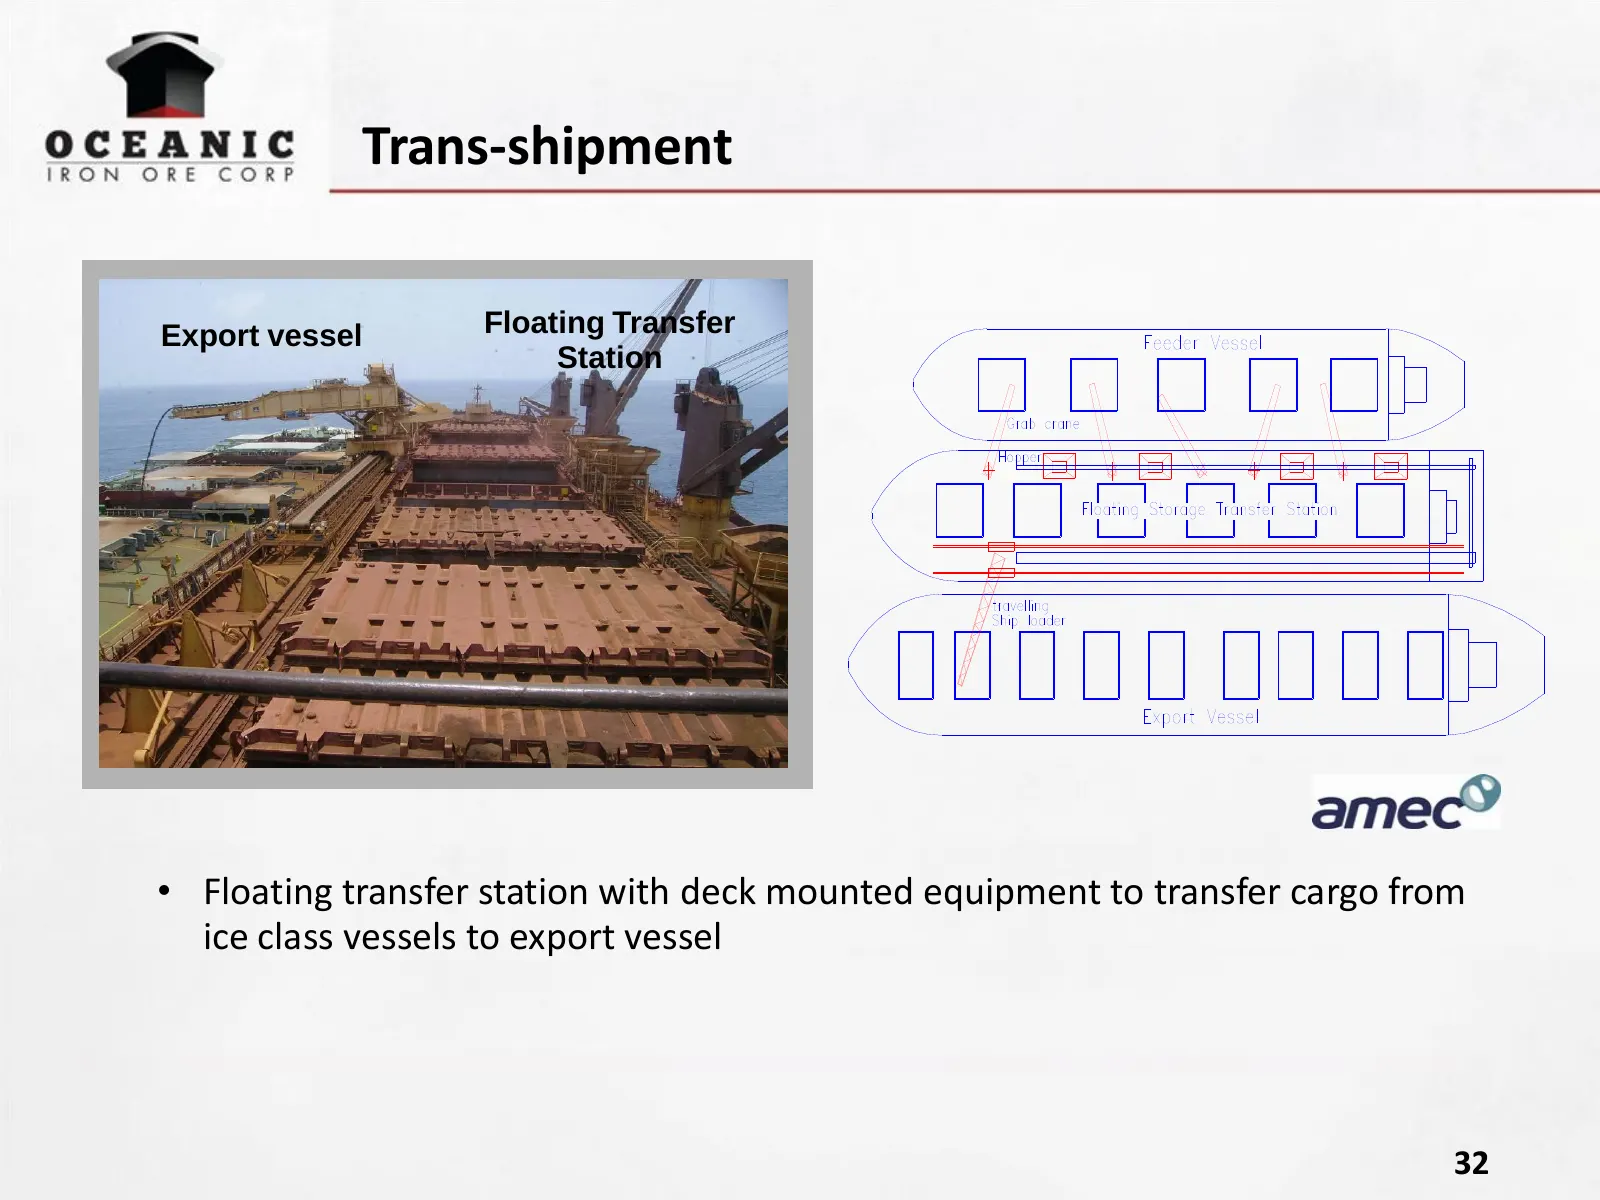
Slide 32: Trans-shipment
Trans-shipment Export vessel Floating Transfer Station • Floating transfer station with deck mounted equipment to transfer cargo from ice class vessels to export vessel 32
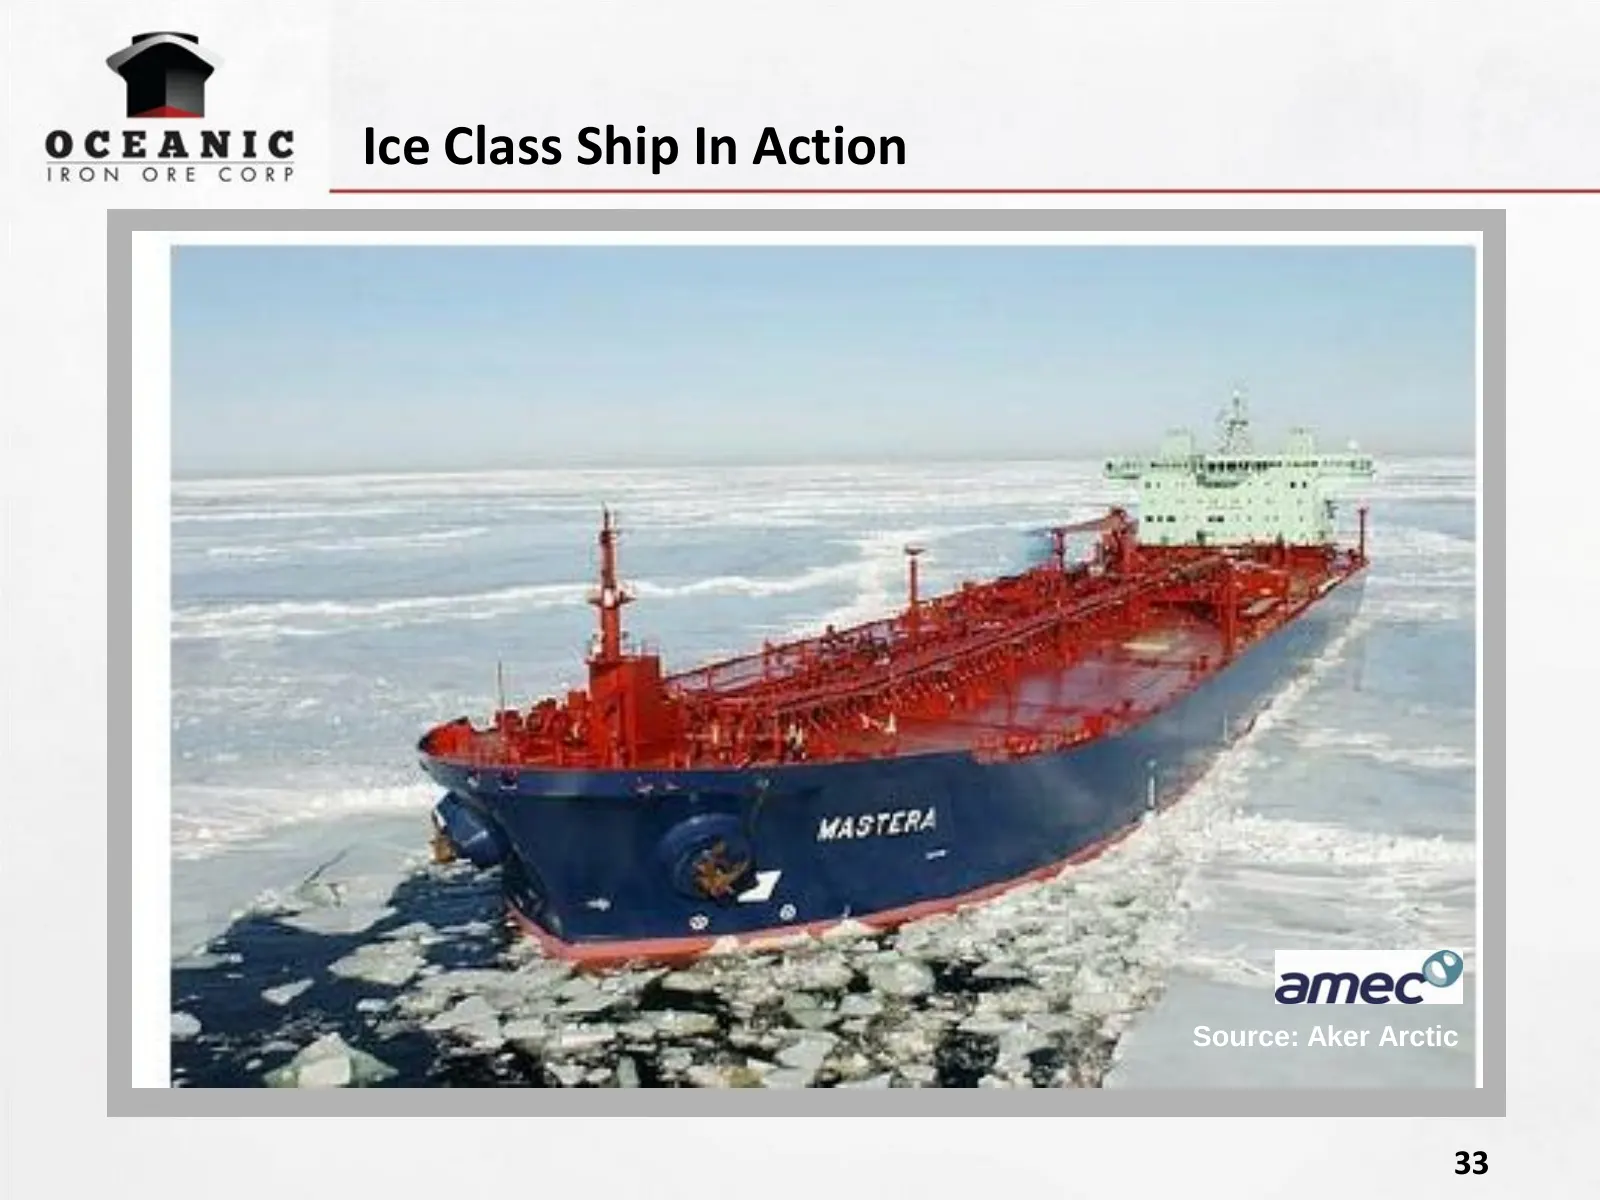
Slide 33: Ice Class Ship In Action
Ice Class Ship In Action Source: Aker Arctic 33
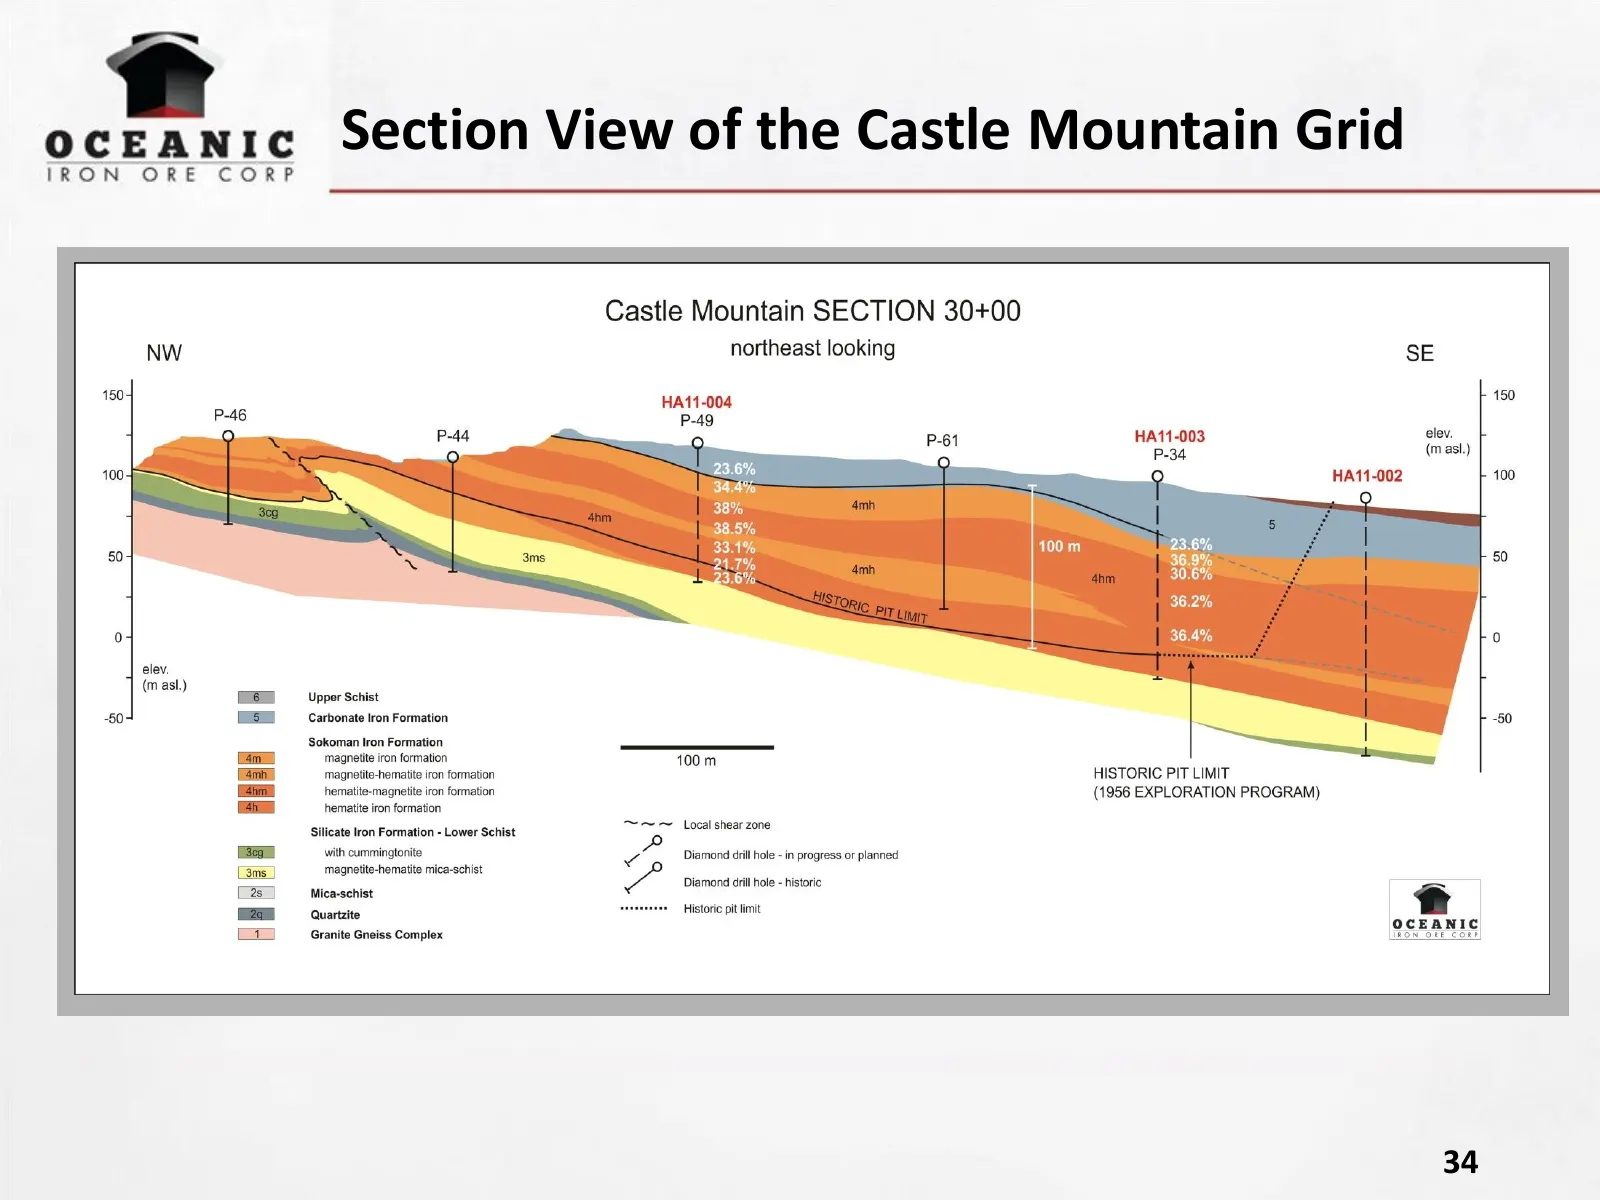
Slide 34: Section View of the Castle Mountain Grid
Section View of the Castle Mountain Grid 34
Slide 35: Previous Work
Previous Work • Labrador Trough noted for iron potential in 1895 by GSC • First claims staked in Hopes Advance area in 1951 • 1950-1970 active exploration including sampling, trenching, drilling, metallurgical testwork • Ungava Iron Ores Company completed most of the exploration in Hopes Advance are
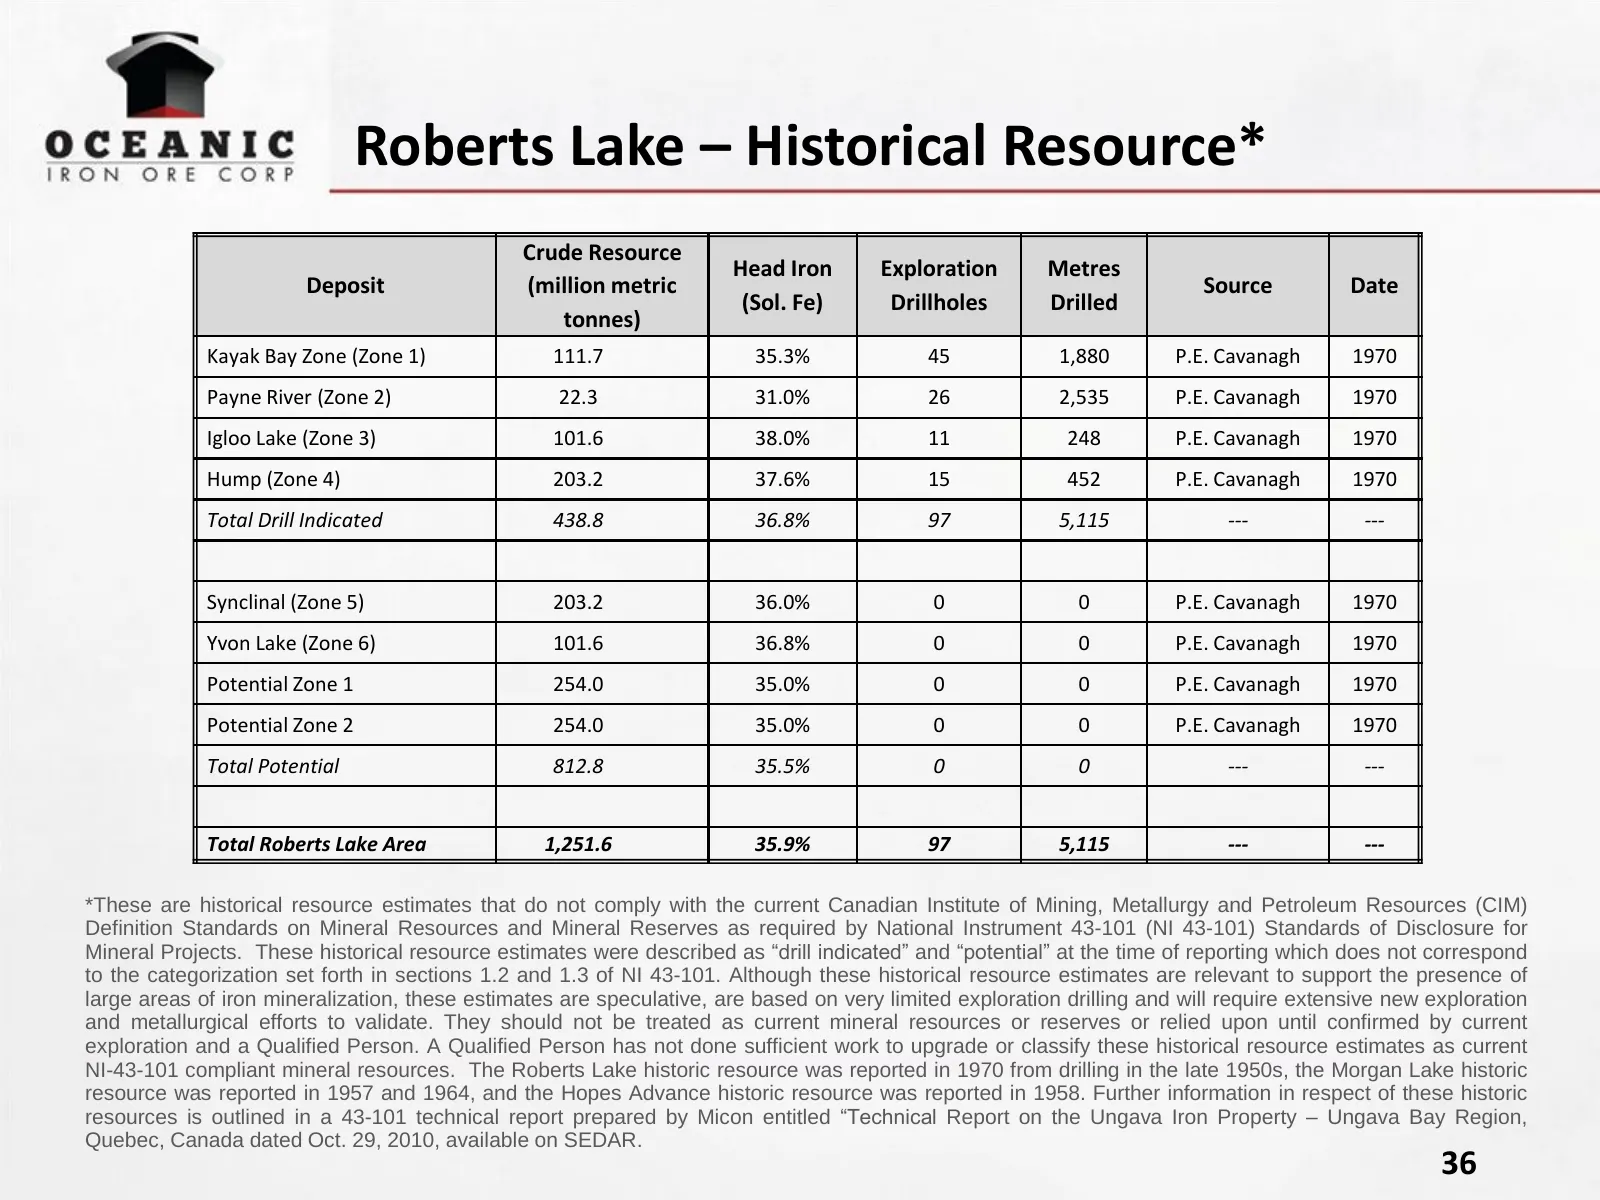
Slide 36: Roberts Lake – Historical Resource
Roberts Lake – Historical Resource* Crude Resource Head Iron Exploration Metres Deposit (million metric Source Date (Sol. Fe) Drillholes Drilled tonnes) Kayak Bay Zone (Zone 1) 111.7 35.3% 45 1,880 P.E. Cavanagh 1970 Payne River (Zone 2) 22.3 31.0% 26 2,535 P.E. Cavanagh 1970 Igloo Lake (Zone 3) 101
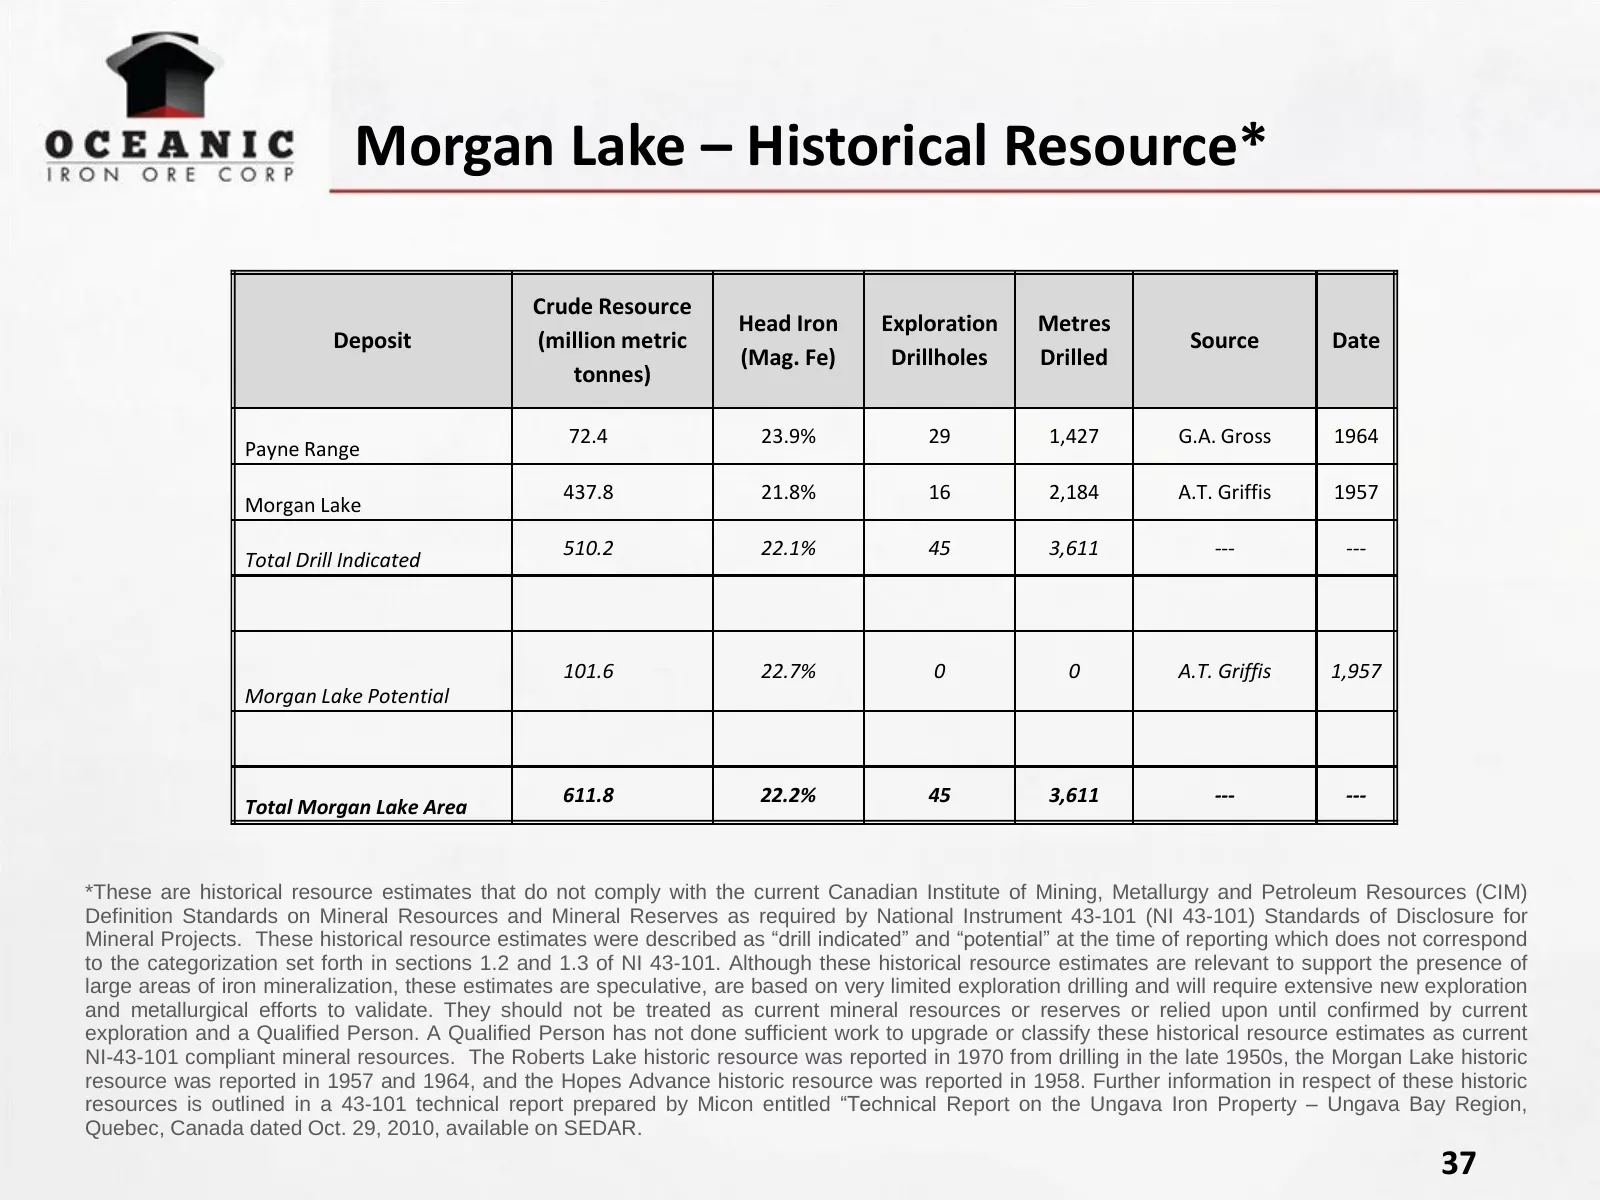
Slide 37: Morgan Lake – Historical Resource
Morgan Lake – Historical Resource* Crude Resource Head Iron Exploration Metres Deposit (million metric Source Date (Mag. Fe) Drillholes Drilled tonnes) 72.4 23.9% 29 1,427 G.A. Gross 1964 Payne Range 437.8 21.8% 16 2,184 A.T. Griffis 1957 Morgan Lake 510.2 22.1% 45 3,611 --- --- Total Drill Indicate
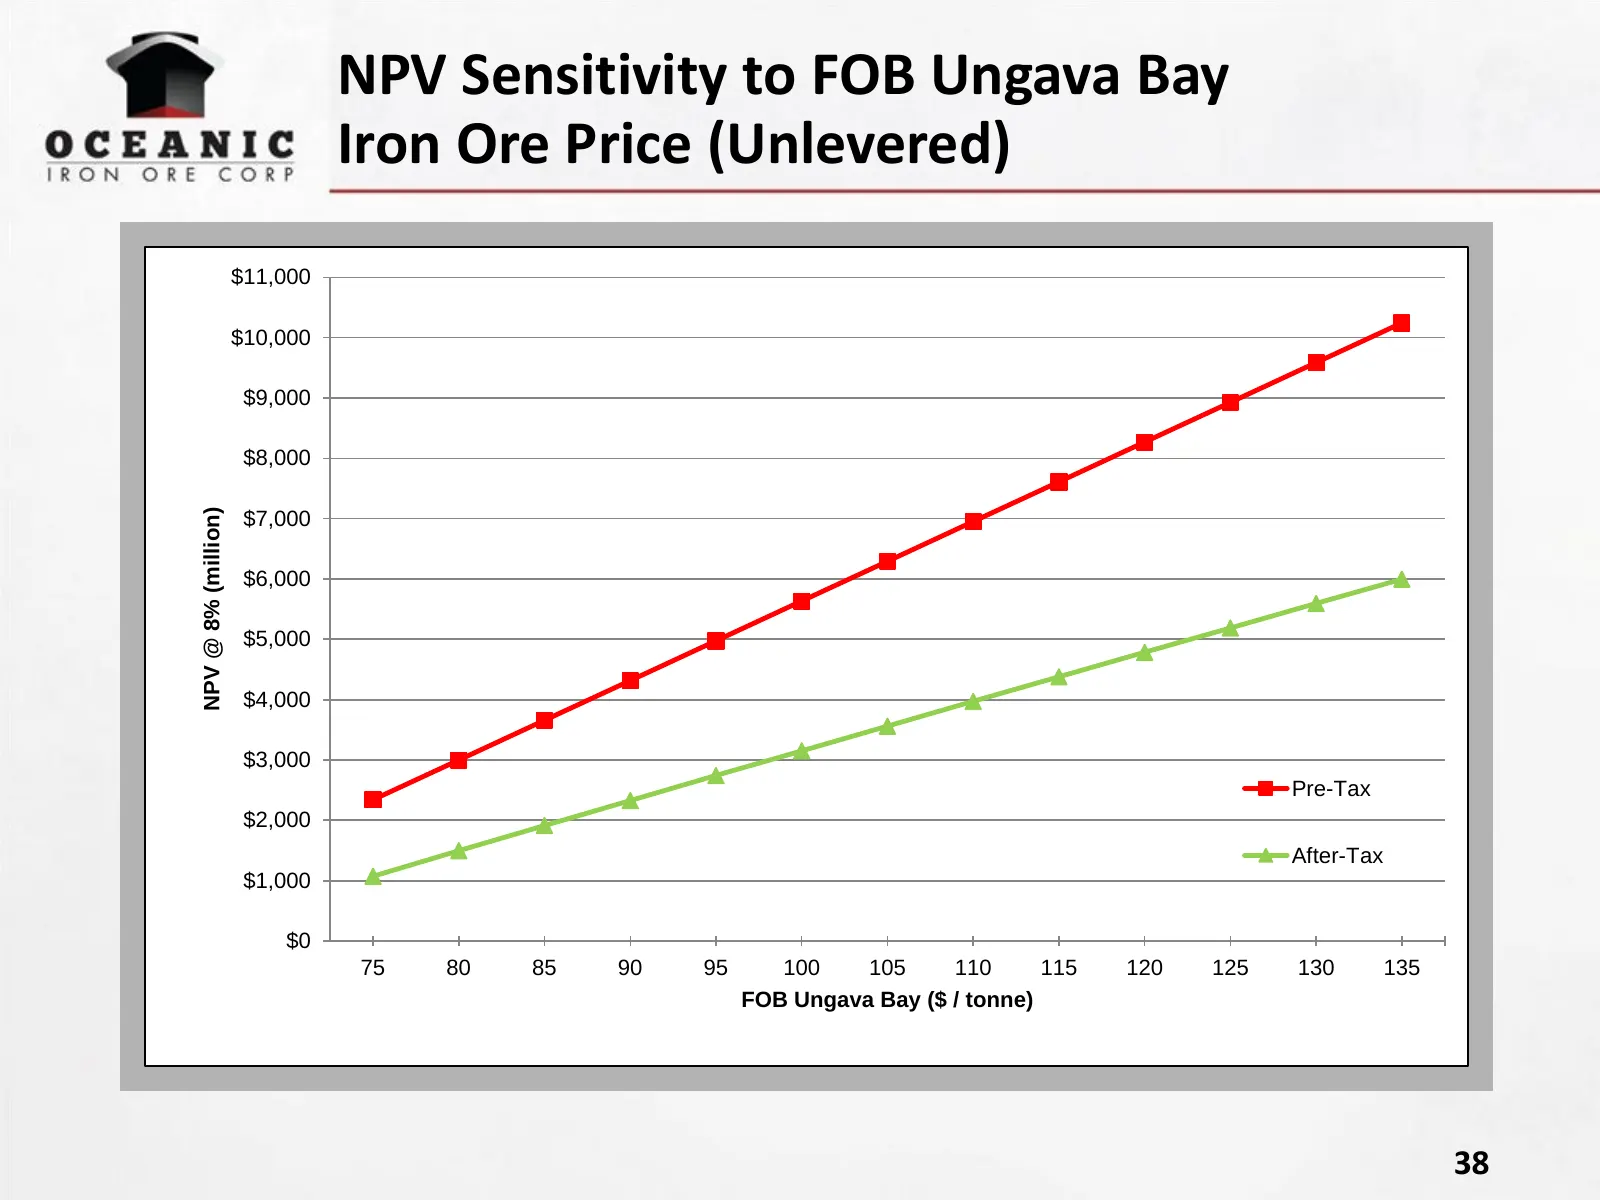
Slide 38: NPV Sensitivity to FOB Ungava Bay Iron Ore Price
NPV Sensitivity to FOB Ungava Bay Iron Ore Price (Unlevered) $11,000 $10,000 $9,000 $8,000 NPV @ 8% (million) $7,000 $6,000 $5,000 $4,000 $3,000 Pre-Tax $2,000 After-Tax $1,000 $0 75 80 85 90 95 100 105 110 115 120 125 130 135 FOB Ungava Bay ($ / tonne) 38
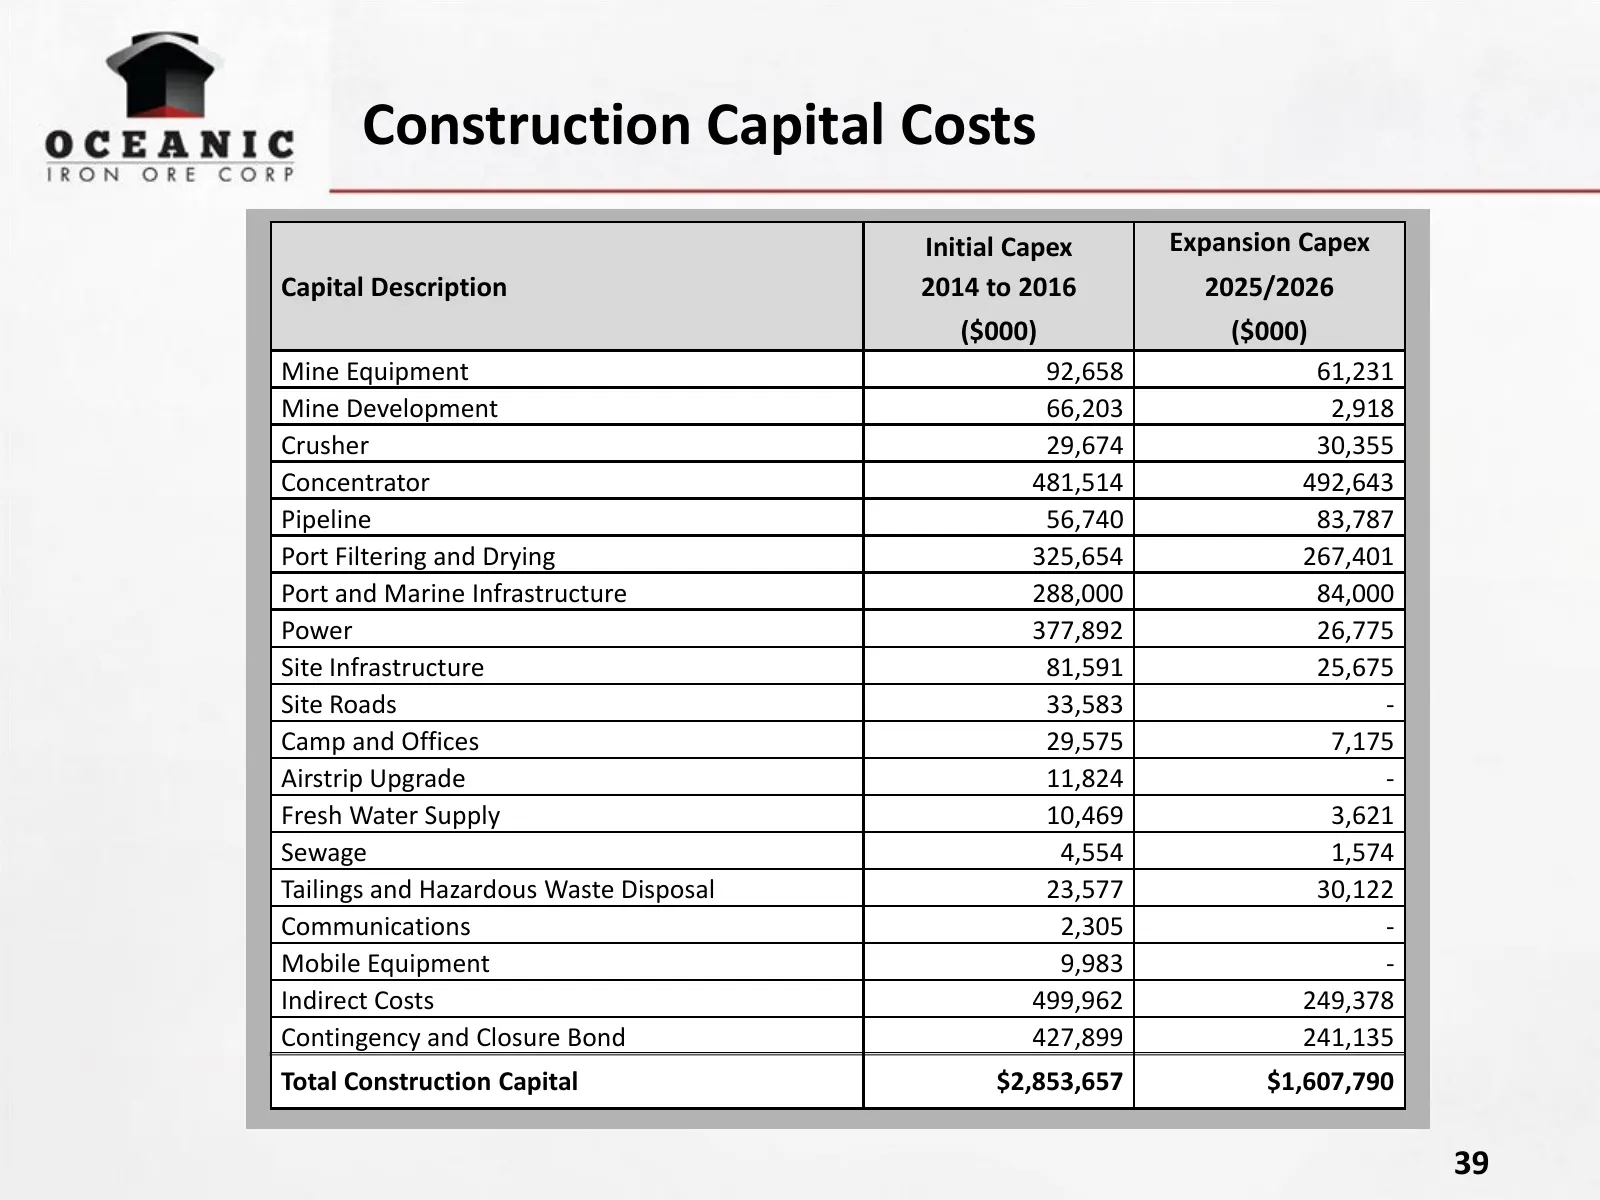
Slide 39: Construction Capital Costs
Construction Capital Costs Initial Capex Expansion Capex Capital Description 2014 to 2016 2025/2026 ($000) ($000) Mine Equipment 92,658 61,231 Mine Development 66,203 2,918 Crusher 29,674 30,355 Concentrator 481,514 492,643 Pipeline 56,740 83,787 Port Filtering and Drying 325,654 267,401 Port and Ma
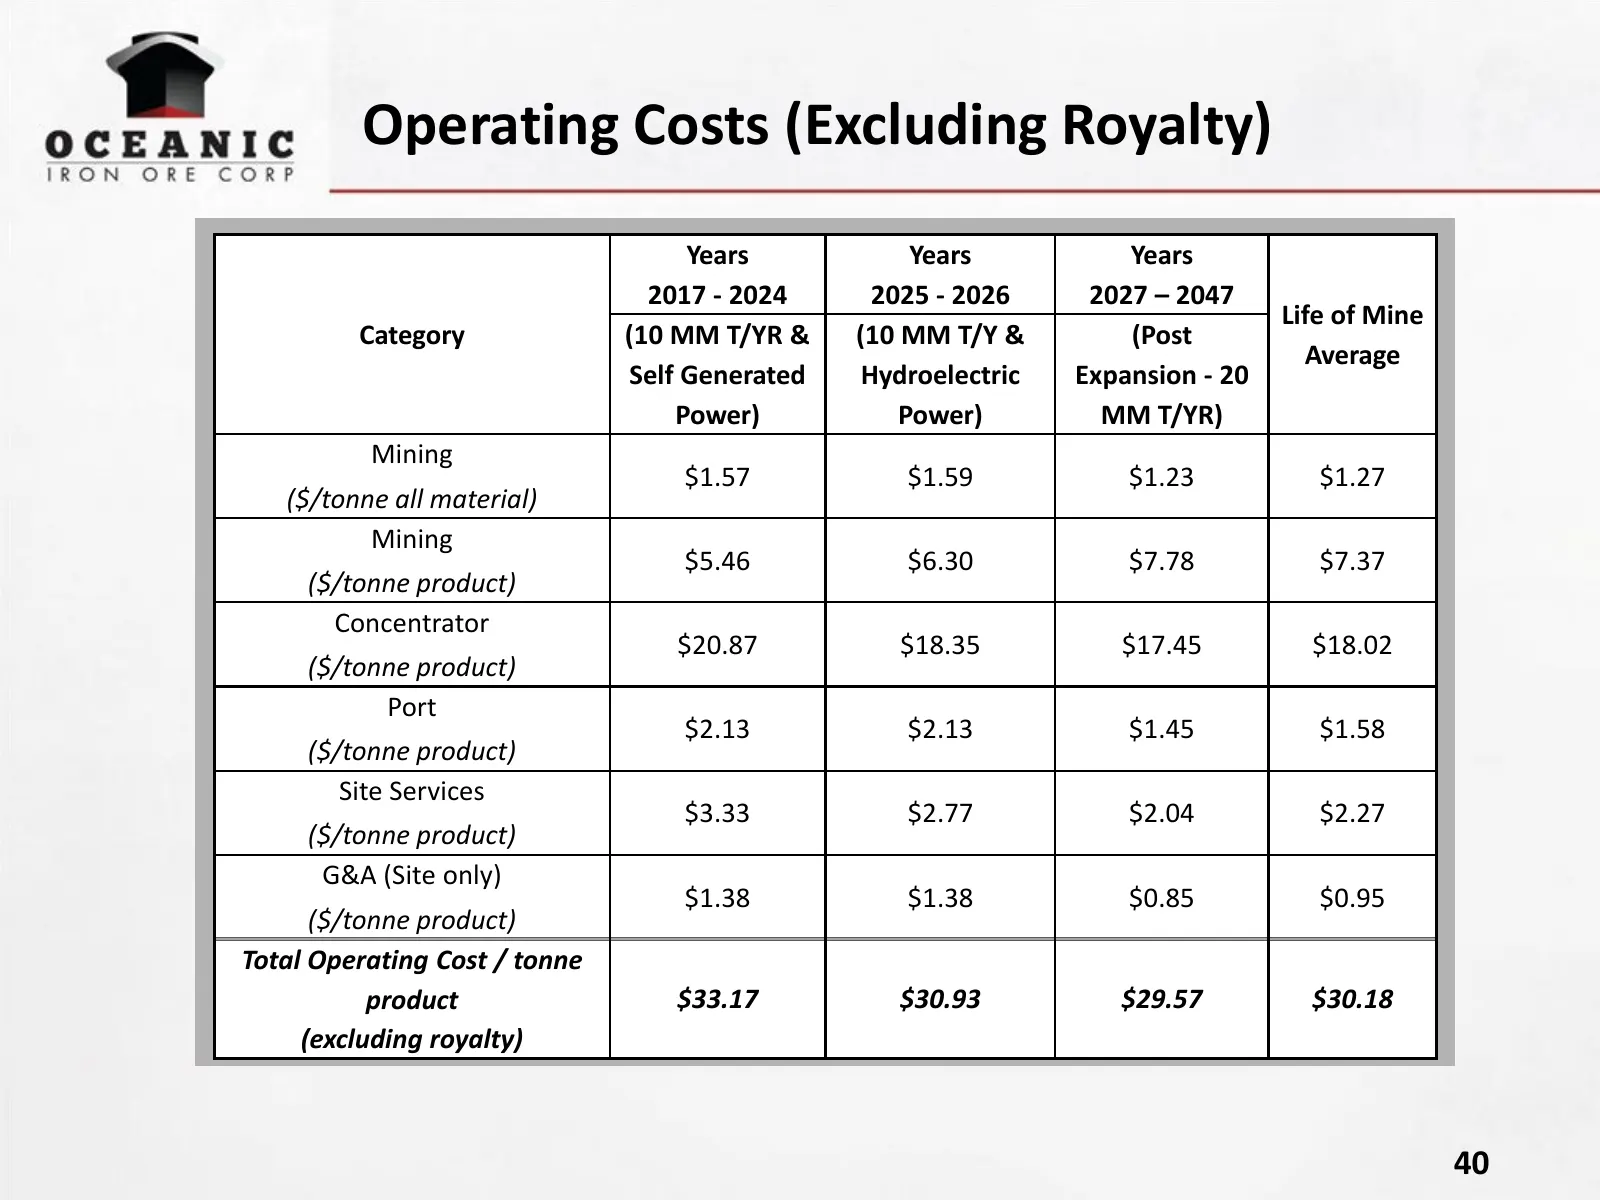
Slide 40: Operating Costs (Excluding Royalty)
Operating Costs (Excluding Royalty) Years Years Years 2017 - 2024 2025 - 2026 2027 – 2047 Life of Mine Category (10 MM T/YR & (10 MM T/Y & (Post Average Self Generated Hydroelectric Expansion - 20 Power) Power) MM T/YR) Mining $1.57 $1.59 $1.23 $1.27 ($/tonne all material) Mining $5.46 $6.30 $7.78 $
Slide 41: Oceanic Iron Ore Corp.
fn OCEANIC IRON -ORE. CORP WWW.OCEANICIRONORE.COM TSX:V-FEO OTCQX - FEOVF
Source: Internet Archive copy of oceanicironore.com
More decks from Oceanic Iron Ore Corp.
 Investor Presentation (October 2026)26 slides · October 2026
 Investor Presentation (September 2026)26 slides · September 2026
 Investor Presentation (October 2025)26 slides · October 2025
 Investor Presentation (June 2021)26 slides · June 2021
 Investor Presentation (April 2017)47 slides · Apr 18, 2017
 Investor Presentation (April 2017)47 slides · Apr 18, 2017