Oceanic Iron Ore Corp. · TSXV:FEO
Oceanic Iron Ore — Investor Presentation (June 2021)
26 slides from Oceanic Iron Ore's investor presentation, June 2021
Slide 1: Investor Presentation
Investor Presentation June 2021
Slide 2: Cautionary Notes
Cautionary Notes This presentation includes certain "Forward-Looking Statements” as that term is used in applicable securities law. All statements included herein, other than statements of historical fact, including, without limitation, statements regarding potential mineralization and resources, ex
Slide 3: Corporate Overview
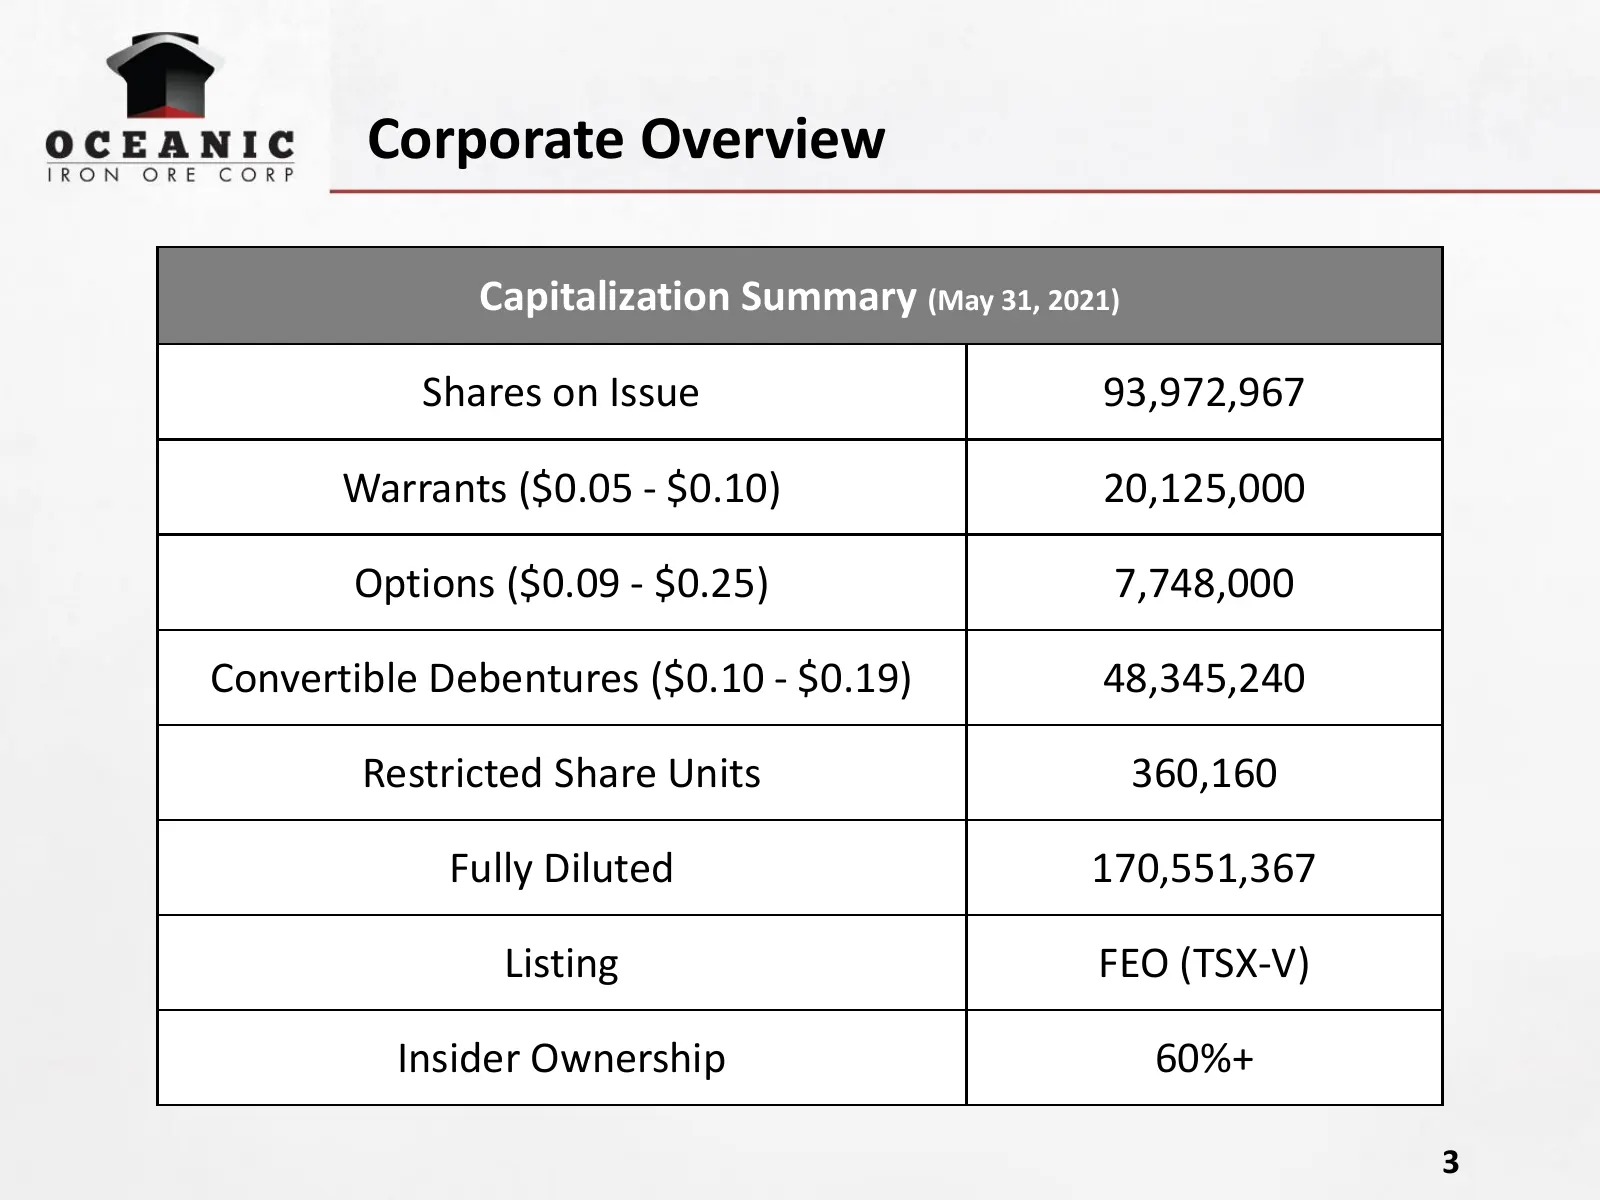
Corporate Overview Capitalization Summary (May 31, 2021) Shares on Issue 93,972,967 Warrants ($0.05 - $0.10) 20,125,000 Options ($0.09 - $0.25) 7,748,000 Convertible Debentures ($0.10 - $0.19) 48,345,240 Restricted Share Units 360,160 Fully Diluted 170,551,367 Listing FEO (TSX-V) Insider Ownership 6
Slide 4: Company Overview
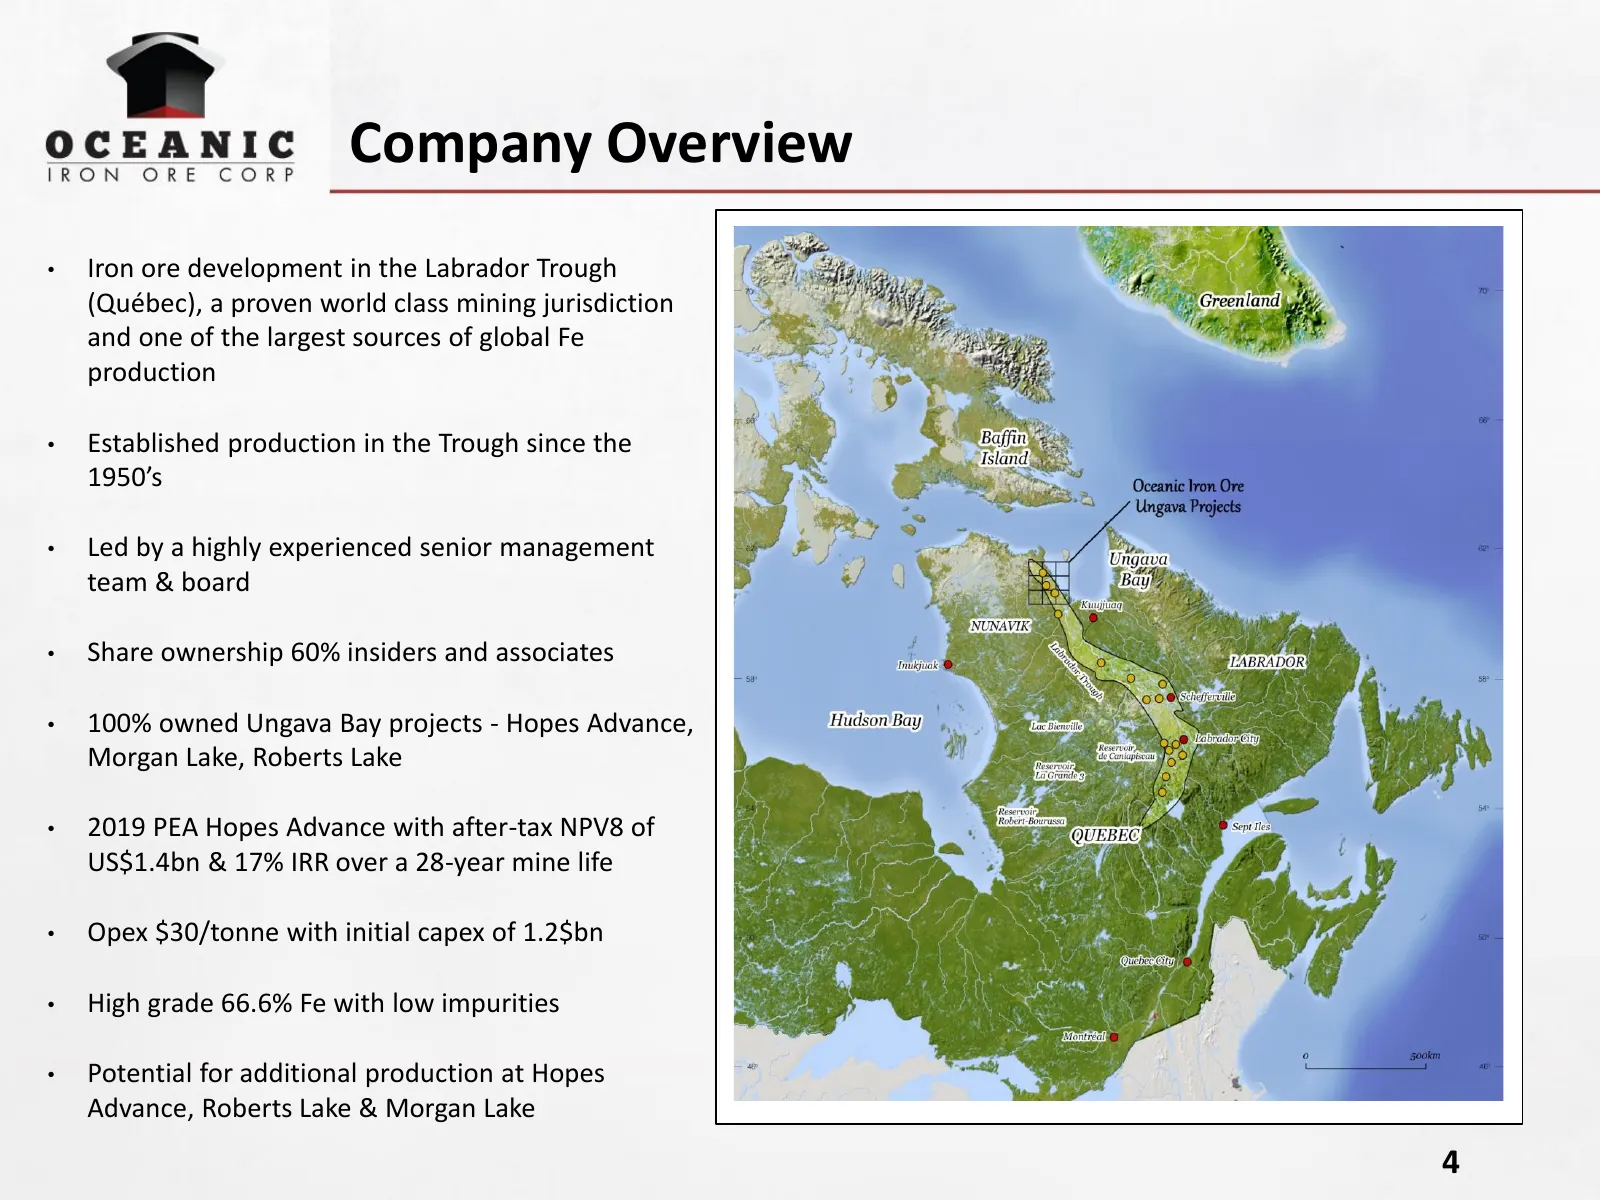
Company Overview • Iron ore development in the Labrador Trough (Québec), a proven world class mining jurisdiction and one of the largest sources of global Fe production • Established production in the Trough since the 1950’s • Led by a highly experienced senior management team & board • Share owners
Slide 5: Hopes Advance – A Premier High Quality, Low Cost Iron Ore Project in North America
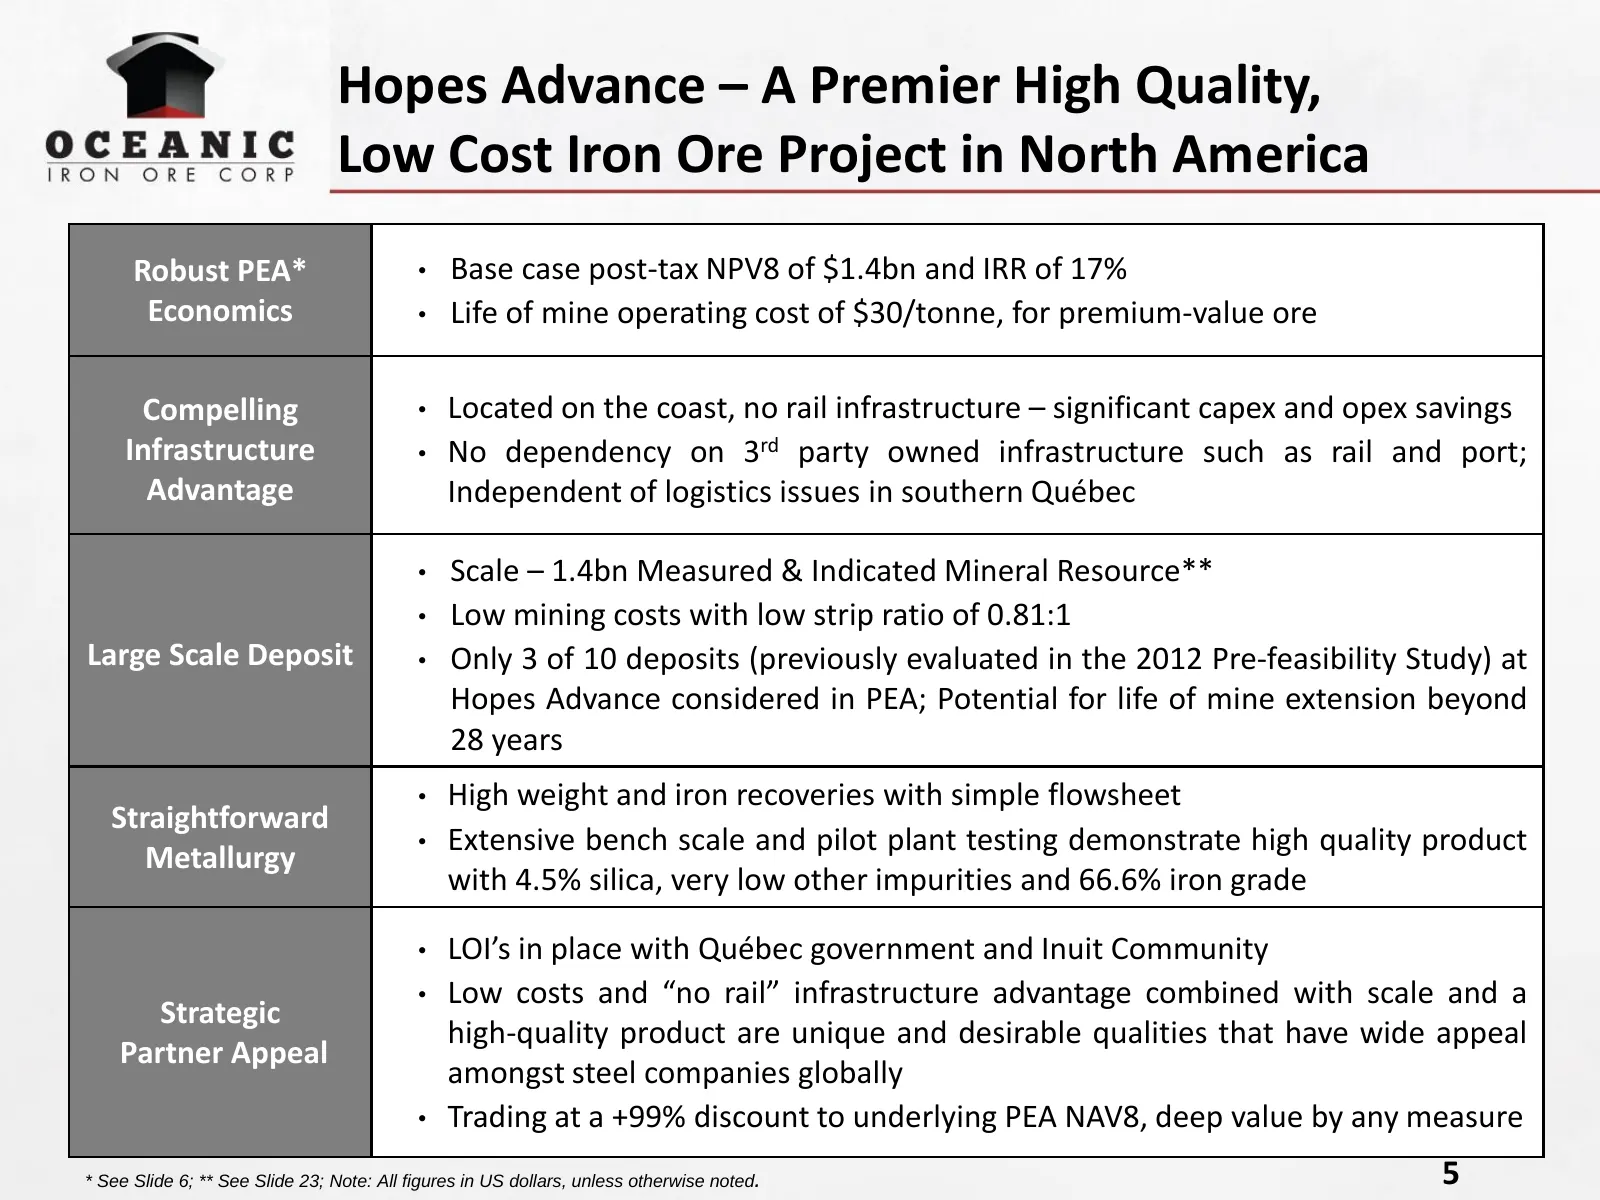
Hopes Advance – A Premier High Quality, Low Cost Iron Ore Project in North America Robust PEA* • Base case post-tax NPV8 of $1.4bn and IRR of 17% Economics • Life of mine operating cost of $30/tonne, for premium-value ore Compelling • Located on the coast, no rail infrastructure – significant capex
Slide 6: Hopes Advance Re-scoped PEA (December 2019)
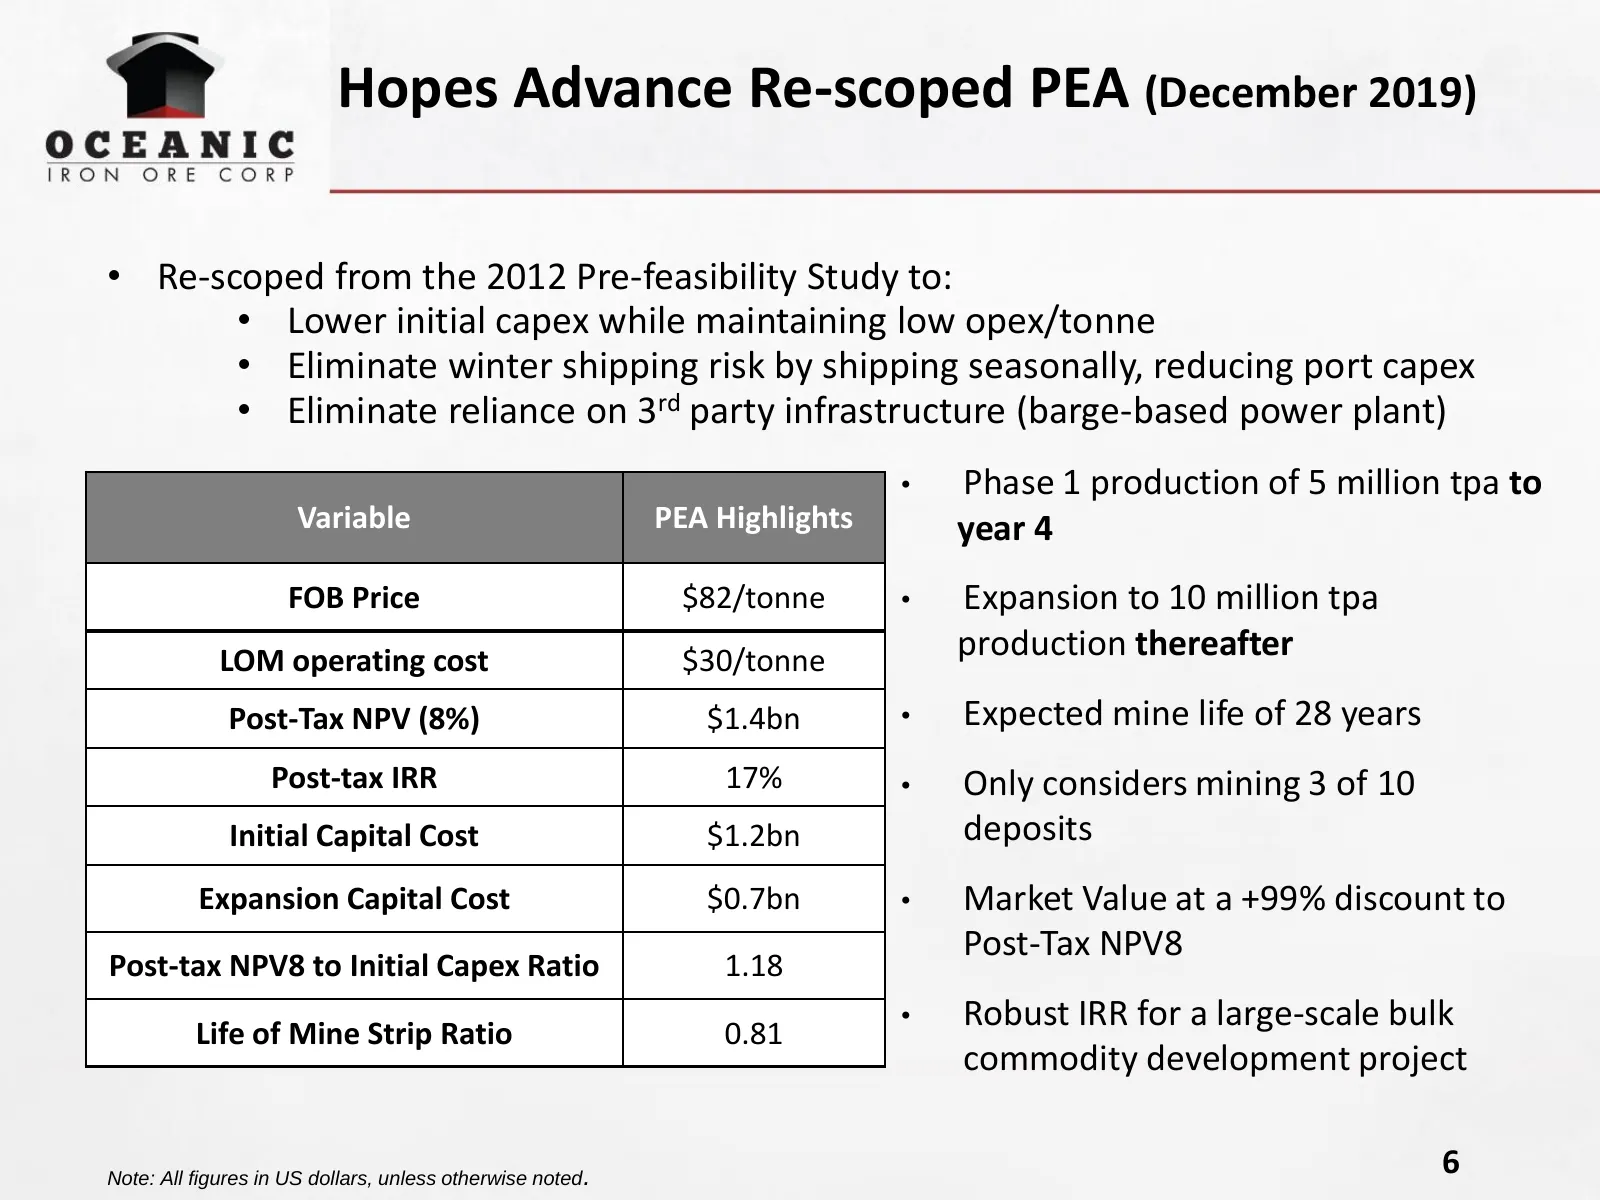
Hopes Advance Re-scoped PEA (December 2019) • Re-scoped from the 2012 Pre-feasibility Study to: • Lower initial capex while maintaining low opex/tonne • Eliminate winter shipping risk by shipping seasonally, reducing port capex • Eliminate reliance on 3rd party infrastructure (barge-based power plan
Slide 7: Global Steel Production Outlook
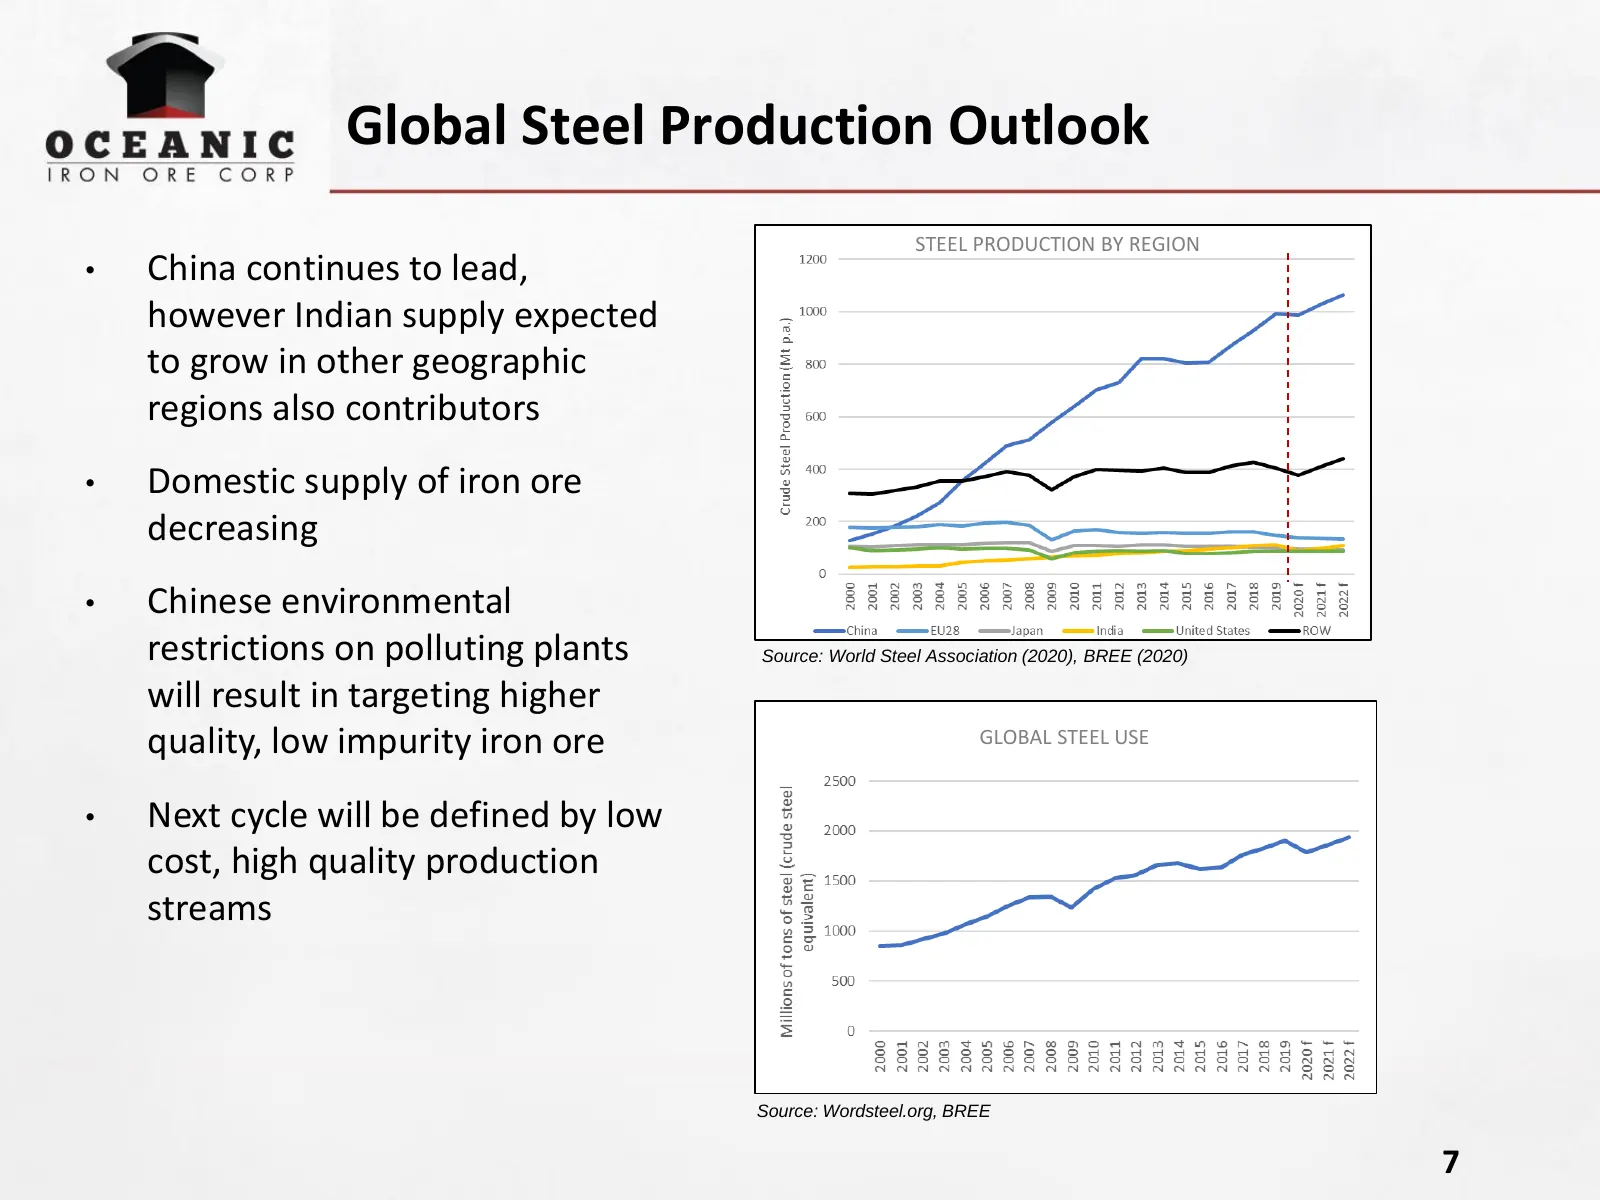
Global Steel Production Outlook STEEL PRODUCTION BY REGION • China continues to lead, however Indian supply expected to grow in other geographic regions also contributors • Domestic supply of iron ore decreasing • Chinese environmental restrictions on polluting plants Source: World Steel Association
Slide 8: Structural Shift In Iron Ore - High Quality & Low Contaminant Product in Rising Demand
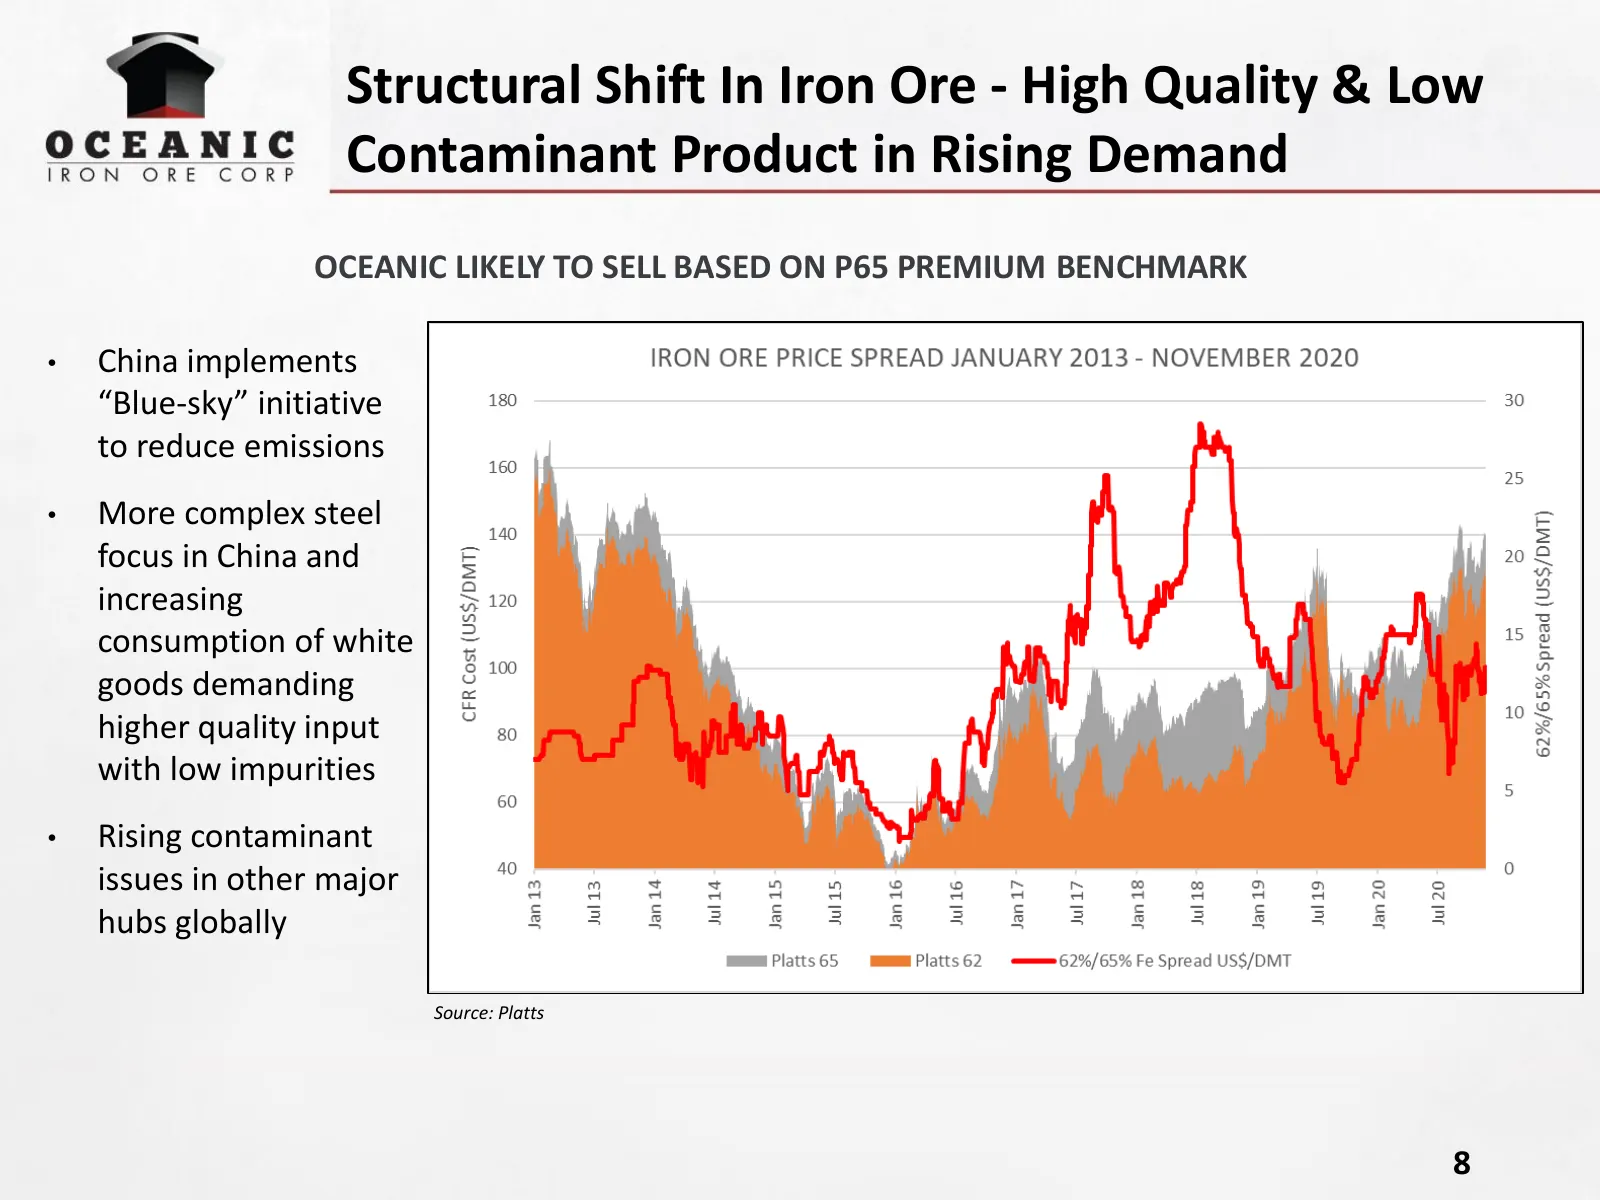
Structural Shift In Iron Ore - High Quality & Low Contaminant Product in Rising Demand OCEANIC LIKELY TO SELL BASED ON P65 PREMIUM BENCHMARK • China implements “Blue-sky” initiative to reduce emissions • More complex steel focus in China and increasing consumption of white goods demanding higher qua
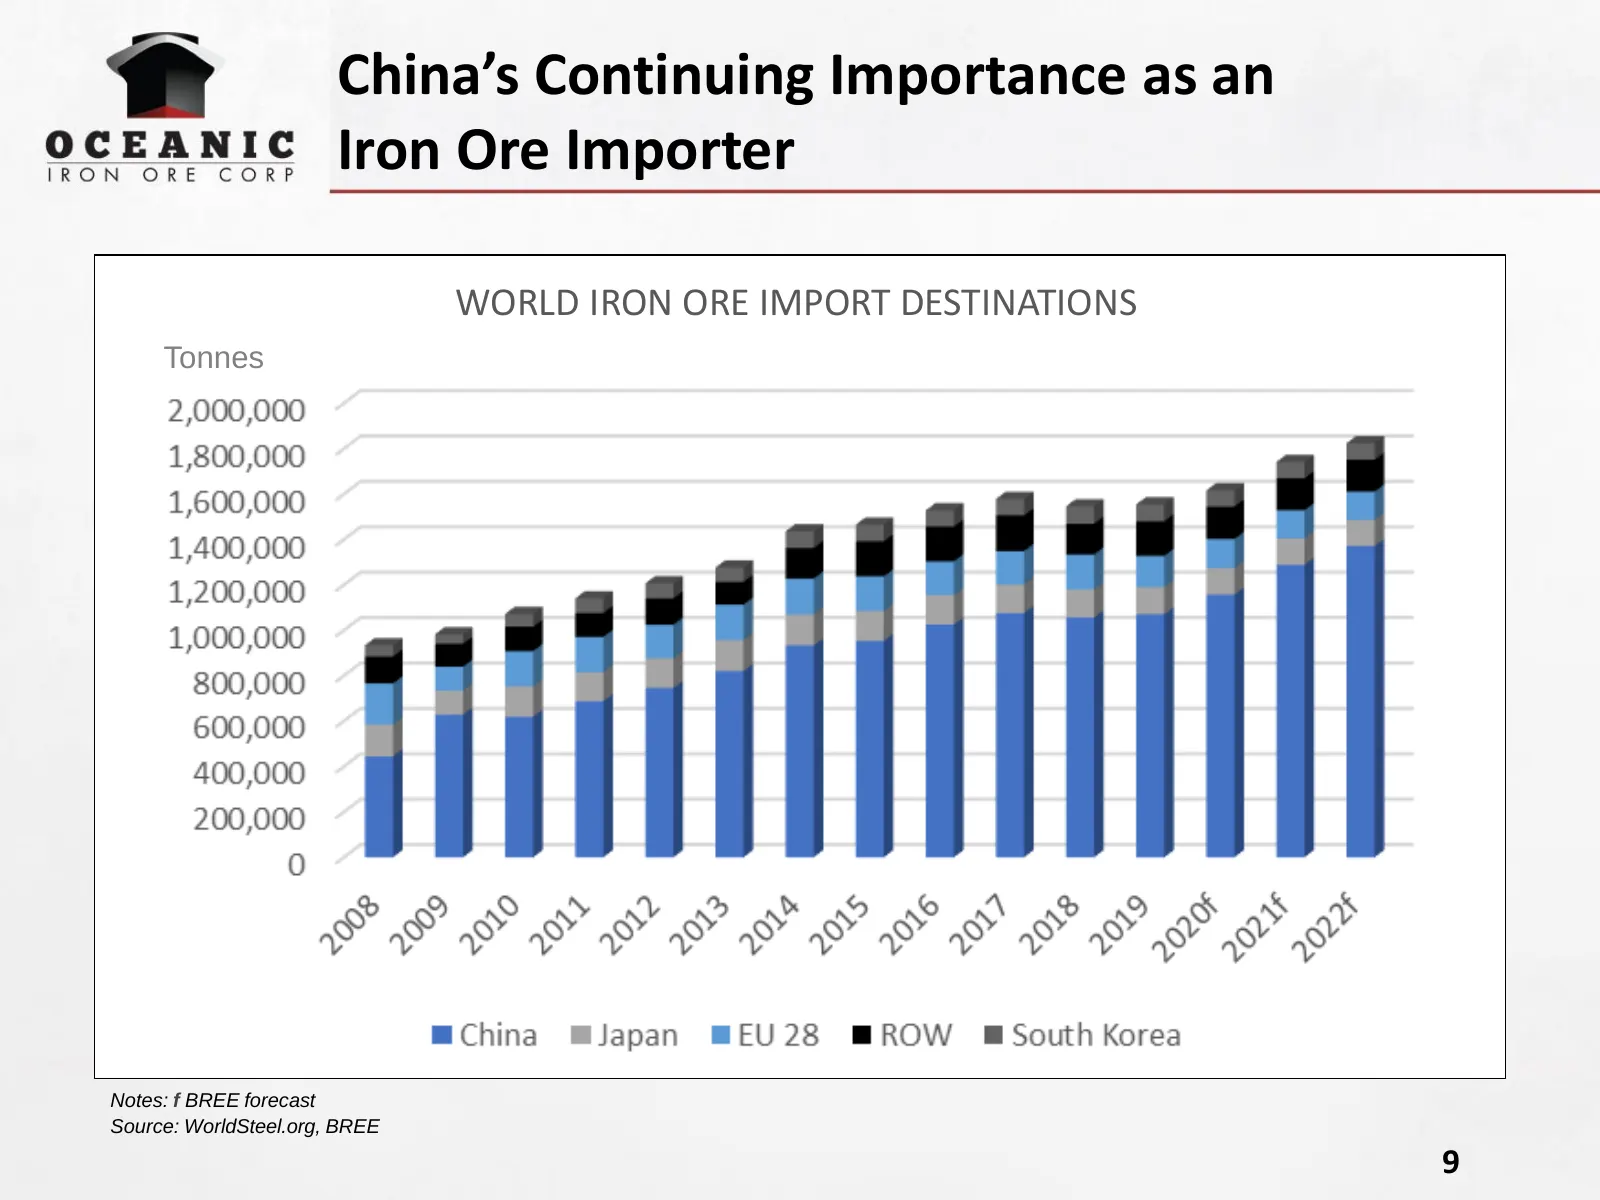
Slide 9: China’s Continuing Importance as an Iron Ore Importer
China’s Continuing Importance as an Iron Ore Importer WORLD IRON ORE IMPORT DESTINATIONS Tonnes Notes: f BREE forecast Source: WorldSteel.org, BREE 9
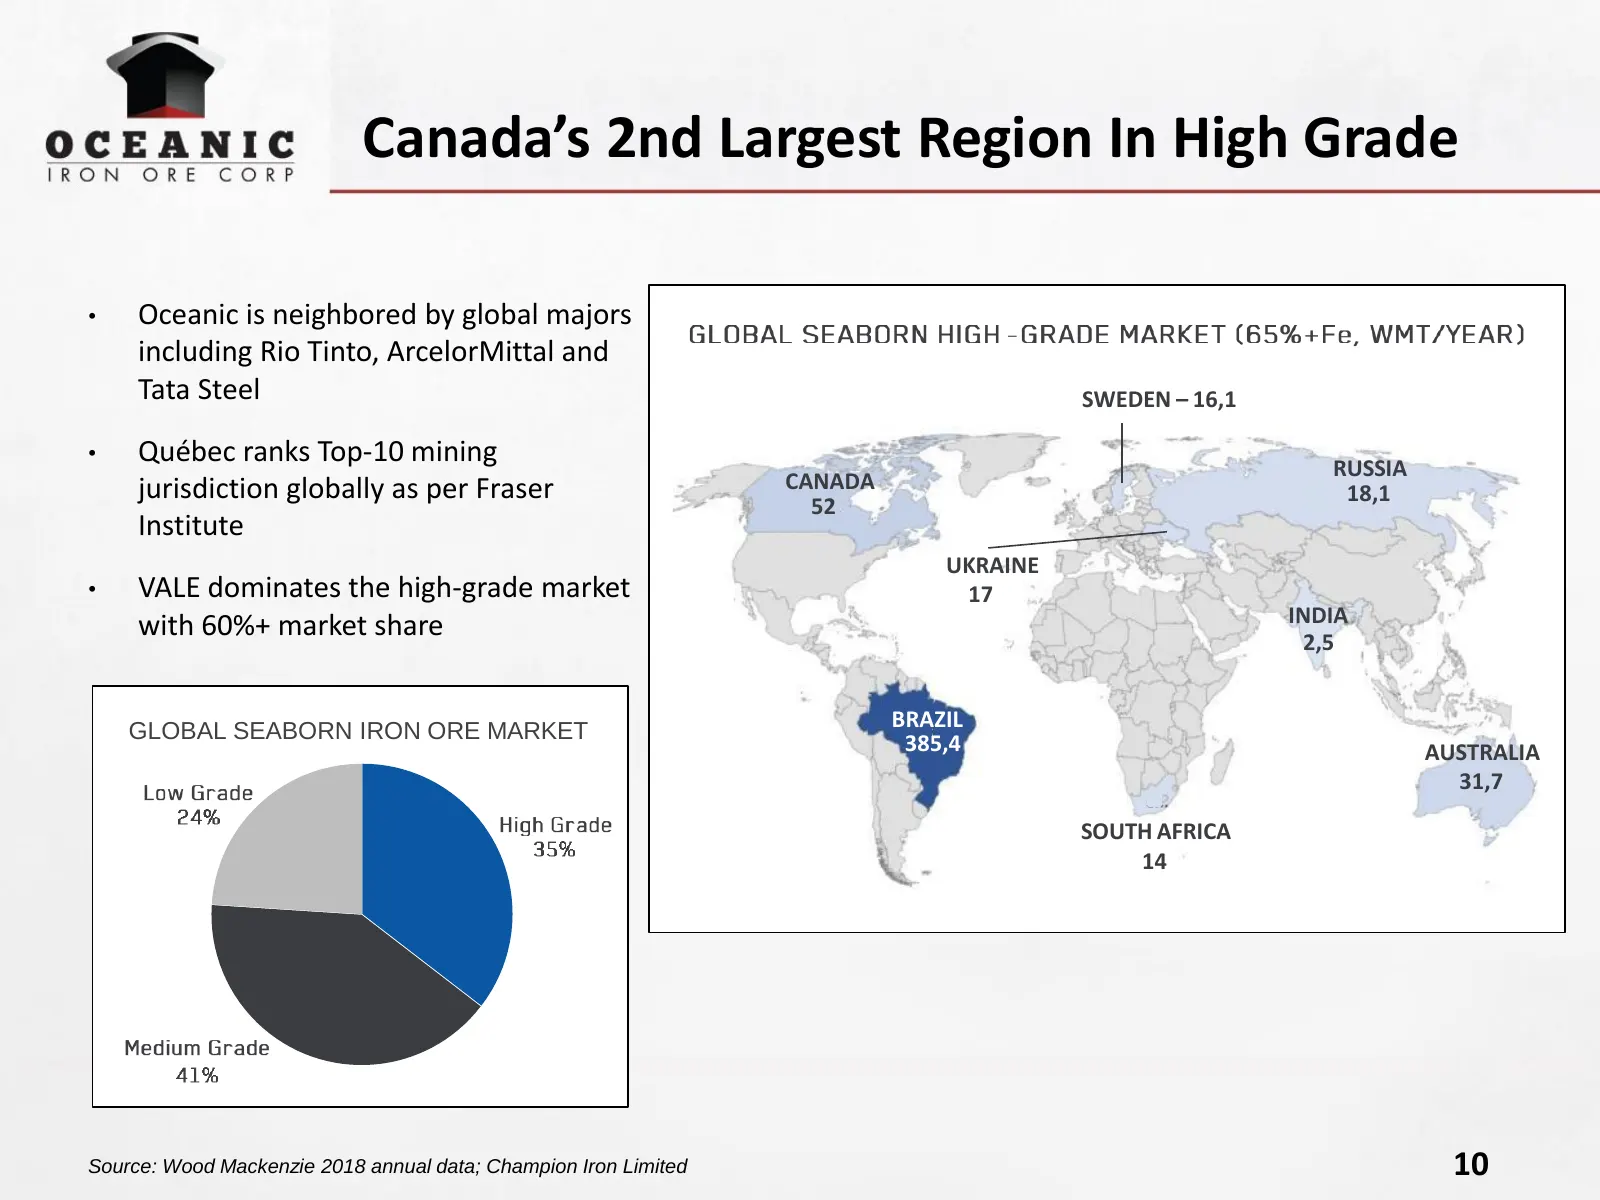
Slide 10: Canada’s 2nd Largest Region In High Grade
Canada’s 2nd Largest Region In High Grade • Oceanic is neighbored by global majors including Rio Tinto, ArcelorMittal and Tata Steel SWEDEN – 16,1 • Québec ranks Top-10 mining RUSSIA jurisdiction globally as per Fraser CANADA 18,1 52 Institute UKRAINE • VALE dominates the high-grade market 17 with 6
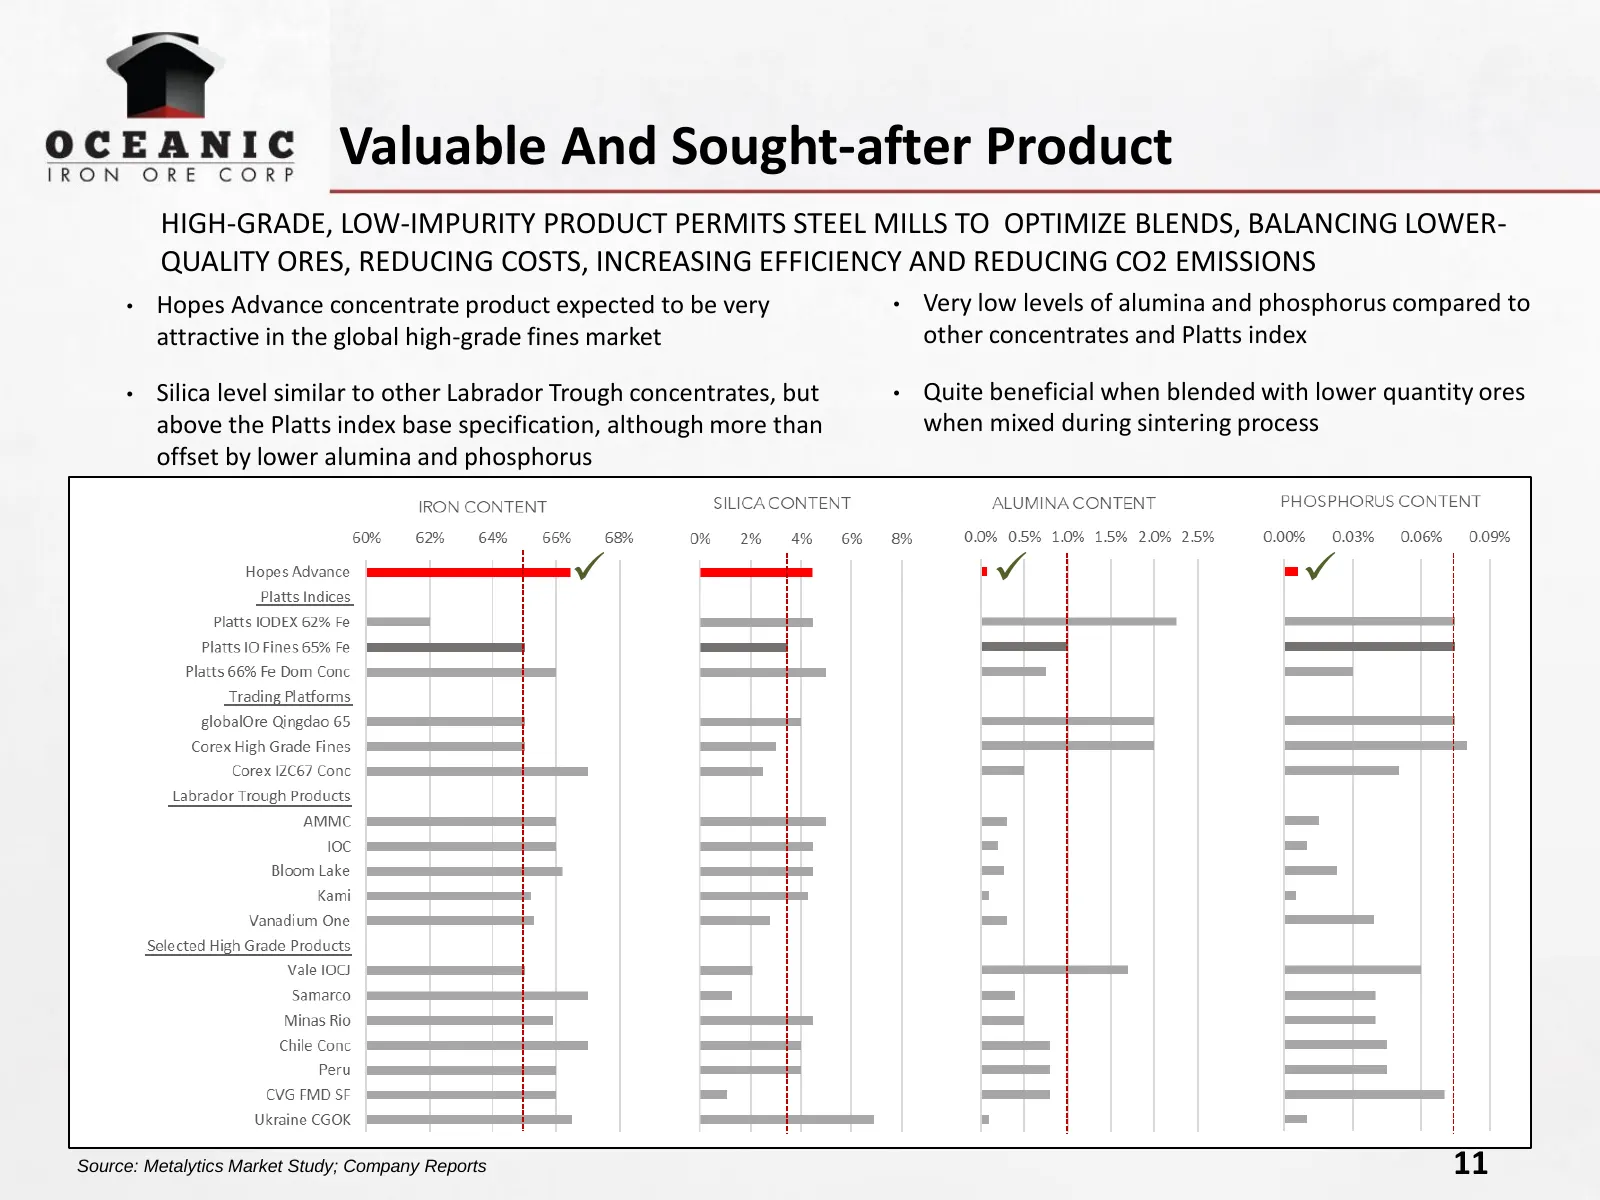
Slide 11: Valuable And Sought-after Product
Valuable And Sought-after Product HIGH-GRADE, LOW-IMPURITY PRODUCT PERMITS STEEL MILLS TO OPTIMIZE BLENDS, BALANCING LOWER- QUALITY ORES, REDUCING COSTS, INCREASING EFFICIENCY AND REDUCING CO2 EMISSIONS • Hopes Advance concentrate product expected to be very • Very low levels of alumina and phosphor
Slide 12: Unique No-Rail Advantage in Canada
Unique No-Rail Advantage in Canada Hopes Advance’s de-risking advantage - No Rail Requirement • Minimum Annual Production requirement for any new entrant to use QNSL rail infrastructure, such supply likely falling in priority to other current users • Significant capex undertaking to connect to any e
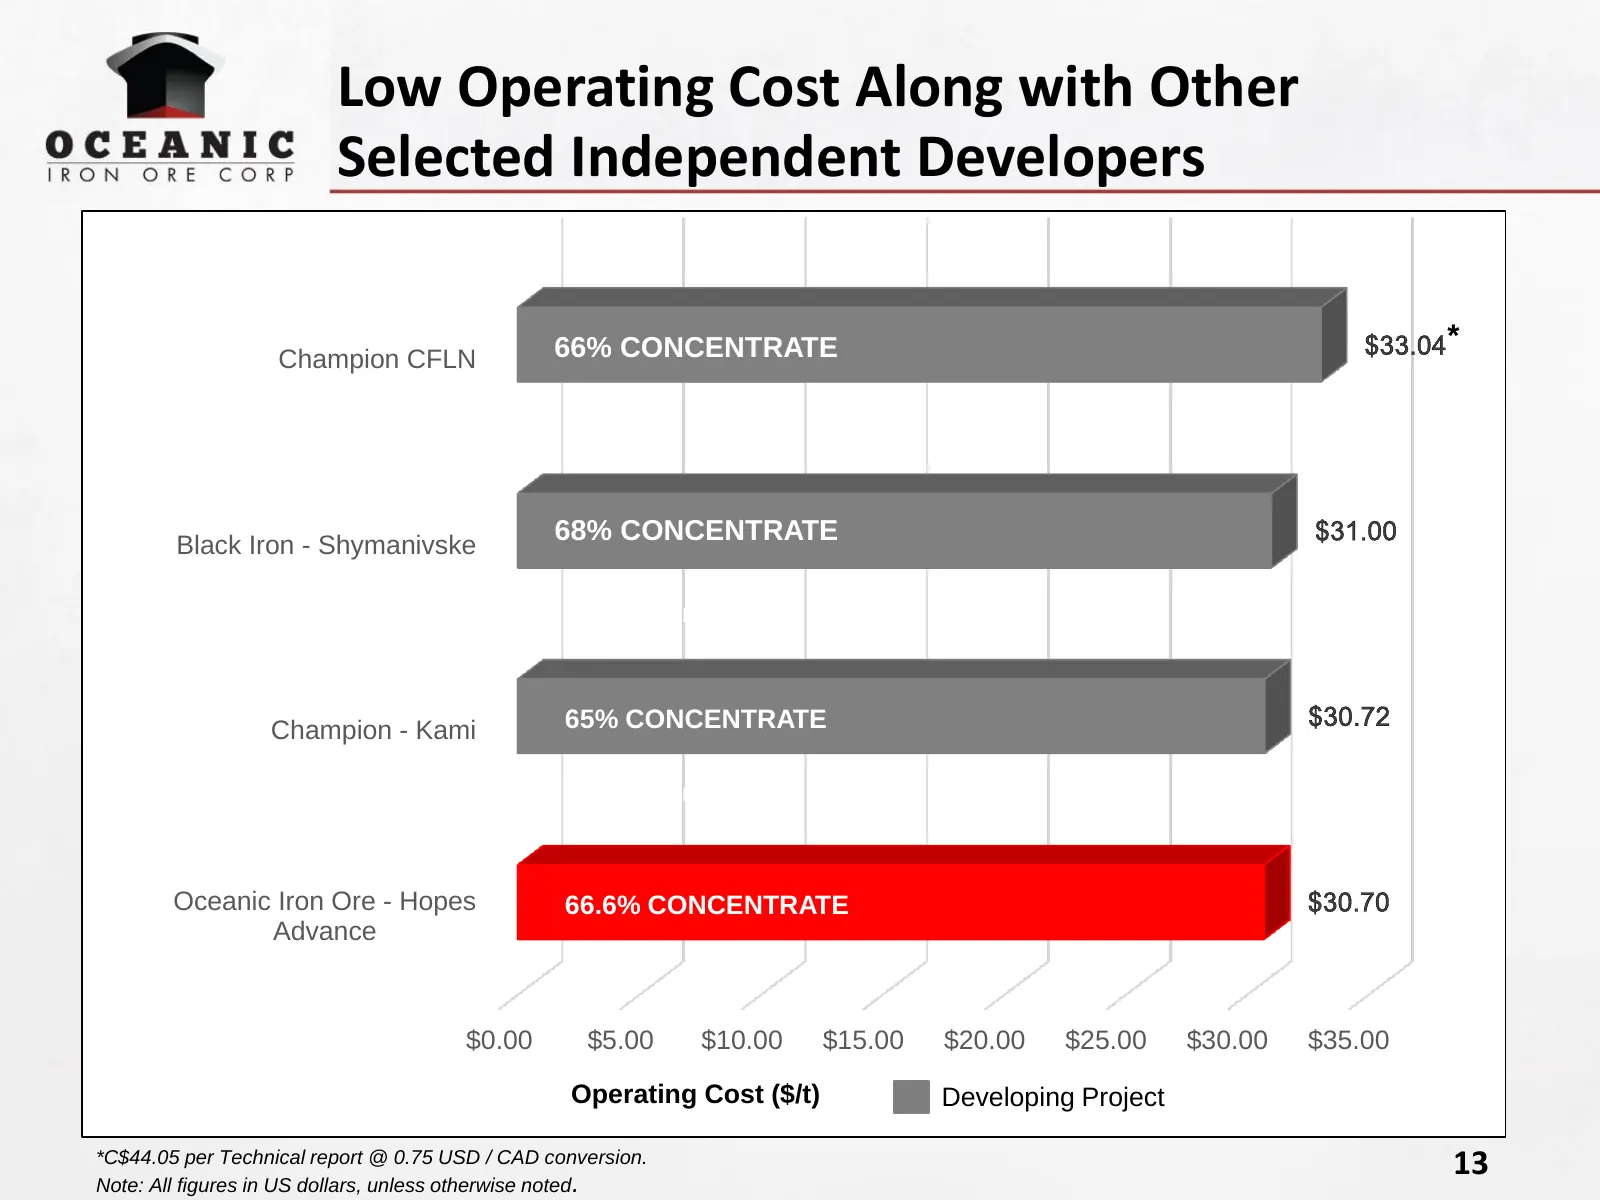
Slide 13: Low Operating Cost Along with Other Selected Independent Developers
Low Operating Cost Along with Other Selected Independent Developers 66% CONCENTRATE * Champion CFLN Black Iron - Shymanivske 68% CONCENTRATE 66% CONCENTRATE Champion - Kami 65% CONCENTRATE 65% CONCENTRATE Oceanic Iron Ore - Hopes 66.6% CONCENTRATE Advance $0.00 $5.00 $10.00 $15.00 $20.00 $25.00 $30.
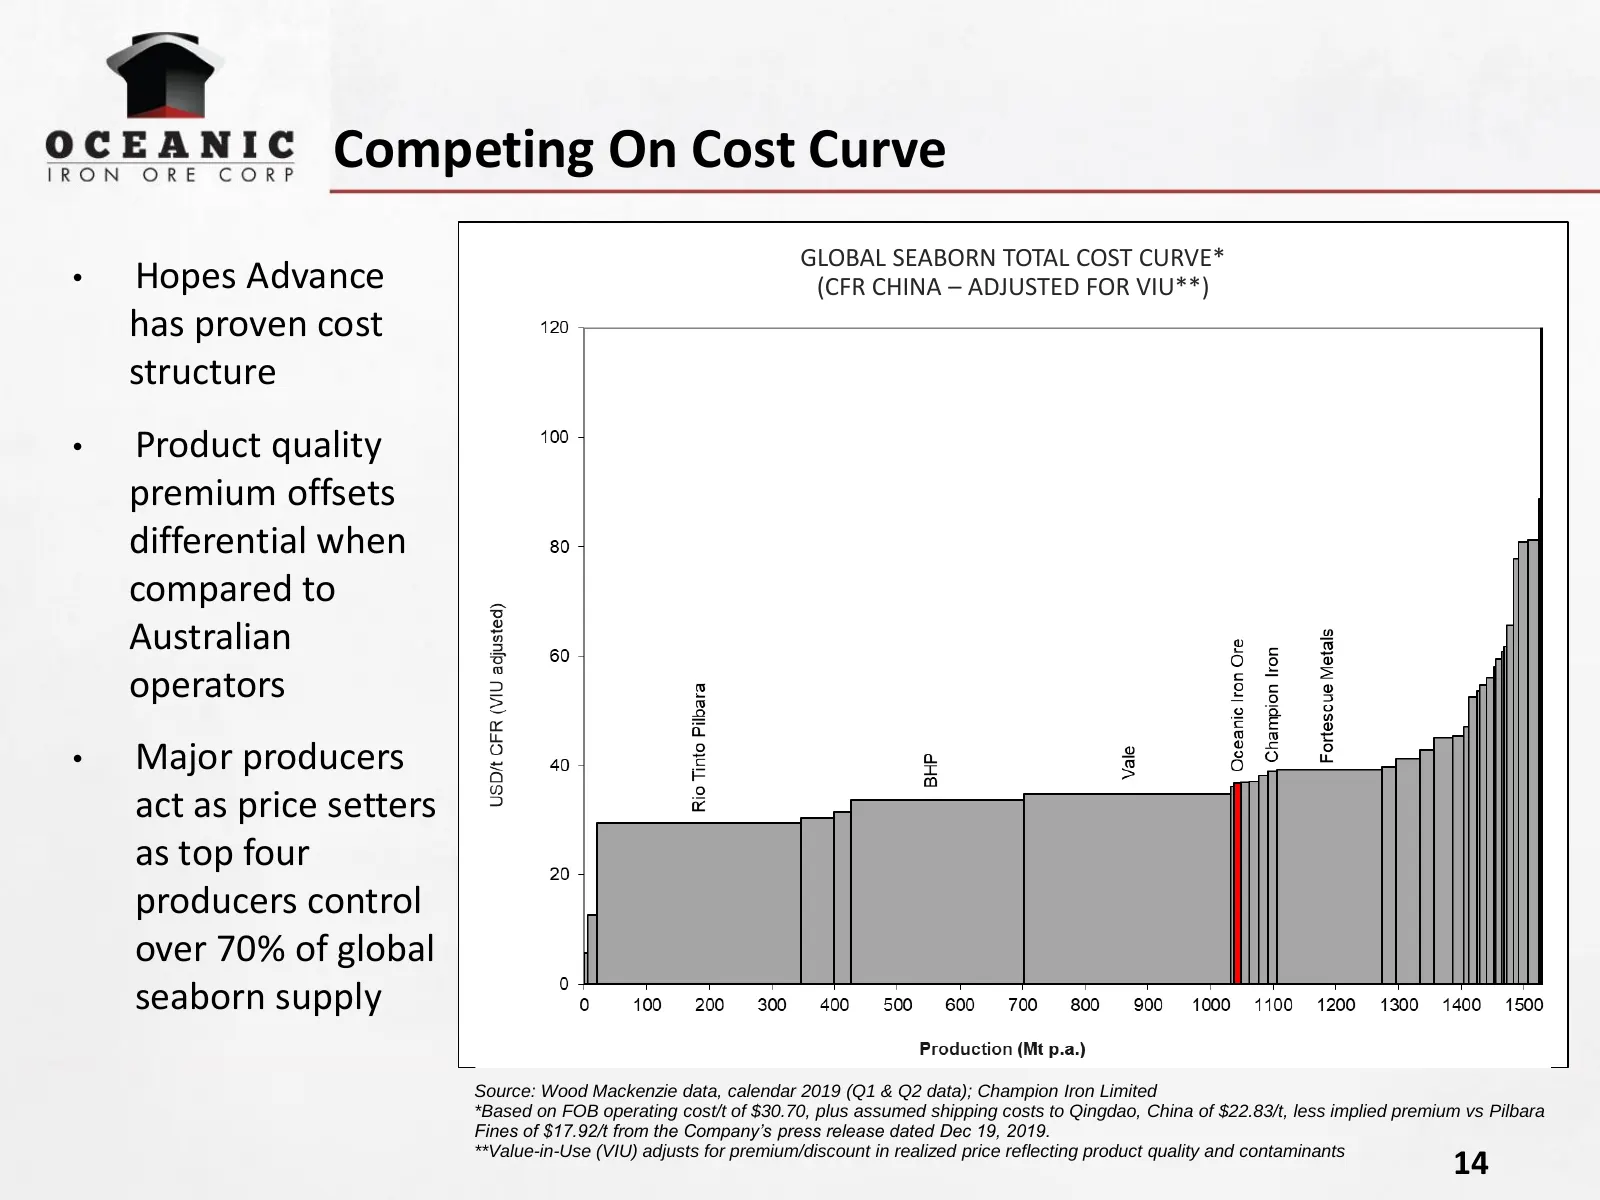
Slide 14: Competing On Cost Curve
Competing On Cost Curve GLOBAL SEABORN TOTAL COST CURVE* • Hopes Advance (CFR CHINA – ADJUSTED FOR VIU**) has proven cost structure • Product quality premium offsets differential when compared to Australian operators • Major producers act as price setters as top four producers control over 70% of gl
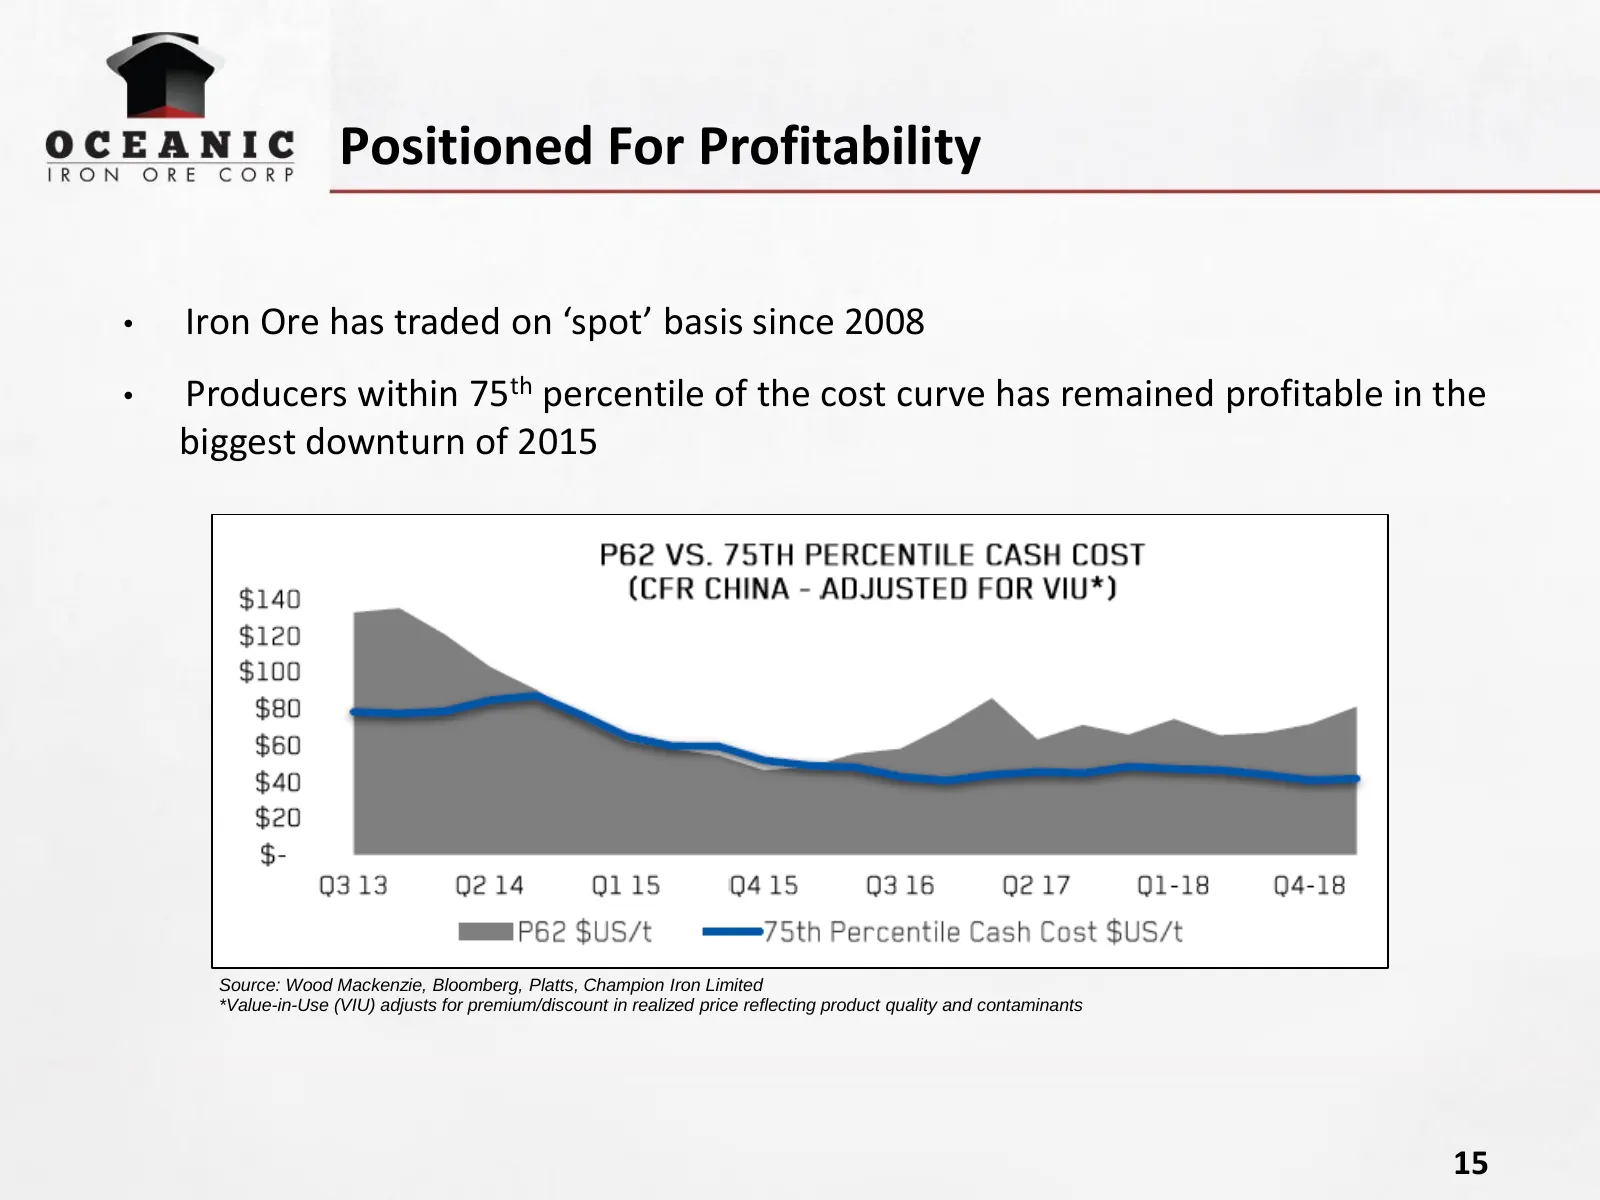
Slide 15: Positioned For Profitability
Positioned For Profitability • Iron Ore has traded on ‘spot’ basis since 2008 • Producers within 75th percentile of the cost curve has remained profitable in the biggest downturn of 2015 Source: Wood Mackenzie, Bloomberg, Platts, Champion Iron Limited *Value-in-Use (VIU) adjusts for premium/discount
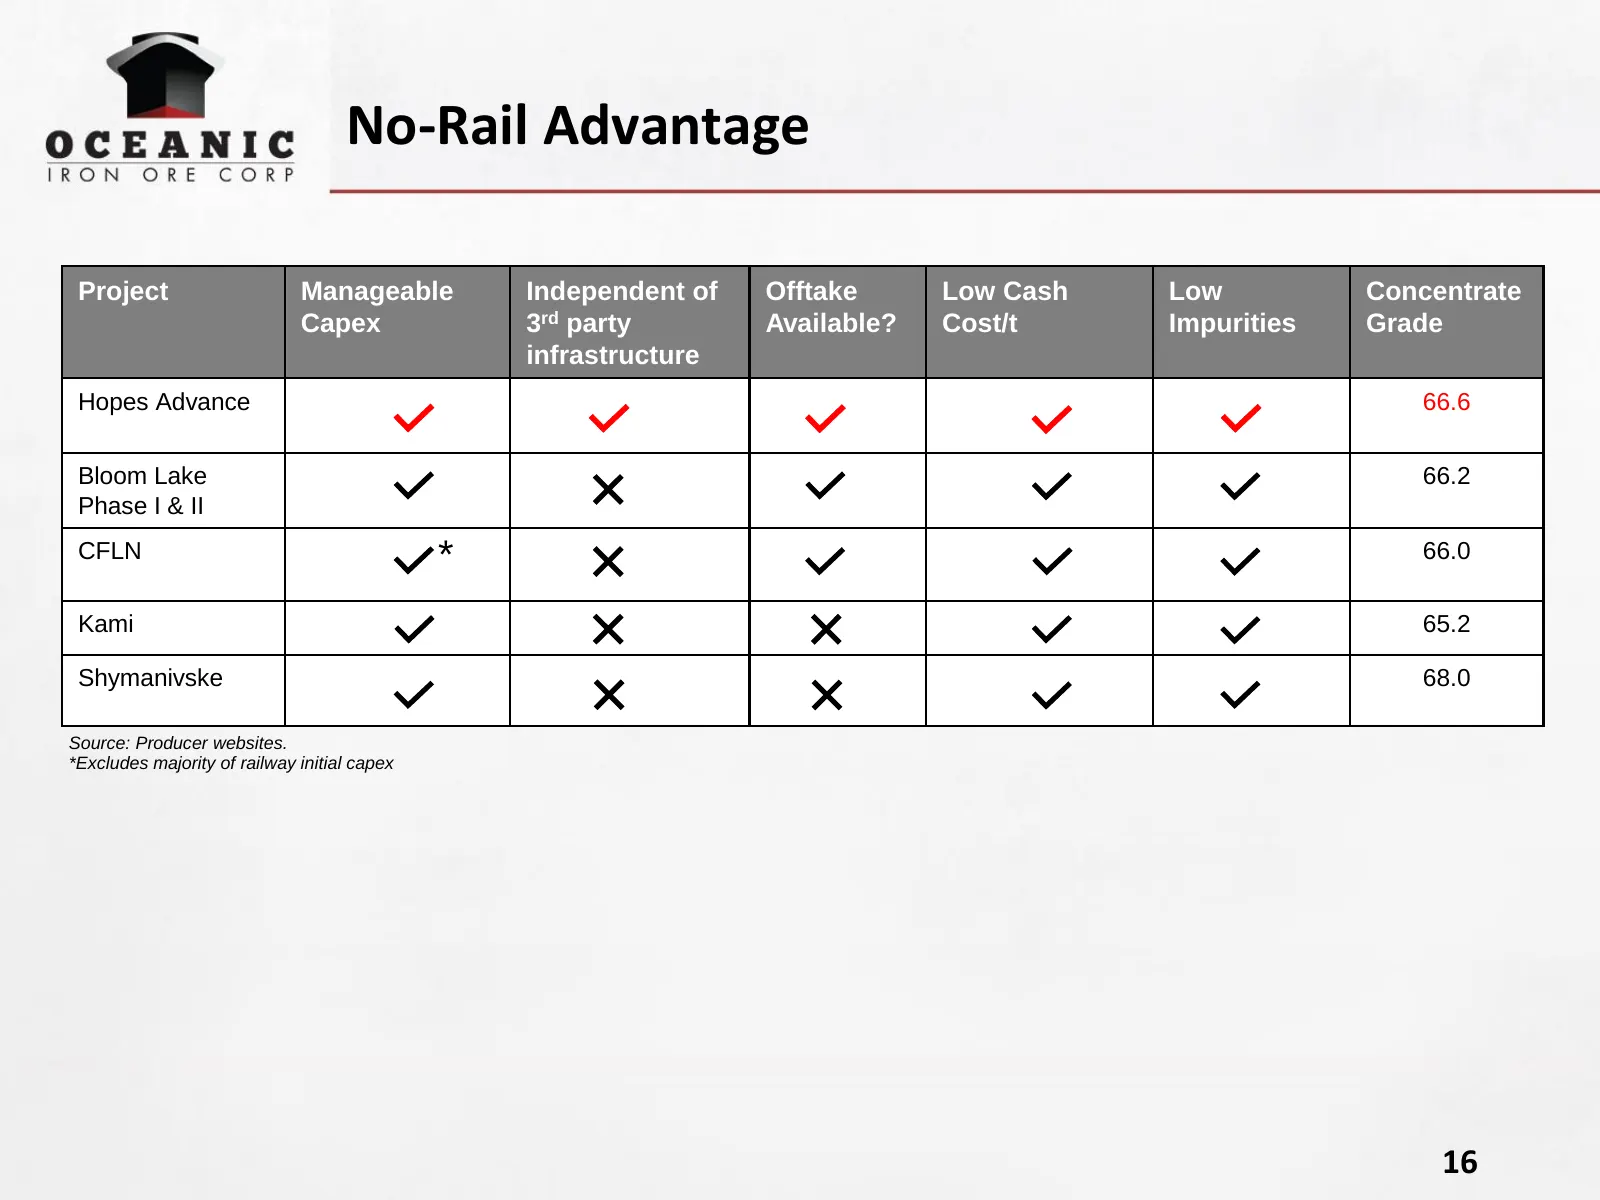
Slide 16: No-Rail Advantage
No-Rail Advantage Project Manageable Independent of Offtake Low Cash Low Concentrate Capex 3rd party Available? Cost/t Impurities Grade infrastructure Hopes Advance 66.6 Bloom Lake 66.2 Phase I & II CFLN * 66.0 Kami 65.2 Shymanivske 68.0 Source: Producer websites. *Excludes majority of railway initi
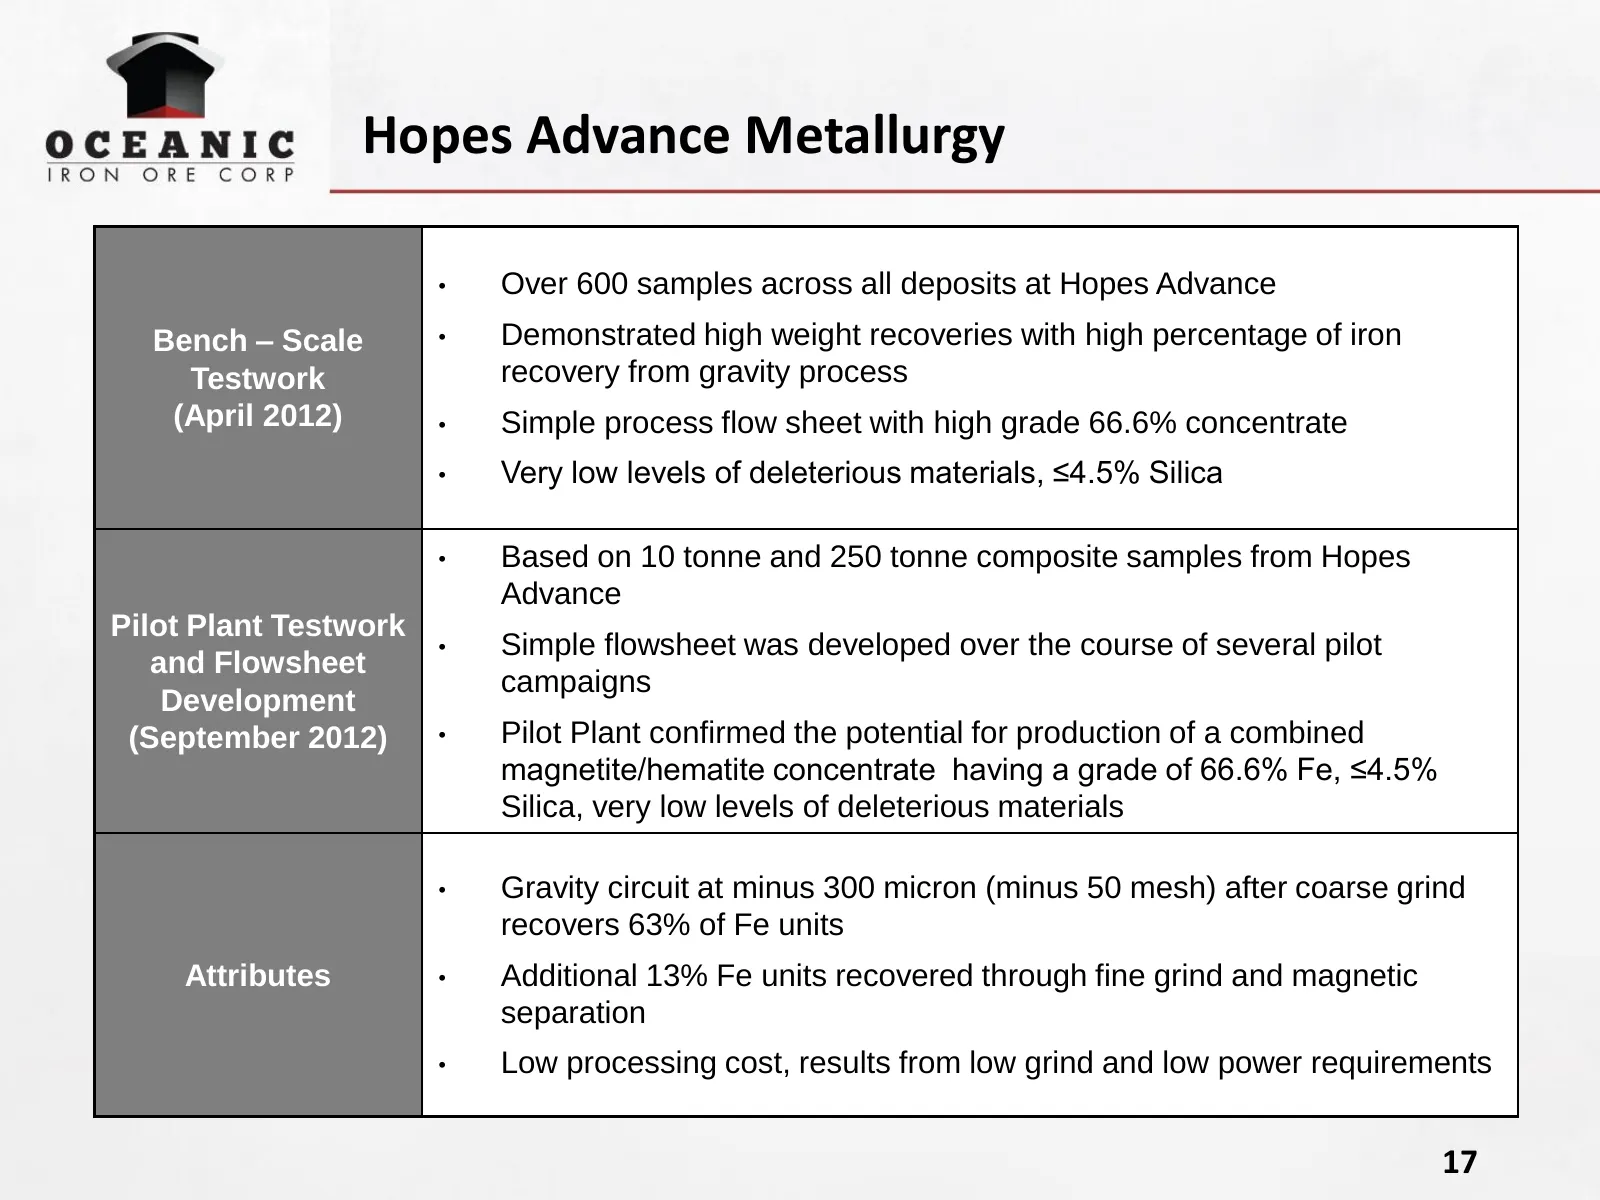
Slide 17: Hopes Advance Metallurgy
Hopes Advance Metallurgy • Over 600 samples across all deposits at Hopes Advance Bench – Scale • Demonstrated high weight recoveries with high percentage of iron Testwork recovery from gravity process (April 2012) • Simple process flow sheet with high grade 66.6% concentrate • Very low levels of del
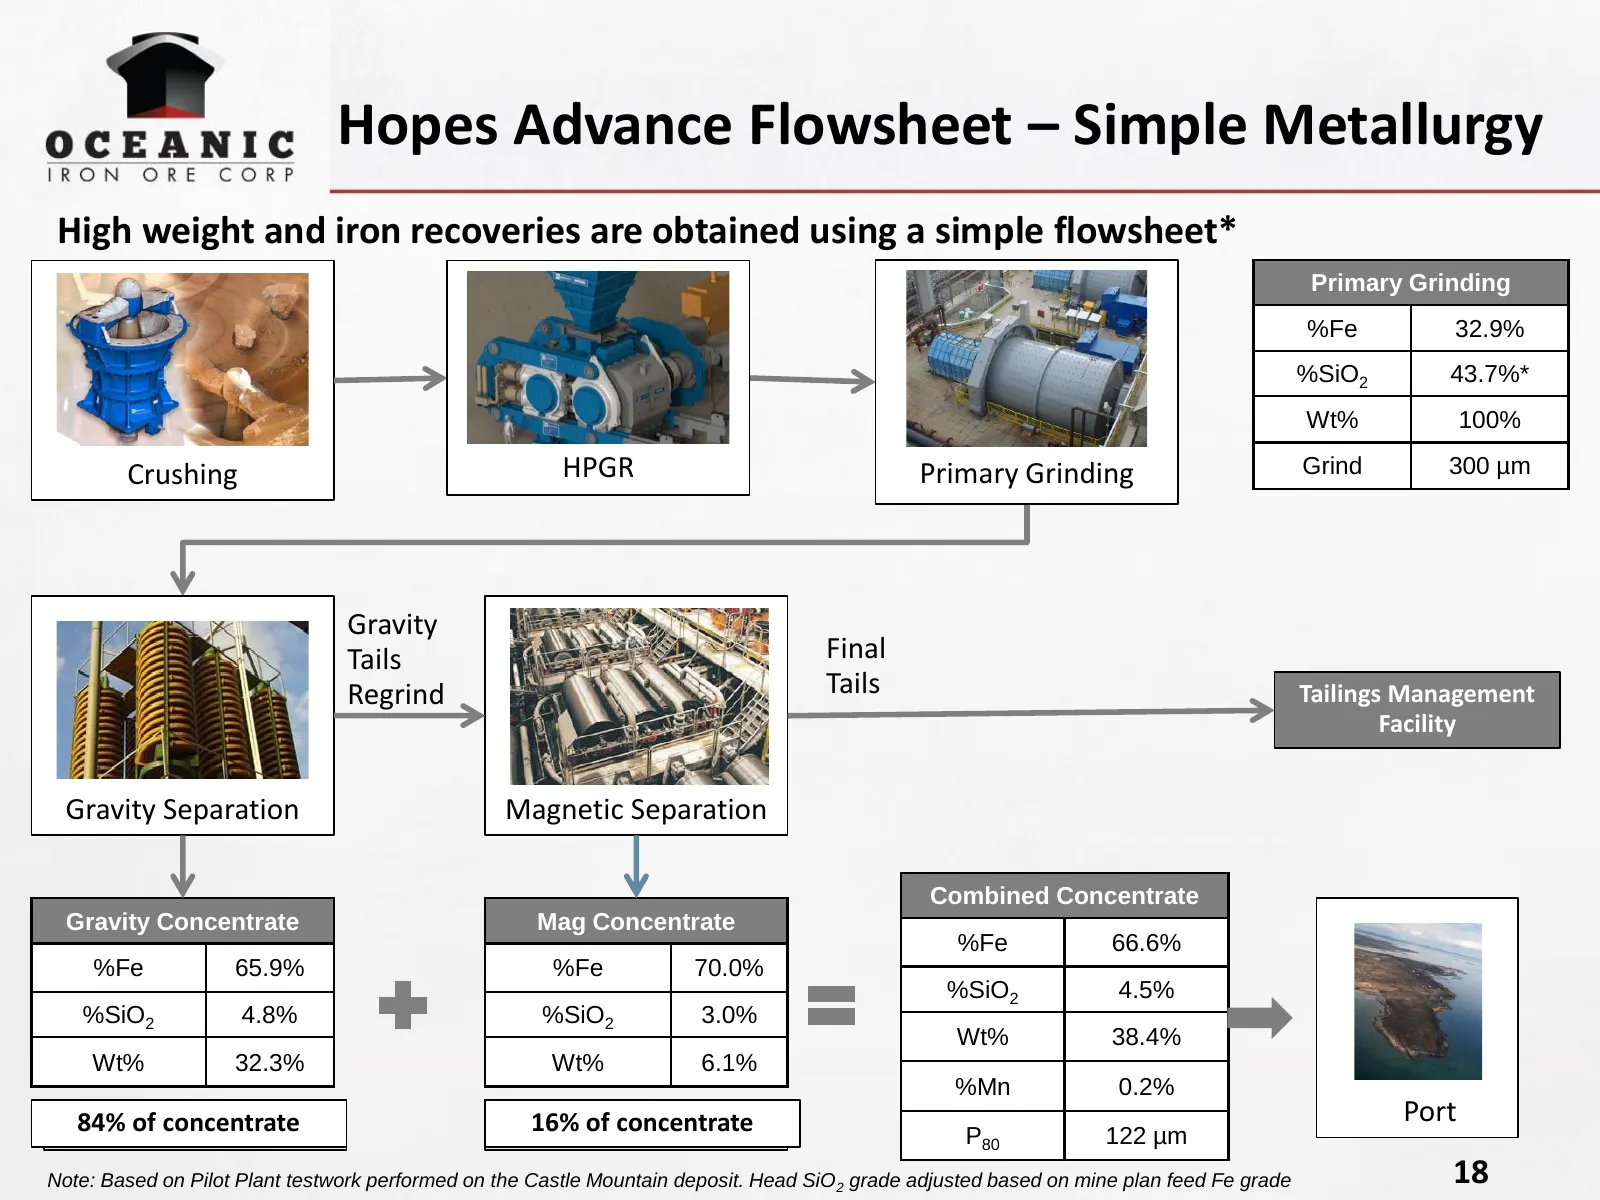
Slide 18: Hopes Advance Flowsheet – Simple Metallurgy
Hopes Advance Flowsheet – Simple Metallurgy High weight and iron recoveries are obtained using a simple flowsheet* Primary Grinding %Fe 32.9% %SiO2 43.7%* Wt% 100% Crushing HPGR Primary Grinding Grind 300 µm Gravity Tails Final Regrind Tails Tailings Management Facility Gravity Separation Magnetic S
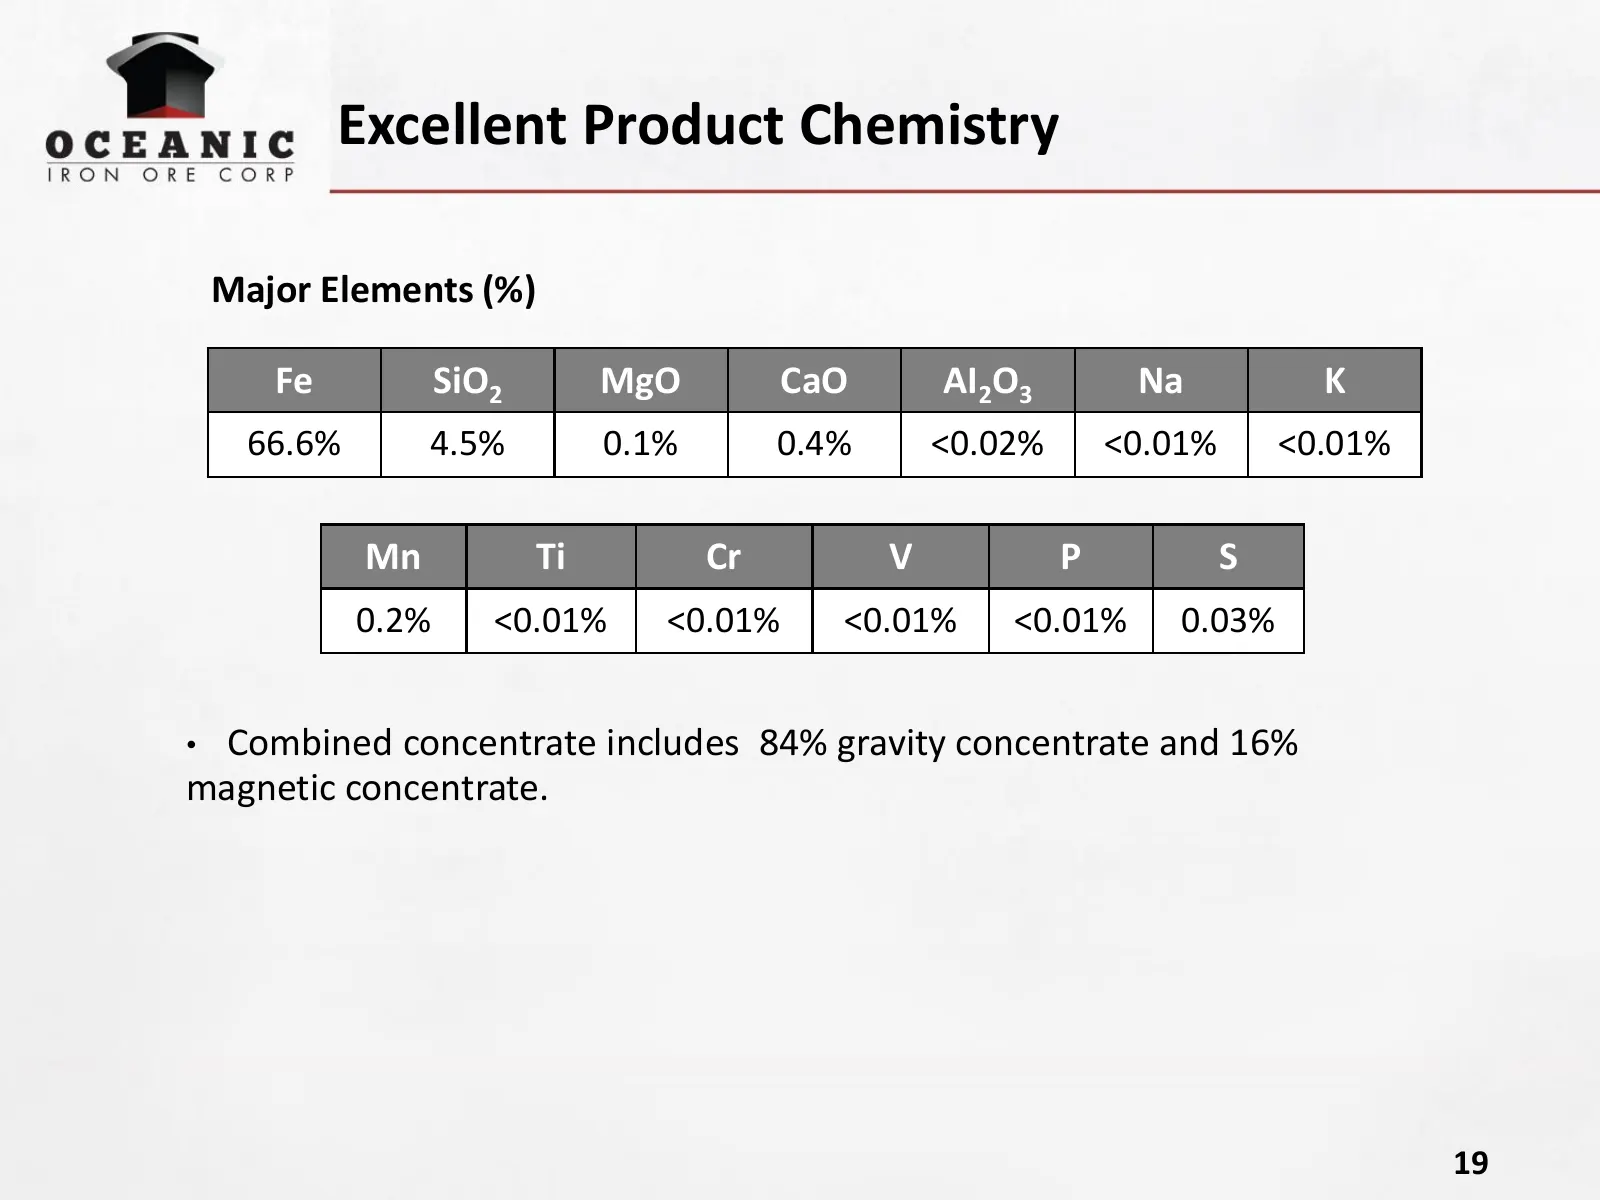
Slide 19: Excellent Product Chemistry
Excellent Product Chemistry Major Elements (%) Fe SiO2 MgO CaO AI2O3 Na K 66.6% 4.5% 0.1% 0.4% <0.02% <0.01% <0.01% Mn Ti Cr V P S 0.2% <0.01% <0.01% <0.01% <0.01% 0.03% •Combined concentrate includes 84% gravity concentrate and 16% magnetic concentrate. 19
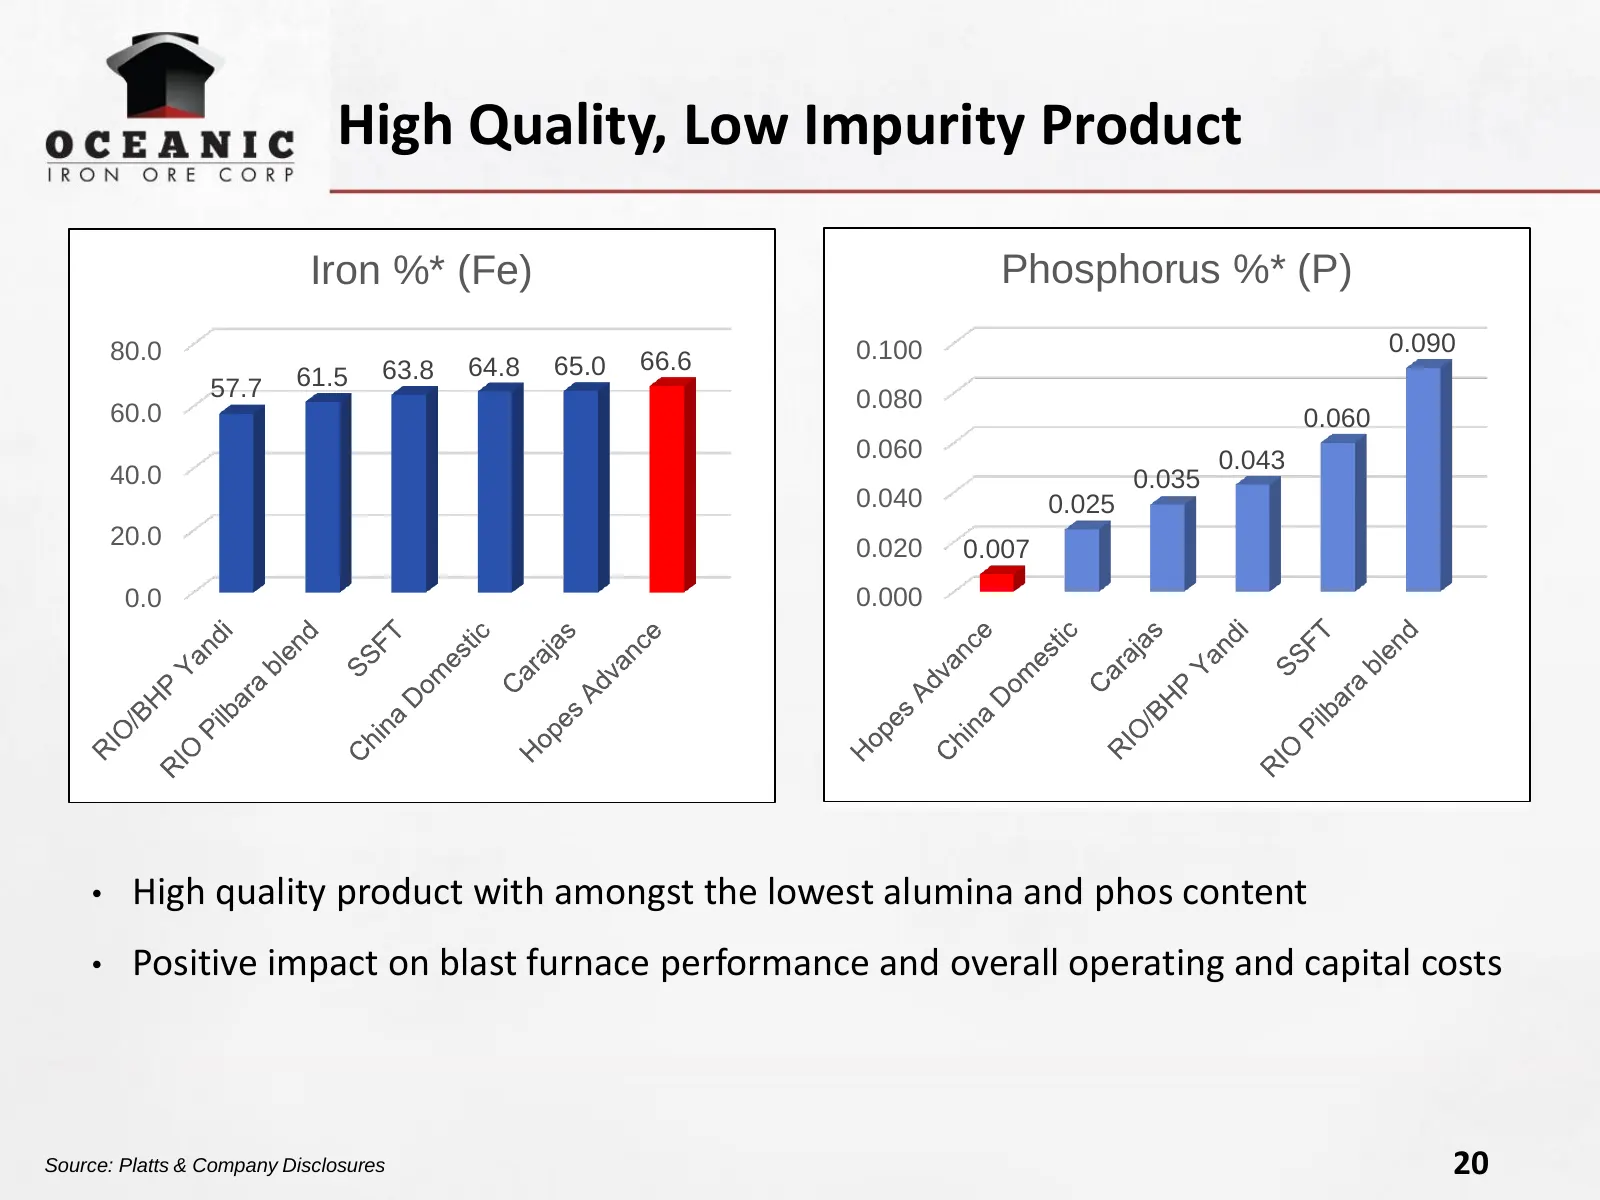
Slide 20: High Quality, Low Impurity Product
High Quality, Low Impurity Product Iron %* (Fe) Phosphorus %* (P) 80.0 0.100 0.090 63.8 64.8 65.0 66.6 57.7 61.5 0.080 60.0 0.060 0.060 0.043 40.0 0.035 0.040 0.025 20.0 0.020 0.007 0.0 0.000 • High quality product with amongst the lowest alumina and phos content • Positive impact on blast furnace p
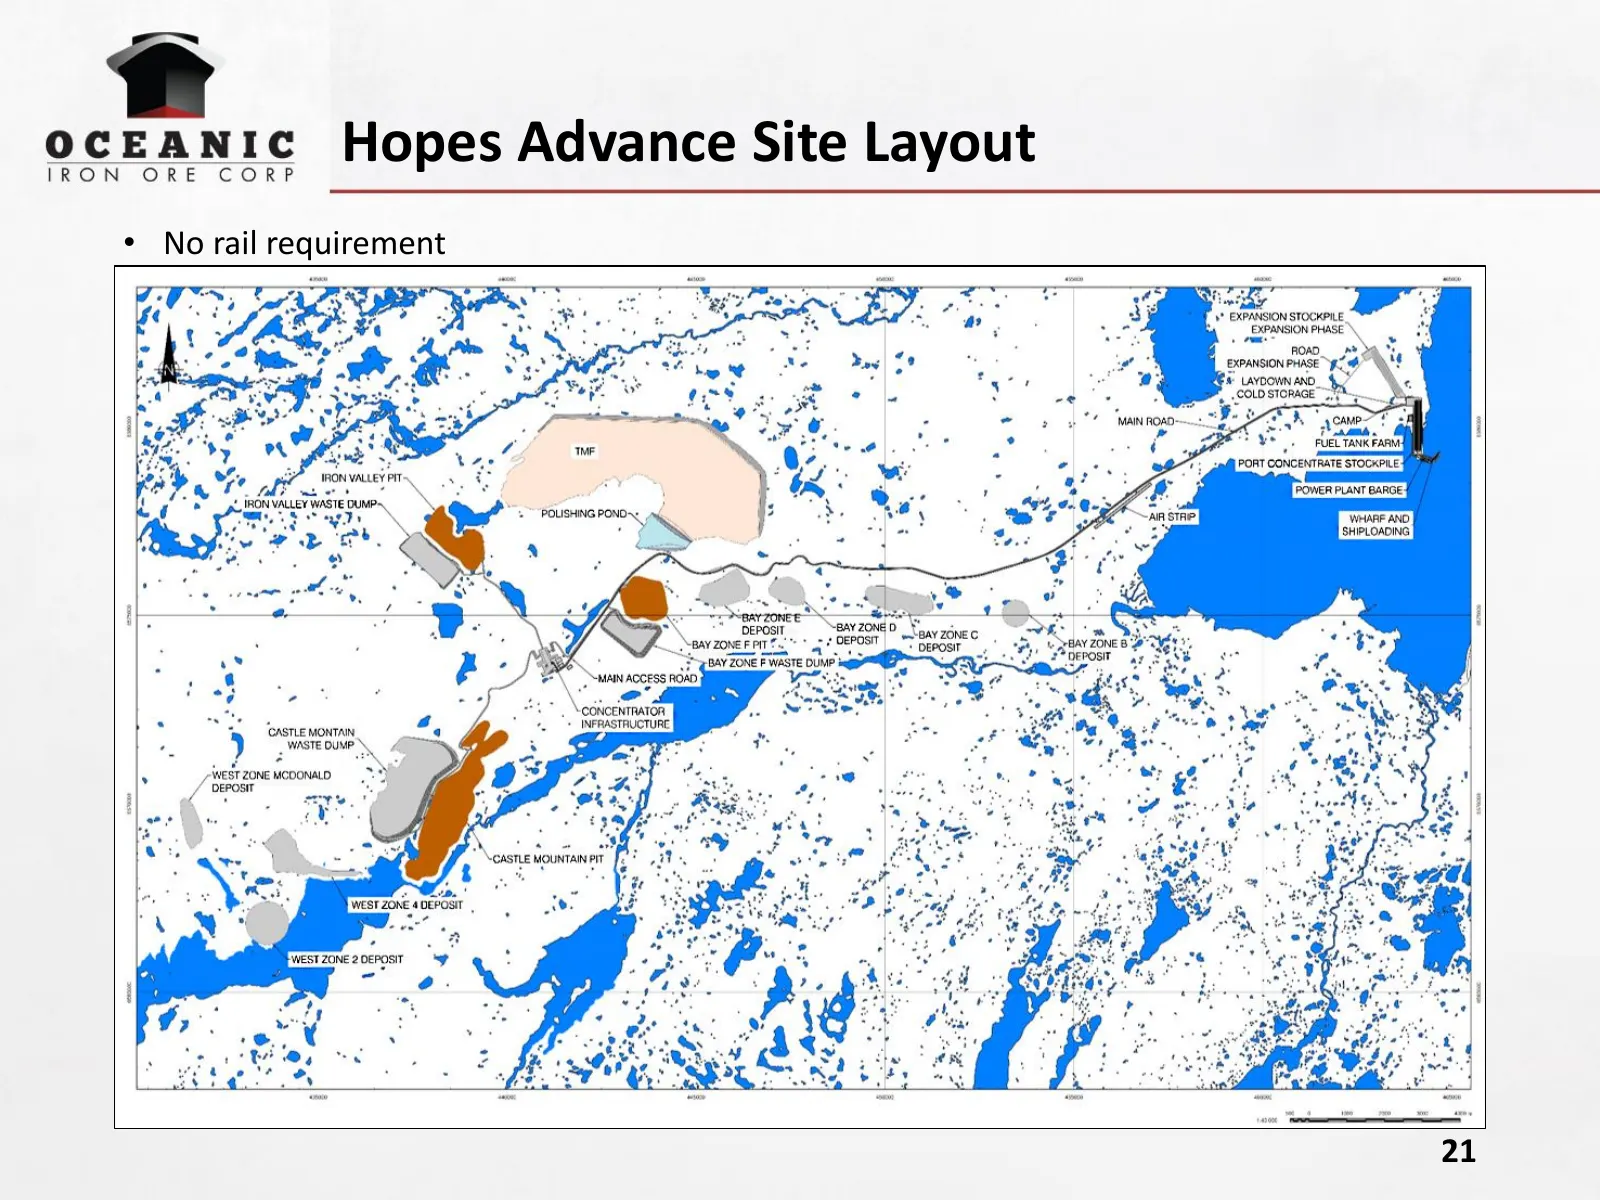
Slide 21: Hopes Advance Site Layout
Hopes Advance Site Layout • No rail requirement 21
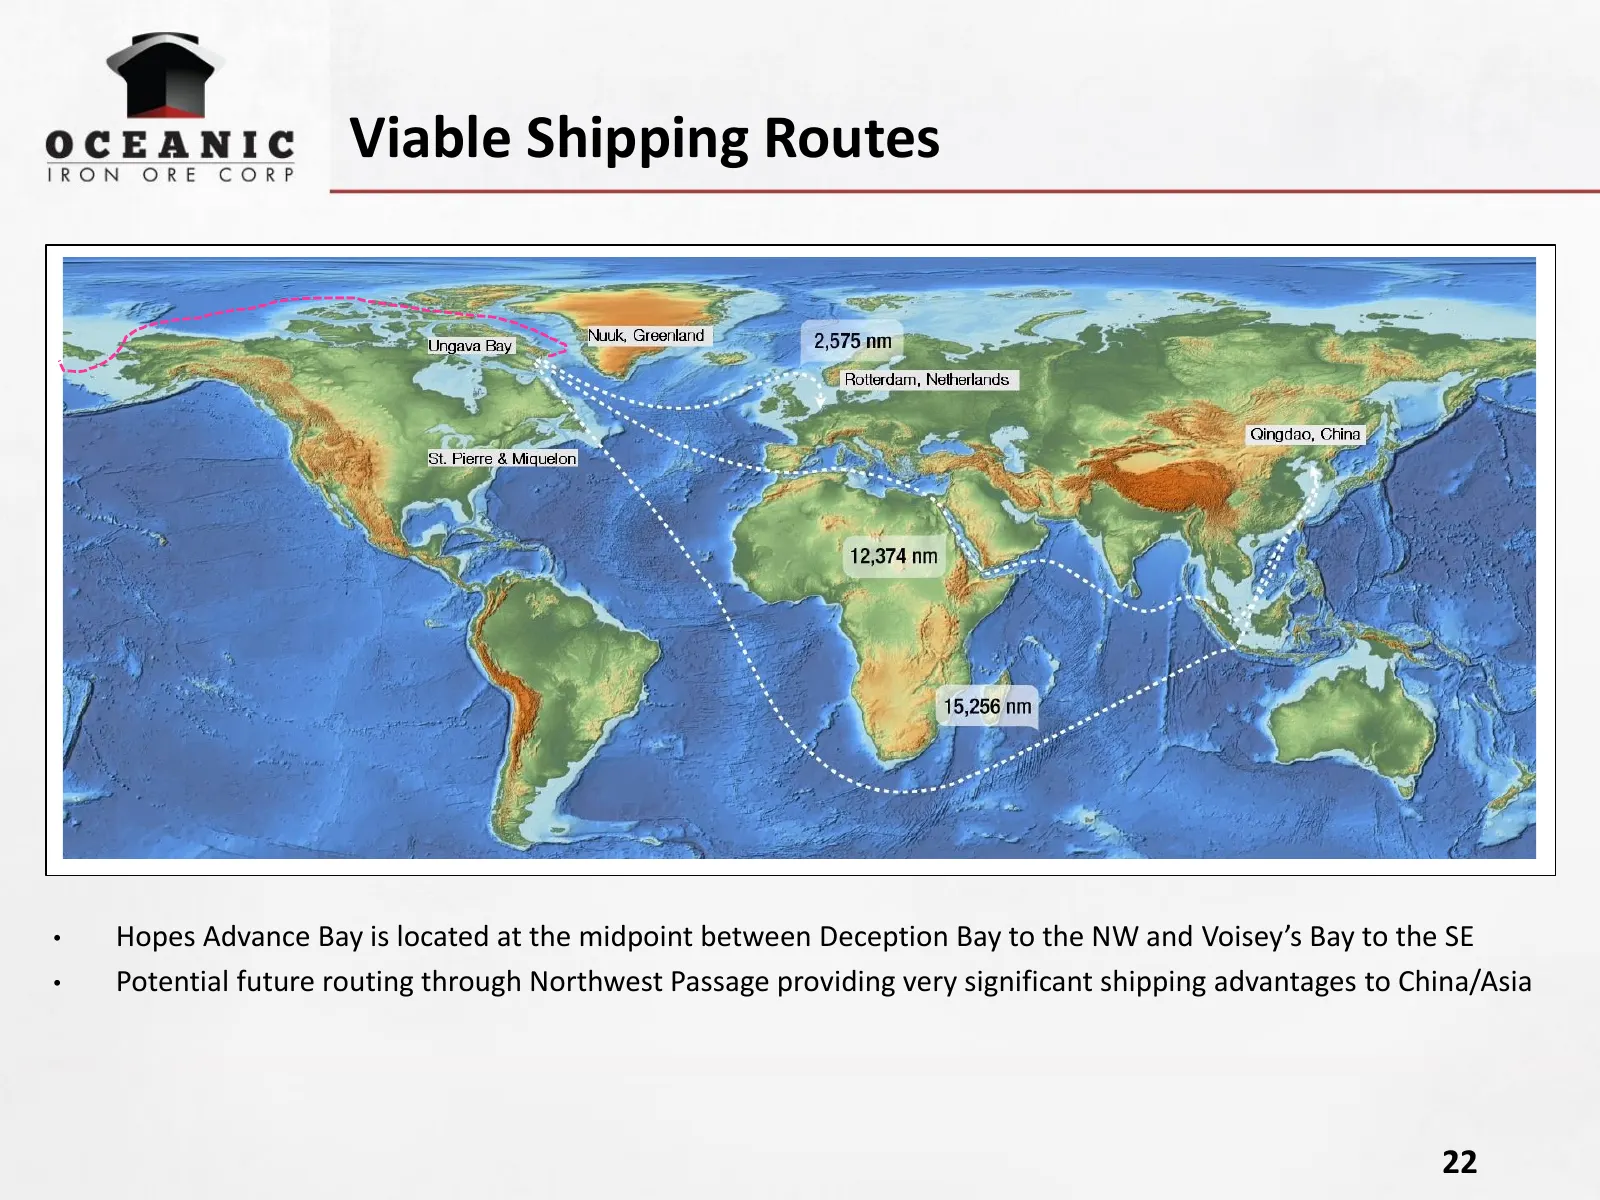
Slide 22: Viable Shipping Routes
Viable Shipping Routes • Hopes Advance Bay is located at the midpoint between Deception Bay to the NW and Voisey’s Bay to the SE • Potential future routing through Northwest Passage providing very significant shipping advantages to China/Asia 22
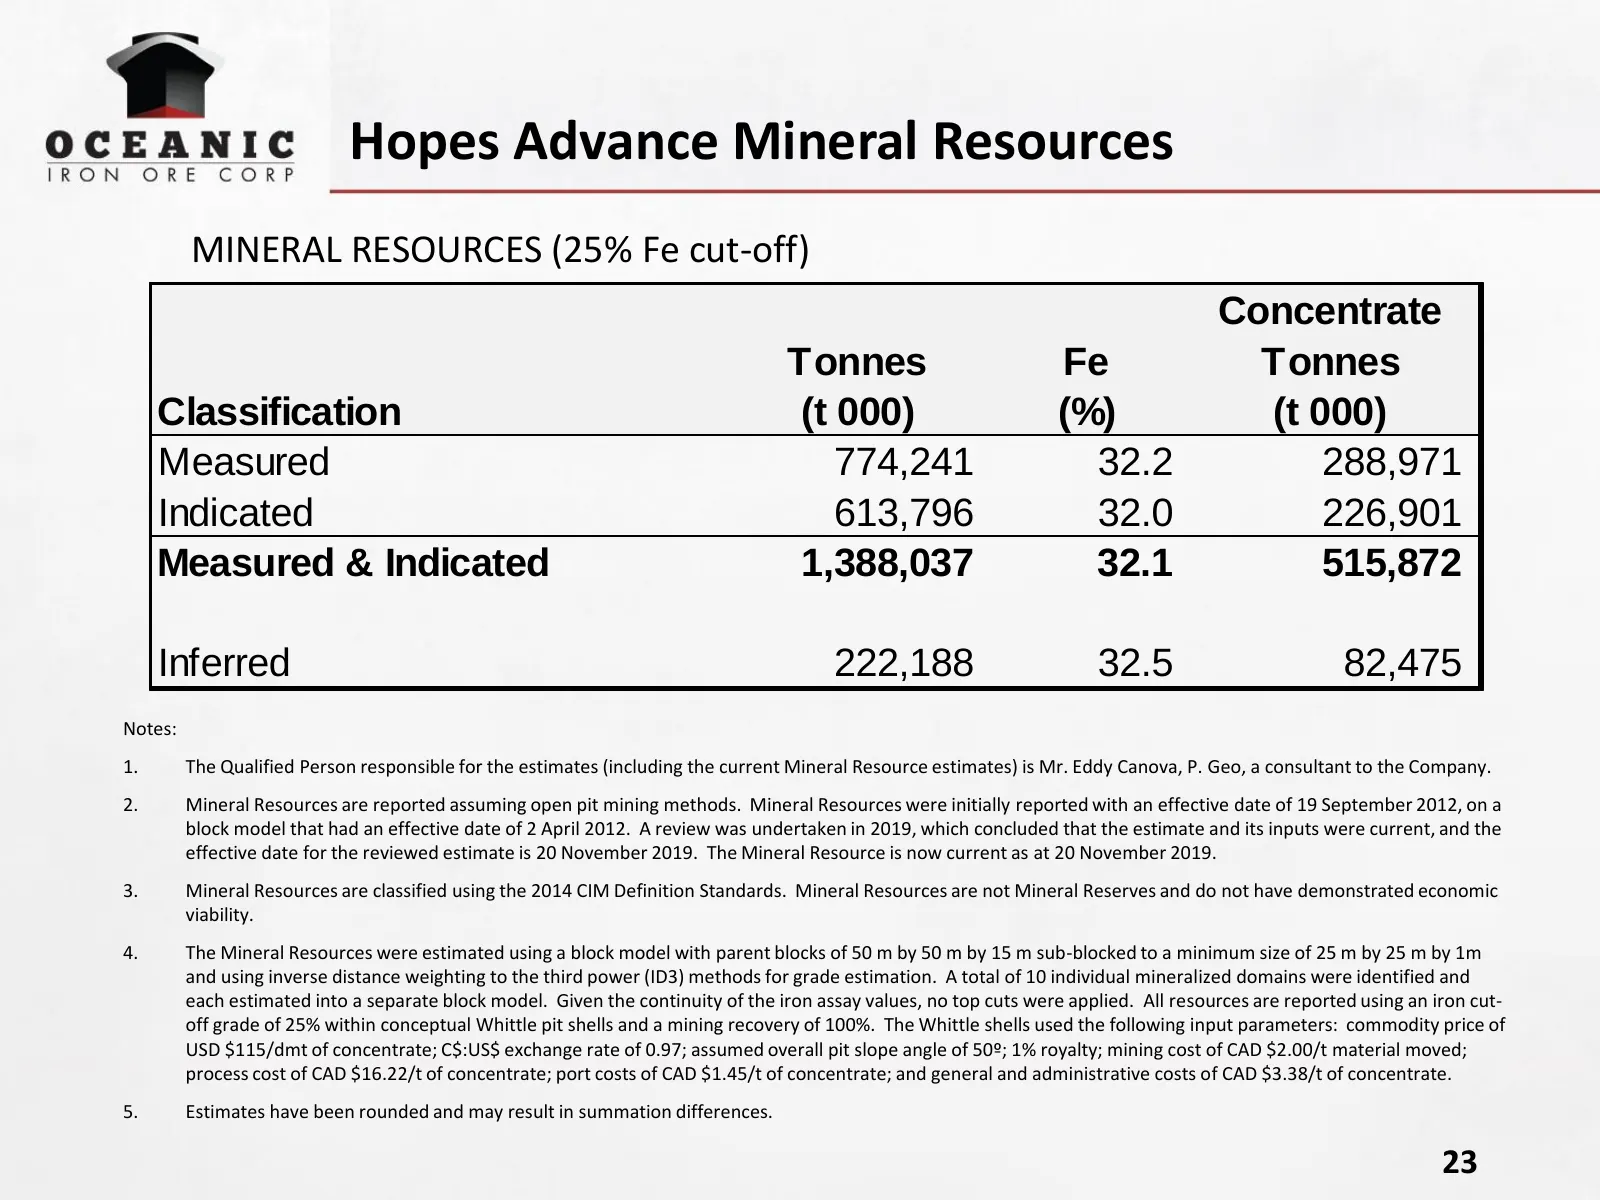
Slide 23: Hopes Advance Mineral Resources
Hopes Advance Mineral Resources MINERAL RESOURCES (25% Fe cut-off) Concentrate Tonnes Fe Tonnes Classification (t 000) (%) (t 000) Measured 774,241 32.2 288,971 Indicated 613,796 32.0 226,901 Measured & Indicated 1,388,037 32.1 515,872 Inferred 222,188 32.5 82,475 Notes: 1. The Qualified Person resp
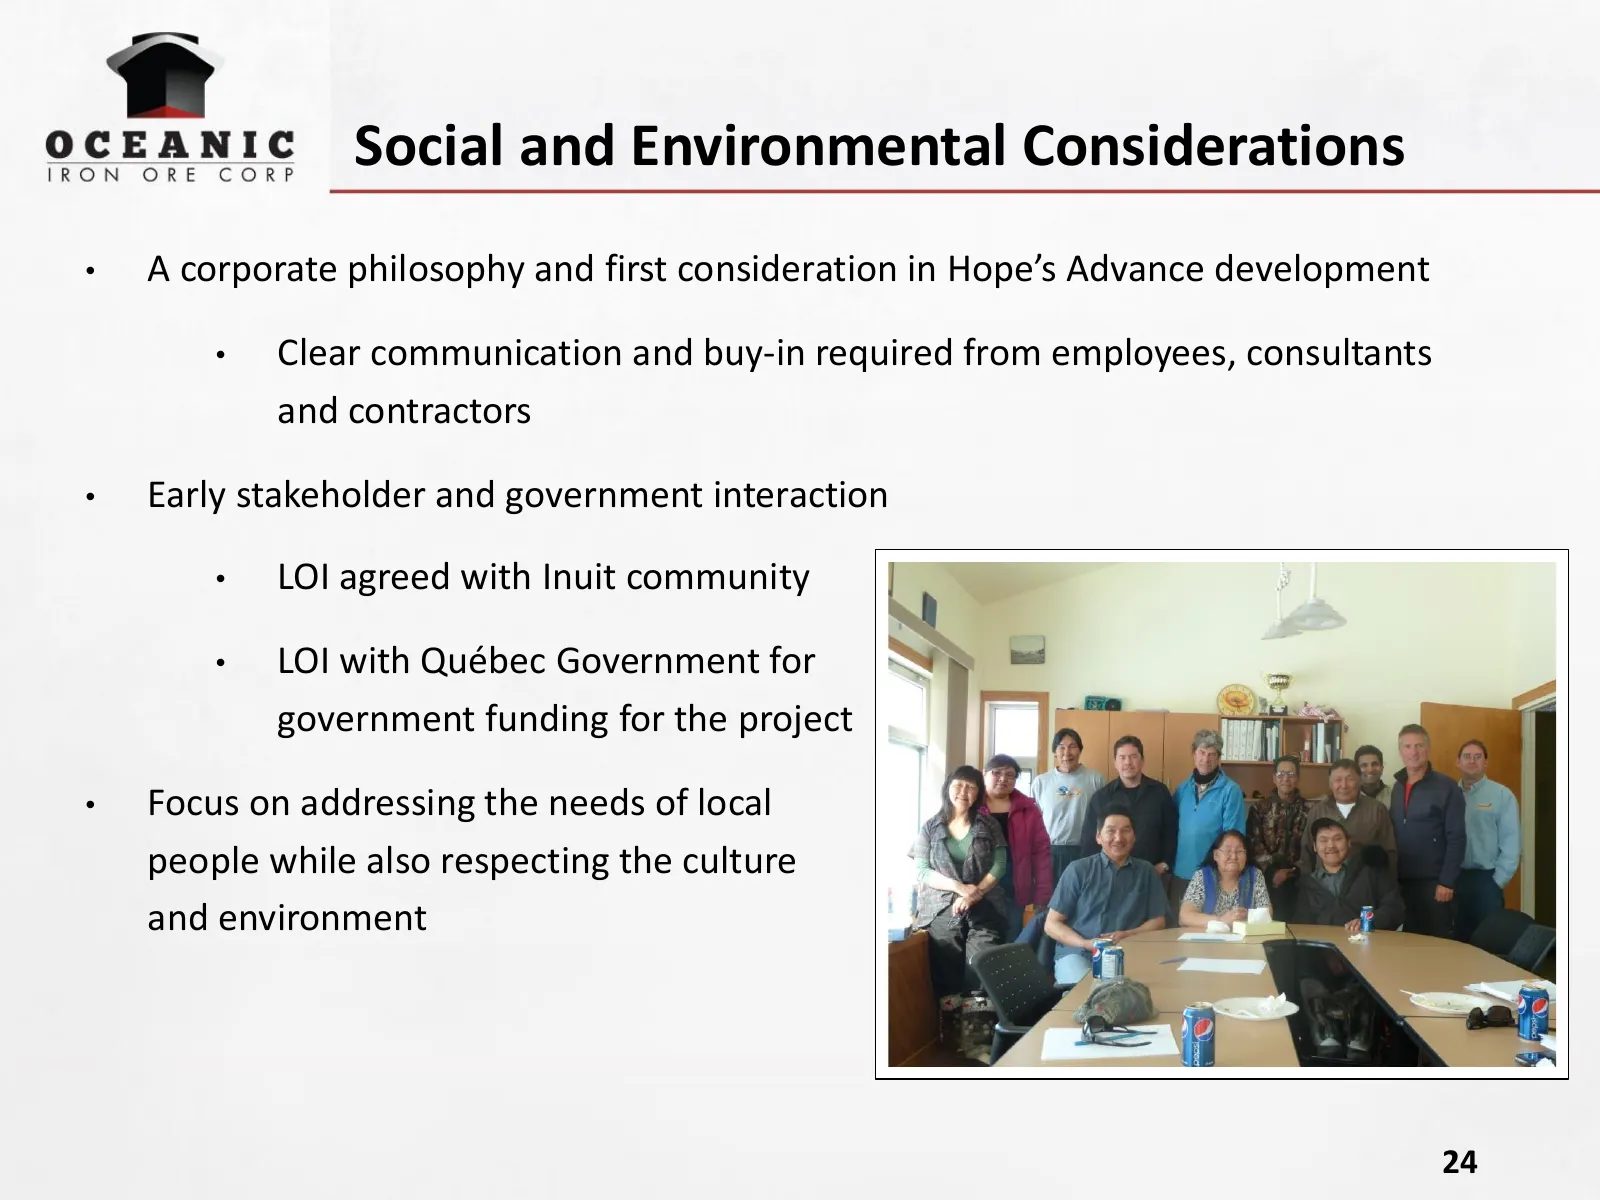
Slide 24: Social and Environmental Considerations
Social and Environmental Considerations • A corporate philosophy and first consideration in Hope’s Advance development • Clear communication and buy-in required from employees, consultants and contractors • Early stakeholder and government interaction • LOI agreed with Inuit community • LOI with Qué
Slide 25: Oceanic Iron Ore Corp.
fn OCEANIC TRON -ORE. CORP WWW.OCEANICIRONORE.COM TSX:V - FEO
Slide 26: APPENDIX - Hopes Advance Images
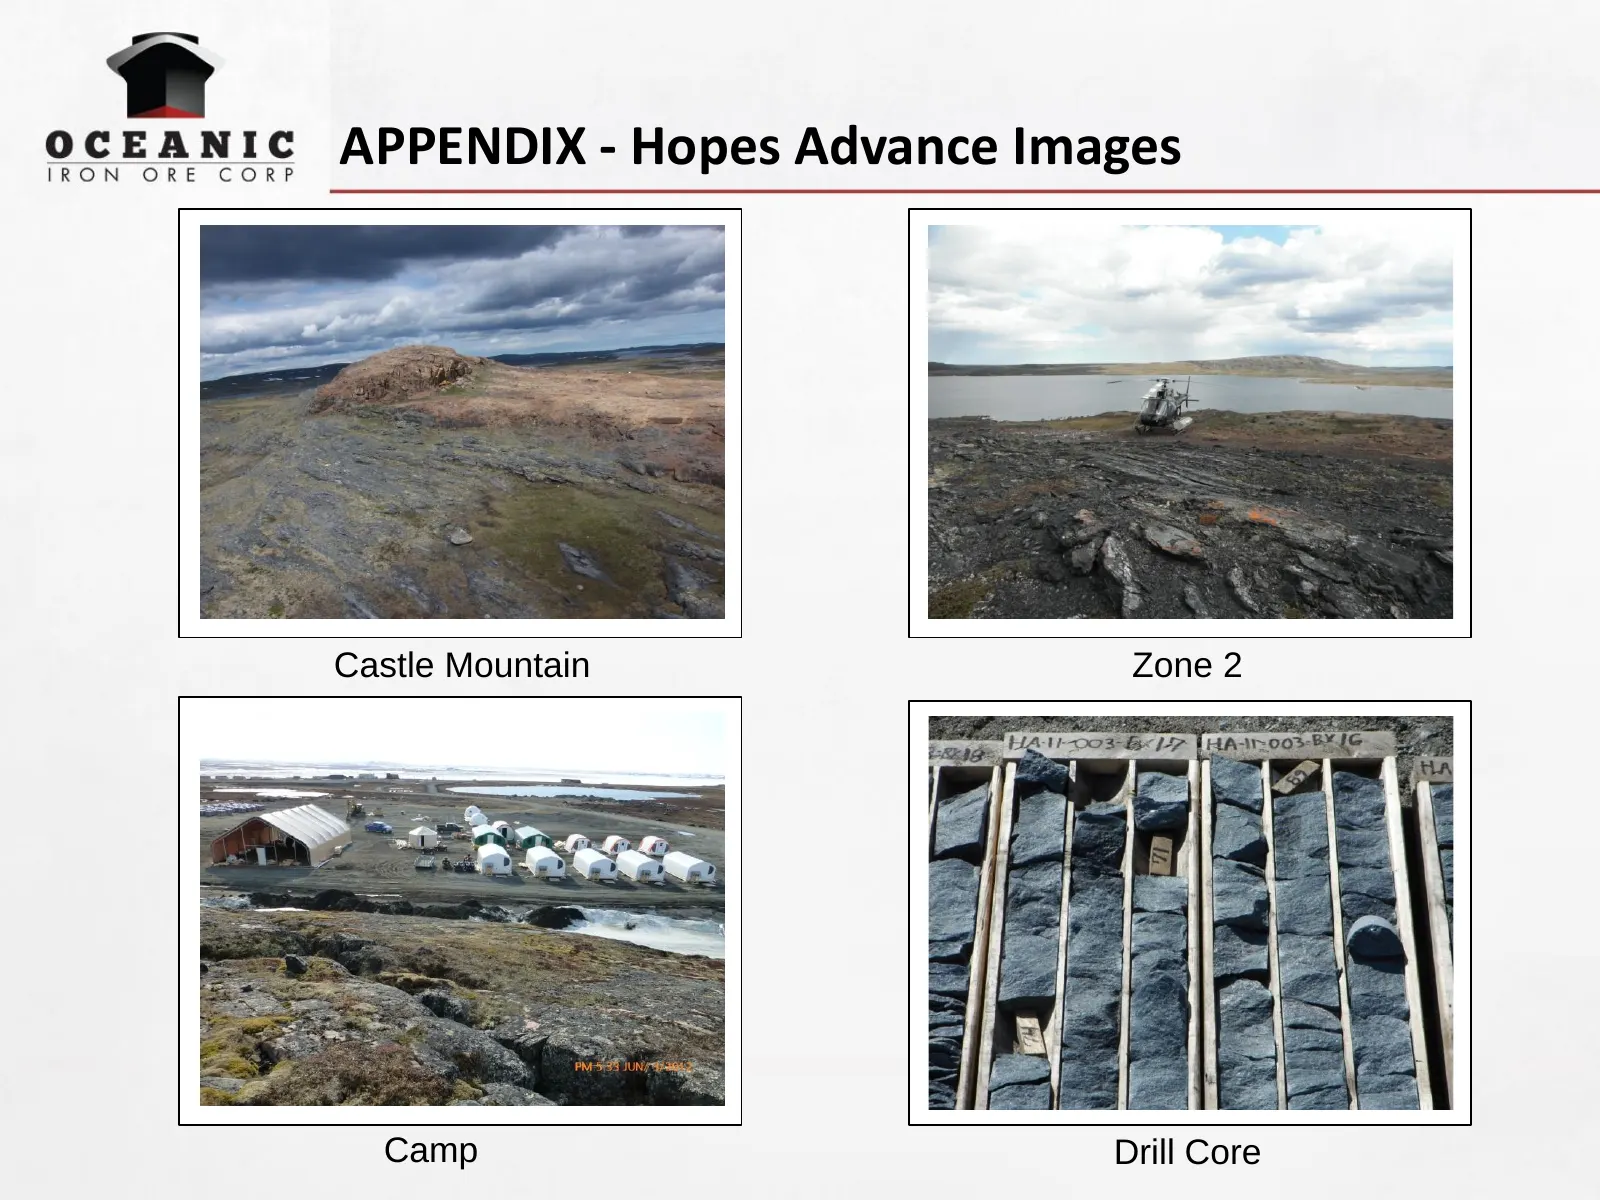
APPENDIX - Hopes Advance Images Castle Mountain Zone 2 Camp Drill Core
Source: Internet Archive copy of oceanicironore.com
More decks from Oceanic Iron Ore Corp.
 Investor Presentation (October 2026)26 slides · October 2026
 Investor Presentation (September 2026)26 slides · September 2026
 Investor Presentation (October 2025)26 slides · October 2025
 Investor Presentation (April 2017)47 slides · Apr 18, 2017
 Investor Presentation (April 2017)47 slides · Apr 18, 2017
 Investor Presentation (April 2017)47 slides · Apr 18, 2017