Naspers Limited Class N · JSE:NPN
Naspers Limited Class N — FY2018 Earnings Presentation
37 slides from Naspers Limited Class N's earnings presentation, 2018

Slide 1: Financial results presentation
Financial results presentation For the year ended 31 March 2018
Slide 2: Important information
Important information This report contains forward-looking statements as defined in the United States Private Securities Litigation Reform Act of 1995. Words such as “believe”, “anticipate”, “intend”, “seek”, “will”, “plan”, “could”, “may”, “endeavor” and similar expressions are intended to identify
Slide 3: Agenda
1. Strategic business review Agenda 2. Financial review 3. Outlook

Slide 4: Strategic business review
Strategic business review
Slide 5: We have delivered well on our objectives
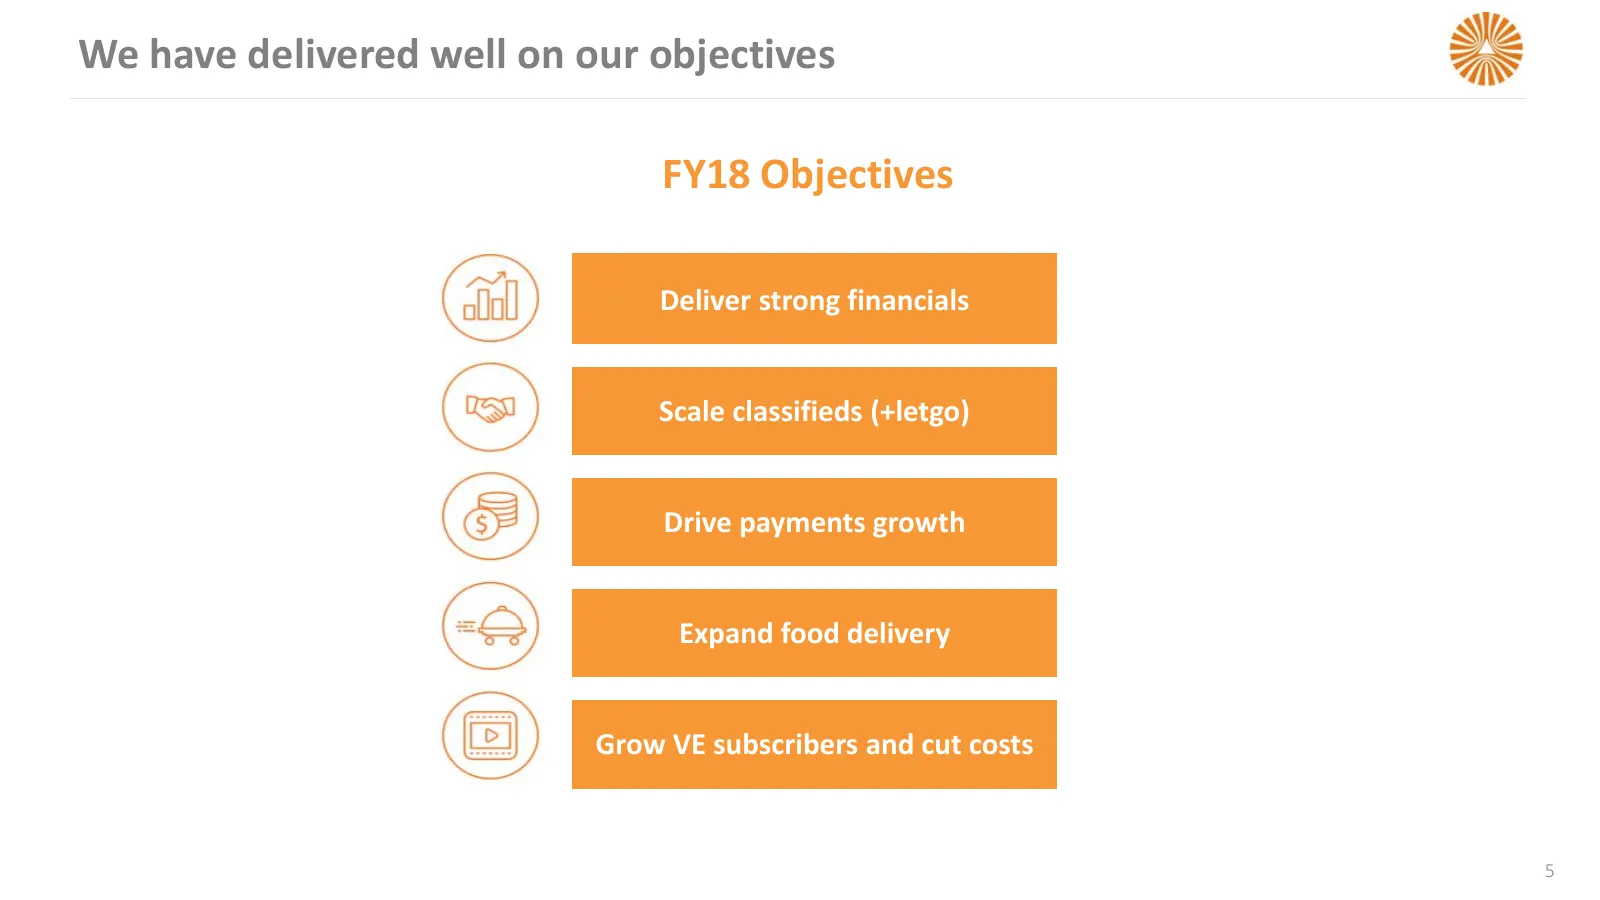
We have delivered well on our objectives FY18 Objectives Deliver strong financials Scale Scale classifieds classifieds (+letgo) (Letgo) Drive payments growth Expand online Expand foodfood delivery delivery Grow VE subscribers and cut costs 5
Slide 6: Flipkart: this is how we create value
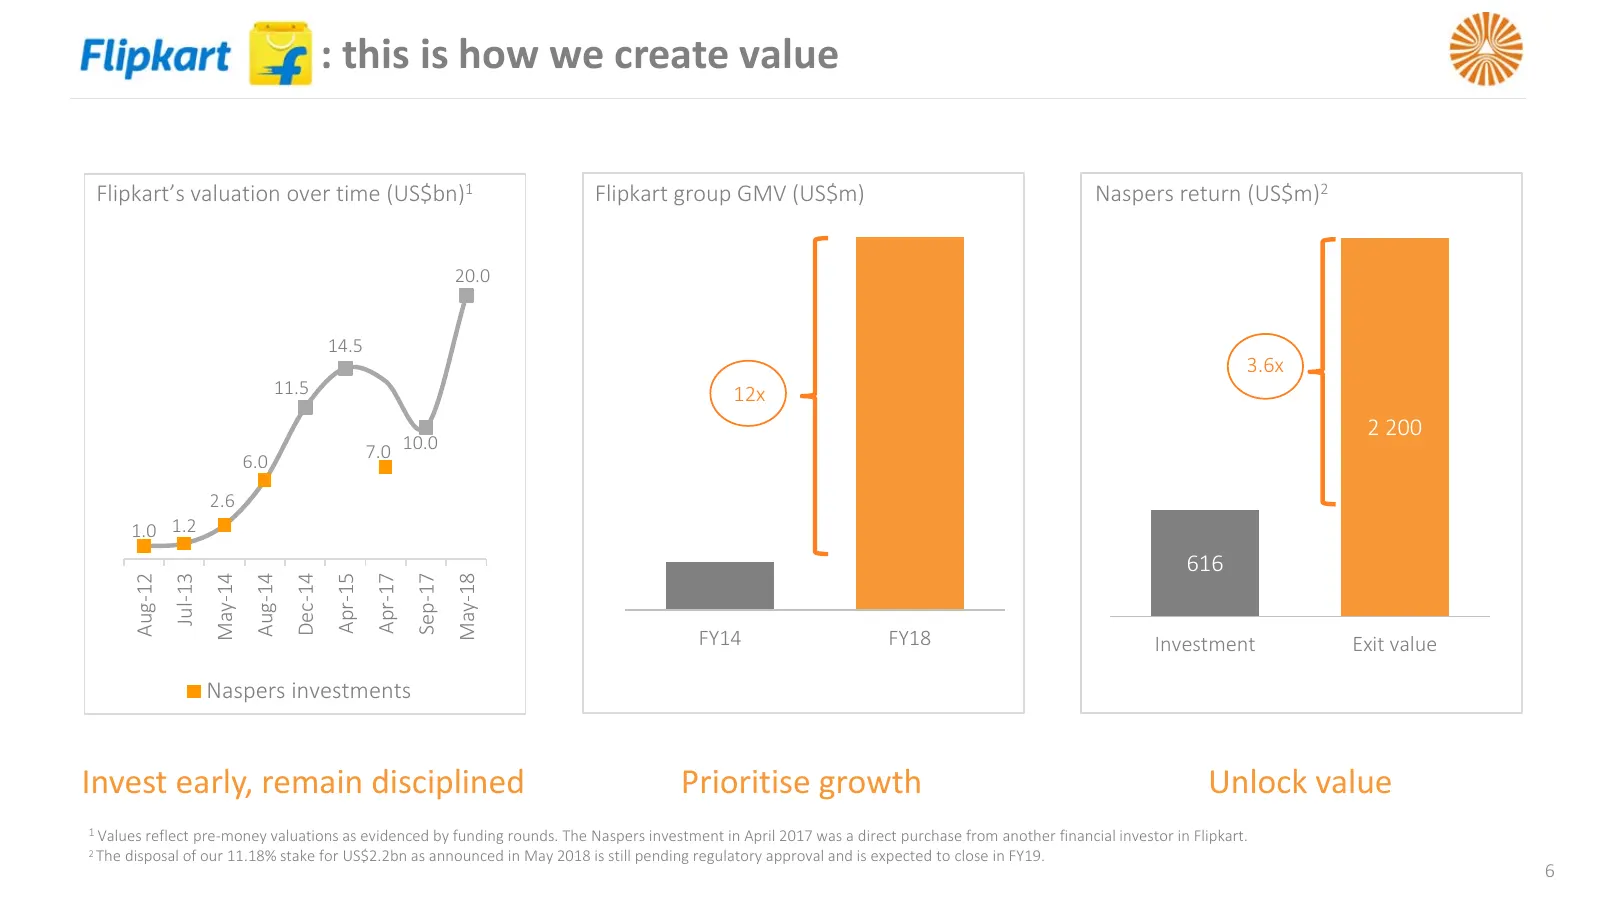
Flipkart: : this is how we create value Flipkart’s valuation over time (US$bn)1 Flipkart group GMV (US$m) Naspers return (US$m)2 20.0 14.5 3.6x 11.5 12x 2 200 7.0 10.0 6.0 2.6 1.0 1.2 616 Sep-17 Jul-13 Dec-14 May-18 Aug-12 May-14 Aug-14 Apr-15 Apr-17 FY14 FY18 Investment Exit value Naspers investmen
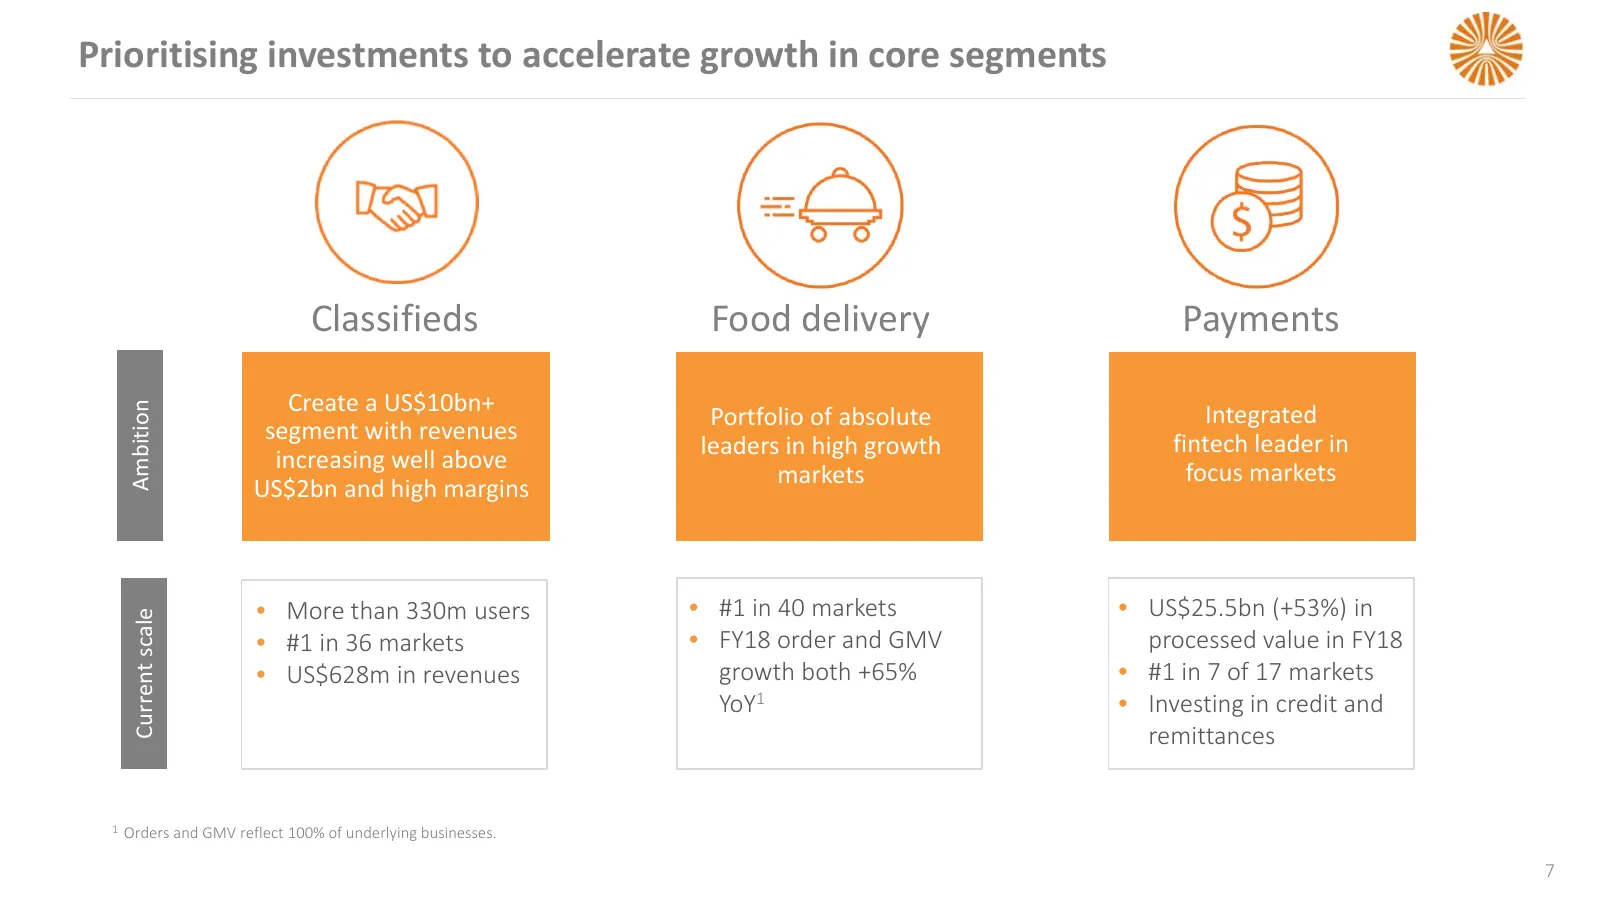
Slide 7: Prioritising investments to accelerate growth in core segments
Prioritising investments to accelerate growth in core segments Online food Payments delivery Classifieds Food delivery Payments Create a US$10bn+ Integrated Portfolio of absolute Ambition segment with revenues fintech leader in leaders in high growth increasing well above focus markets markets US$2b
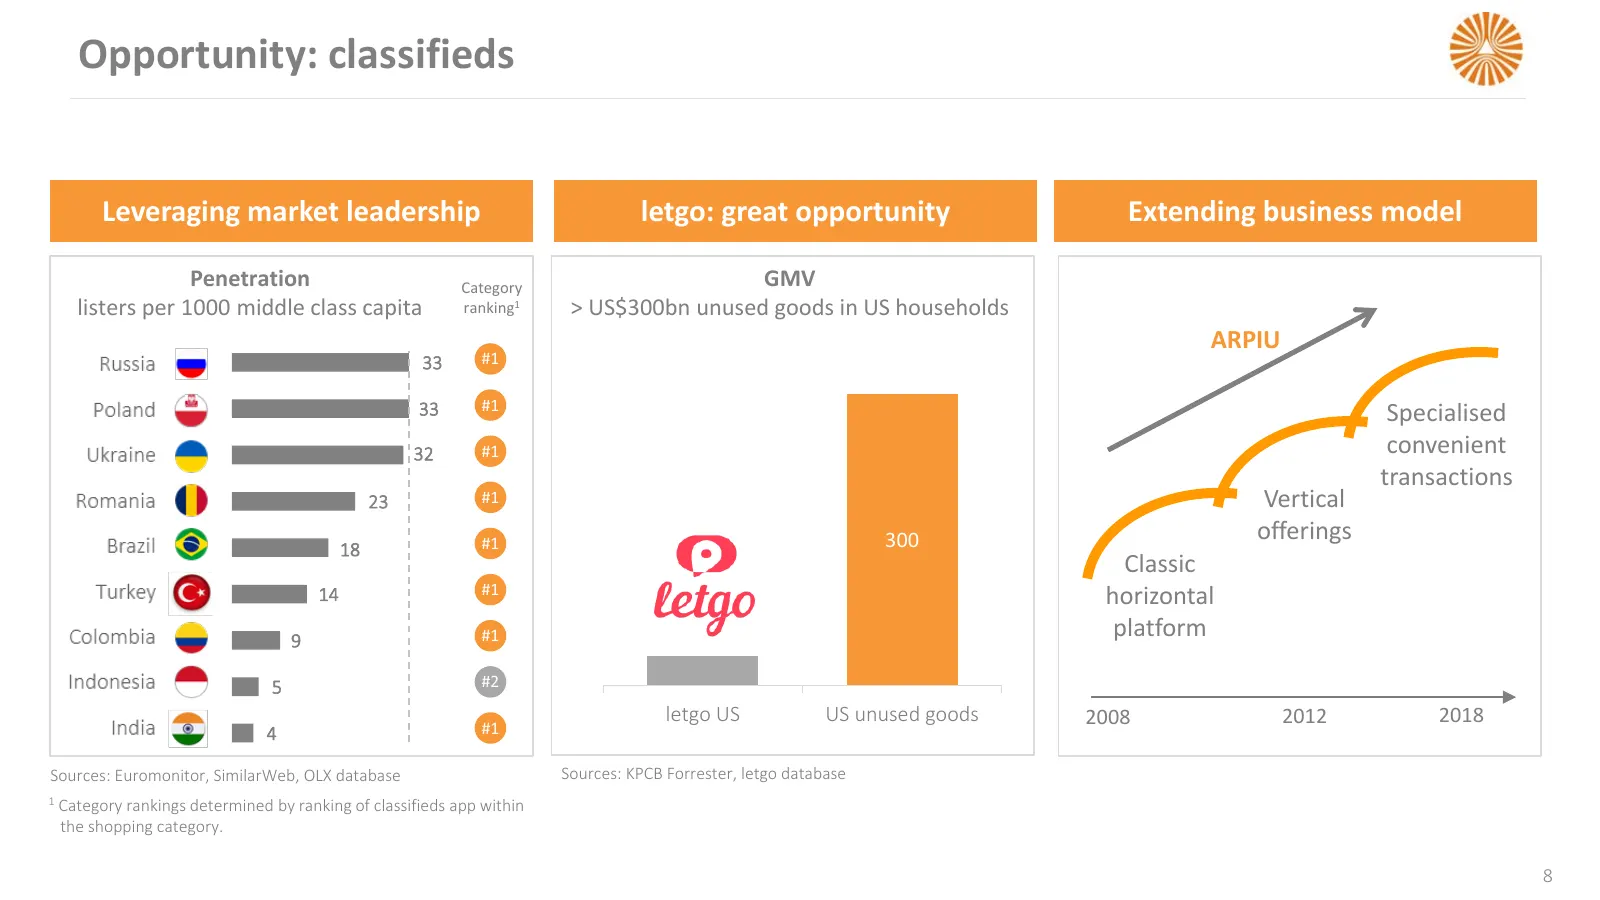
Slide 8: Opportunity: classifieds
Opportunity: classifieds Leveraging market leadership letgo: great opportunity Extending business model Penetration Category GMV listers per 1000 middle class capita ranking1 > US$300bn unused goods in US households ARPIU 33 #1 #1 33 Specialised 32 #1 convenient transactions 23 #1 Vertical #1 300 of
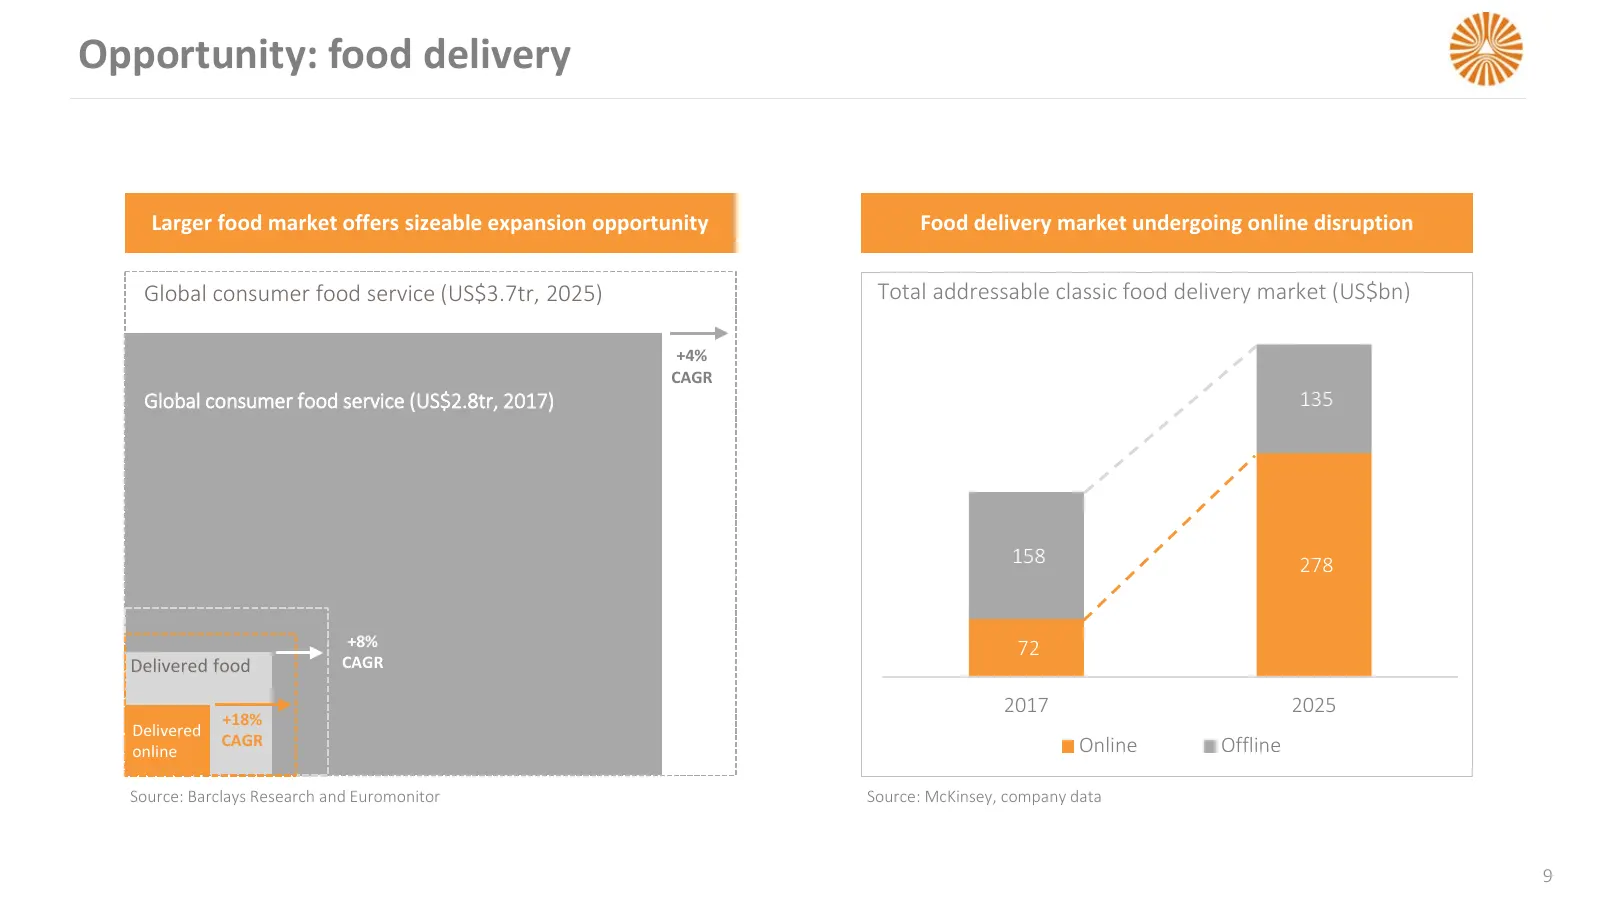
Slide 9: Opportunity: food delivery
Opportunity: food delivery Larger food market offers sizeable expansion opportunity Food delivery market undergoing online disruption Global consumer food service (US$3.7tr, 2025) Total addressable classic food delivery market (US$bn) +4% Offline CAGR Global consumer food service (US$2.8tr, 120 2017
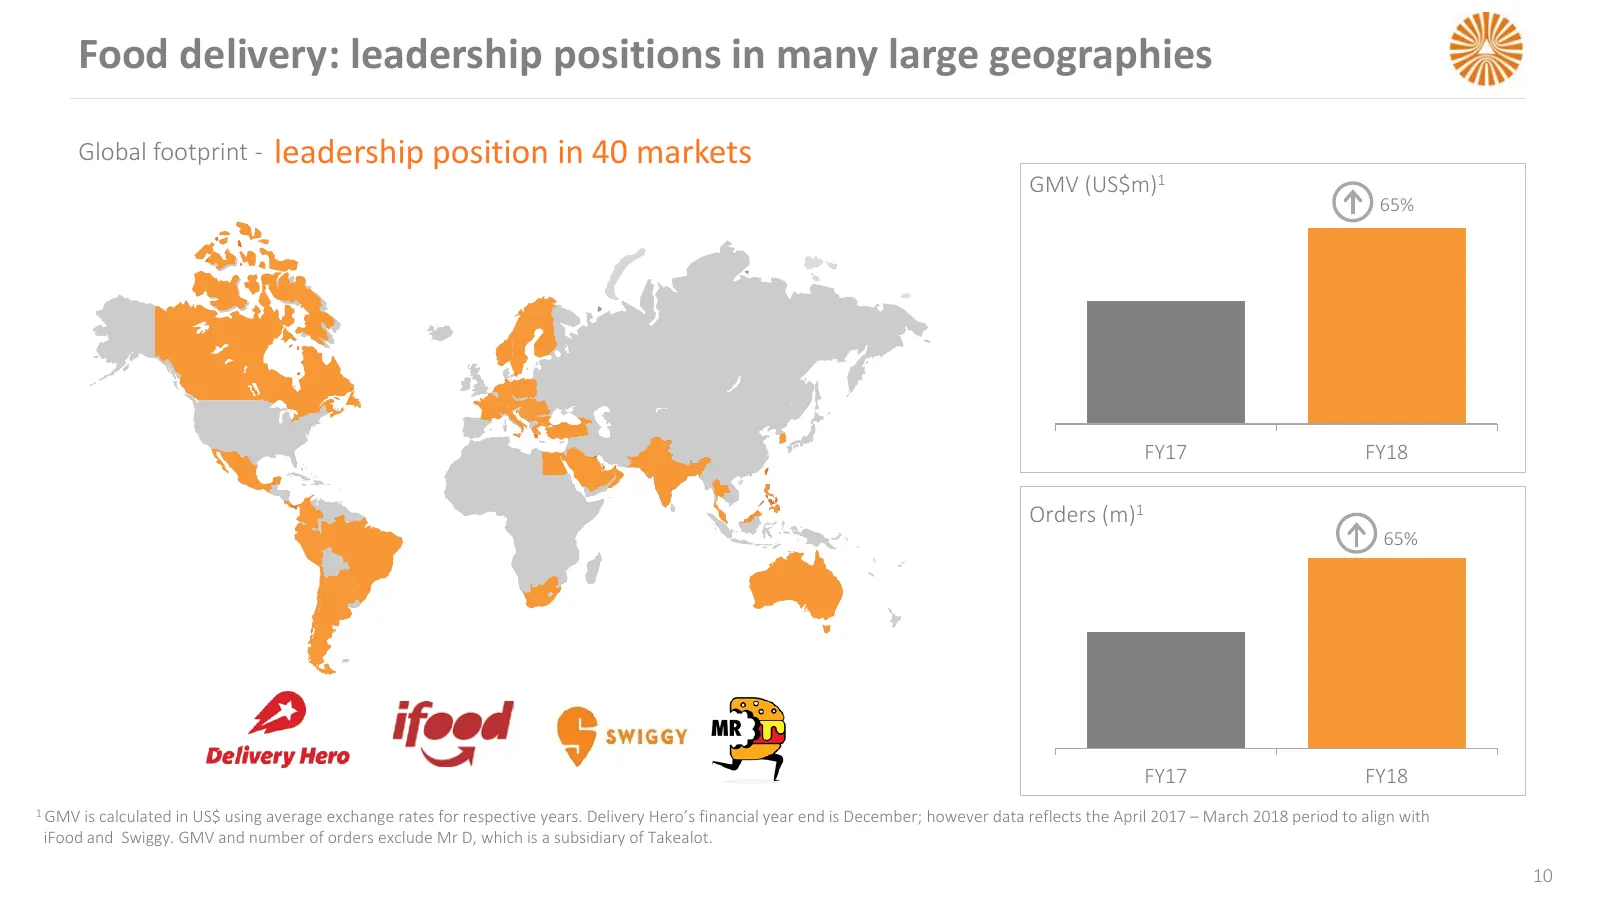
Slide 10: Food delivery: leadership positions in many large geographies
Food delivery: leadership positions in many large geographies Global footprint - leadership position in 40 markets GMV (US$m)1 65% FY17 FY18 Orders (m)1 65% FY17 FY18 1 GMV is calculated in US$ using average exchange rates for respective years. Delivery Hero’s financial year end is December; however
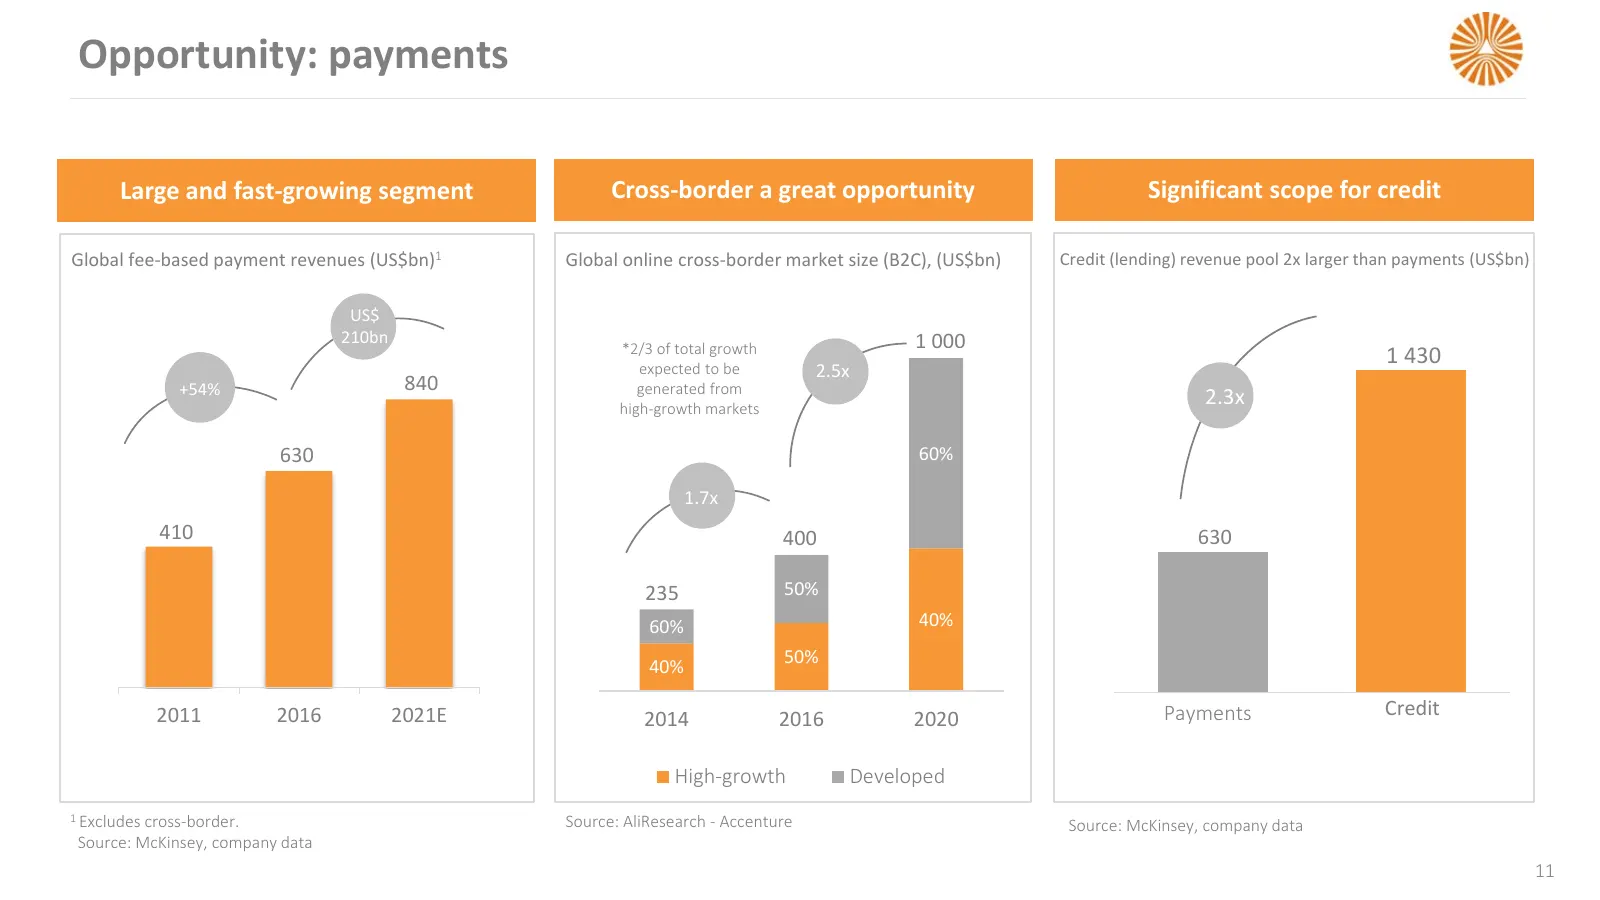
Slide 11: Opportunity: payments
Opportunity: payments Large and fast-growing segment Cross-border a great opportunity Significant scope for credit Global fee-based payment revenues (US$bn)1 Global online cross-border market size (B2C), (US$bn) Credit (lending) revenue pool 2x larger than payments (US$bn) US$ 210bn 1 000 *2/3 of to
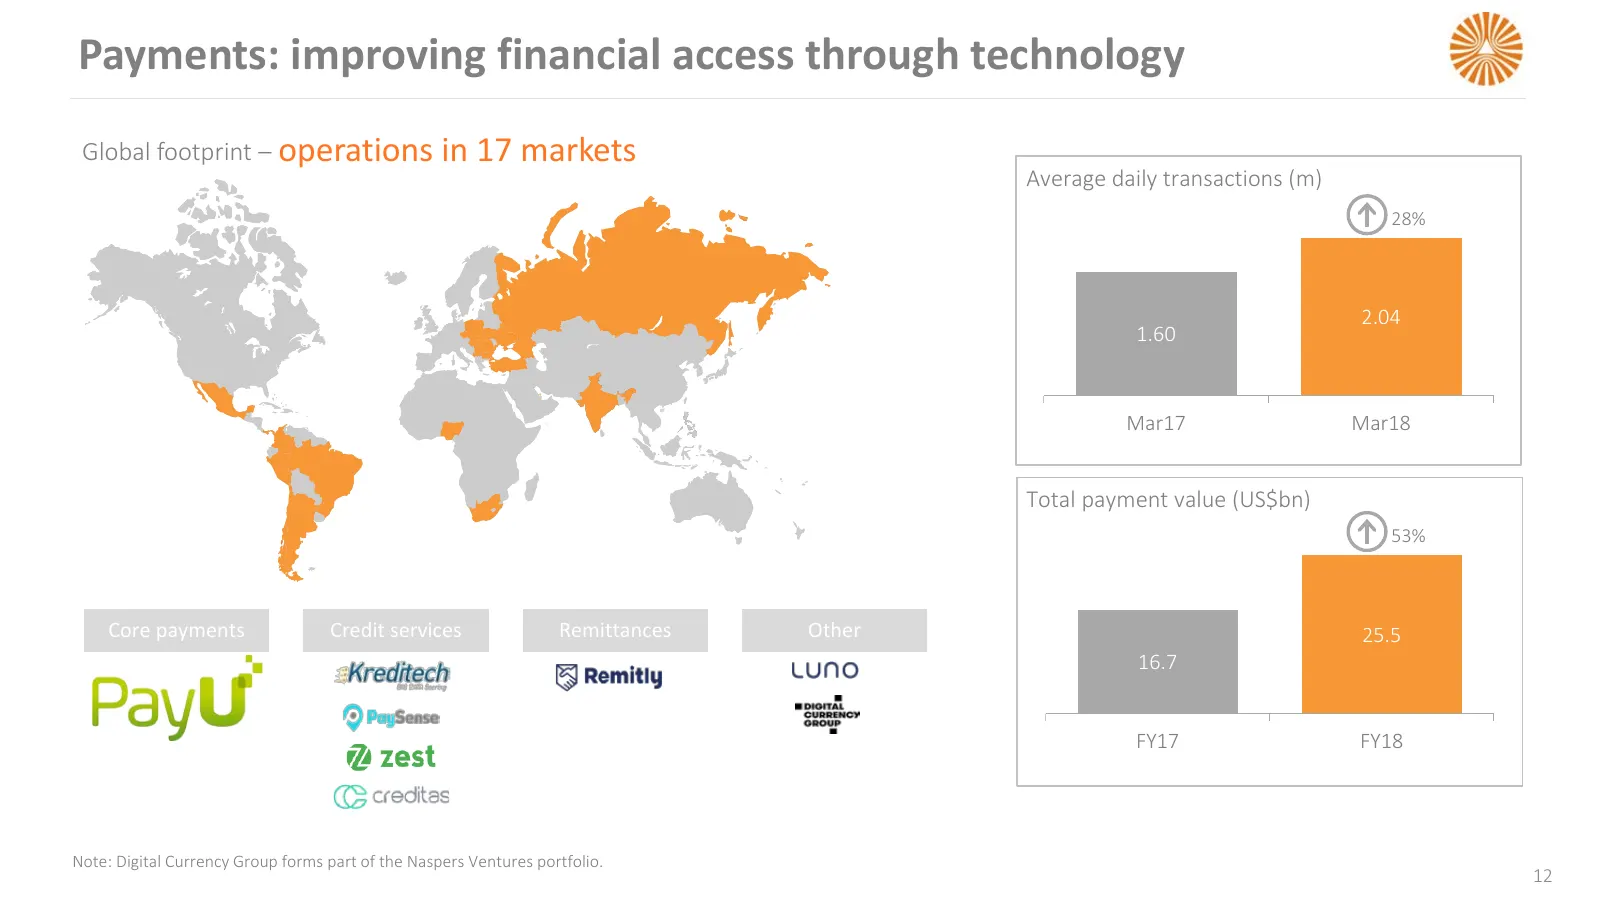
Slide 12: Payments: improving financial access through technology
Payments: improving financial access through technology Global footprint – operations in 17 markets Average daily transactions (m) 28% 2.04 1.60 Mar17 Mar18 Total payment value (US$bn) 53% Core payments Credit services Remittances Other 25.5 16.7 FY17 FY18 Note: Digital Currency Group forms part of

Slide 13: Financial review
Financial review
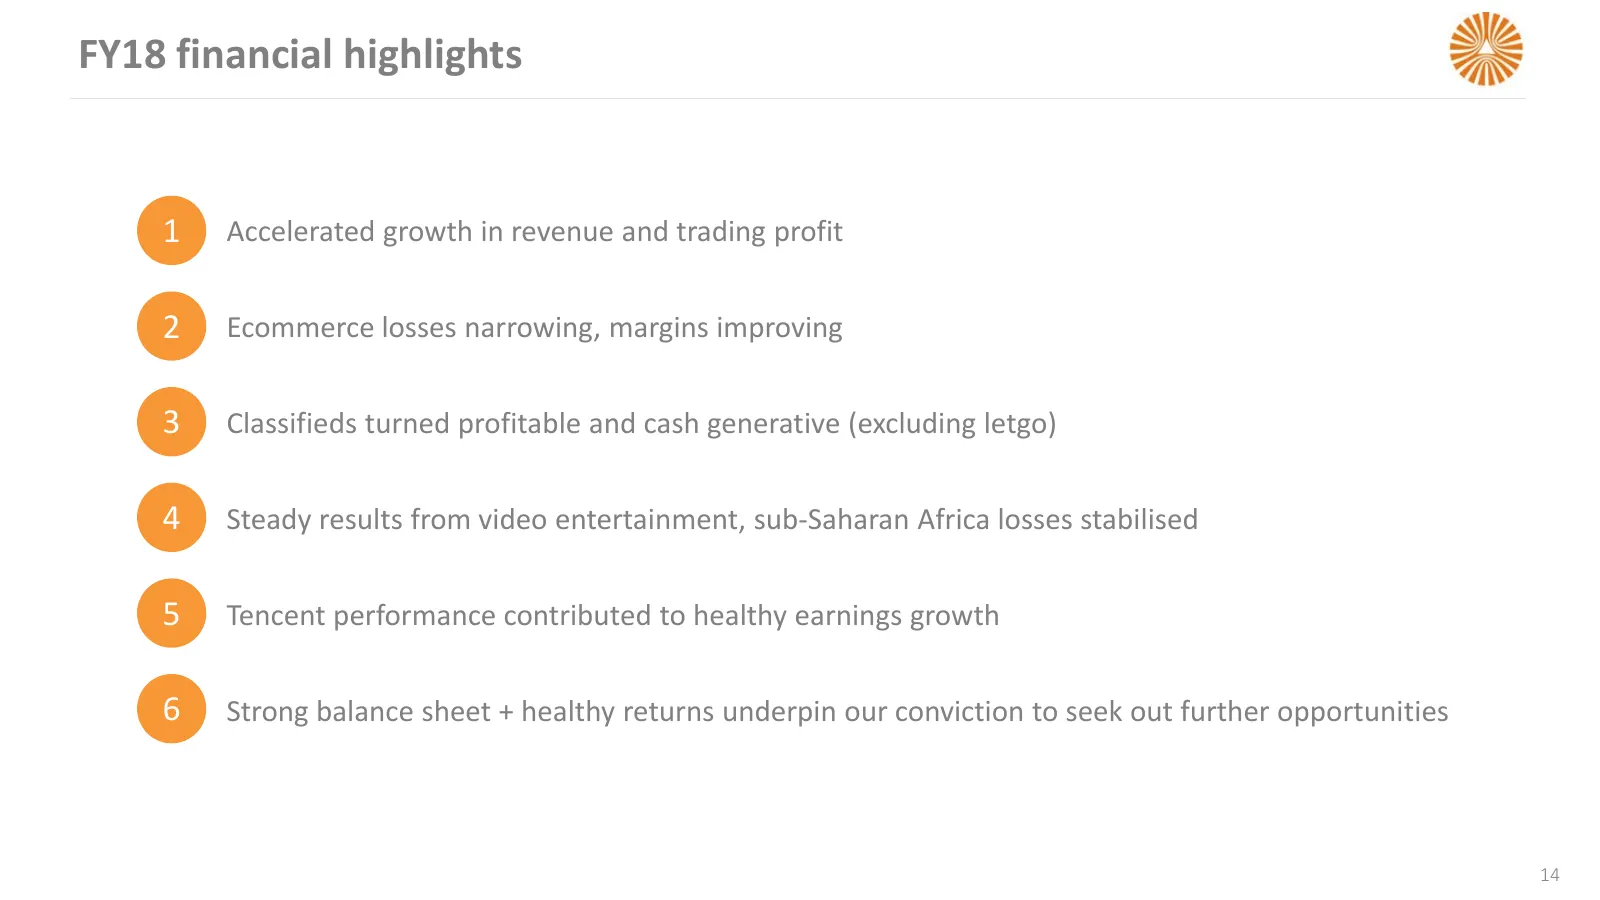
Slide 14: FY18 financial highlights
FY18 financial highlights 1 Accelerated growth in revenue and trading profit 2 Ecommerce losses narrowing, margins improving 3 Classifieds turned profitable and cash generative (excluding letgo) 4 Steady results from video entertainment, sub-Saharan Africa losses stabilised 5 Tencent performance con
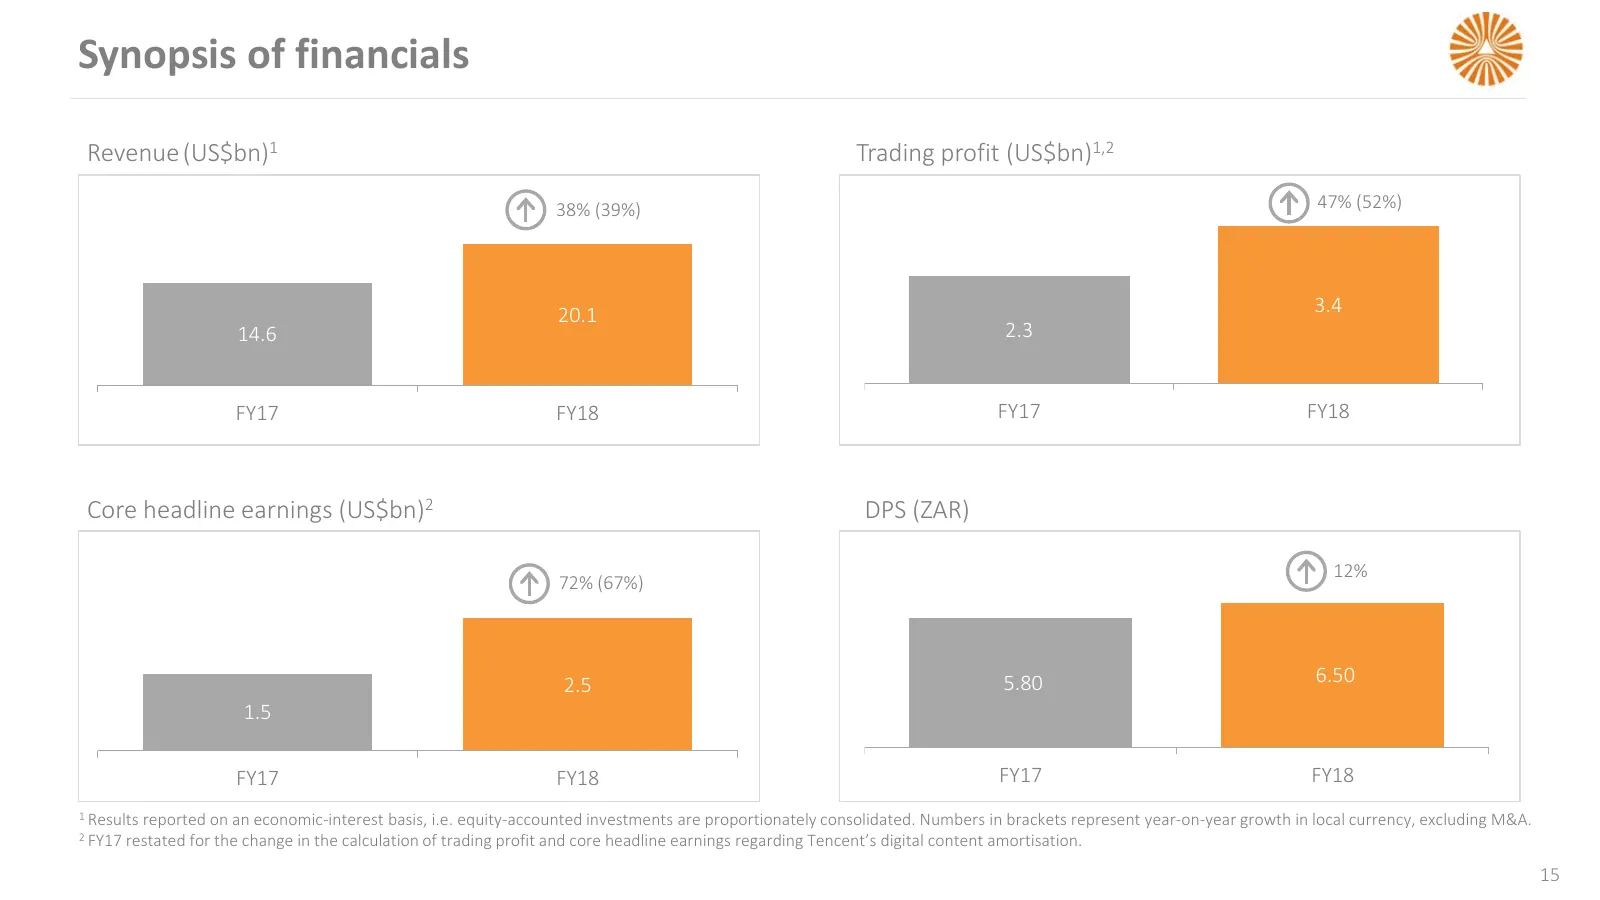
Slide 15: Synopsis of financials
Synopsis of financials Revenue (US$bn)1 Trading profit (US$bn)1,2 38% (39%) 47% (52%) 20.1 3.4 14.6 2.3 FY17 FY18 FY17 FY18 Core headline earnings (US$bn)2 DPS (ZAR) 12% 72% (67%) 2.5 5.80 6.50 1.5 FY17 FY18 FY17 FY18 1 Results reported on an economic-interest basis, i.e. equity-accounted investment
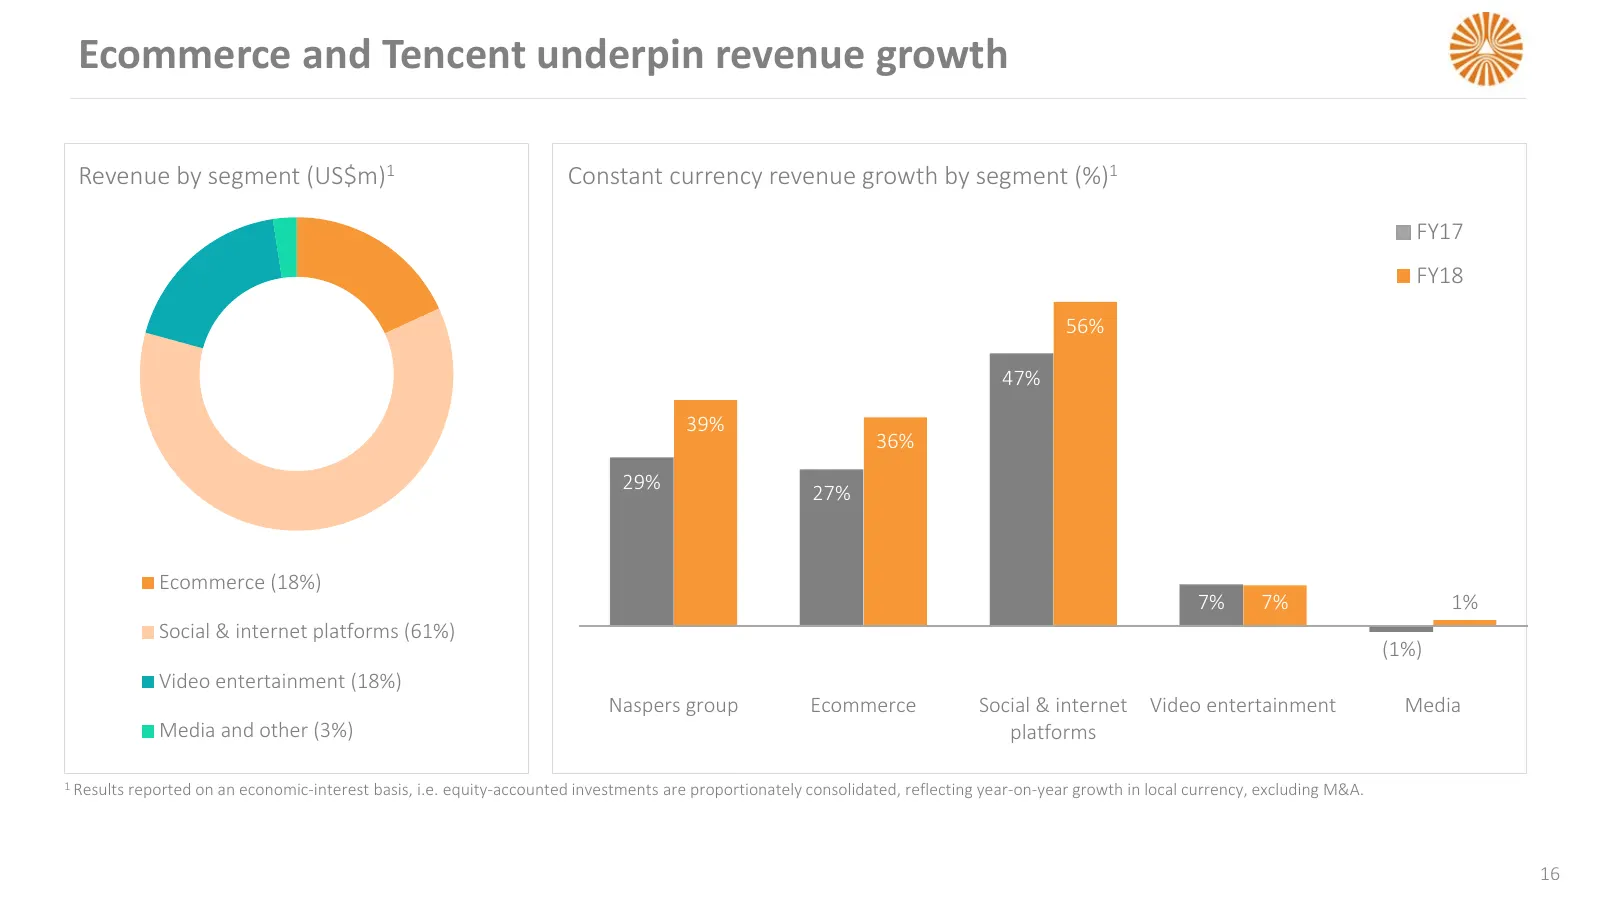
Slide 16: Ecommerce and Tencent underpin revenue growth
Ecommerce and Tencent underpin revenue growth Revenue by segment (US$m)1 Constant currency revenue growth by segment (%)1 FY17 FY18 56% 47% 39% 36% 29% 27% Ecommerce (18%) 7% 7% 1% Social & internet platforms (61%) (1%) Video entertainment (18%) Naspers group Ecommerce Social & internet Video entert
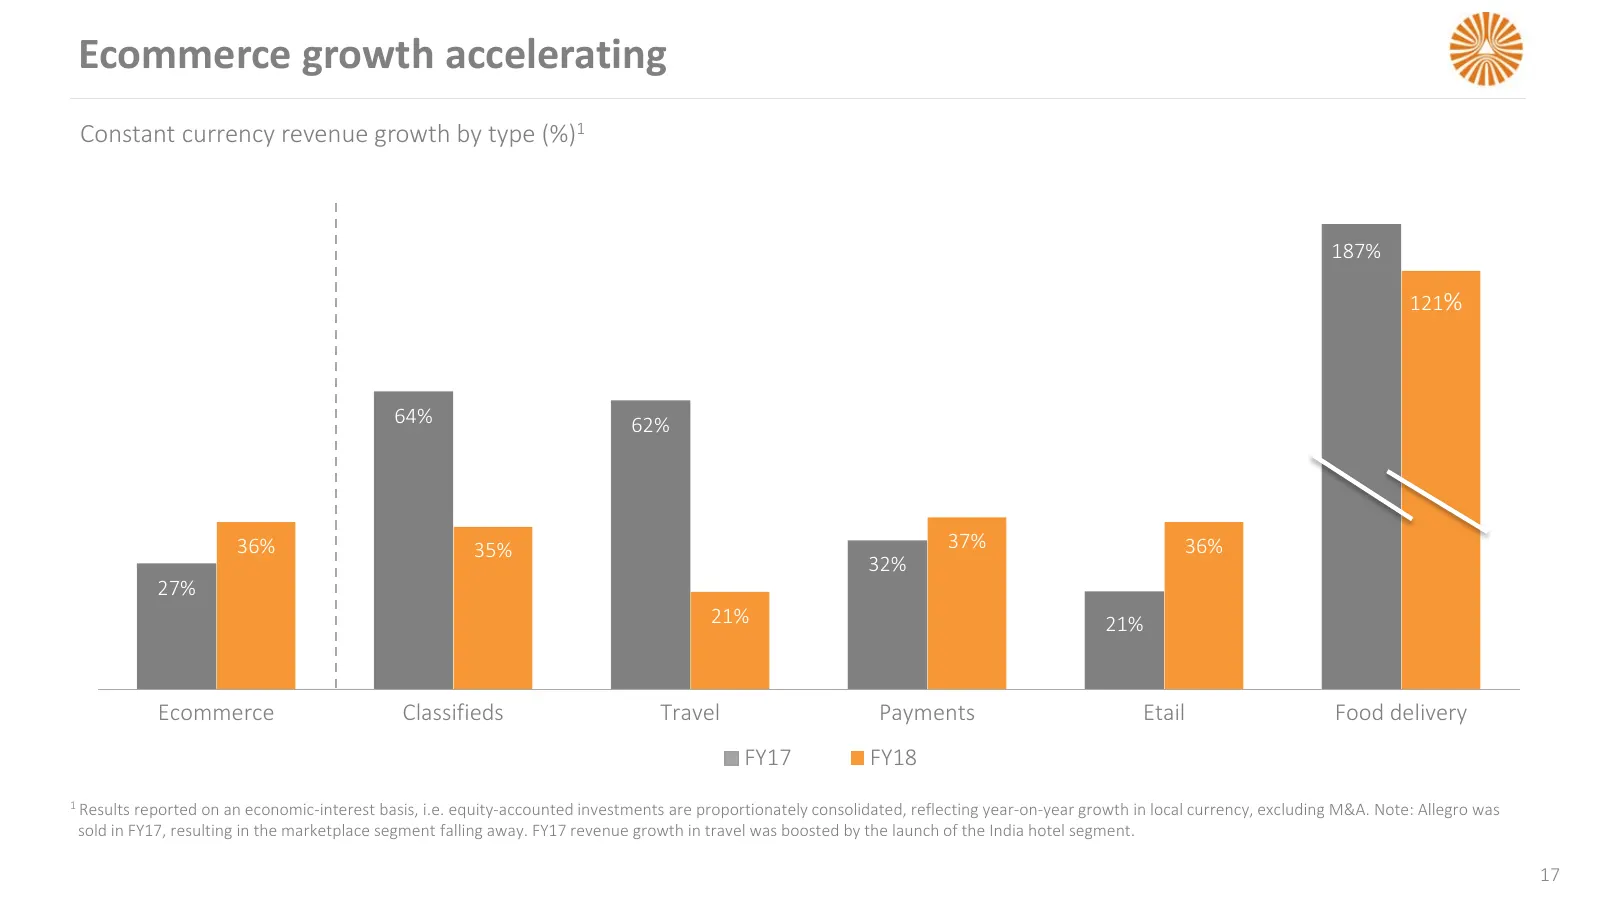
Slide 17: Ecommerce growth accelerating
Ecommerce growth accelerating Constant currency revenue growth by type (%)1 187% 121% 64% 62% 36% 35% 37% 36% 32% 27% 21% 21% Ecommerce Classifieds Travel Payments Etail Food delivery FY17 FY18 1 Results reported on an economic-interest basis, i.e. equity-accounted investments are proportionately co
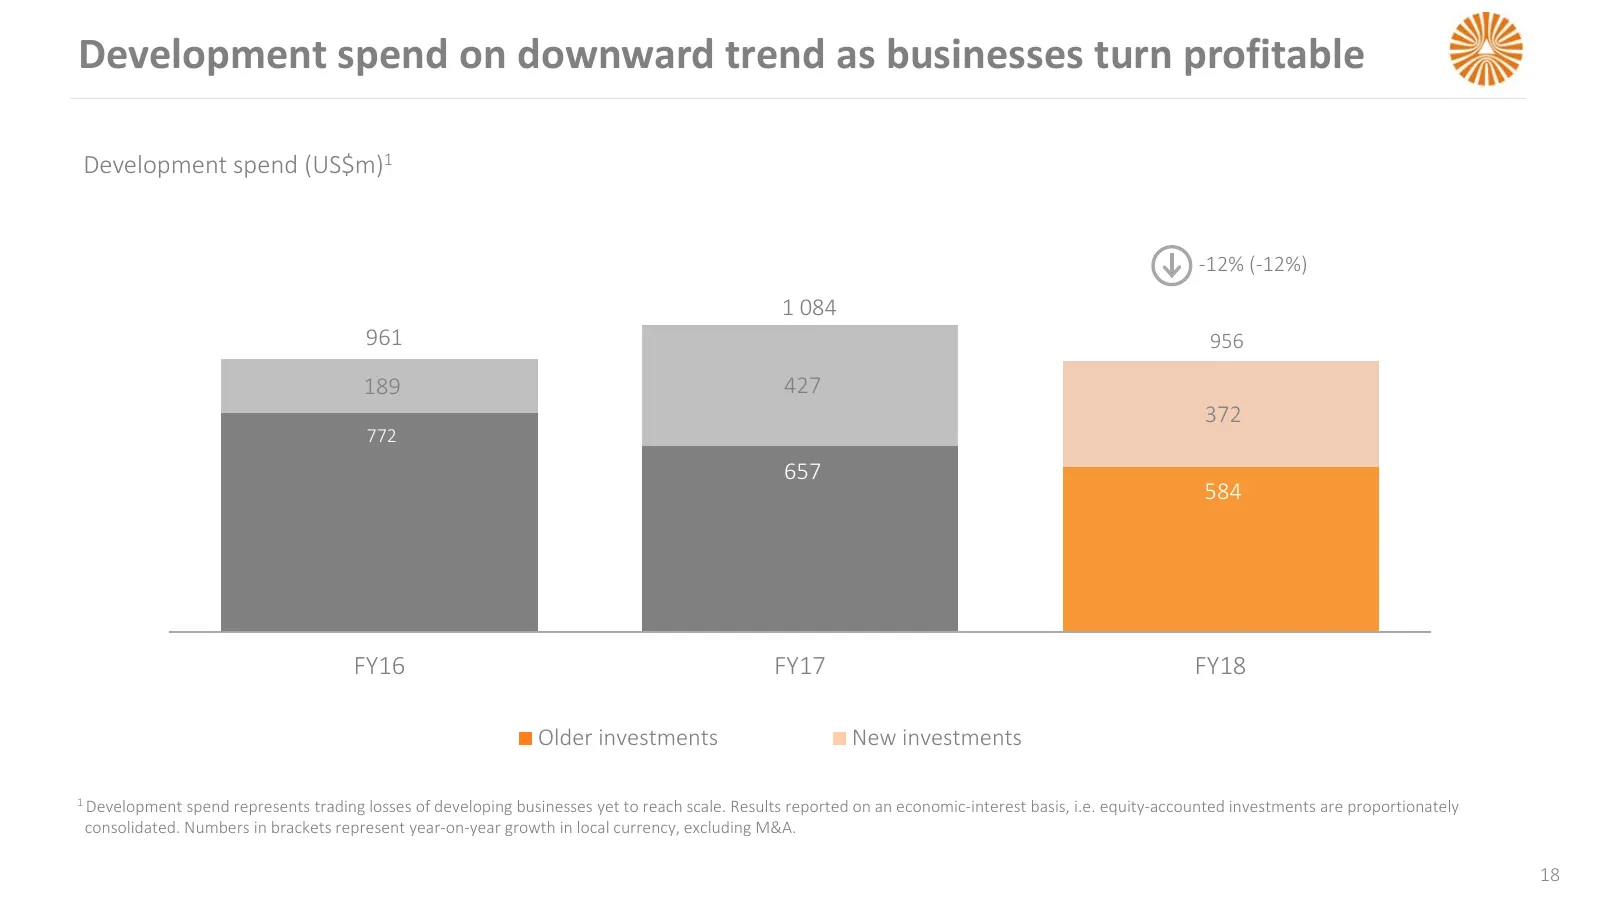
Slide 18: Development spend on downward trend as businesses turn profitable
Development spend on downward trend as businesses turn profitable Development spend (US$m)1 -12% (-12%) 1 084 961 956 189 427 372 772 657 584 FY16 FY17 FY18 Older investments New investments 1 Development spend represents trading losses of developing businesses yet to reach scale. Results reported o
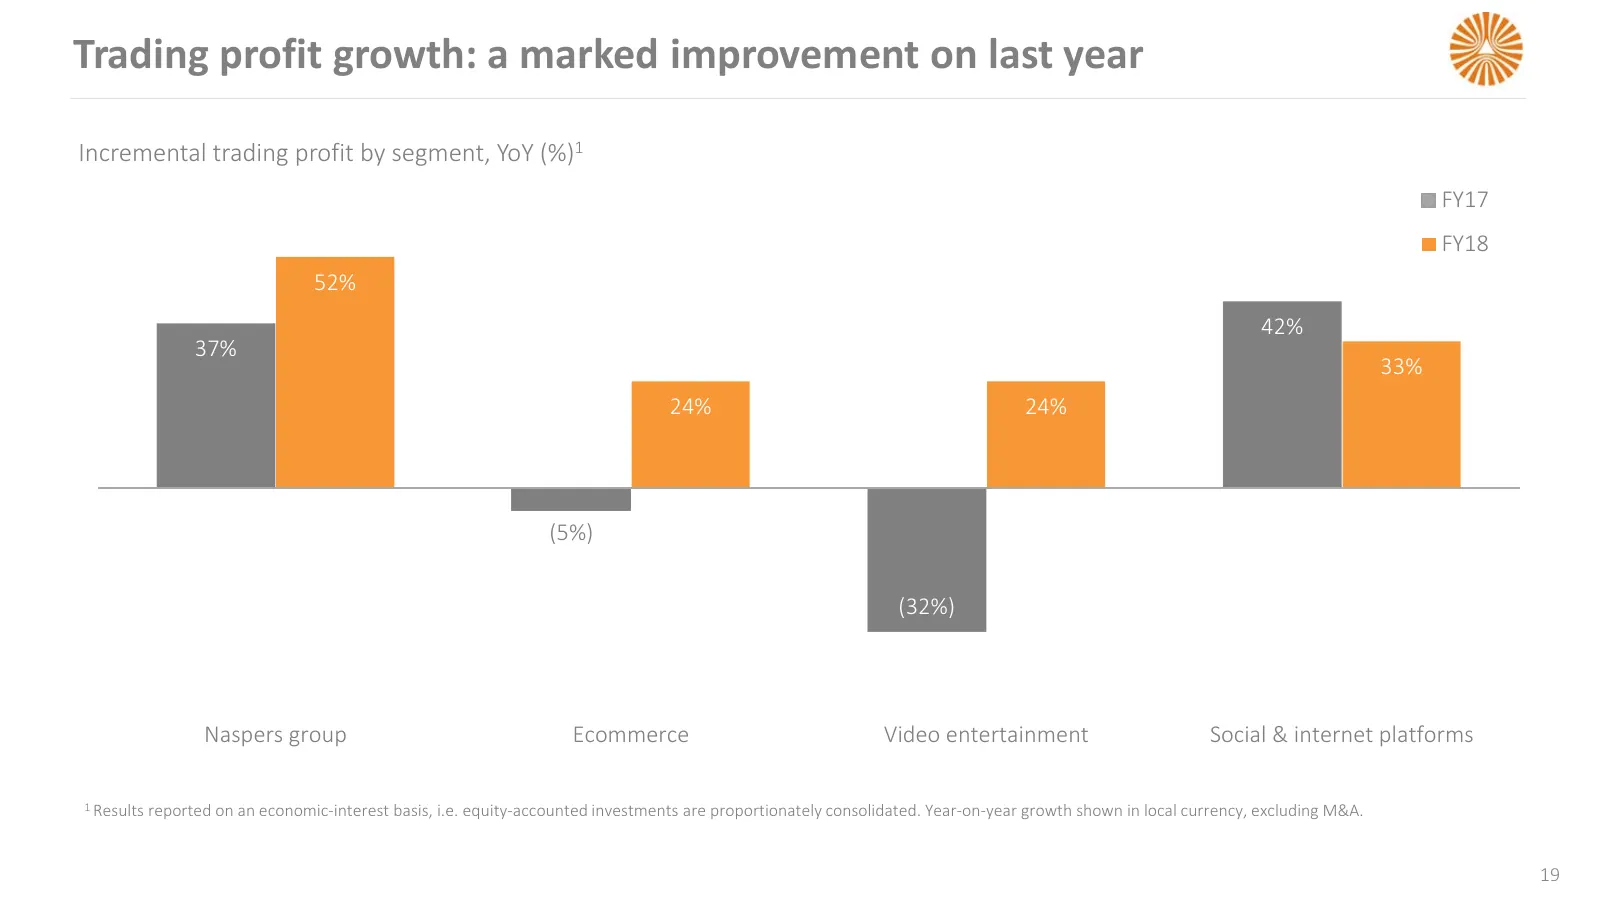
Slide 19: Trading profit growth: a marked improvement on last year
Trading profit growth: a marked improvement on last year Incremental trading profit by segment, YoY (%)1 FY17 FY18 52% 42% 37% 33% 24% 24% (5%) (32%) >-100% Naspers group Ecommerce Video entertainment Social & internet platforms 1 Results reported on an economic-interest basis, i.e. equity-accounted
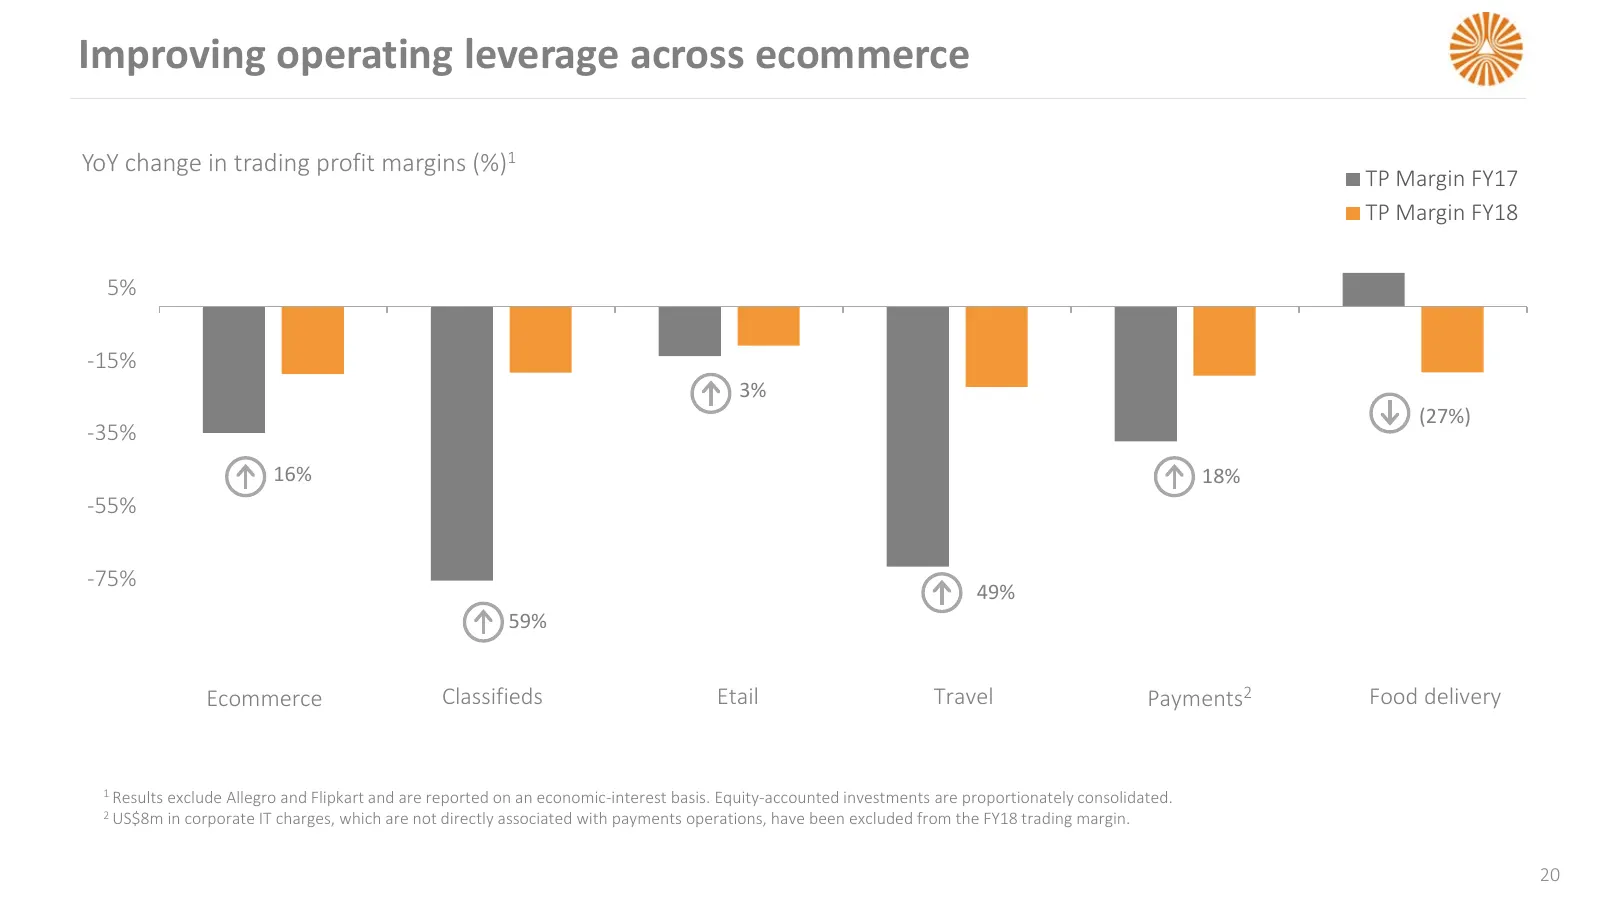
Slide 20: Improving operating leverage across ecommerce
Improving operating leverage across ecommerce YoY change in trading profit margins (%)1 TP Margin FY17 TP Margin FY18 5% -15% 3% (27%) -35% 16% 18% -55% -75% 49% 59% Ecommerce Classifieds Etail Travel Payments2 Food delivery 1 Results exclude Allegro and Flipkart and are reported on an economic-inte
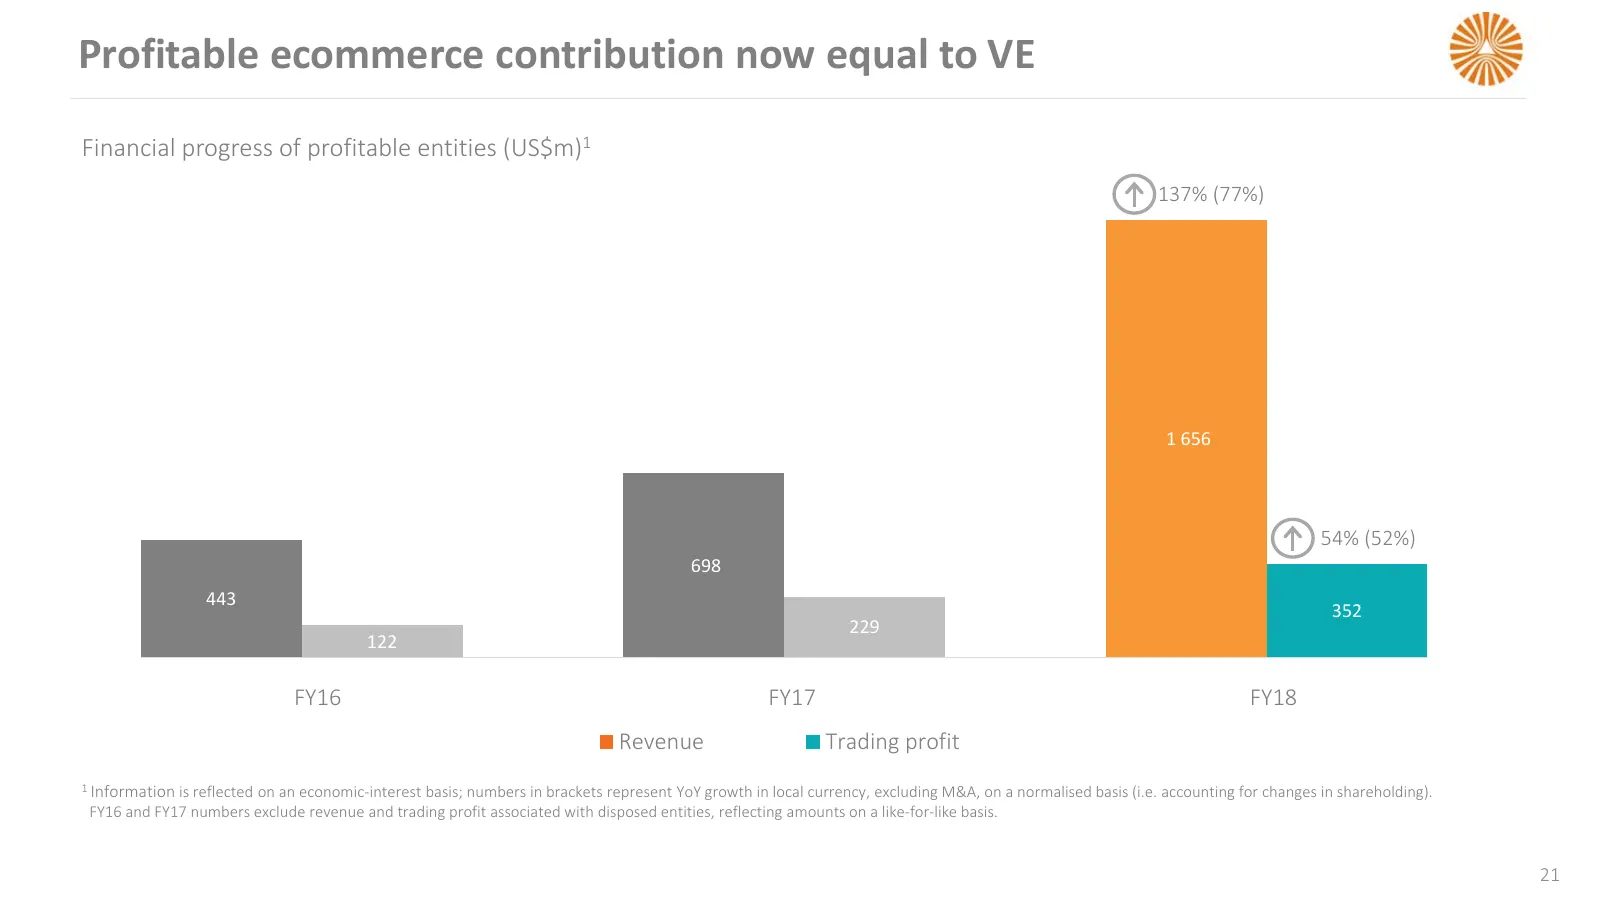
Slide 21: Profitable ecommerce contribution now equal to VE
Profitable ecommerce contribution now equal to VE Financial progress of profitable entities (US$m)1 137% (77%) 1 656 54% (52%) 698 443 352 229 122 FY16 FY17 FY18 Revenue Trading profit 1 Information is reflected on an economic-interest basis; numbers in brackets represent YoY growth in local currenc
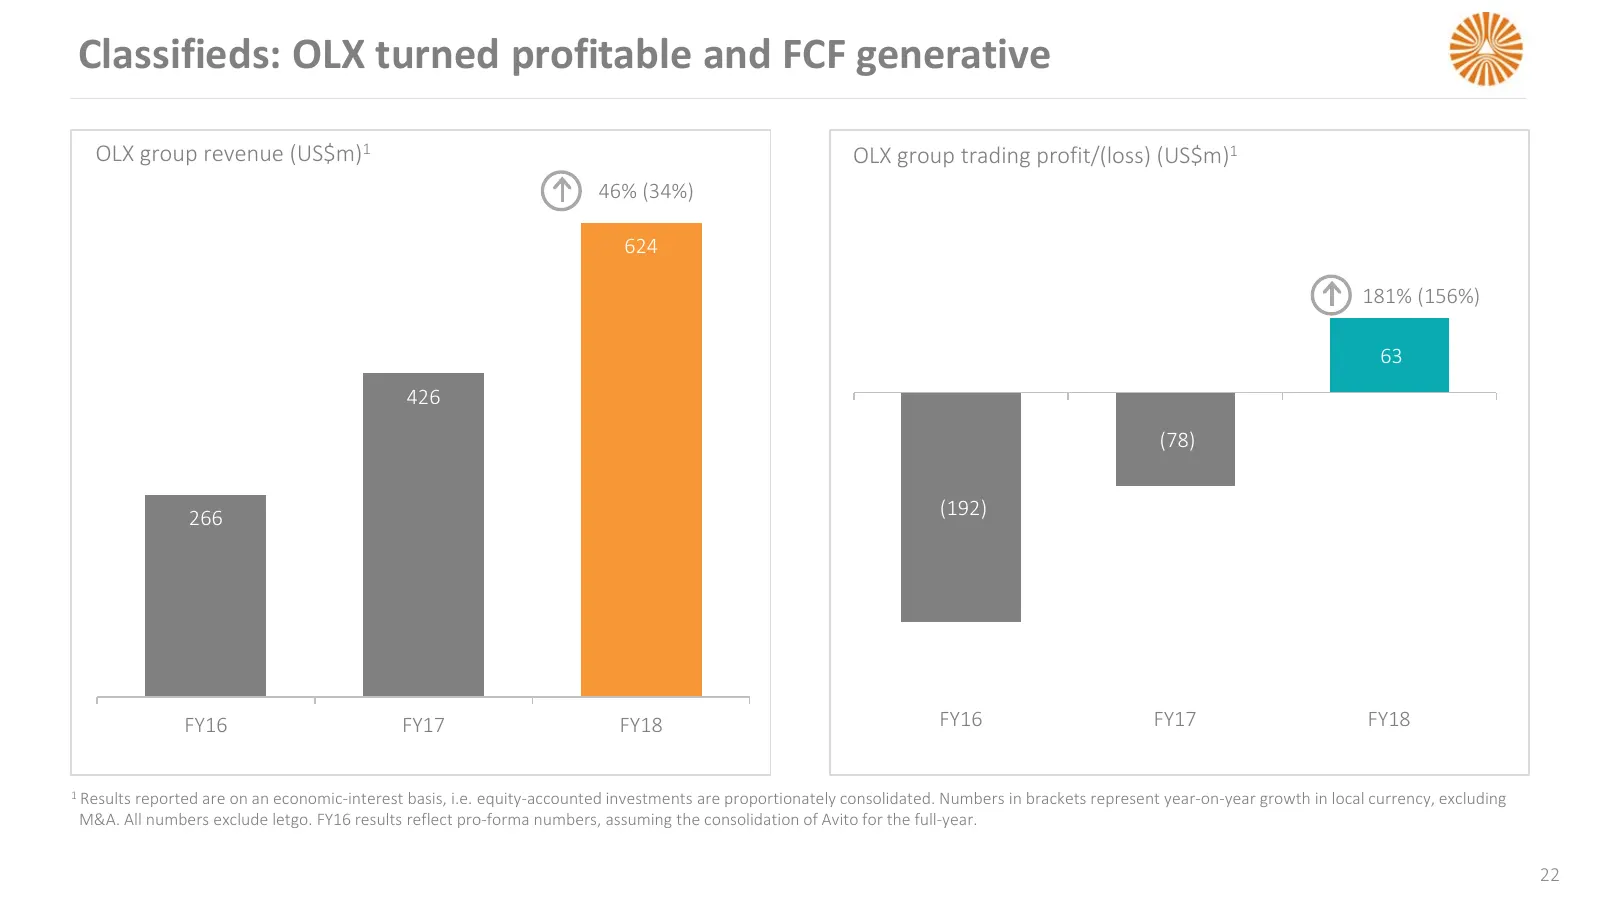
Slide 22: Classifieds: OLX turned profitable and FCF generative
Classifieds: OLX turned profitable and FCF generative OLX group revenue (US$m)1 OLX group trading profit/(loss) (US$m)1 46% (34%) 624 181% (156%) 63 426 (78) 266 (192) FY16 FY17 FY18 FY16 FY17 FY18 1 Results reported are on an economic-interest basis, i.e. equity-accounted investments are proportion
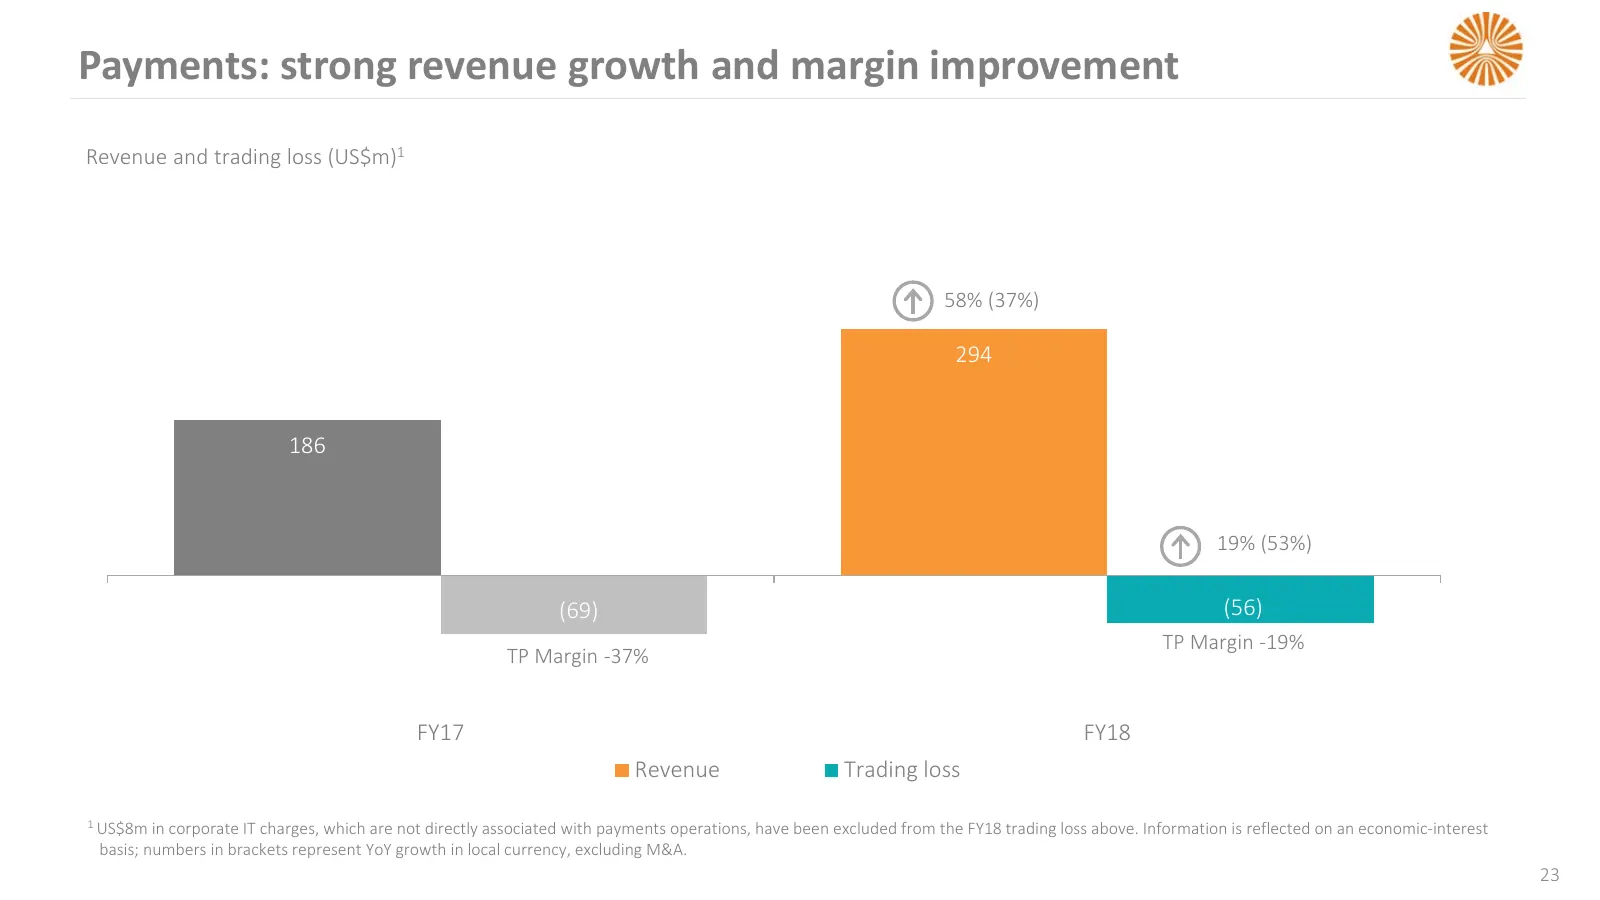
Slide 23: Payments: strong revenue growth and margin improvement
Payments: strong revenue growth and margin improvement Revenue and trading loss (US$m)1 58% (37%) 294 186 19% (53%) (69) (56) TP Margin -19% TP Margin -37% FY17 FY18 Revenue Trading loss 1 US$8m in corporate IT charges, which are not directly associated with payments operations, have been excluded f
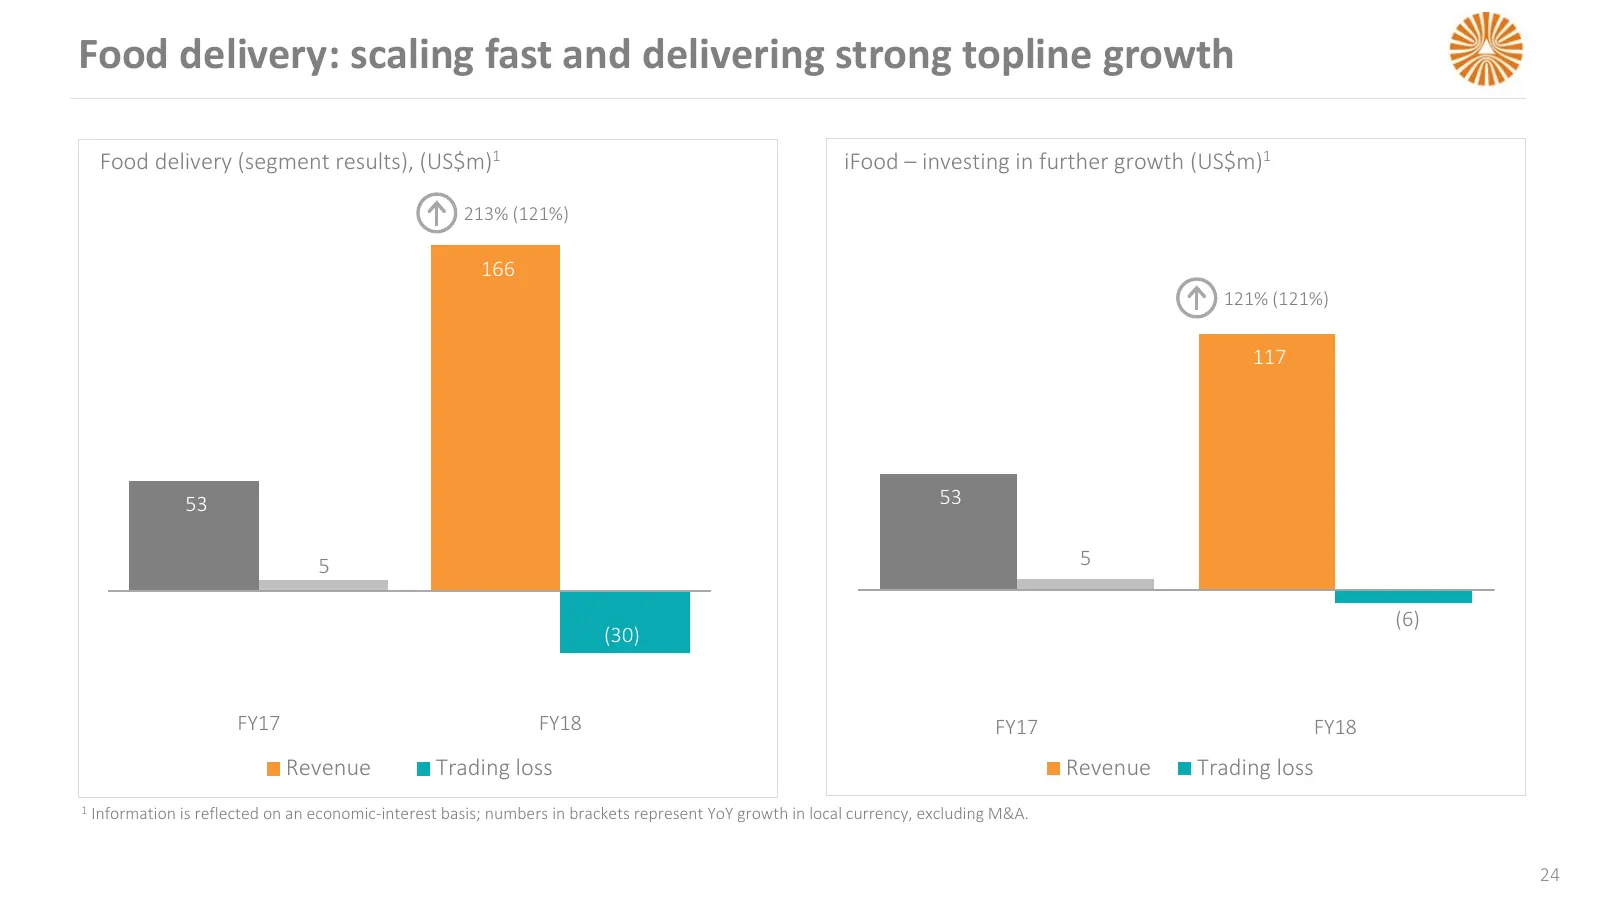
Slide 24: Food delivery: scaling fast and delivering strong topline growth
Food delivery: scaling fast and delivering strong topline growth Food delivery (segment results), (US$m)1 iFood – investing in further growth (US$m)1 213% (121%) 166 121% (121%) 117 53 53 5 5 (6) (30) FY17 FY18 FY17 FY18 Revenue Trading loss Revenue Trading loss 1 Information is reflected on an econ
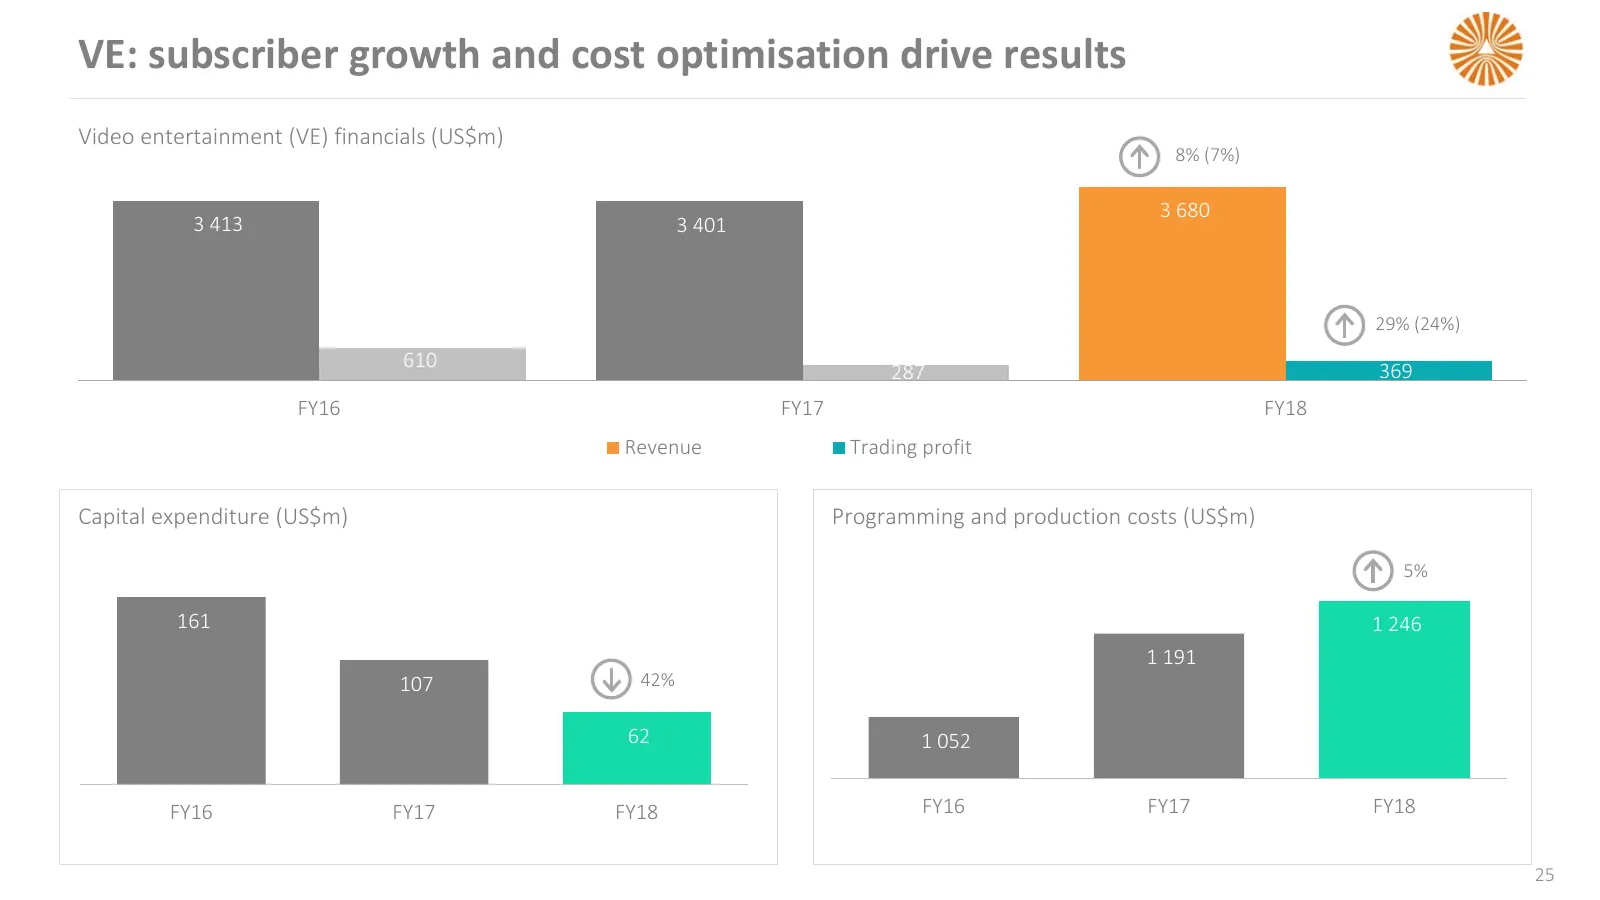
Slide 25: VE: subscriber growth and cost optimisation drive results
VE: subscriber growth and cost optimisation drive results Video entertainment (VE) financials (US$m) 8% (7%) 3 680 3 413 3 401 29% (24%) 610 287 369 FY16 FY17 FY18 Revenue Trading profit Capital expenditure (US$m) Programming and production costs (US$m) 5% 161 1 246 1 191 107 42% 62 1 052 FY16 FY17
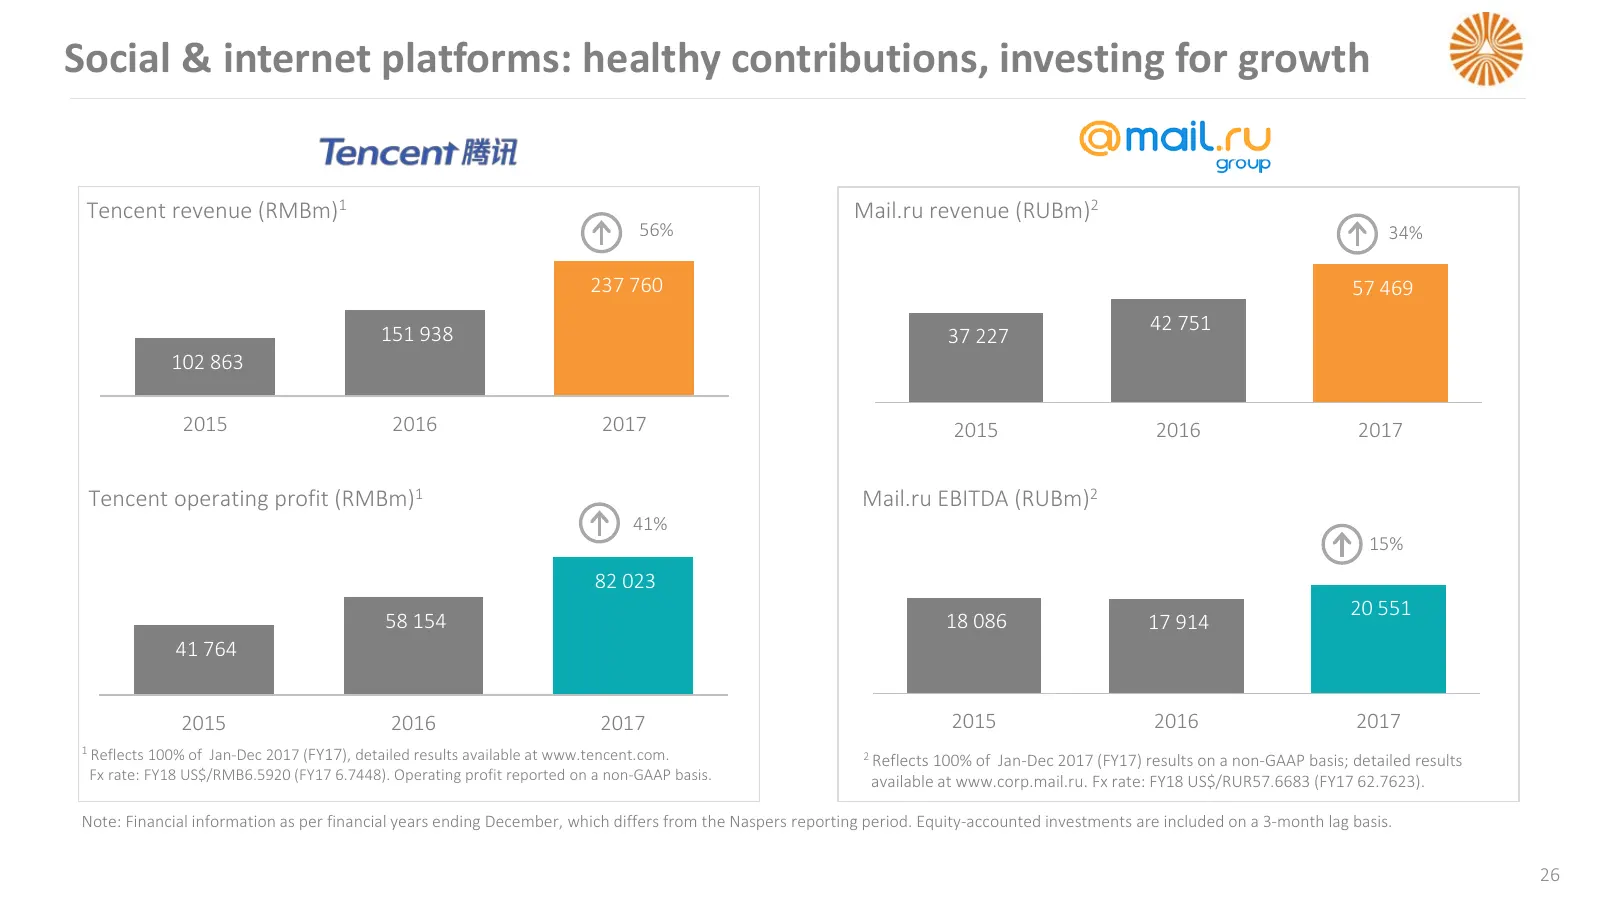
Slide 26: Social & internet platforms: healthy contributions, investing for growth
Social & internet platforms: healthy contributions, investing for growth Tencent revenue (RMBm)1 Mail.ru revenue (RUBm)2 56% 34% 237 760 57 469 151 938 42 751 37 227 102 863 2015 2016 2017 2015 2016 2017 Tencent operating profit (RMBm)1 Mail.ru EBITDA (RUBm)2 41% 15% 82 023 20 551 58 154 18 086 17 9
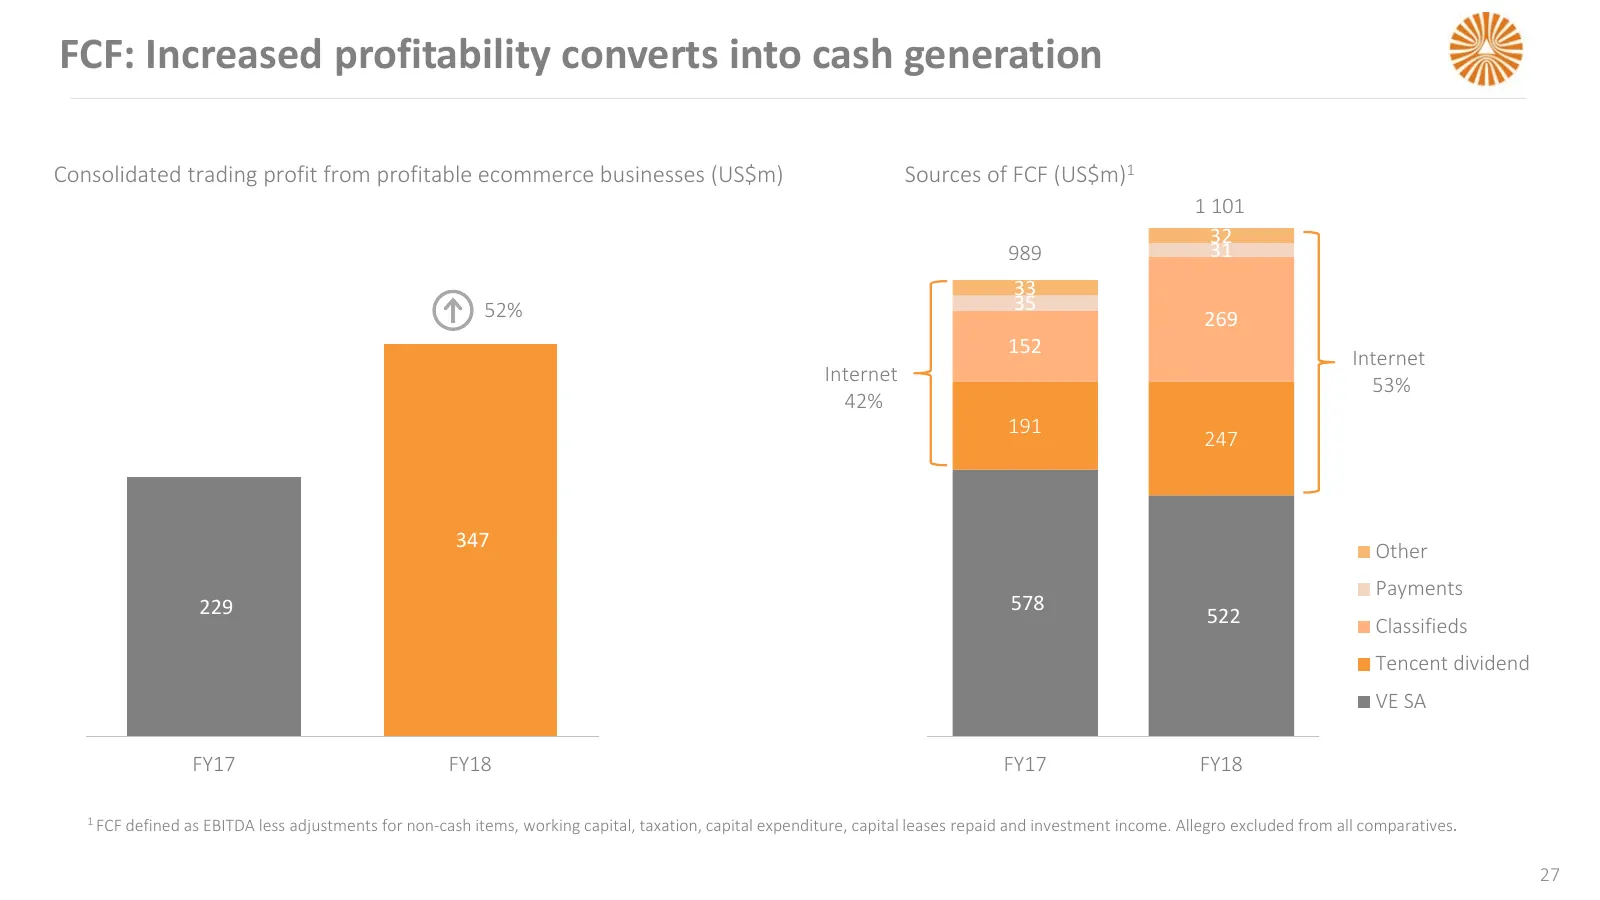
Slide 27: FCF: Increased profitability converts into cash generation
FCF: Increased profitability converts into cash generation Consolidated trading profit from profitable ecommerce businesses (US$m) Sources of FCF (US$m)1 1 101 32 989 31 33 52% 35 269 152 Internet Internet 53% 42% 191 247 347 Other Payments 229 578 522 Classifieds Tencent dividend VE SA FY17 FY18 FY
Slide 28: Balance sheet reinforced with cash to pursue growth opportunities
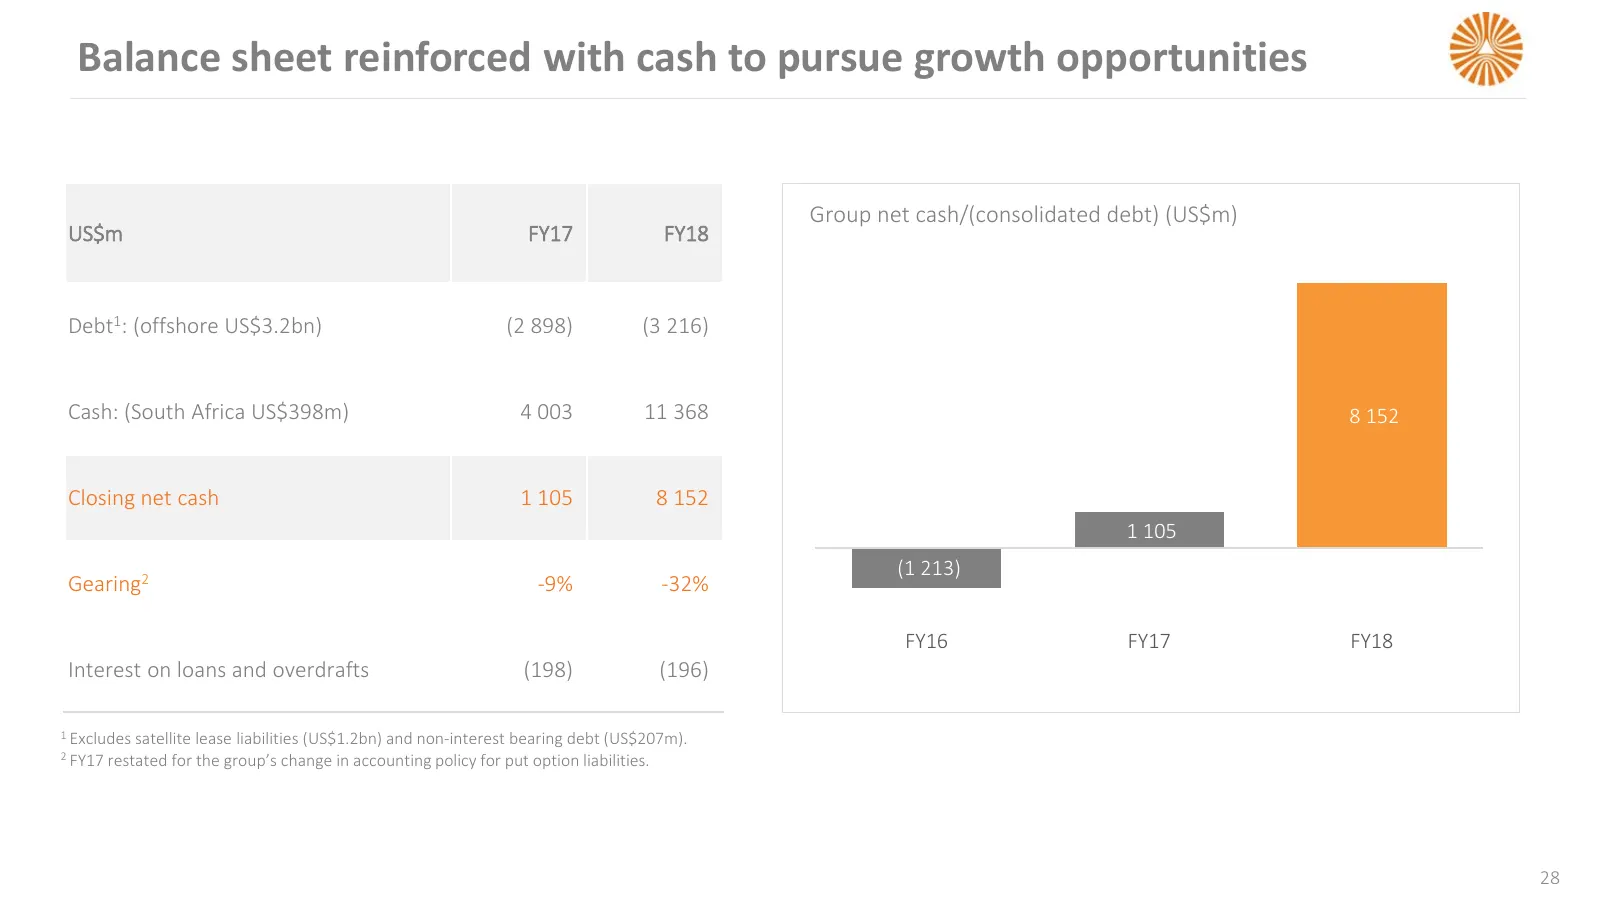
Balance sheet reinforced with cash to pursue growth opportunities Group net cash/(consolidated debt) (US$m) US$m FY17 FY18 Debt1: (offshore US$3.2bn) (2 898) (3 216) Cash: (South Africa US$398m) 4 003 11 368 8 152 Closing net cash 1 105 8 152 1 105 (1 213) Gearing2 -9% -32% FY16 FY17 FY18 Interest o
Slide 29: M&A activity ongoing, disciplined approach
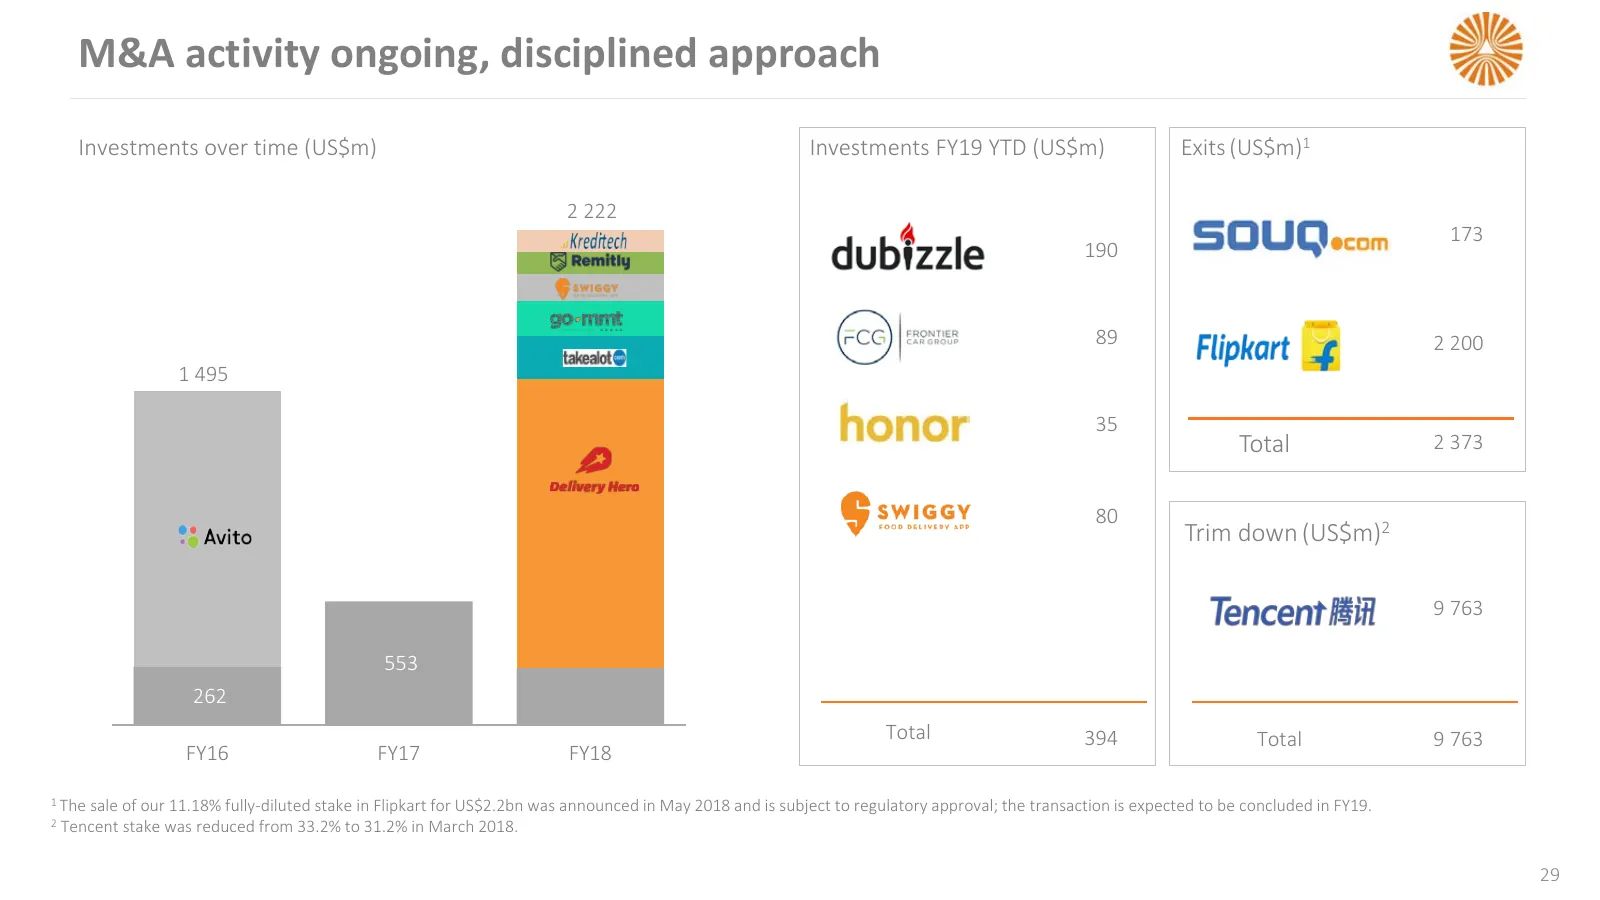
M&A activity ongoing, disciplined approach Investments over time (US$m) Investments FY19 YTD (US$m) Exits (US$m)1 2 222 173 190 89 2 200 1 495 35 Total 2 373 80 Trim down (US$m)2 9 763 553 262 Total 394 Total 9 763 FY16 FY17 FY18 1 The sale of our 11.18% fully-diluted stake in Flipkart for US$2.2bn
Slide 30: Internal rate of return well above cost of capital
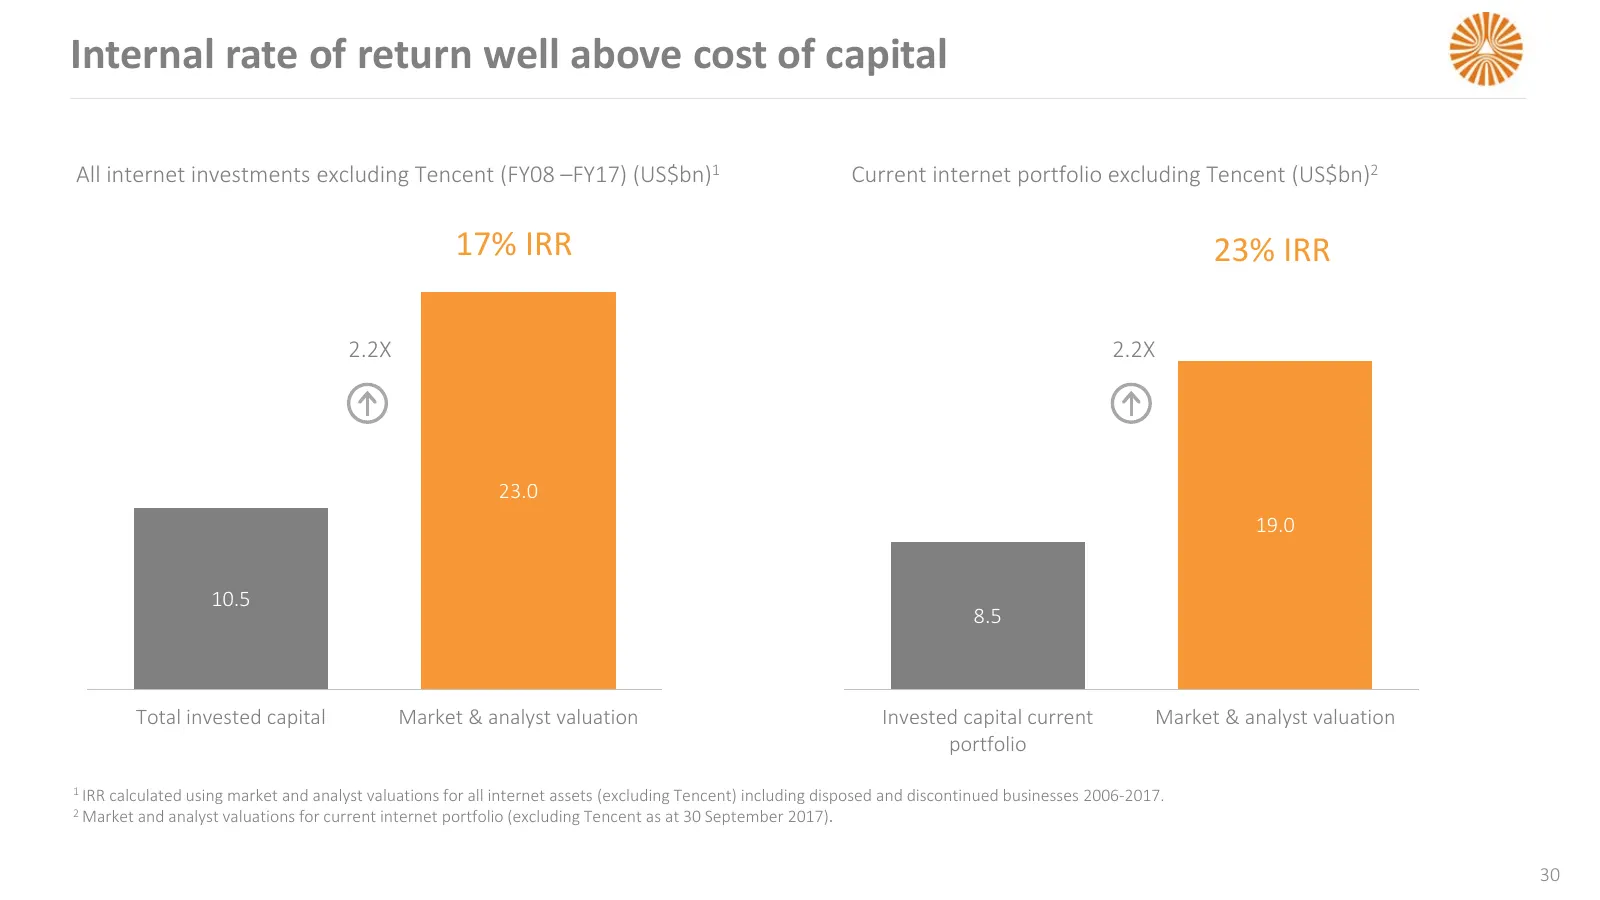
Internal rate of return well above cost of capital All internet investments excluding Tencent (FY08 –FY17) (US$bn)1 Current internet portfolio excluding Tencent (US$bn)2 17% IRR 23% IRR 2.2X 2.2X 23.0 19.0 10.5 8.5 Total invested capital Market & analyst valuation Invested capital current Market & a
Slide 31: Addressing the holding company discount
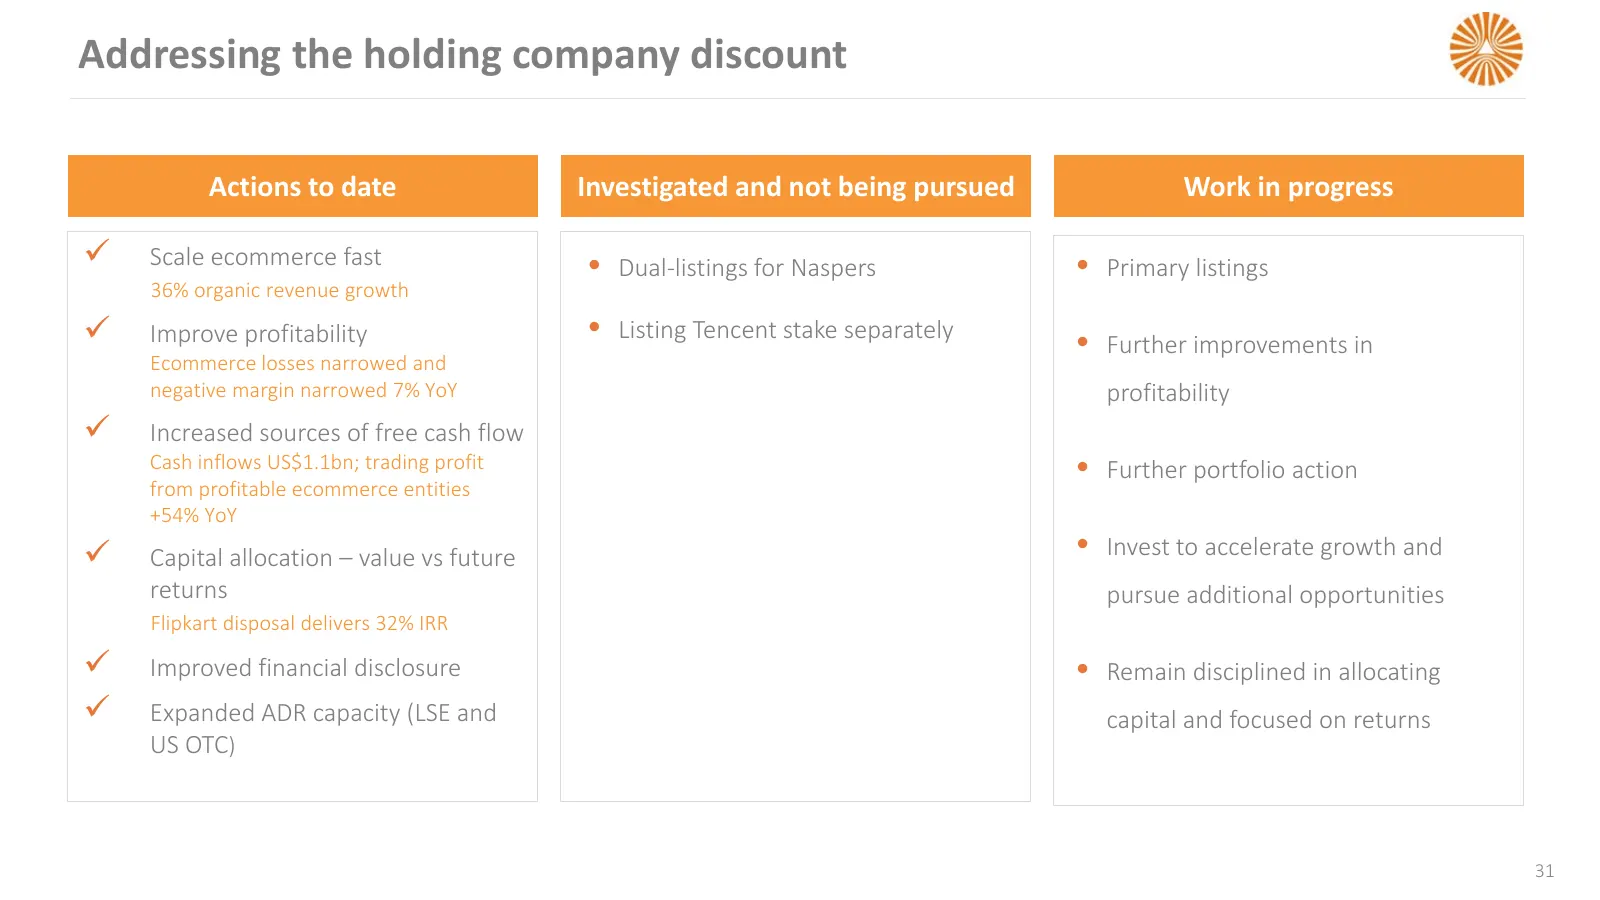
Addressing the holding company discount Actions to date Investigated and not being pursued Work in progress Scale ecommerce fast • Dual-listings for Naspers • Primary listings 36% organic revenue growth Improve profitability • Listing Tencent stake separately • Further improvements in Ecommerce

Slide 32: Outlook
Outlook
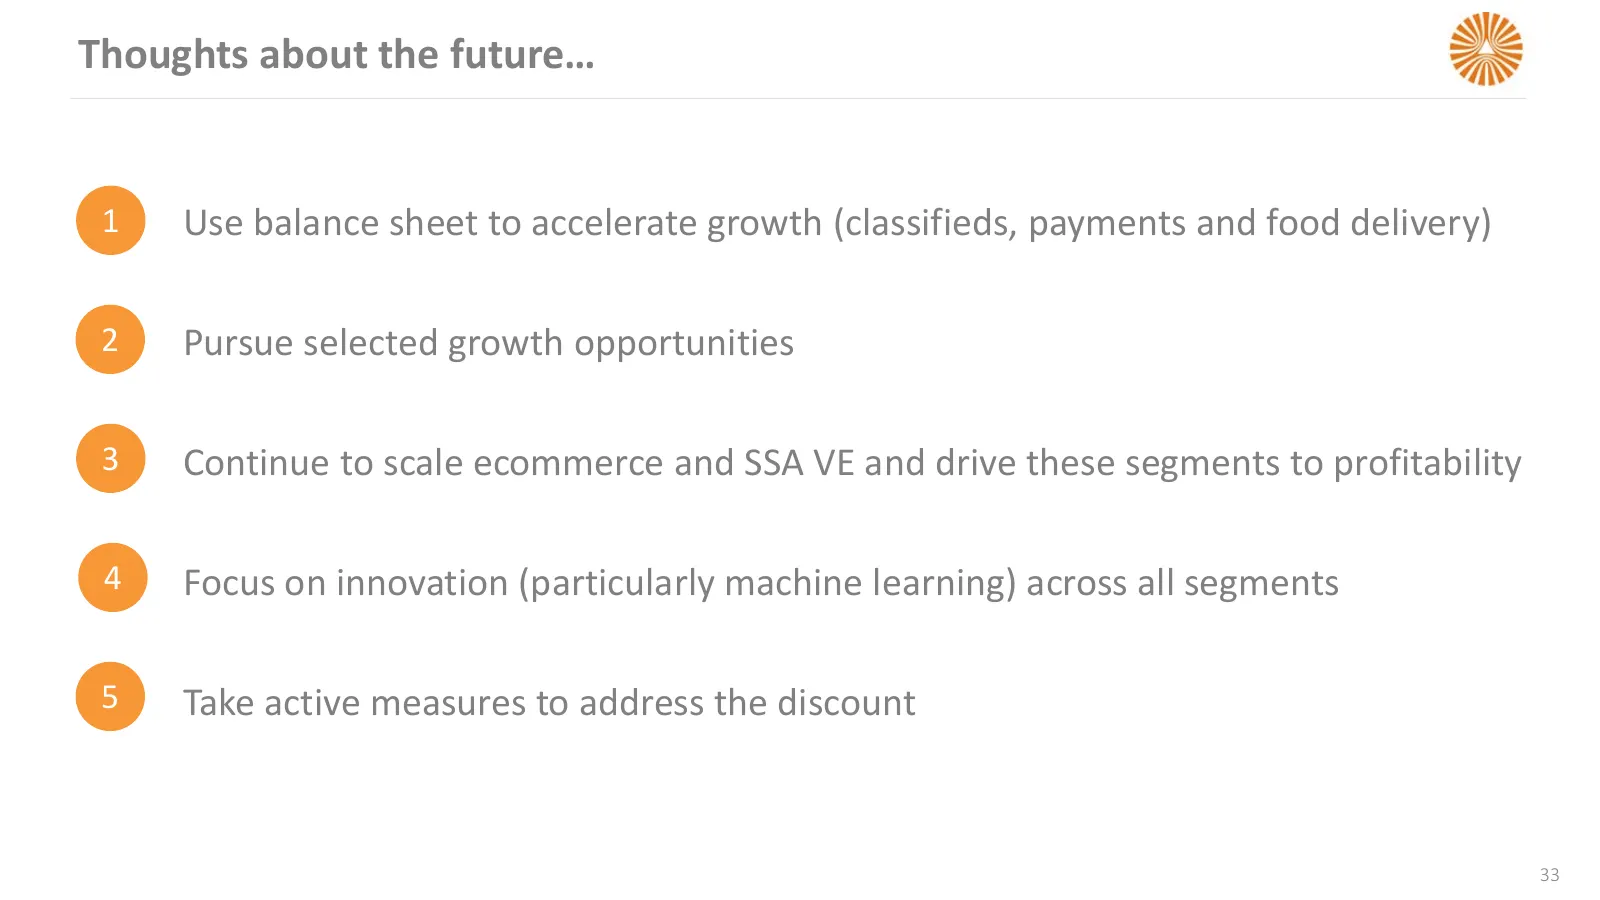
Slide 33: Thoughts about the future…
Thoughts about the future… 1 Use balance sheet to accelerate growth (classifieds, payments and food delivery) 2 Pursue selected growth opportunities 3 Continue to scale ecommerce and SSA VE and drive these segments to profitability 4 Focus on innovation (particularly machine learning) across all seg

Slide 34: Appendix
Appendix
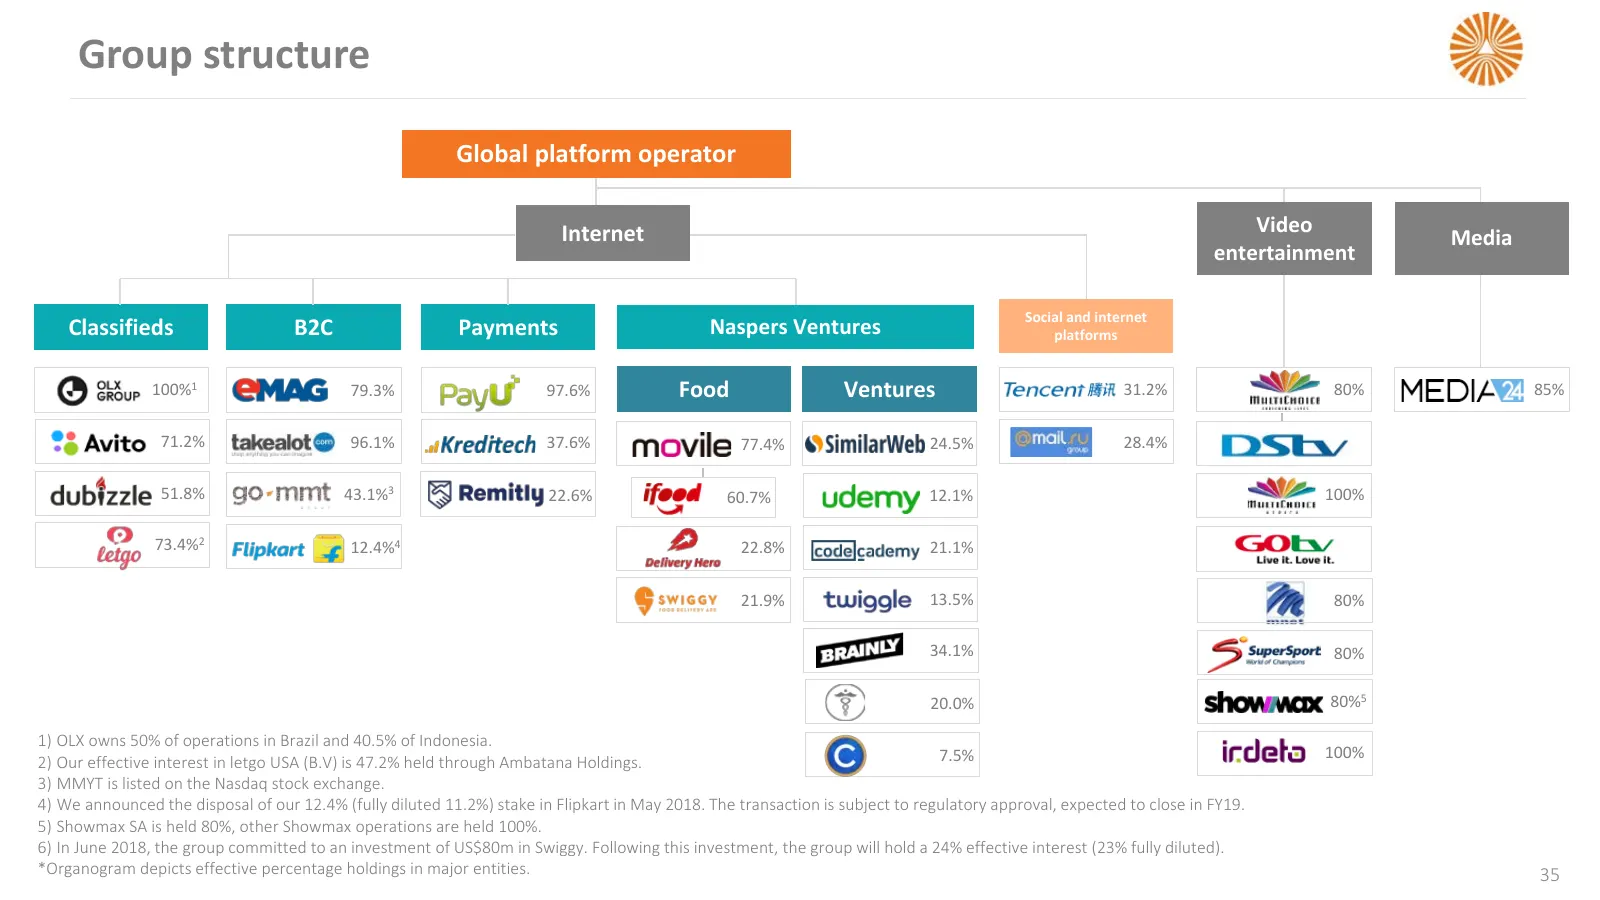
Slide 35: Group structure
Group structure Global platform operator Internet Video Media entertainment Social and internet Classifieds B2C Payments Naspers Ventures platforms 100%1 79.3% 97.6% Food Ventures 31.2% 80% 85% 71.2% 96.1% 37.6% 77.4% 24.5% 28.4% 51.8% 43.1%3 22.6% 60.7% 12.1% 100% 73.4%2 12.4%4 22.8% 21.1% 21.9% 13
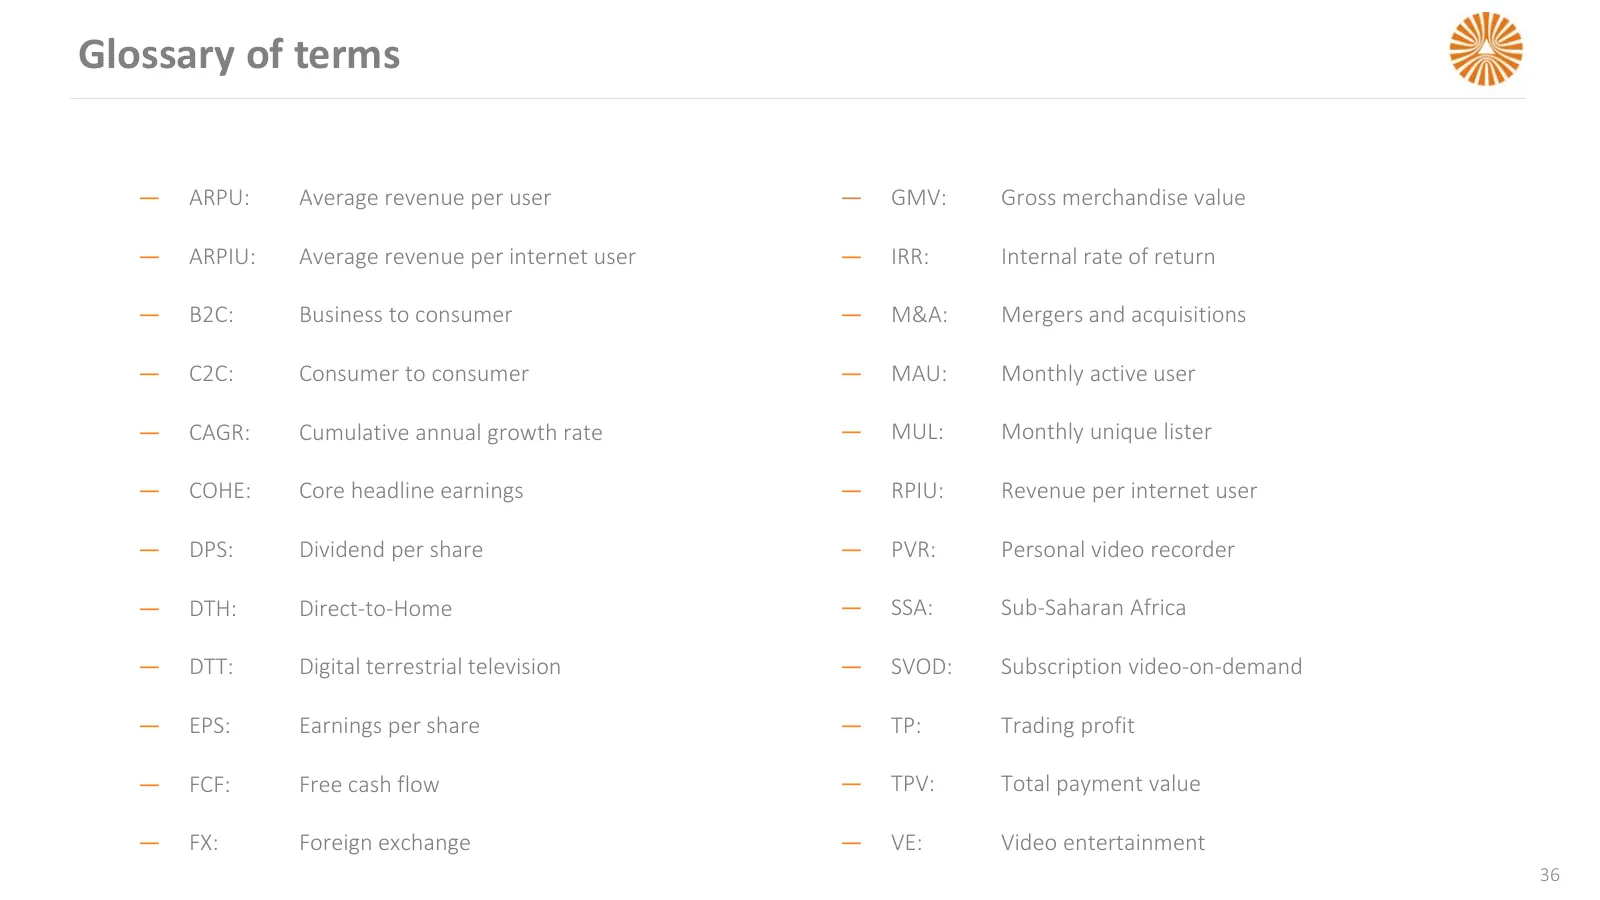
Slide 36: Glossary of terms
Glossary of terms — ARPU: Average revenue per user — GMV: Gross merchandise value — ARPIU: Average revenue per internet user — IRR: Internal rate of return — B2C: Business to consumer — M&A: Mergers and acquisitions — C2C: Consumer to consumer — MAU: Monthly active user — CAGR: Cumulative annual gro

Slide 37: Thank you
THANK YOU Meloy Horn +27 11 289 3320 +27 82 772 7123 InvestorRelations@naspers.com www.naspers.com
Source: Internet Archive copy of naspers.com
More decks from Naspers Limited Class N
 FY2026 Earnings Presentation60 slides · Jun 29, 2026
 FY2026 Earnings Presentation17 slides · Mar 31, 2026
 H1 2026 Earnings Presentation64 slides · Nov 24, 2025
 H1 FY26 Earnings Presentation17 slides · November 2025
 FY2025 Earnings Presentation51 slides · June 2025
 FY2025 Earnings Presentation17 slides · 2025