Delek Group Ltd. · TASE:DLEKG
Delek — Barclays CEO Energy-Power Conference 2020
18 slides from Delek's conference presentation, September 2020
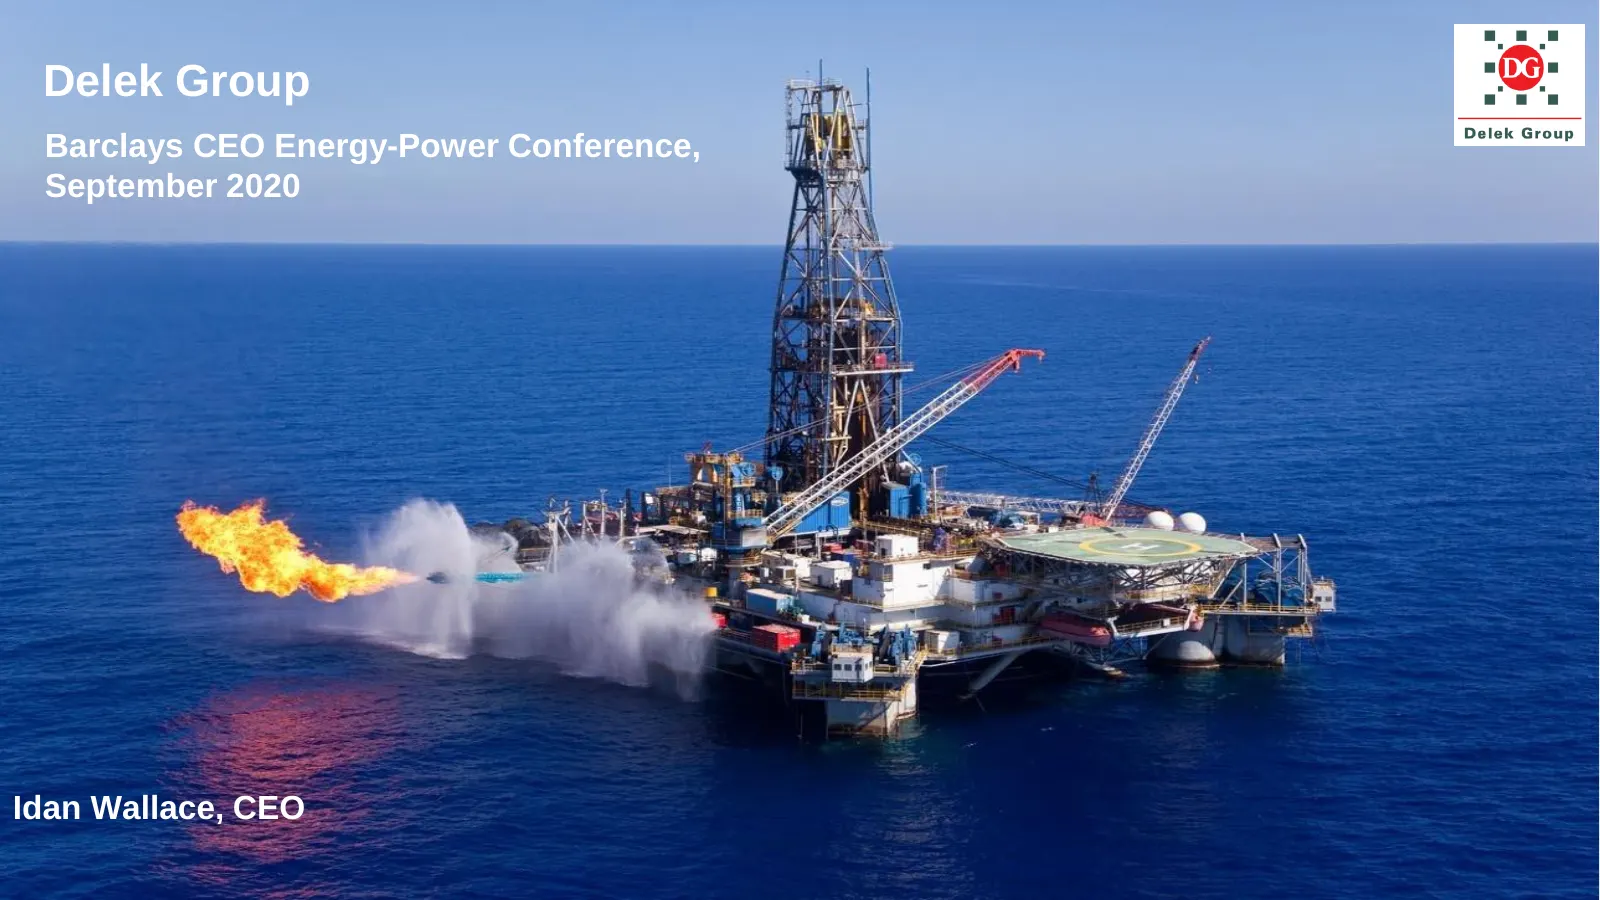
Slide 1: Delek Group
Delek Group Barclays CEO Energy-Power Conference, September 2020 Idan Wallace, CEO 1
Slide 2: Disclaimer
Disclaimer This presentation was prepared by Delek Group Ltd (“Delek”, or the “Company”), and is given only for the provision of concise information for the sake of convenience. This presentation does not purport to be comprehensive or to contain any and all information which might be relevant in co
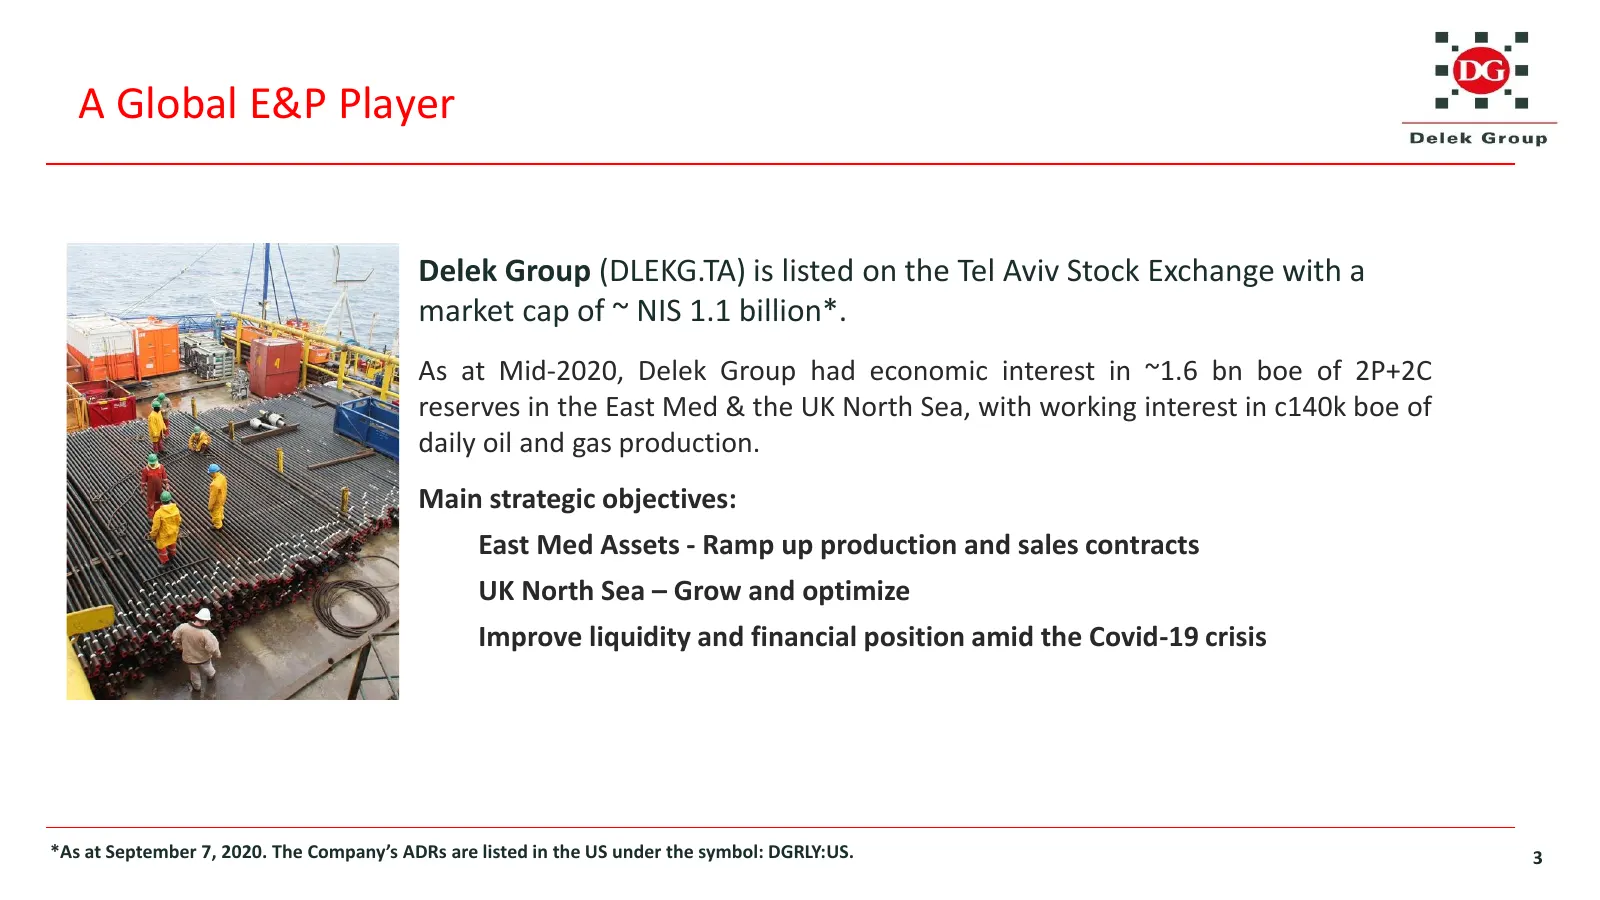
Slide 3: A Global E&P Player
A Global E&P Player Delek Group (DLEKG.TA) is listed on the Tel Aviv Stock Exchange with a market cap of ~ NIS 1.1 billion*. As at Mid-2020, Delek Group had economic interest in ~1.6 bn boe of 2P+2C reserves in the East Med & the UK North Sea, with working interest in c140k boe of daily oil and gas
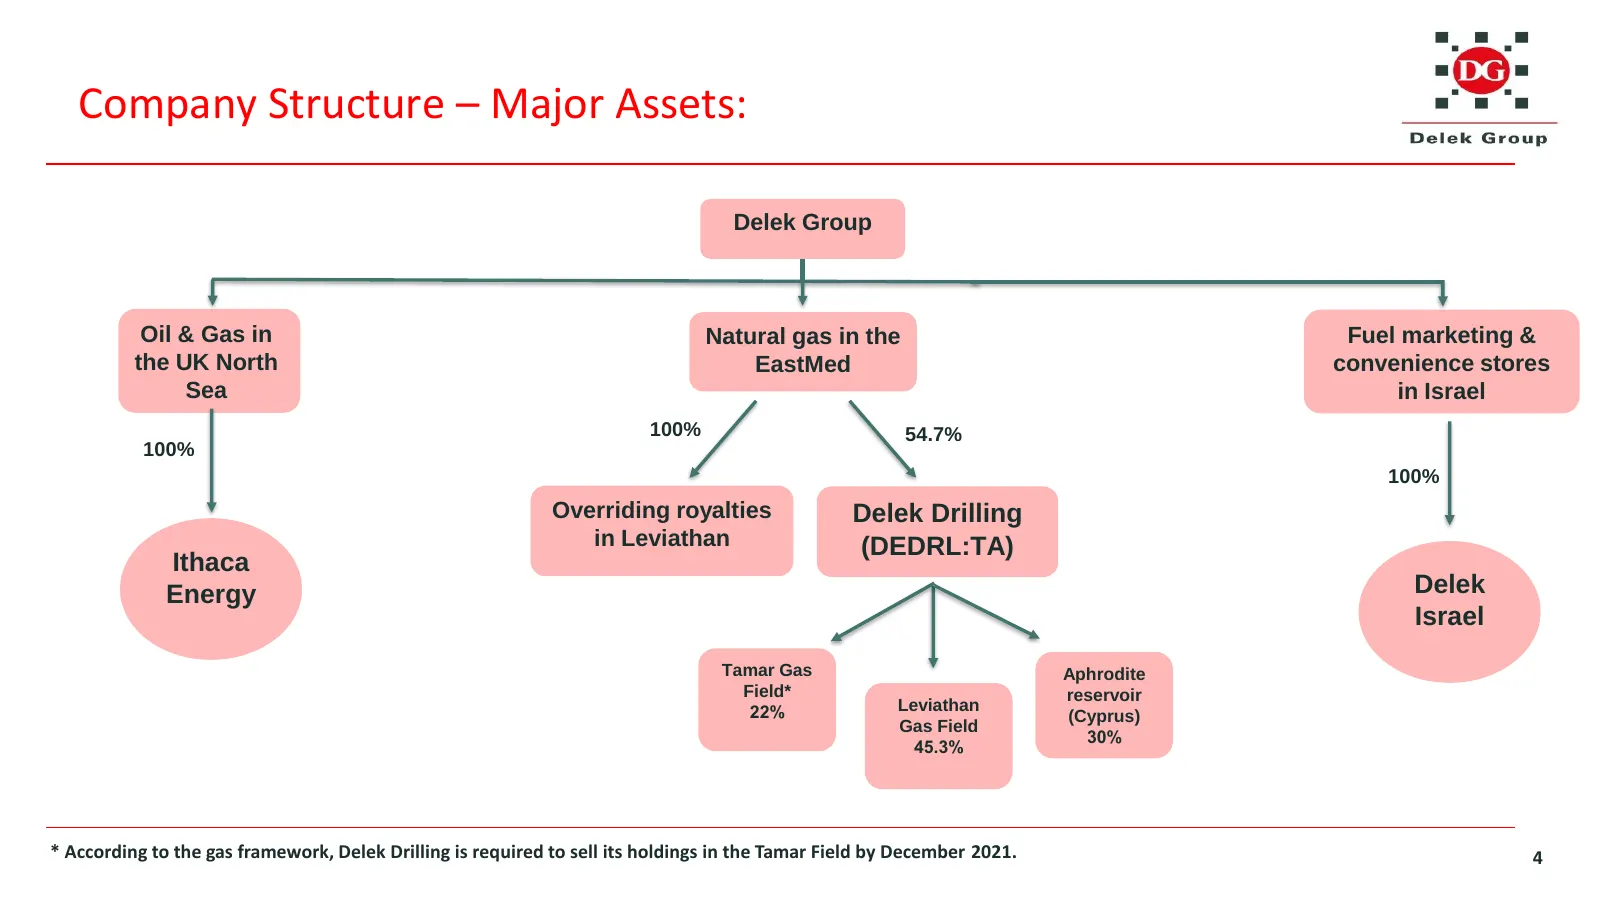
Slide 4: Company Structure – Major Assets
Company Structure – Major Assets: Delek Group Oil & Gas in Natural gas in the Fuel marketing & the UK North EastMed convenience stores Sea in Israel 100% 54.7% 100% 100% Overriding royalties Delek Drilling in Leviathan (DEDRL:TA) Ithaca Energy Delek Israel Tamar Gas Aphrodite Field* reservoir 22% Le
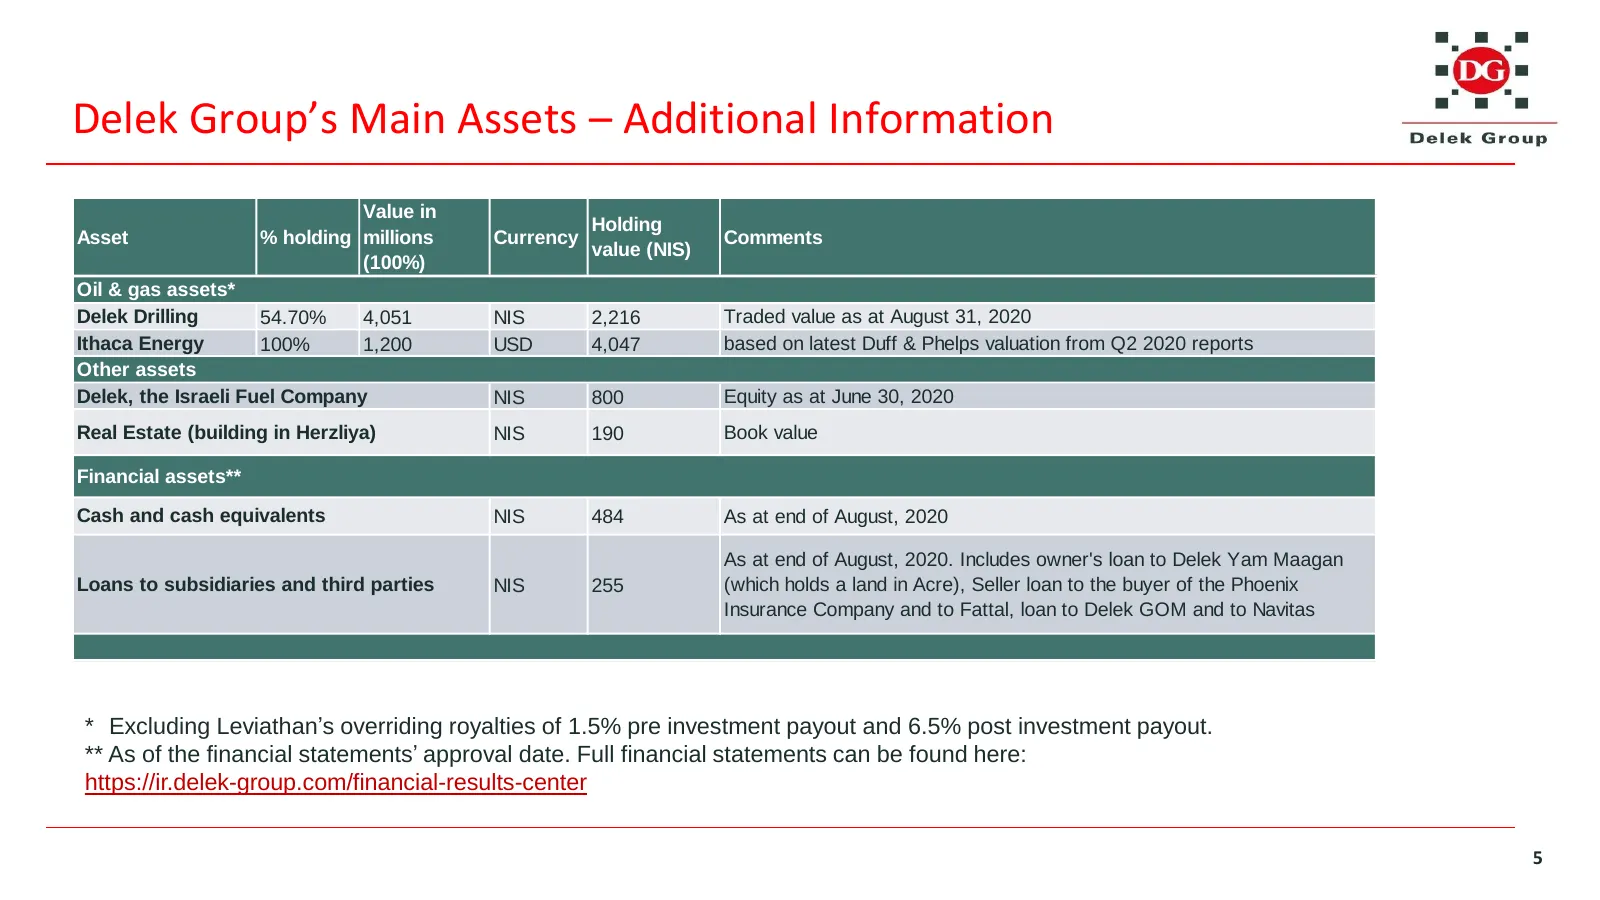
Slide 5: Delek Group's Main Assets – Additional Information
Delek Group’s Main Assets – Additional Information Value in Holding Asset % holding millions Currency Comments value (NIS) (100%) Oil & gas assets* Delek Drilling 54.70% 4,051 NIS 2,216 Traded value as at August 31, 2020 Ithaca Energy 100% 1,200 USD 4,047 based on latest Duff & Phelps valuation from
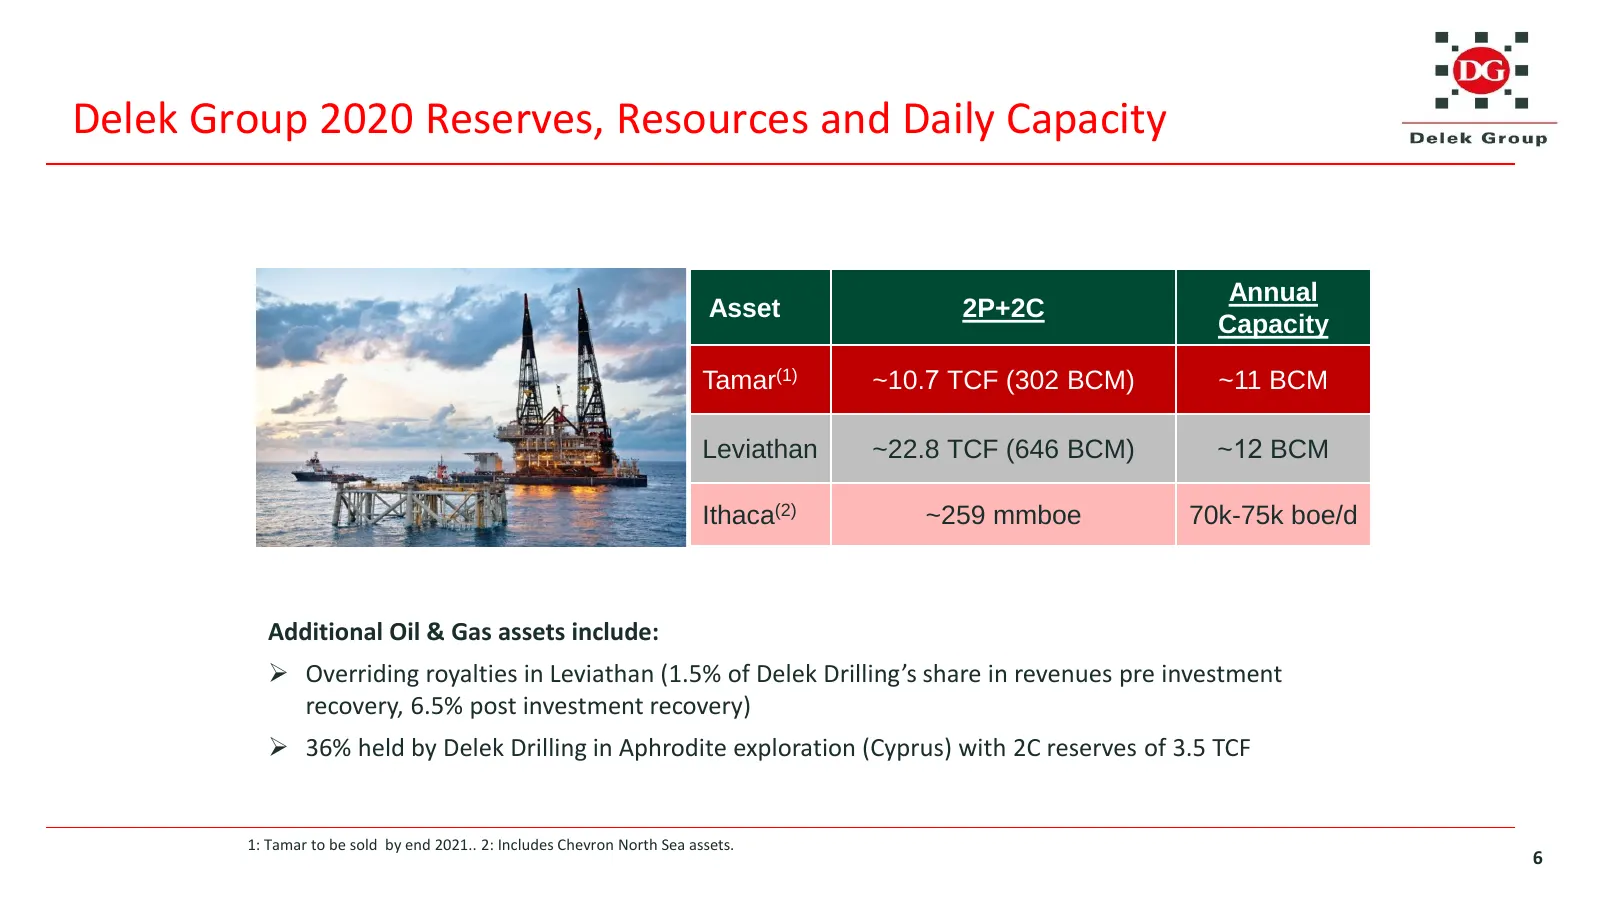
Slide 6: Delek Group 2020 Reserves, Resources and Daily Capacity
Delek Group 2020 Reserves, Resources and Daily Capacity Annual Asset 2P+2C Capacity Tamar(1) ~10.7 TCF (302 BCM) ~11 BCM Leviathan ~22.8 TCF (646 BCM) ~12 BCM Ithaca(2) ~259 mmboe 70k-75k boe/d Additional Oil & Gas assets include: ➢ Overriding royalties in Leviathan (1.5% of Delek Drilling’s share i
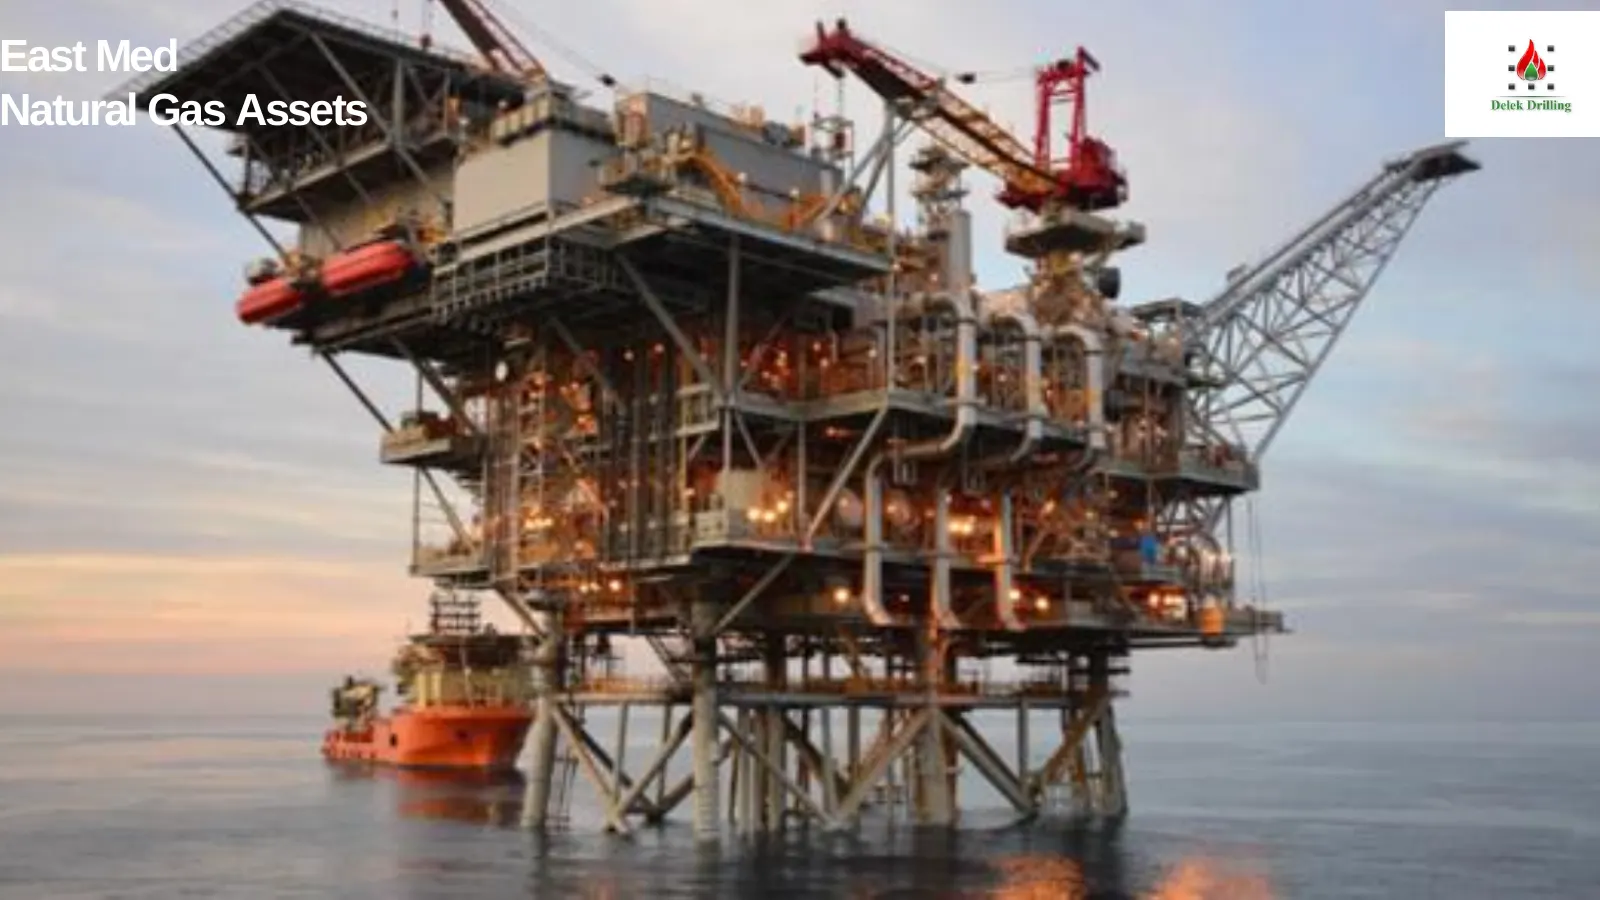
Slide 7: East Med Natural Gas Assets
East Med Natural Gas Assets
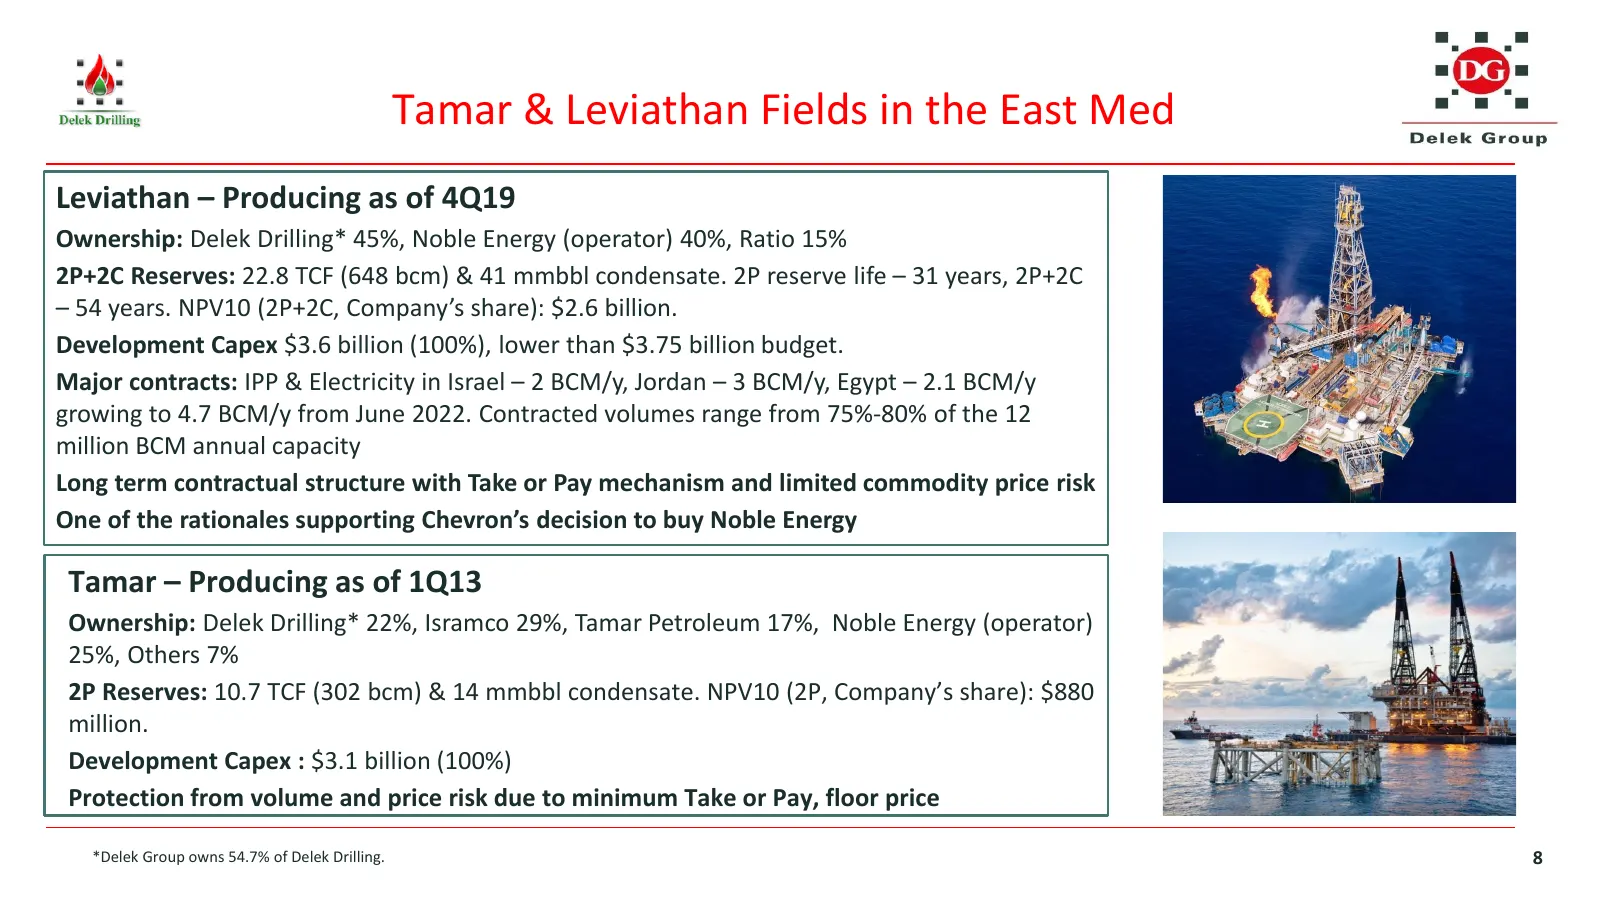
Slide 8: Tamar & Leviathan Fields in the East Med
Tamar & Leviathan Fields in the East Med Leviathan – Producing as of 4Q19 Ownership: Delek Drilling* 45%, Noble Energy (operator) 40%, Ratio 15% 2P+2C Reserves: 22.8 TCF (648 bcm) & 41 mmbbl condensate. 2P reserve life – 31 years, 2P+2C – 54 years. NPV10 (2P+2C, Company’s share): $2.6 billion. Devel
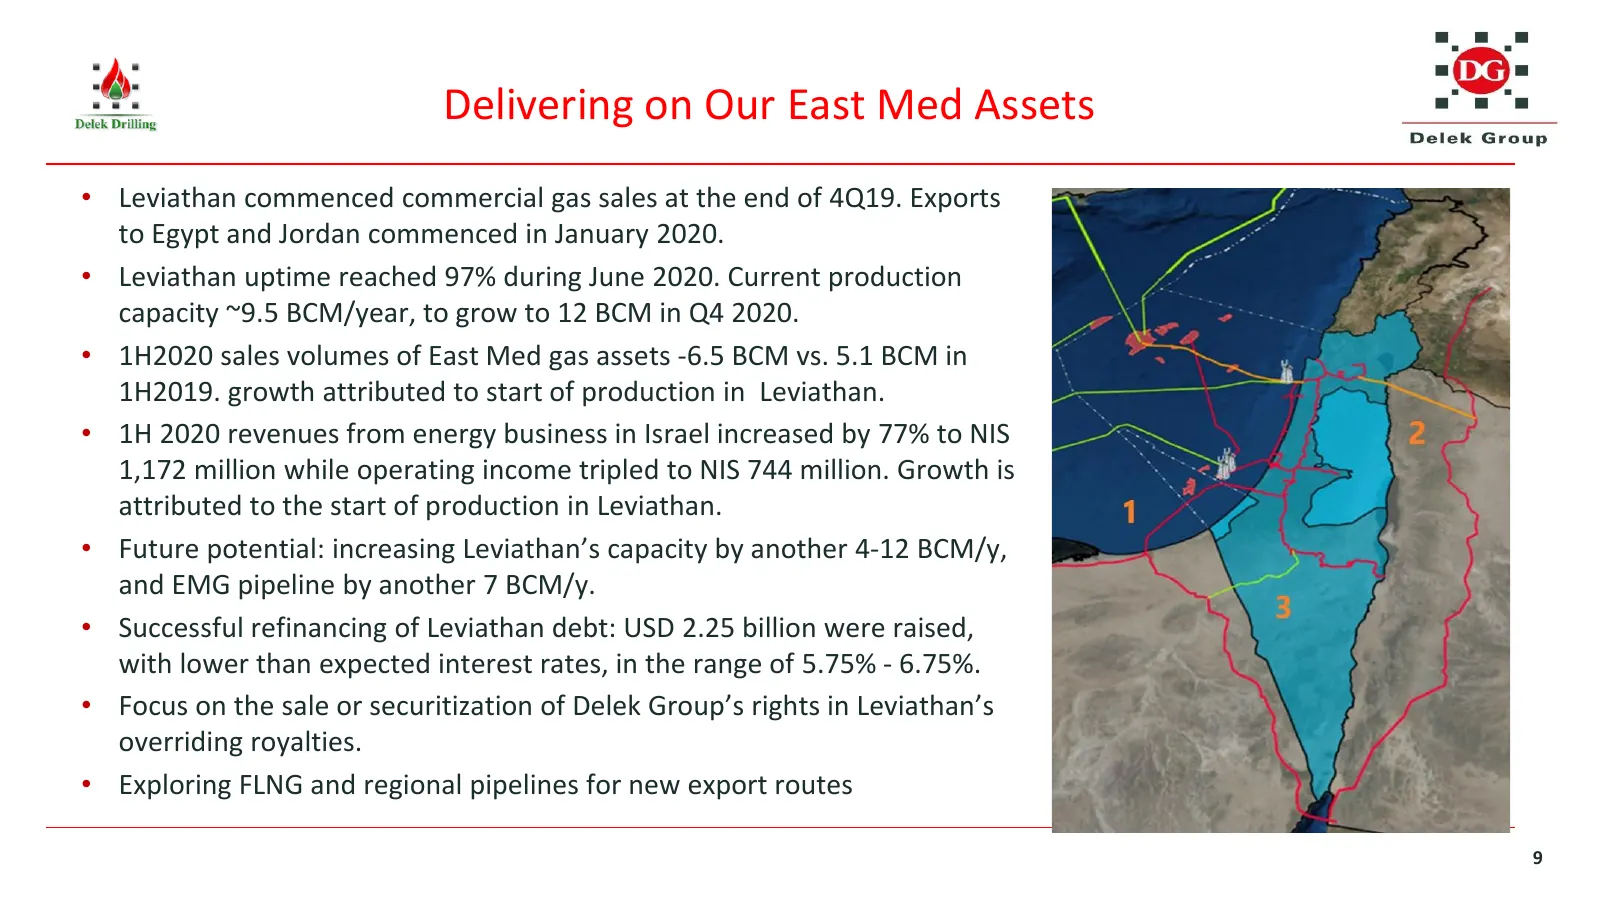
Slide 9: Delivering on Our East Med Assets
Delivering on Our East Med Assets • Leviathan commenced commercial gas sales at the end of 4Q19. Exports to Egypt and Jordan commenced in January 2020. • Leviathan uptime reached 97% during June 2020. Current production capacity ~9.5 BCM/year, to grow to 12 BCM in Q4 2020. • 1H2020 sales volumes of
Slide 10: UK North Sea Oil & Gas Assets
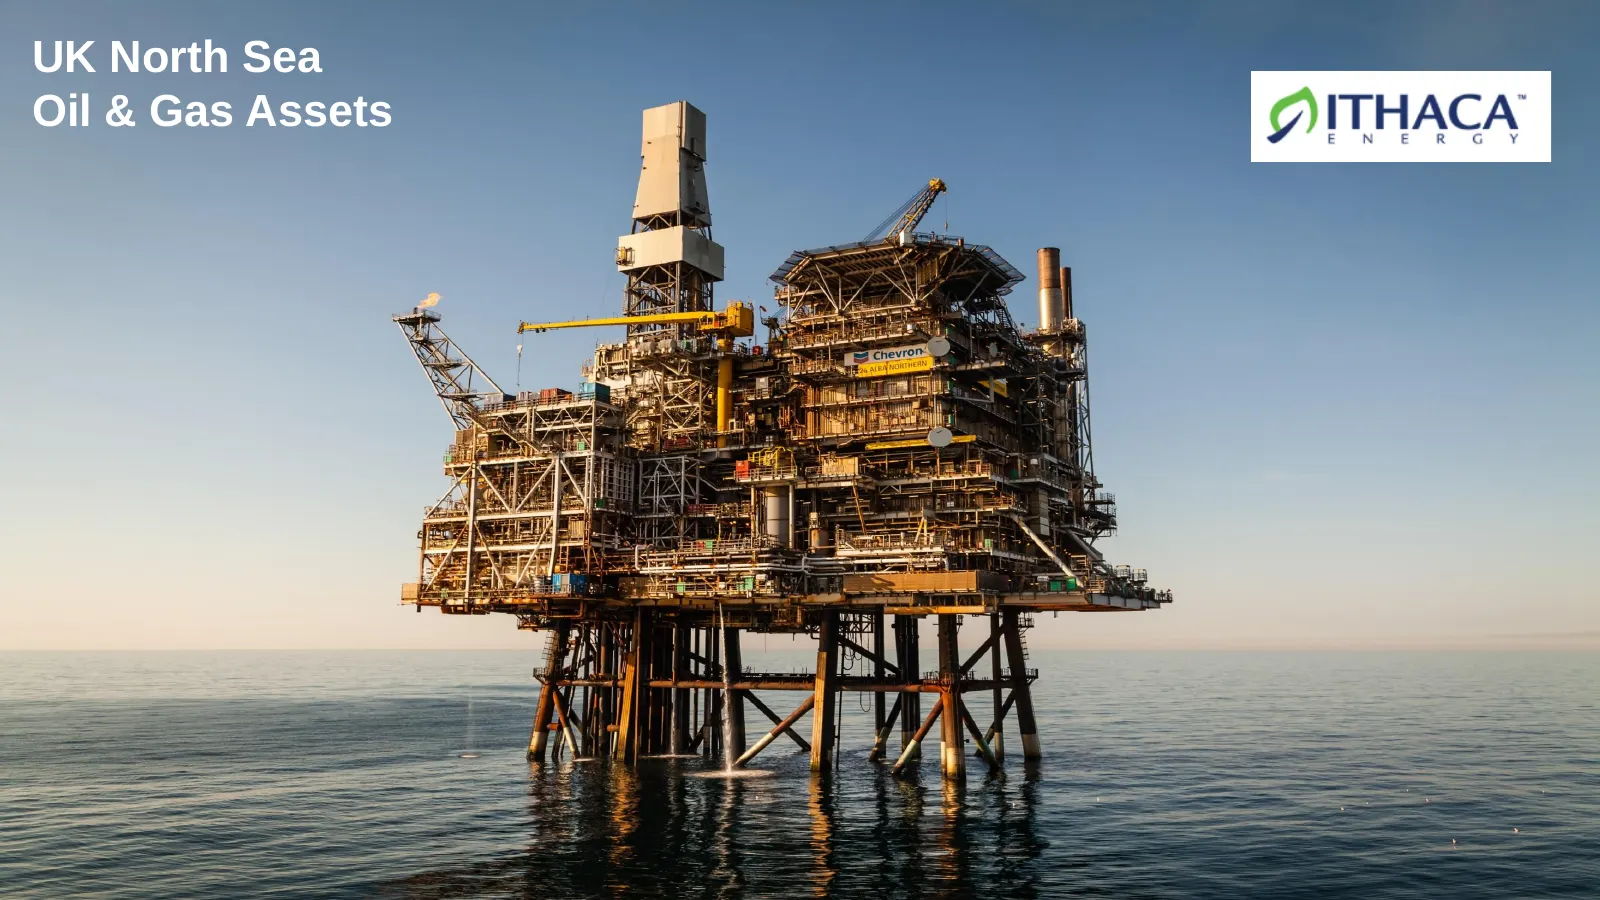
UK North Sea Oil & Gas Assets 10
Slide 11: Ithaca Energy – Main Characteristics
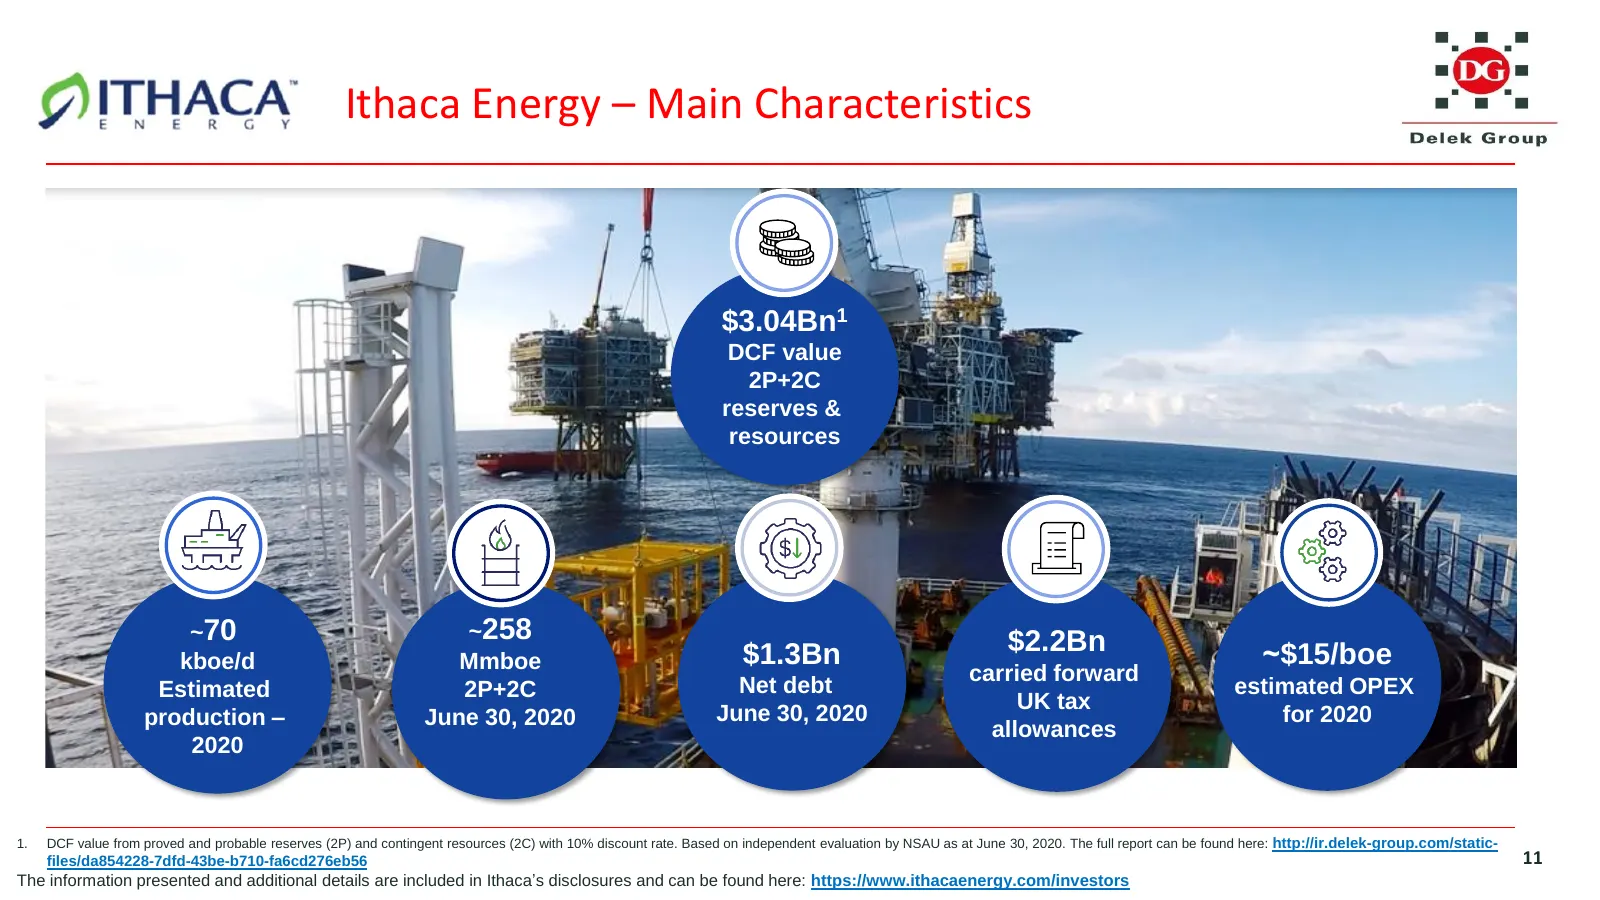
Ithaca Energy – Main Characteristics $3.04Bn1 DCF value 2P+2C reserves & resources ~70 ~258 $1.3Bn $2.2Bn ~$15/boe kboe/d Mmboe carried forward Estimated 2P+2C Net debt estimated OPEX UK tax production – June 30, 2020 June 30, 2020 for 2020 allowances 2020 1. DCF value from proved and probable reser
Slide 12: Competitive Cost Structure
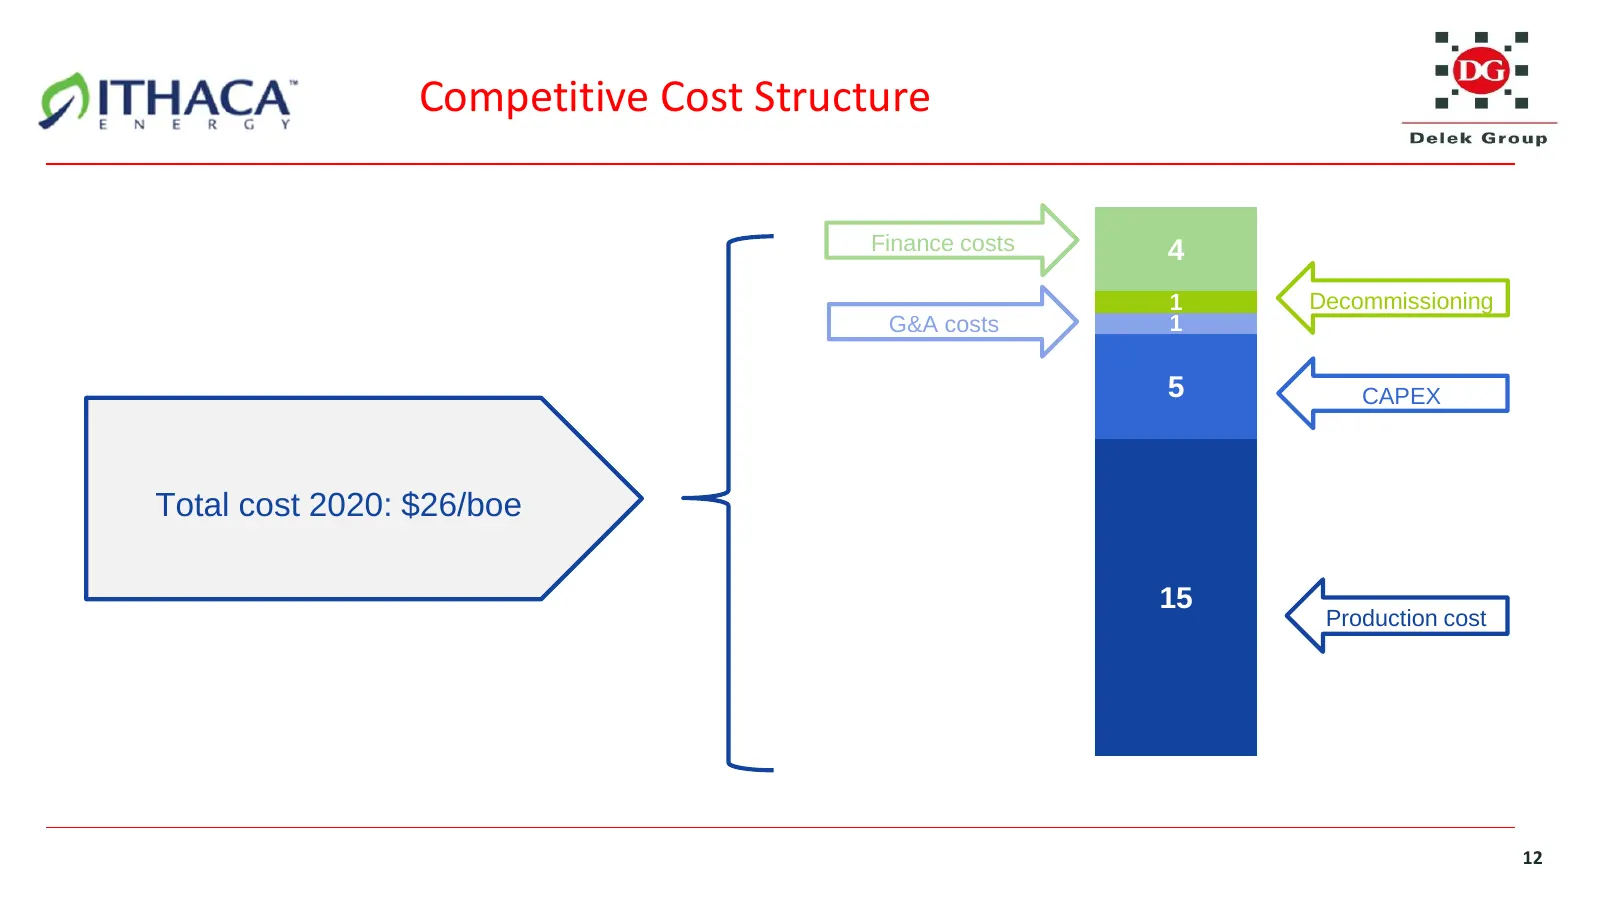
Competitive Cost Structure Finance costs 4 1 Decommissioning G&A costs 1 5 CAPEX Total cost 2020: $26/boe 15 Production cost 12
Slide 13: Strong Performance in a Challenging Period
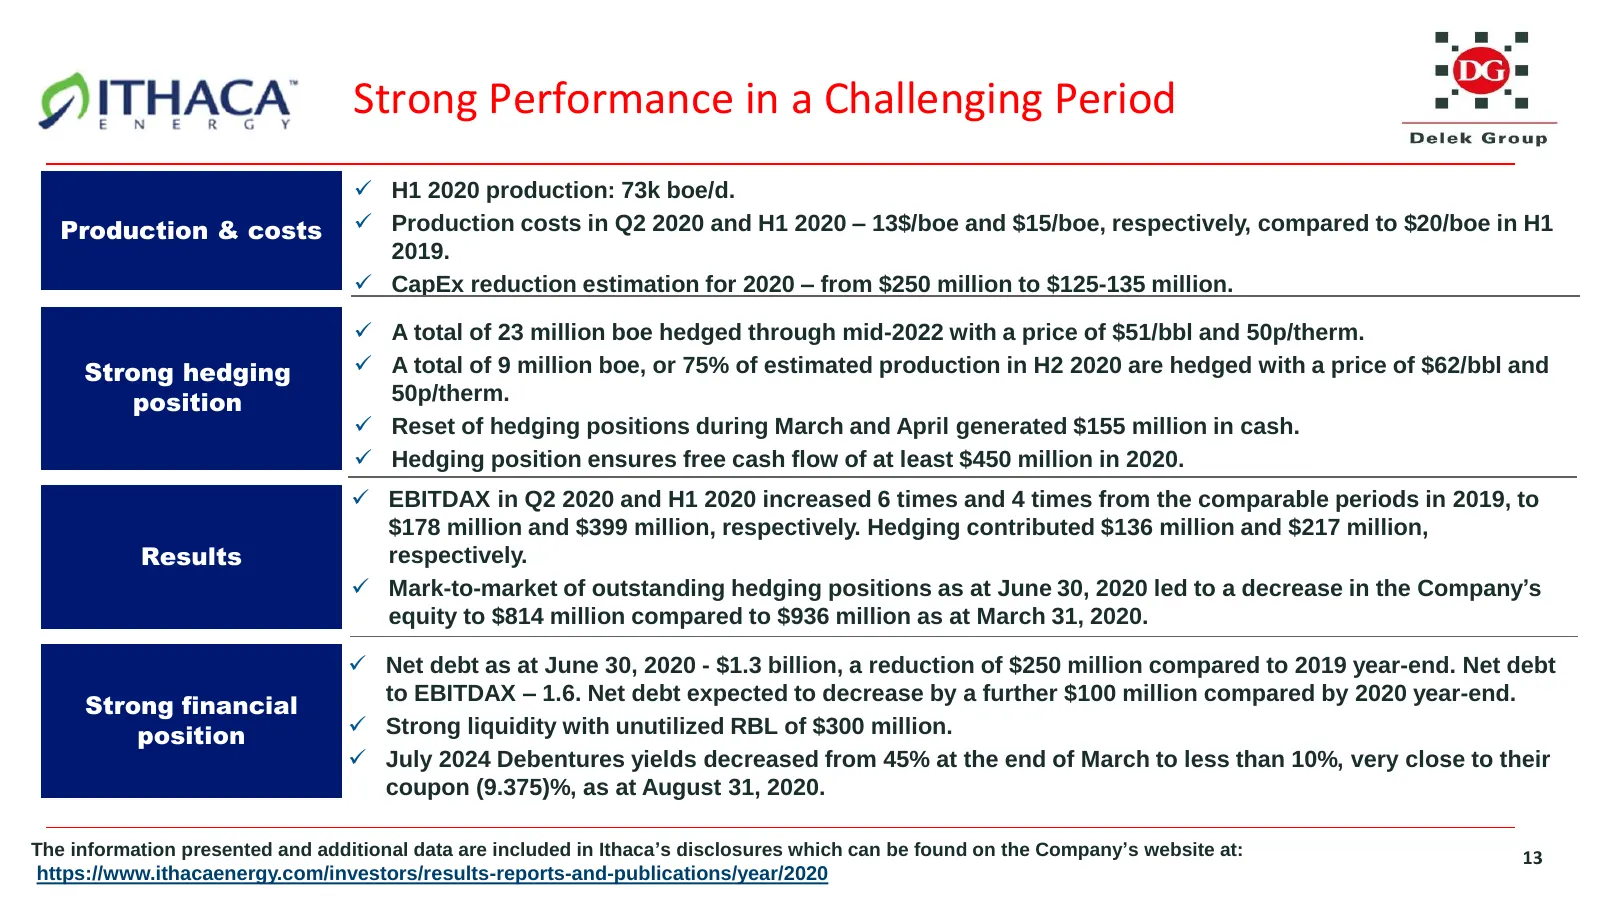
Strong Performance in a Challenging Period ✓ H1 2020 production: 73k boe/d. Production & costs ✓ Production costs in Q2 2020 and H1 2020 – 13$/boe and $15/boe, respectively, compared to $20/boe in H1 2019. ✓ CapEx reduction estimation for 2020 – from $250 million to $125-135 million. ✓ A total of 23
Slide 14: Delek Group's Financial Position
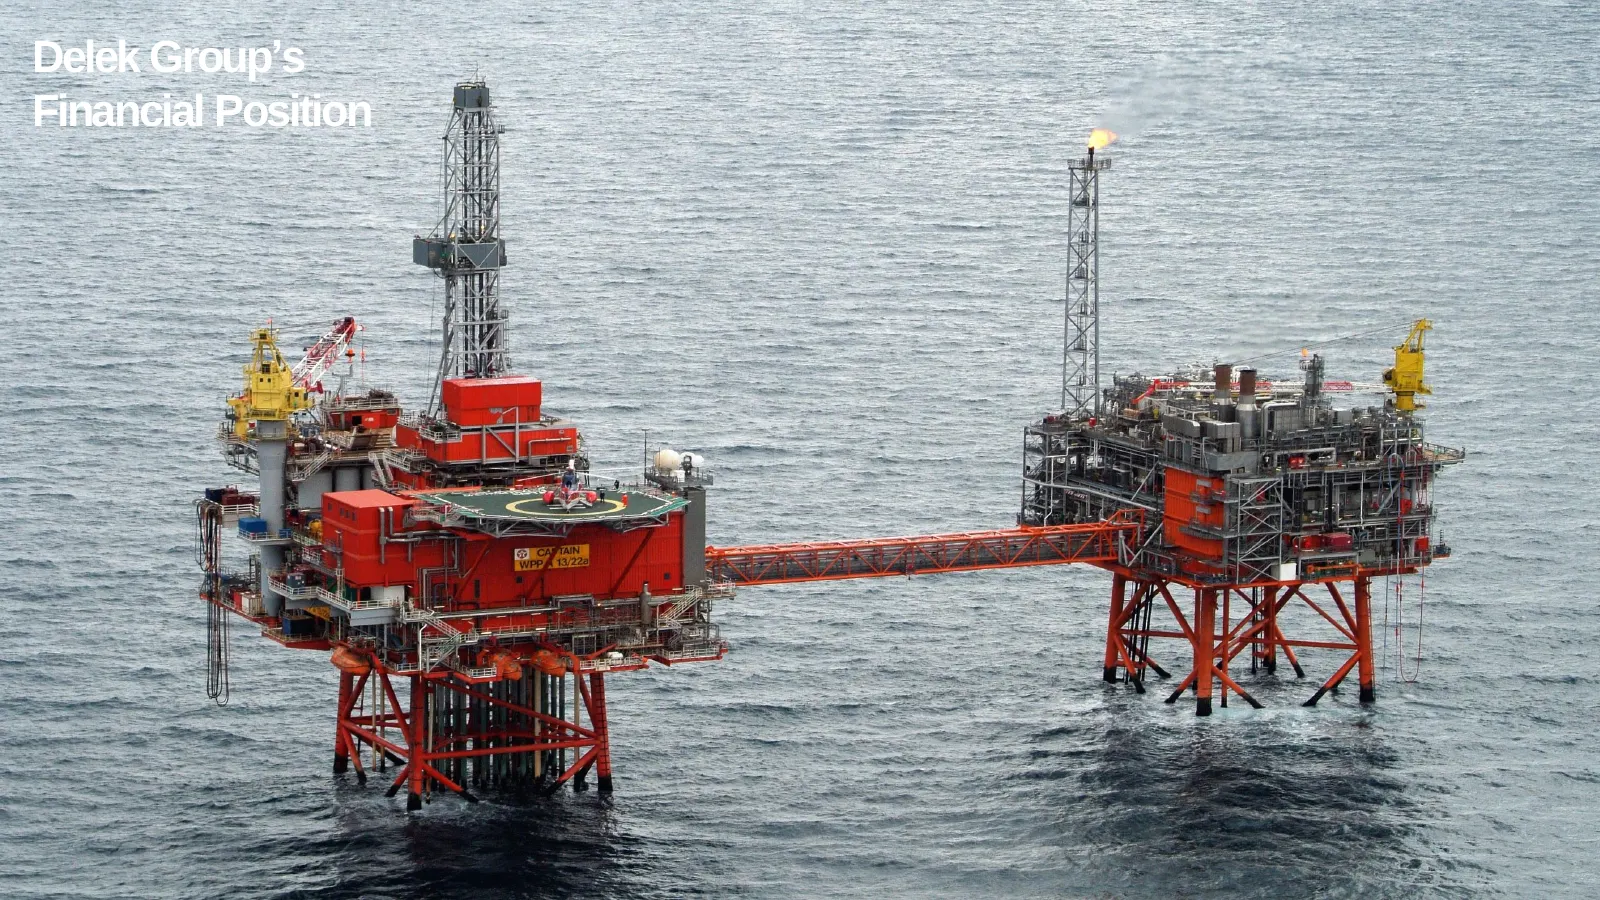
Delek Group’s Financial Position
Slide 15: Covid-19 and Measures Taken to Strengthen Financial Position
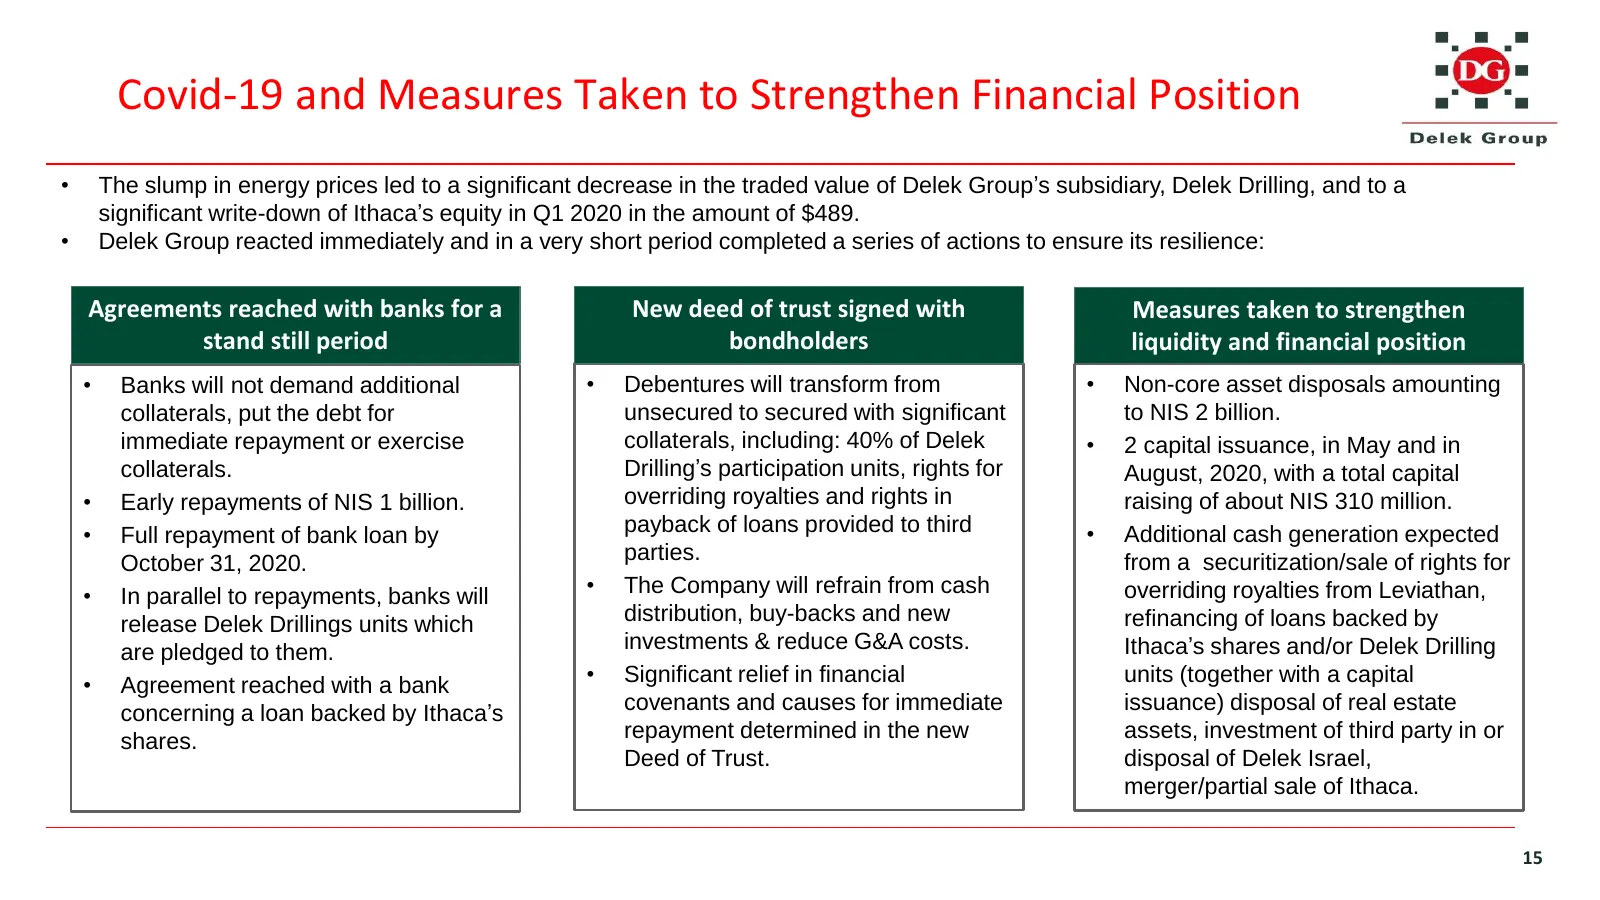
Covid-19 and Measures Taken to Strengthen Financial Position • The slump in energy prices led to a significant decrease in the traded value of Delek Group’s subsidiary, Delek Drilling, and to a significant write-down of Ithaca’s equity in Q1 2020 in the amount of $489. • Delek Group reacted immediat
Slide 16: A Significant Decrease in Financial Debt YTD
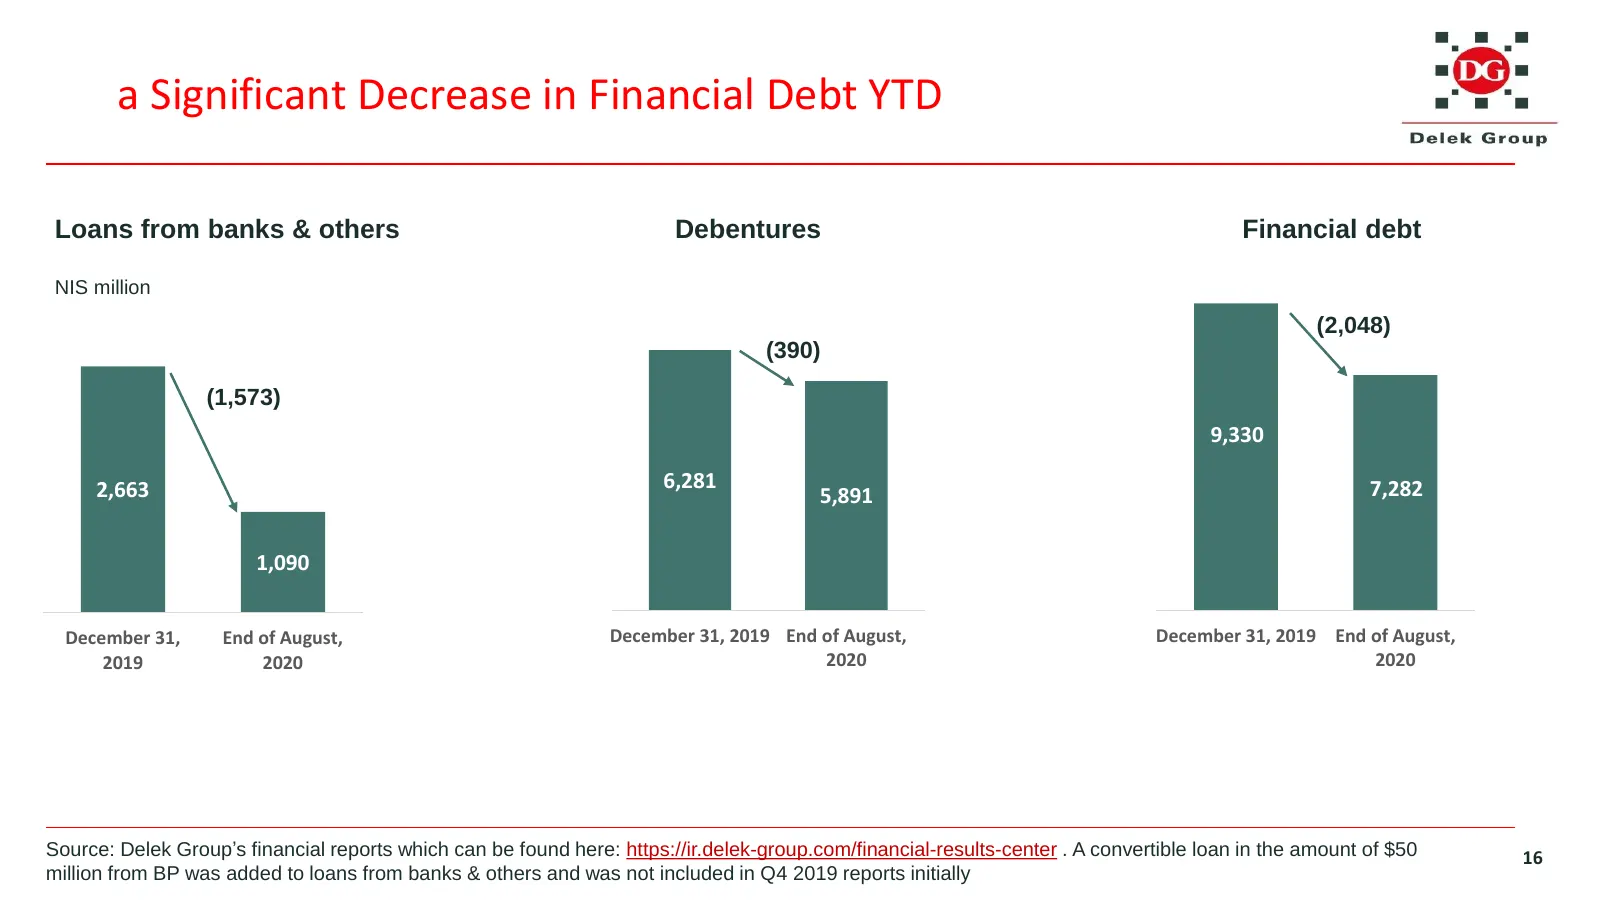
a Significant Decrease in Financial Debt YTD Loans from banks & others Debentures Financial debt NIS million (2,048) (390) (1,573) 9,330 2,663 6,281 7,282 5,891 1,090 December 31, End of August, December 31, 2019 End of August, December 31, 2019 End of August, 2019 2020 2020 2020 Source: Delek Group
Slide 17: Summary
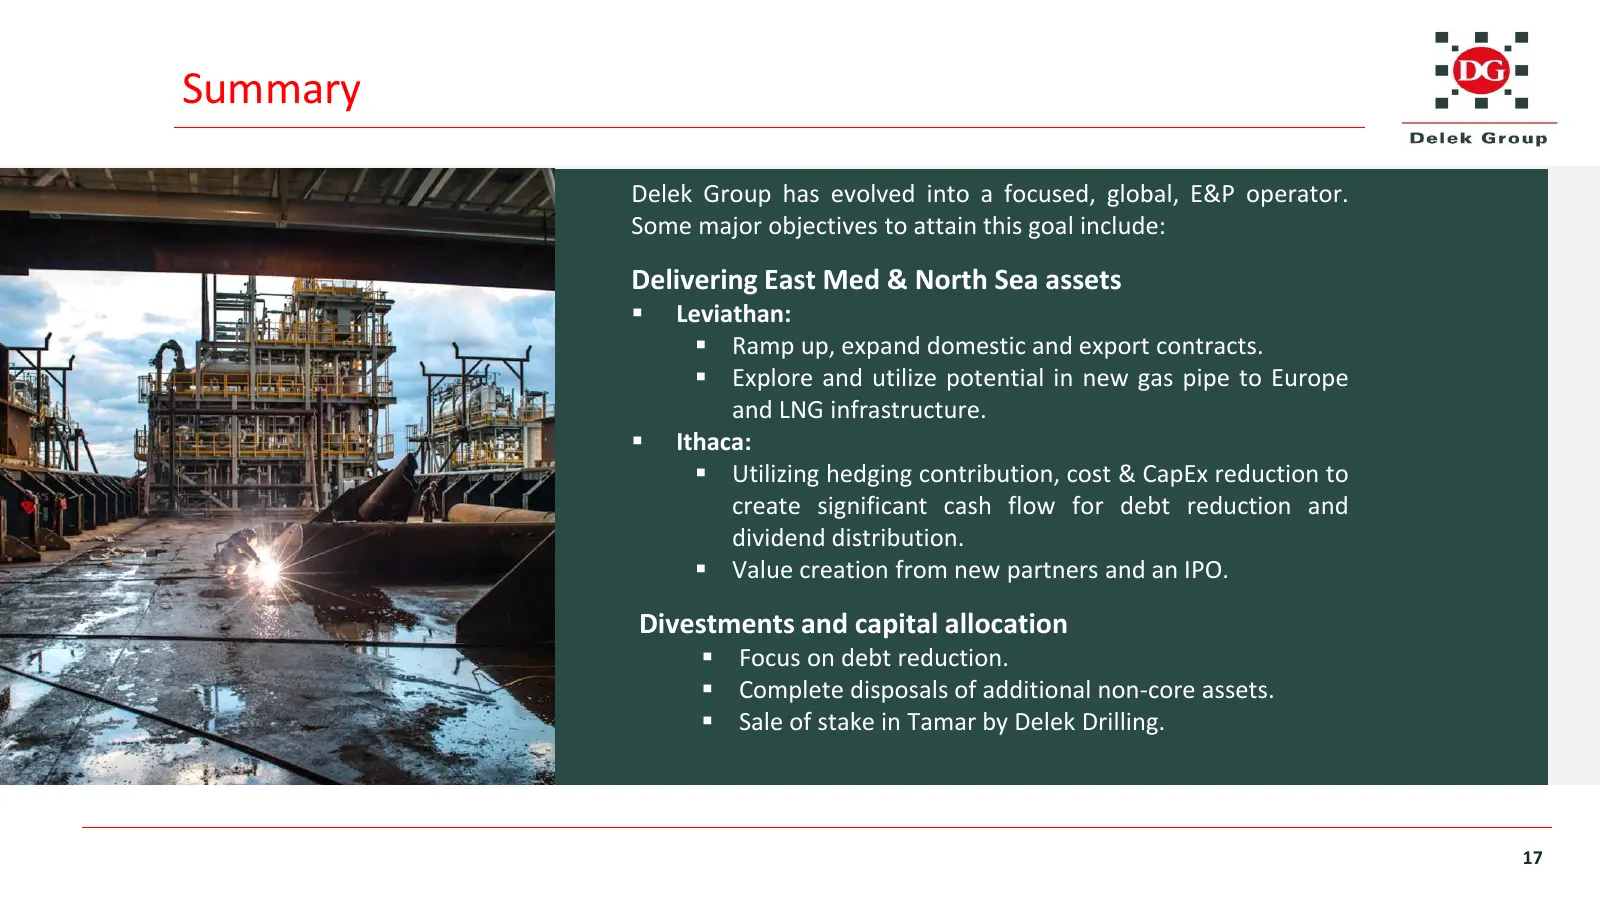
Summary Delek Group has evolved into a focused, global, E&P operator. Some major objectives to attain this goal include: Delivering East Med & North Sea assets ▪ Leviathan: ▪ Ramp up, expand domestic and export contracts. ▪ Explore and utilize potential in new gas pipe to Europe and LNG infrastructu
Slide 18: Thank you
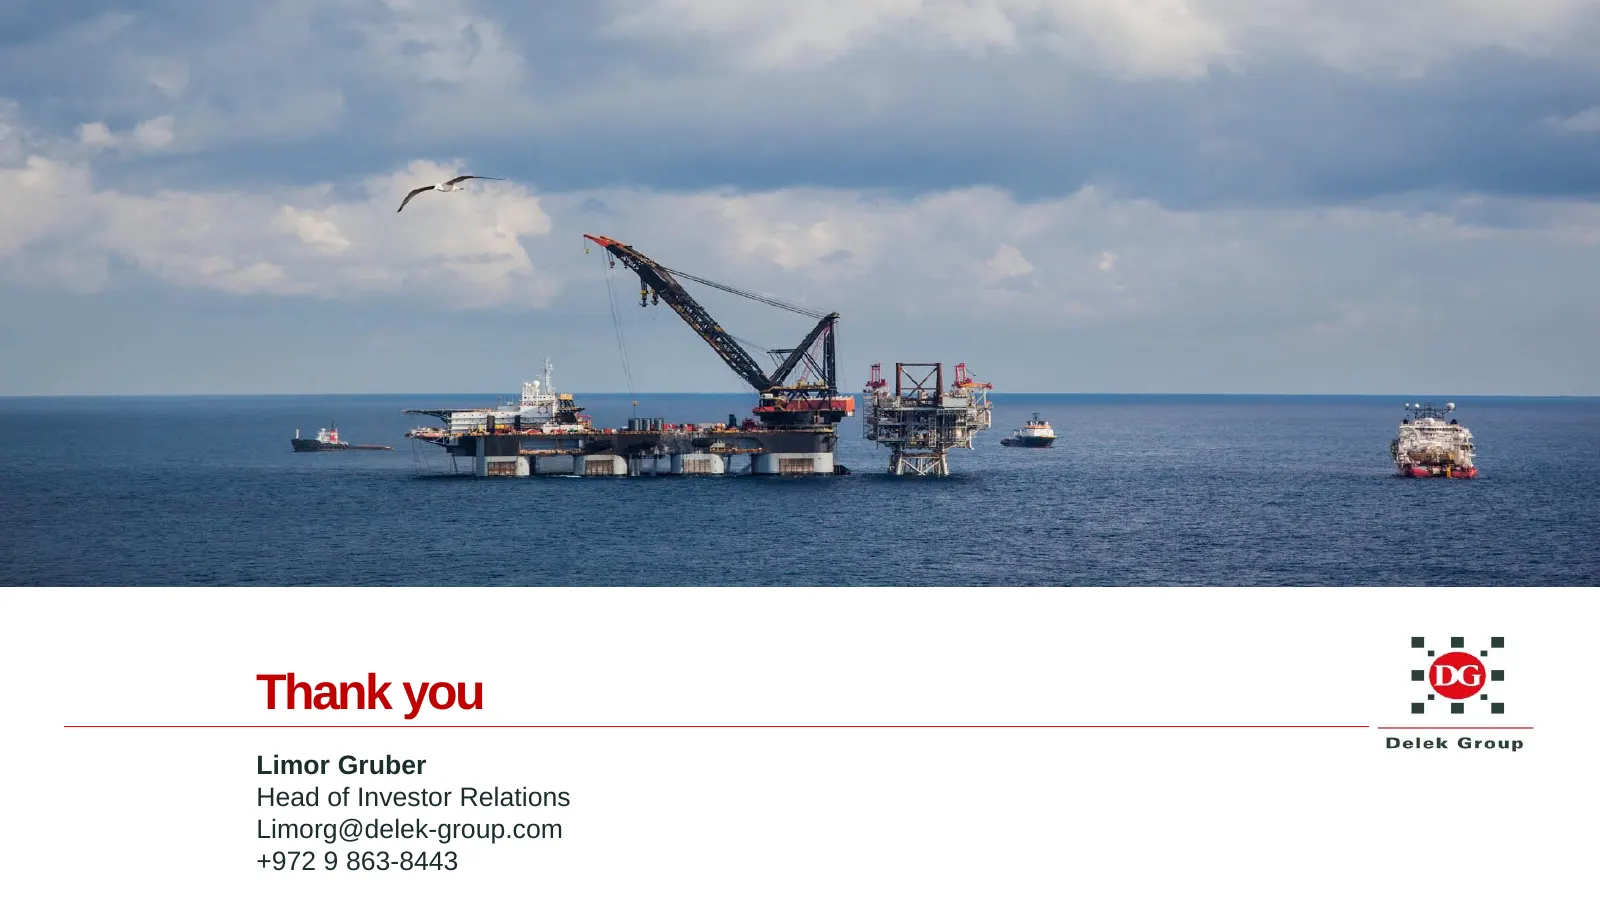
Thank you Limor Gruber Head of Investor Relations Limorg@delek-group.com +972 9 863-8443
Source: Internet Archive copy of ir.delek-group.com
More decks from Delek Group Ltd.
 Q3 2025 Earnings Presentation18 slides · Nov 19, 2025
 Q2 2025 Earnings Presentation17 slides · Aug 20, 2025
 FY2024 Earnings Presentation23 slides · Mar 26, 2025
 Q2 2024 Earnings Presentation15 slides · Aug 22, 2024
 Q1 2024 Earnings Presentation16 slides · May 28, 2024
 Q2 2021 Earnings Presentation12 slides · Aug 26, 2021