STORE Capital — Investor Presentation (November 2016)
27 slides from STORE Capital's investor presentation, Nov 9, 2016
Slide 1: Disclaimer
Disclaimer This presentation includes forward-looking statements within the meaning of Section 27A of the Securities Act of 1933, as amended, that are subject to the “safe harbor” created by that section. These forward-looking statements include comments with respect to our objectives and strategies
Slide 2: STORE Overview
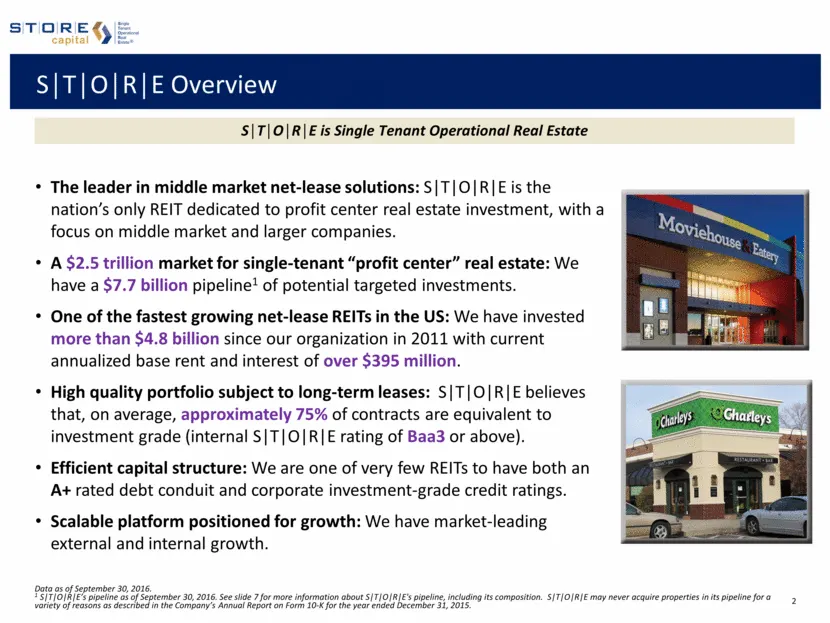
STORE Overview STORE is Single Tenant Operational Real Estate The leader in middle market net-lease solutions: S T O R E is the nation’s only REIT dedicated to profit center real estate investment, with a focus on middle market and larger companies. A $2.5 trillion market for single-tenant “profit c
Slide 3: STORE's Key 2016 Achievements
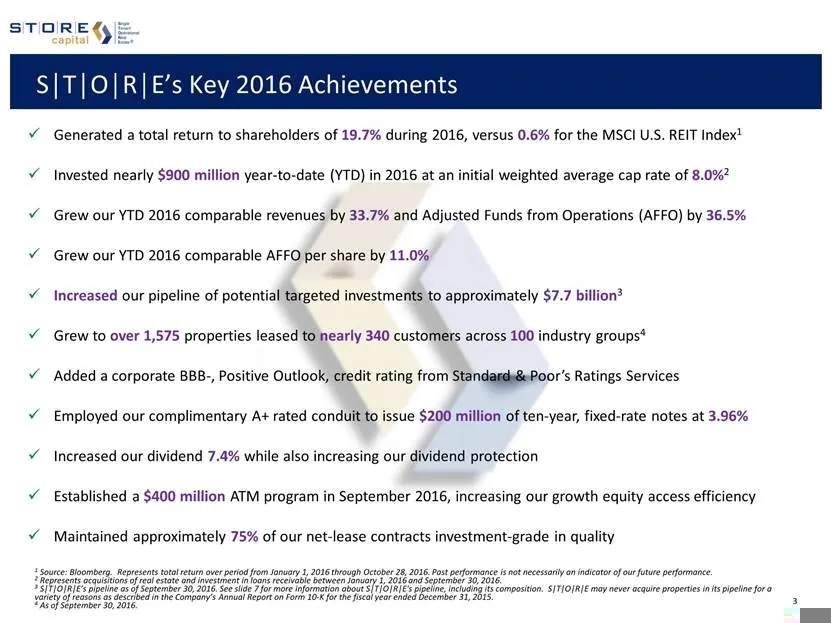
STORE’s Key 2016 Achievements Generated a total return to shareholders of 19.7% during 2016, versus 0.6% for the MSCI U.S. REIT Index1 Invested nearly $900 million year-to-date (YTD) in 2016 at an initial weighted average cap rate of 8.0%2 Grew our YTD 2016 comparable revenues by 33.7% and Adjusted
Slide 4: Experienced Leadership Team with a Proven Track Record
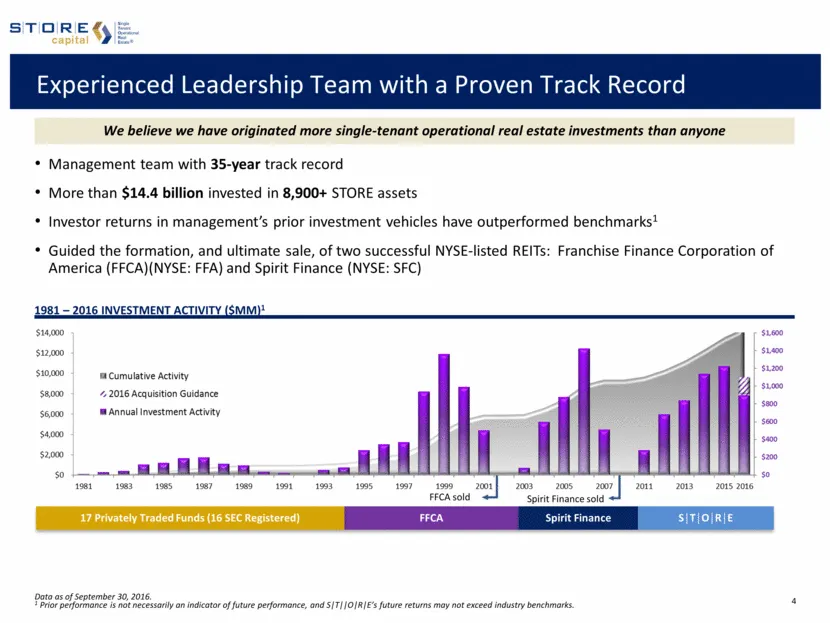
Experienced Leadership Team with a Proven Track Record Management team with 35-year track record More than $14.4 billion invested in 8,900+ STORE assets Investor returns in management’s prior investment vehicles have outperformed benchmarks1 Guided the formation, and ultimate sale, of two successful
Slide 5: Target Market Exceeding $2.5 Trillion in Size
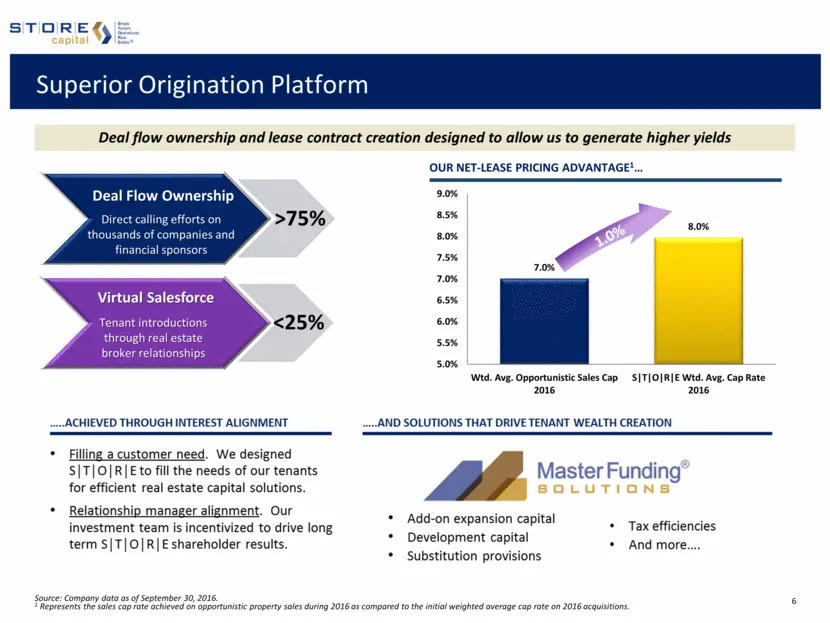
Target Market Exceeding $2.5 Trillion in Size Large More than $2.5 trillion of STORE properties in the United States STORE has a $7.7 billion pipeline of potential targeted investments1 Diverse Highly fragmented More than 1.6 million properties Underserved STORE focuses on larger, unrated bank-depen
Slide 6: We Have a $7.7 Billion Pipeline of Potential Investments
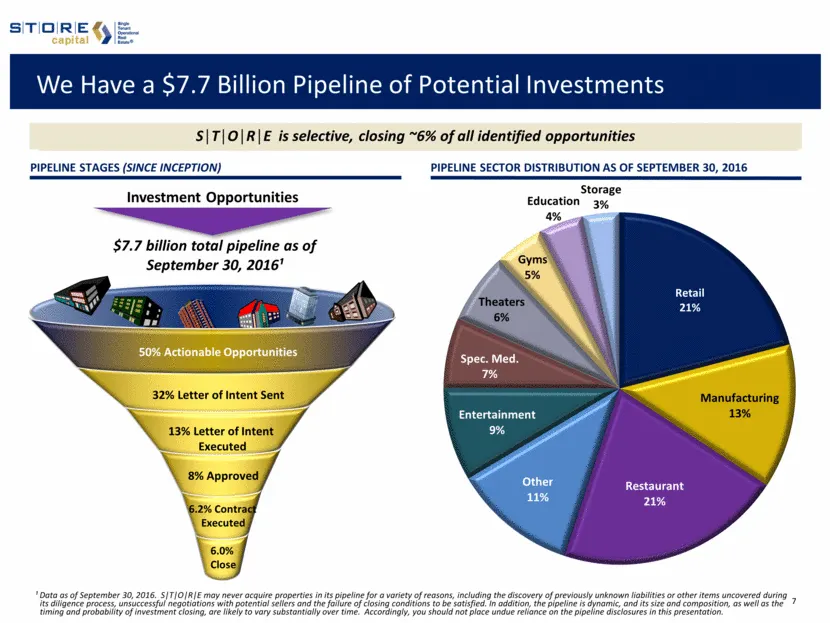
Pipeline Sector Distribution as of september 30, 2016 We Have a $7.7 Billion Pipeline of Potential Investments STORE’s pipeline remains robust LOI Signed ($454 MM) Pipeline Stages (SINCE INCEPTION) New Opportunity ($4.0 billion) Investment Opportunities 32% Letter of Intent Sent 13% Letter of Intent
Slide 7: STORE Contracts vs. Investment Grade Tenant Leases
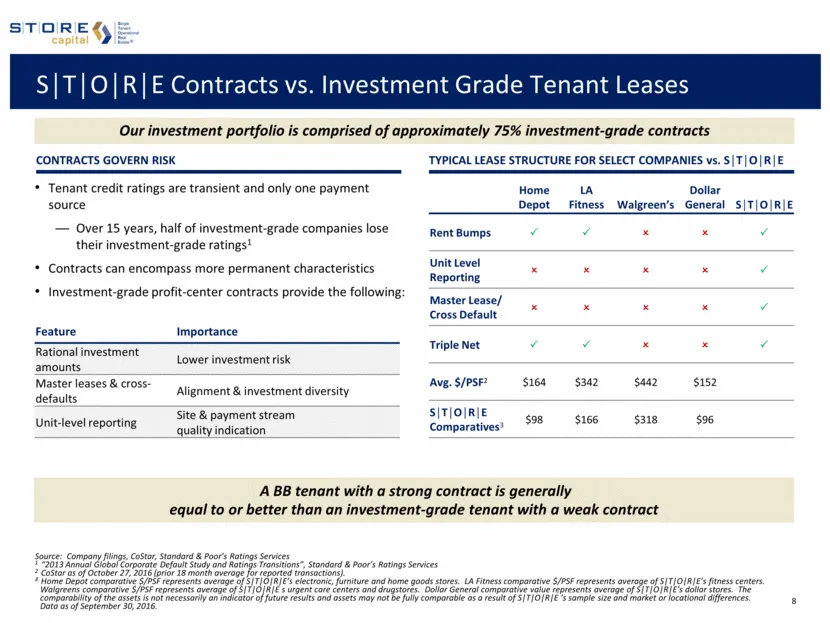
STORE Contracts vs. Investment Grade Tenant Leases TYPICAL LEASE STRUCTURE FOR SELECT COMPANIES vs. STORE Tenant credit ratings are transient and only one payment source Over 15 years, half of investment-grade companies lose their investment-grade ratings1 Contracts can encompass more permanent char
Slide 8: Portfolio Contract Quality
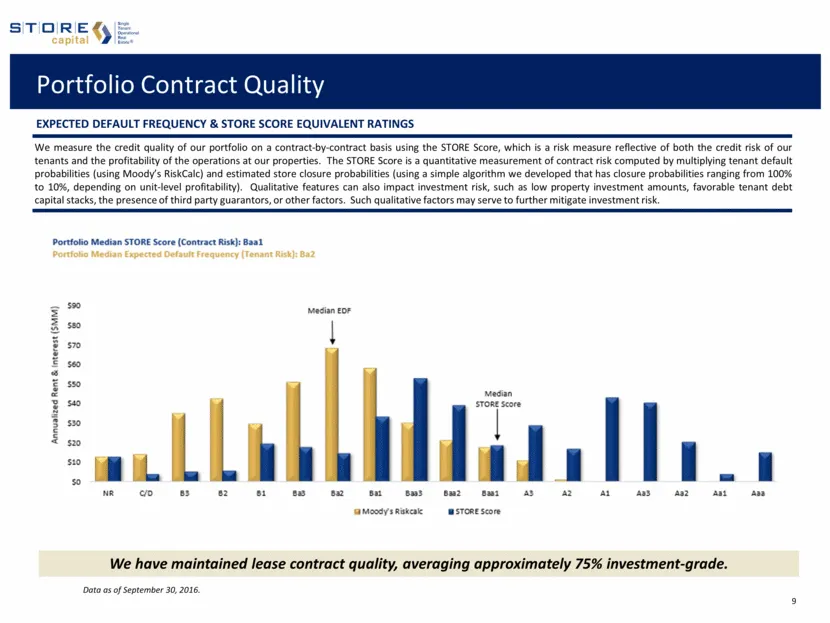
Portfolio Contract Quality Expected default frequency & STORE score equivalent Ratings Data as of September 30, 2016. We measure the credit quality of our portfolio on a contract-by-contract basis using the STORE Score, which is a risk measure reflective of both the credit risk of our tenants and th
Slide 9: Portfolio – At a Glance
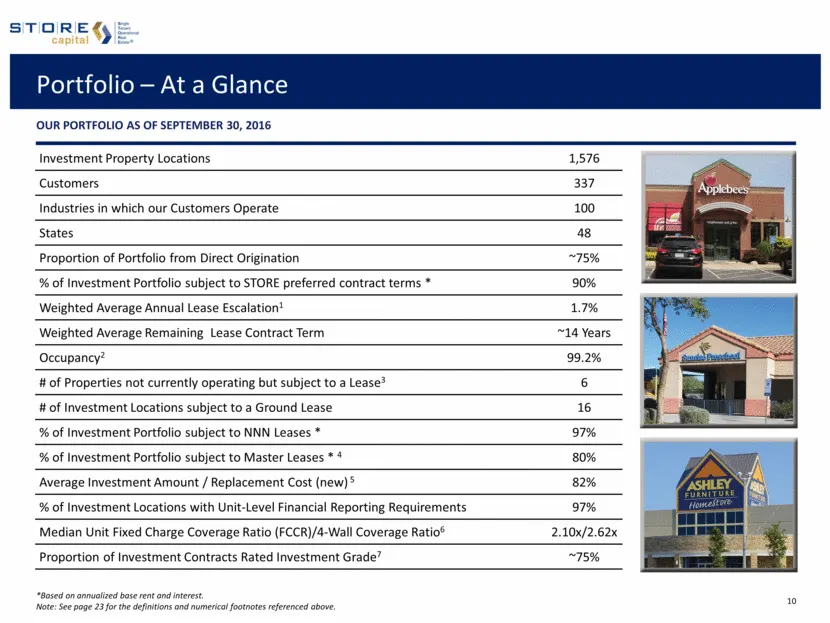
Portfolio – At a Glance OUR PORTFOLIO as of September 30, 2016 Investment Property Locations 1,576 Customers 337 Industries in which our Customers Operate 100 States 48 Proportion of Portfolio from Direct Origination ~75% % of Investment Portfolio subject to STORE preferred contract terms * 90% Weig
Slide 10: Diversified Across Geographies
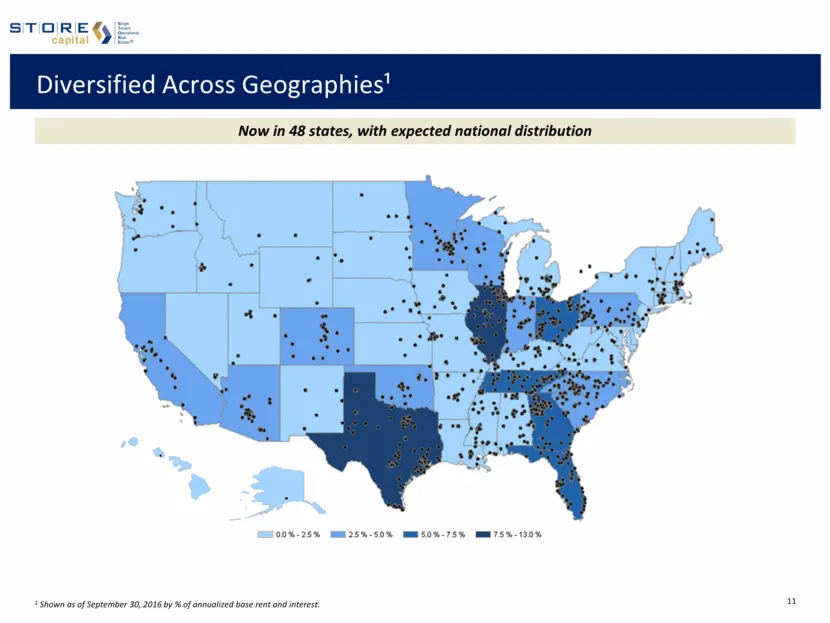
Diversified Across Geographies¹ Now in 48 states, with expected national distribution 1 Shown as of September 30, 2016 by % of annualized base rent and interest.
Slide 11: Diversification Across Customers
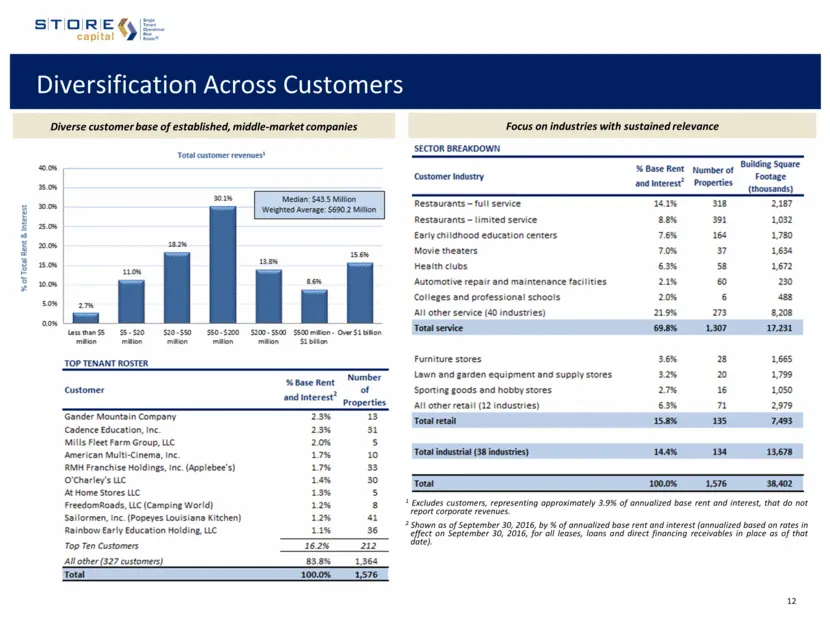
Diversification Across Customers Focus on industries with sustained relevance 1 Excludes customers, representing approximately 3.9% of annualized base rent and interest, that do not report corporate revenues. 2 Shown as of September 30, 2016, by % of annualized base rent and interest (annualized bas
Slide 12: High Quality Portfolio Most Diversified Tenant Base
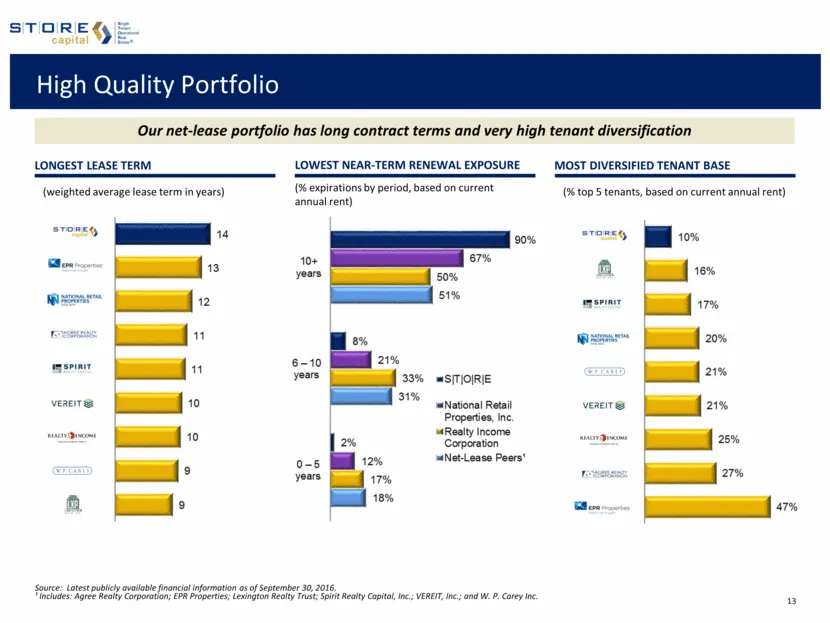
High Quality Portfolio Most Diversified Tenant Base Source: Latest publicly available financial information as of September 30, 2016. ¹ Includes: Agree Realty Corporation; EPR Properties; Lexington Realty Trust; Spirit Realty Capital, Inc.; VEREIT, Inc.; and W. P. Carey Inc. (weighted average lease
Slide 13: Stable and Growing Cash Flow
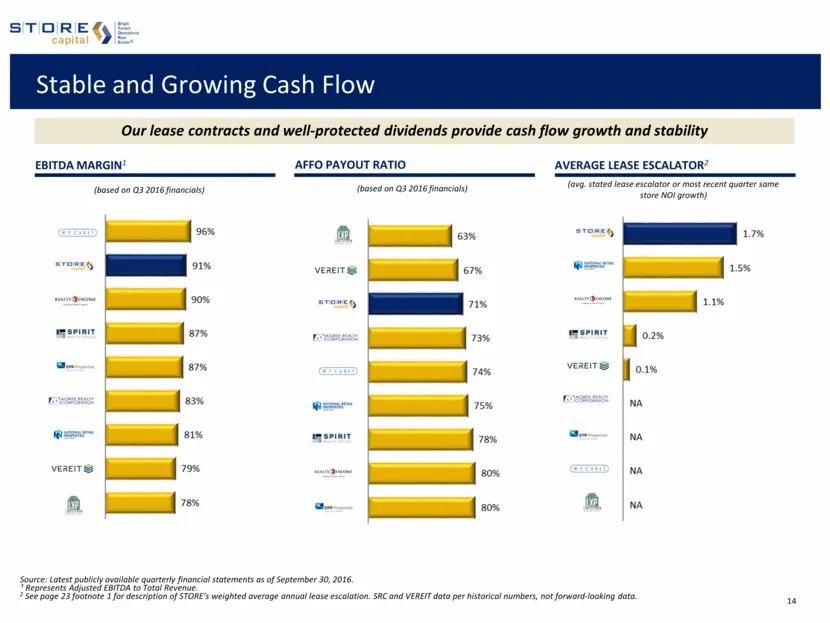
Stable and Growing Cash Flow Average Lease escalator2 Source: Latest publicly available quarterly financial statements as of September 30, 2016. ¹ Represents Adjusted EBITDA to Total Revenue. 2 See page 23 footnote 1 for description of STORE’s weighted average annual lease escalation. SRC and VEREIT
Slide 14: Flexible, Conservative Capital Structure
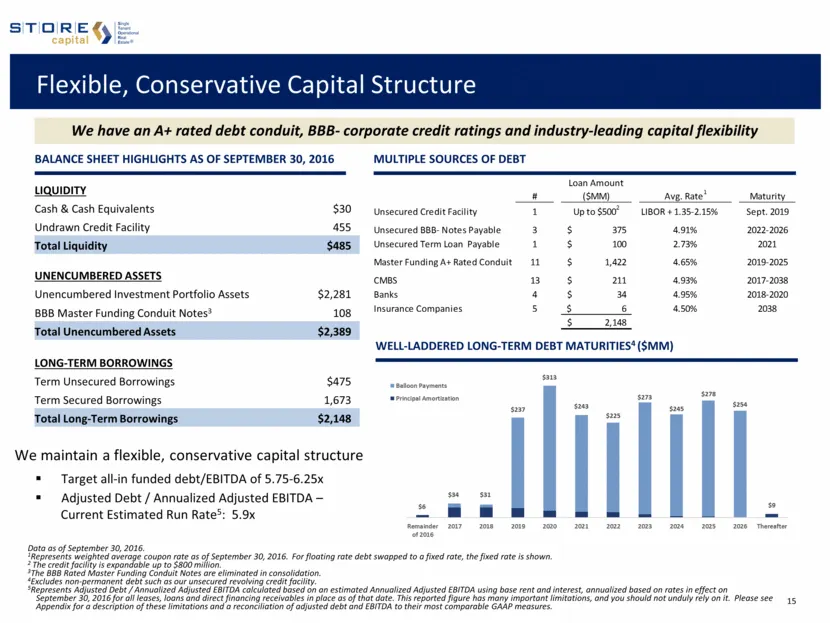
Flexible, Conservative Capital Structure Data as of September 30, 2016. 1Represents weighted average coupon rate as of September 30, 2016. For floating rate debt swapped to a fixed rate, the fixed rate is shown. 2 The credit facility is expandable up to $800 million. 3The BBB Rated Master Funding Co
Slide 15: Prudent Leverage Philosophy and Access to Varied Borrowings
Prudent Leverage Philosophy and Access to Varied Borrowings A+ Master Funding BBB- Unsecured Notes Greater Access to Capital at a Low Cost ü ü Flexible Asset Management ü ü Differentiated Investor Base ü ü Ability to Re-Lever ü ü Source: SEC company filings. Data as of September 30, 2016. 1 Excludes
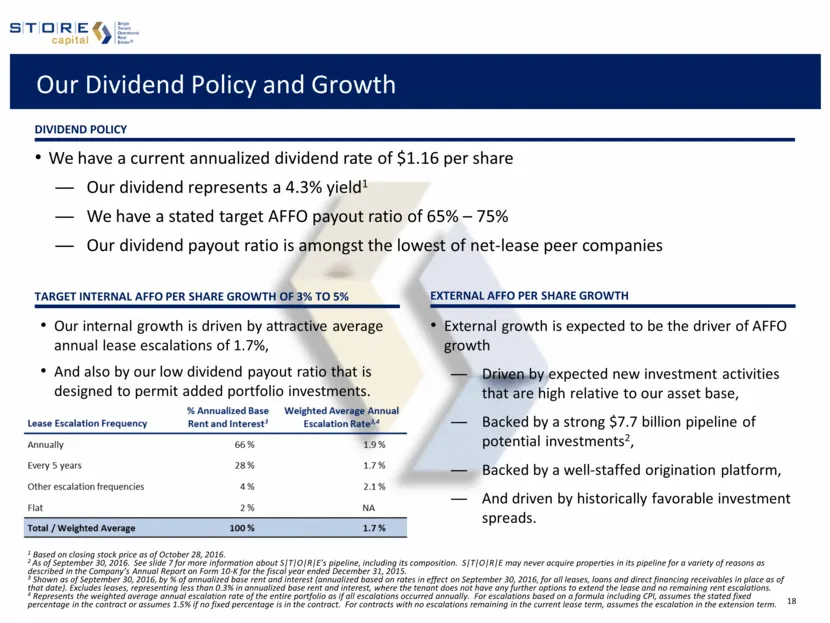
Slide 16: Our Dividend Policy and Growth
Our Dividend Policy and Growth Dividend policy We have a current annualized dividend rate of $1.16 per share Our dividend represents a 4.3% yield1 We have a stated target AFFO payout ratio of 65% – 75% Our dividend payout ratio is amongst the lowest of net-lease peer companies TARGET Internal AFFO p
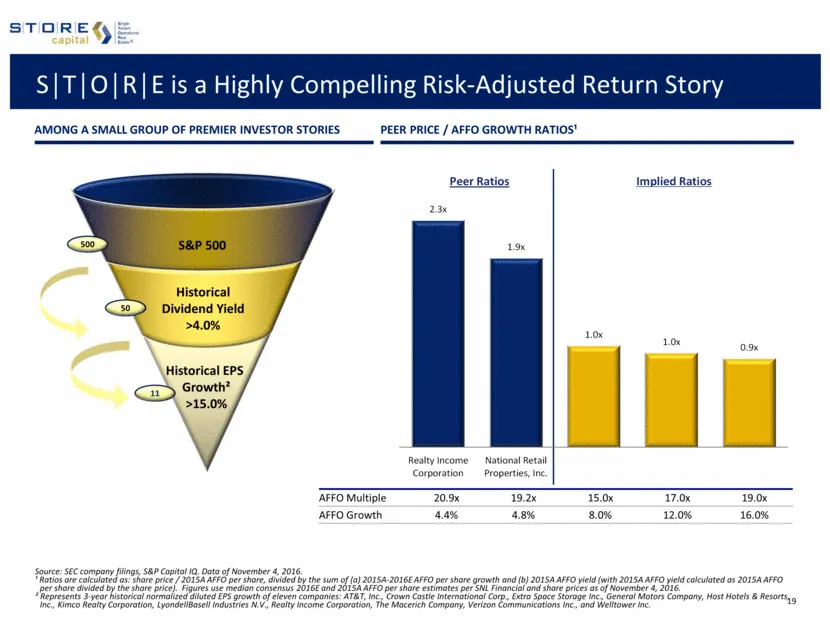
Slide 17: STORE is a Highly Compelling Risk-Adjusted Return Story
STORE is a Highly Compelling Risk-Adjusted Return Story Historical EPS Growth² >15.0% 11 50 Historical Dividend Yield >4.0% Source: SEC company filings, S&P Capital IQ. Data of November 4, 2016. ¹ Ratios are calculated as: share price / 2015A AFFO per share, divided by the sum of (a) 2015A-2016E AFF
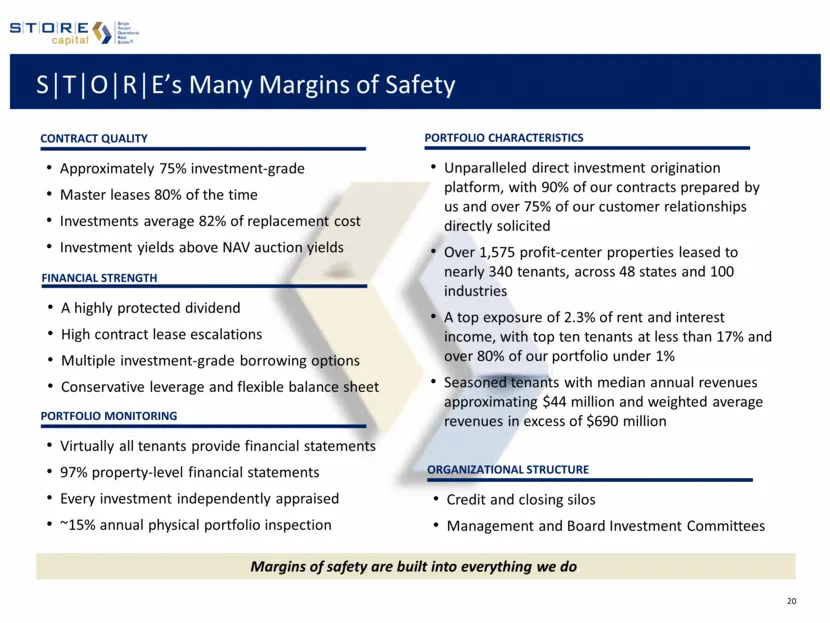
Slide 18: STORE's Many Margins of Safety
Margins of safety are built into everything we do. STORE’s Many Margins of Safety contract quality Approximately 75% investment-grade Master leases 80% of the time Investments average 82% of replacement cost Investment yields above NAV auction yields Portfolio characteristics Unparalleled direct inv
Slide 19: Investment Highlights
Investment Highlights We own a high quality, predominantly investment-grade quality, net-lease contract portfolio 2 We believe we employ a market-leading, direct origination approach in an underserved $2.5 trn market 1 Our leadership team has a 35-year track record of out-performance1 6 4 Our busine
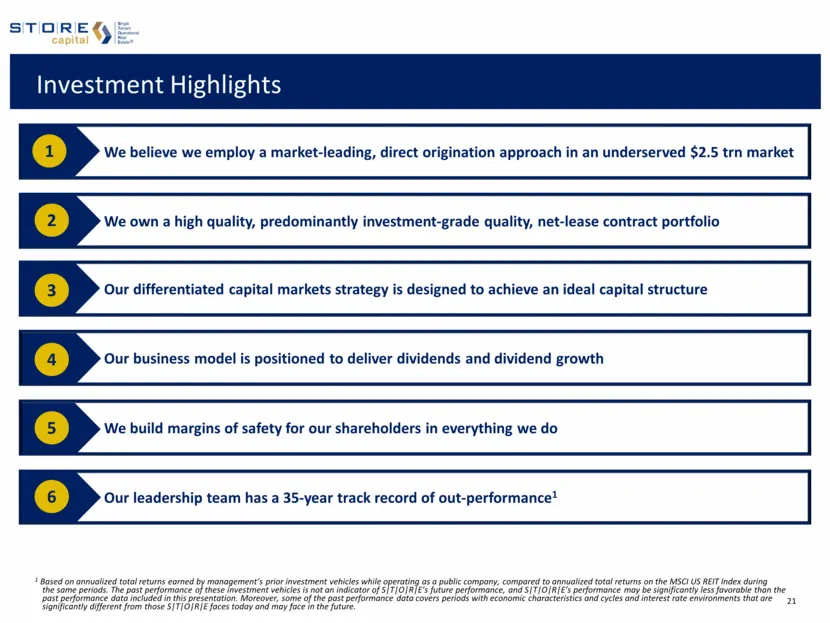
Slide 20: Investment Highlights
STORE (| capital Investment Highlights We believe we employ a market-leading, direct origination approach in an underserved $2.5 trn market We own a high quality, predominantly investment-grade quality, net-lease contract portfolio Our differentiated capital markets strategy is designed to achieve a
Slide 21: Definitions and Footnotes
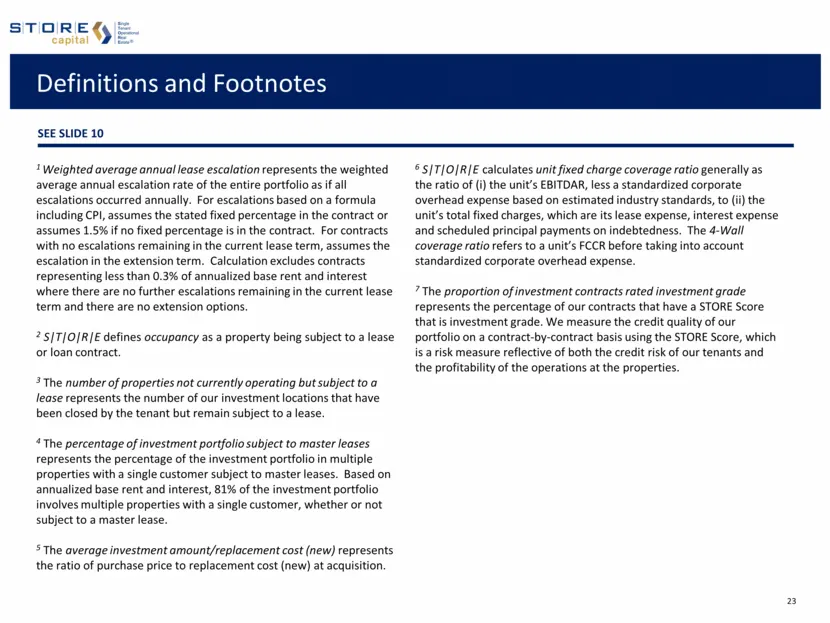
Definitions and Footnotes 1 Weighted average annual lease escalation represents the weighted average annual escalation rate of the entire portfolio as if all escalations occurred annually. For escalations based on a formula including CPI, assumes the stated fixed percentage in the contract or assume
Slide 22: Supplemental Reporting Measures
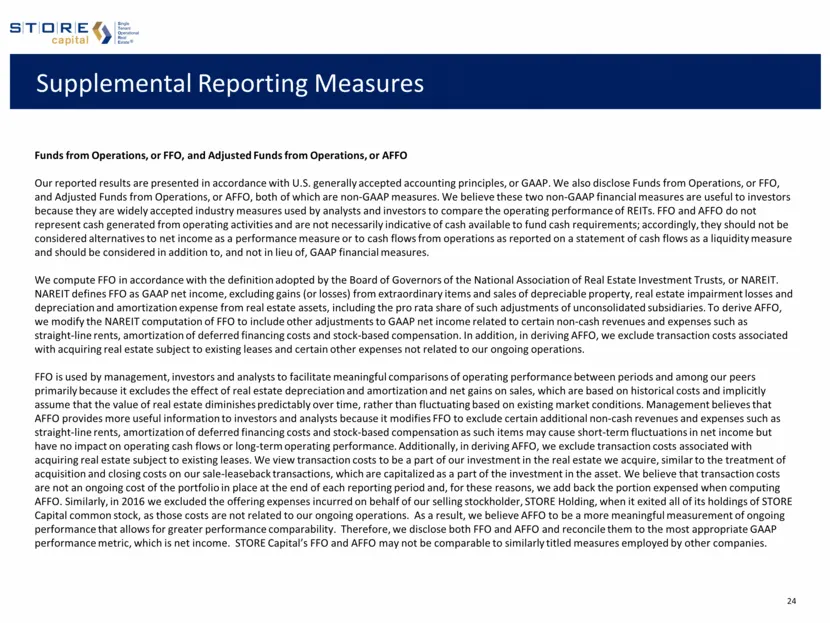
Supplemental Reporting Measures Funds from Operations, or FFO, and Adjusted Funds from Operations, or AFFO Our reported results are presented in accordance with U.S. generally accepted accounting principles, or GAAP. We also disclose Funds from Operations, or FFO, and Adjusted Funds from Operations,
Slide 23: Supplemental Reporting Measures (Continued)
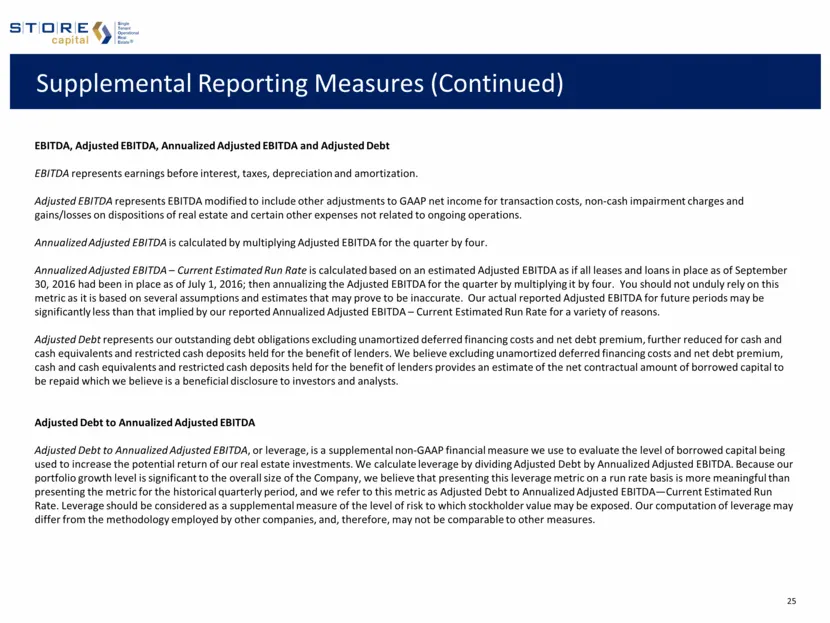
Supplemental Reporting Measures (Continued) EBITDA, Adjusted EBITDA, Annualized Adjusted EBITDA and Adjusted Debt EBITDA represents earnings before interest, taxes, depreciation and amortization. Adjusted EBITDA represents EBITDA modified to include other adjustments to GAAP net income for transacti
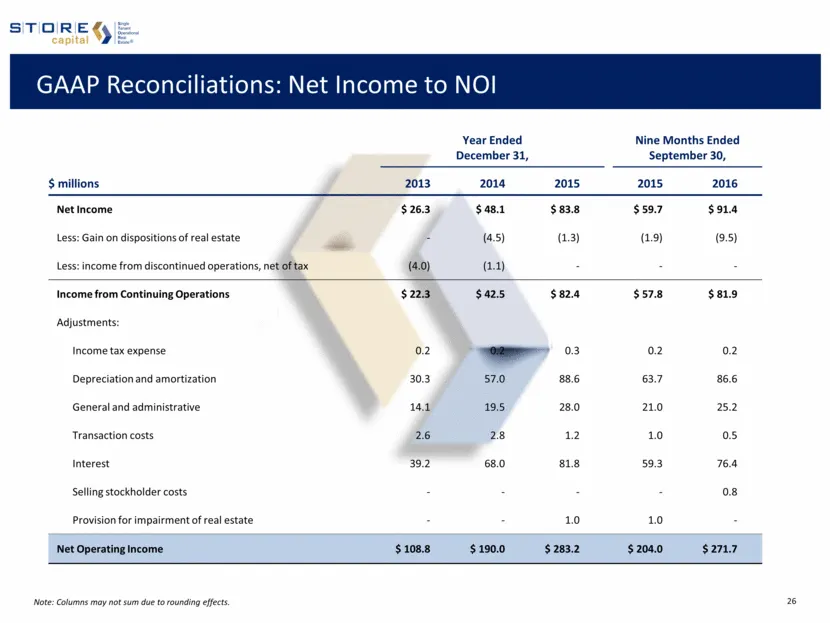
Slide 24: GAAP Reconciliations: Net Income to NOI
GAAP Reconciliations: Net Income to NOI Note: Columns may not sum due to rounding effects. Year Ended December 31, Nine Months Ended September 30, $ millions 2013 2014 2015 2015 2016 Net Income $ 26.3 $ 48.1 $ 83.8 $ 59.7 $ 91.4 Less: Gain on dispositions of real estate - (4.5) (1.3) (1.9) (9.5) Les
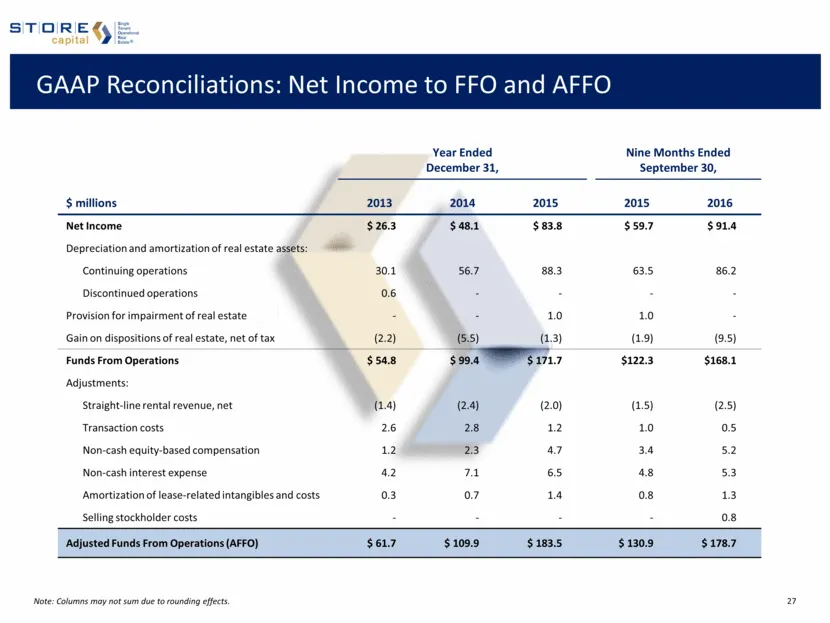
Slide 25: GAAP Reconciliations: Net Income to FFO and AFFO
GAAP Reconciliations: Net Income to FFO and AFFO Note: Columns may not sum due to rounding effects. Year Ended December 31, Nine Months Ended September 30, $ millions 2013 2014 2015 2015 2016 Net Income $ 26.3 $ 48.1 $ 83.8 $ 59.7 $ 91.4 Depreciation and amortization of real estate assets: Continuin
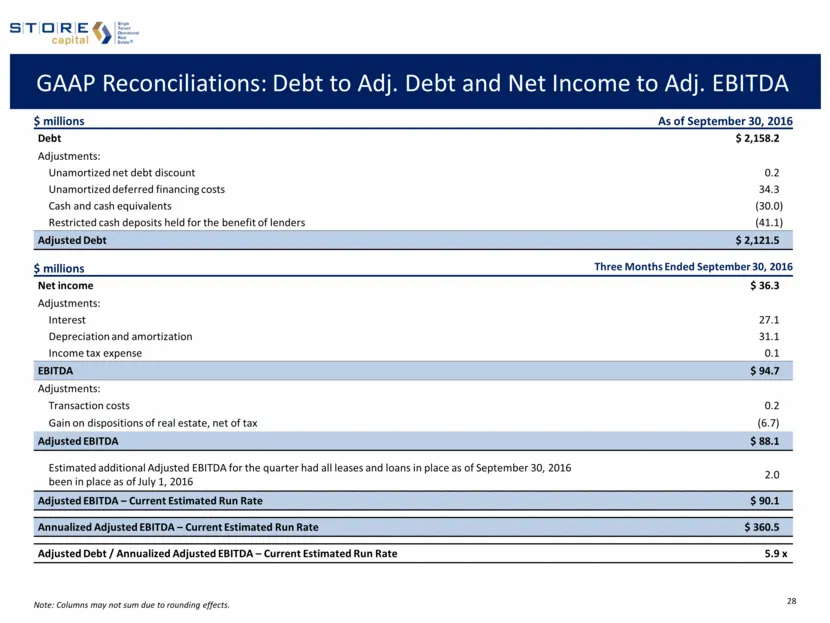
Slide 26: GAAP Reconciliations: Debt to Adj. Debt and Net Income to Adj. EBITDA
GAAP Reconciliations: Debt to Adj. Debt and Net Income to Adj. EBITDA $ millions As of September 30, 2016 Debt $ 2,158.2 Adjustments: Unamortized net debt discount 0.2 Unamortized deferred financing costs 34.3 Cash and cash equivalents (30.0 ) Restricted cash deposits held for the benefit of lenders
Slide 27: GAAP Reconciliations: Debt to Adj. Debt and Net Income to Adj. EBITDA
STORE : capital GAAP Reconciliations: Debt to Adj. Debt and Net Income to Adj. EBITDA Smillions ‘As of September 30, 2016 Debt $2,1582 Adjustments: ‘Unamortized net debt discount 02 Unamortized deferred financing costs 343 CCash and cash equivalents (20.0) Restricted cash deposits held for the benef
Source: SEC EDGAR · 8-K filed Nov 9, 2016
More decks from STORE Capital Corp
 Q2 2023 Earnings Presentation10 slides · Aug 4, 2023
 Q2 2022 Earnings Presentation26 slides · Aug 3, 2022
 Q2 2022 Earnings Presentation22 slides · Aug 3, 2022
 Q1 2022 Earnings Presentation26 slides · May 4, 2022
 Q1 2022 Earnings Presentation22 slides · May 4, 2022
 Q4 2021 Earnings Presentation33 slides · Feb 23, 2022