ATA Creativity Global · NASDAQ:AACG
ATA Creativity Global — Q3 2024 Earnings Presentation
20 slides from ATA Creativity Global's earnings presentation, Nov 7, 2024

Slide 1: ATA Creativity Global 2024 Third Quarter Earnings Call
ATA Creativity Global NASDAQ: AACG 2024 THIRD QUARTER EARNINGS CALL November 7, 2024 Speakers: Kevin Ma, Chairman & CEO Ruobai Sima, CFO Jun Zhang, President P A G E 1
Slide 2: Safe Harbor Statement
Safe Harbor Statement This presentation was developed by ATA Creativity Global (“ACG” or the “Company”) and is intended to be used solely in connection with ACG’s earnings call for the third quarter (Q3 2024”) and nine months (“9M 2024”) ended September 30, 2024. This presentation is not to be const
Slide 3: Welcome Remarks
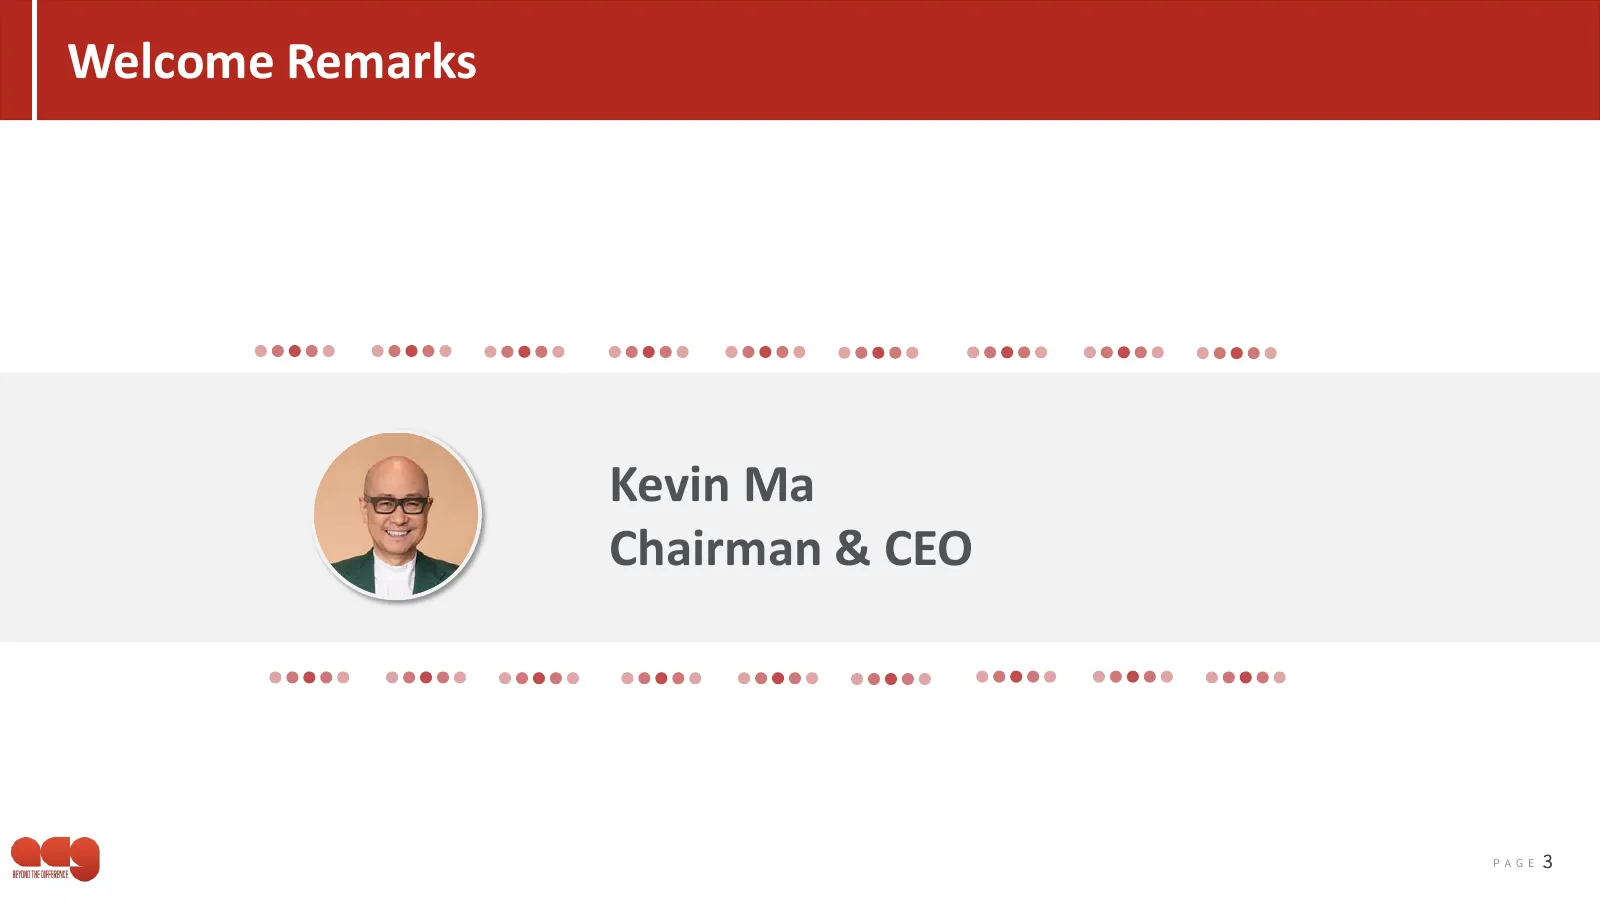
Welcome Remarks Kevin Ma Chairman & CEO P A G E 3
Slide 4: Key Highlights
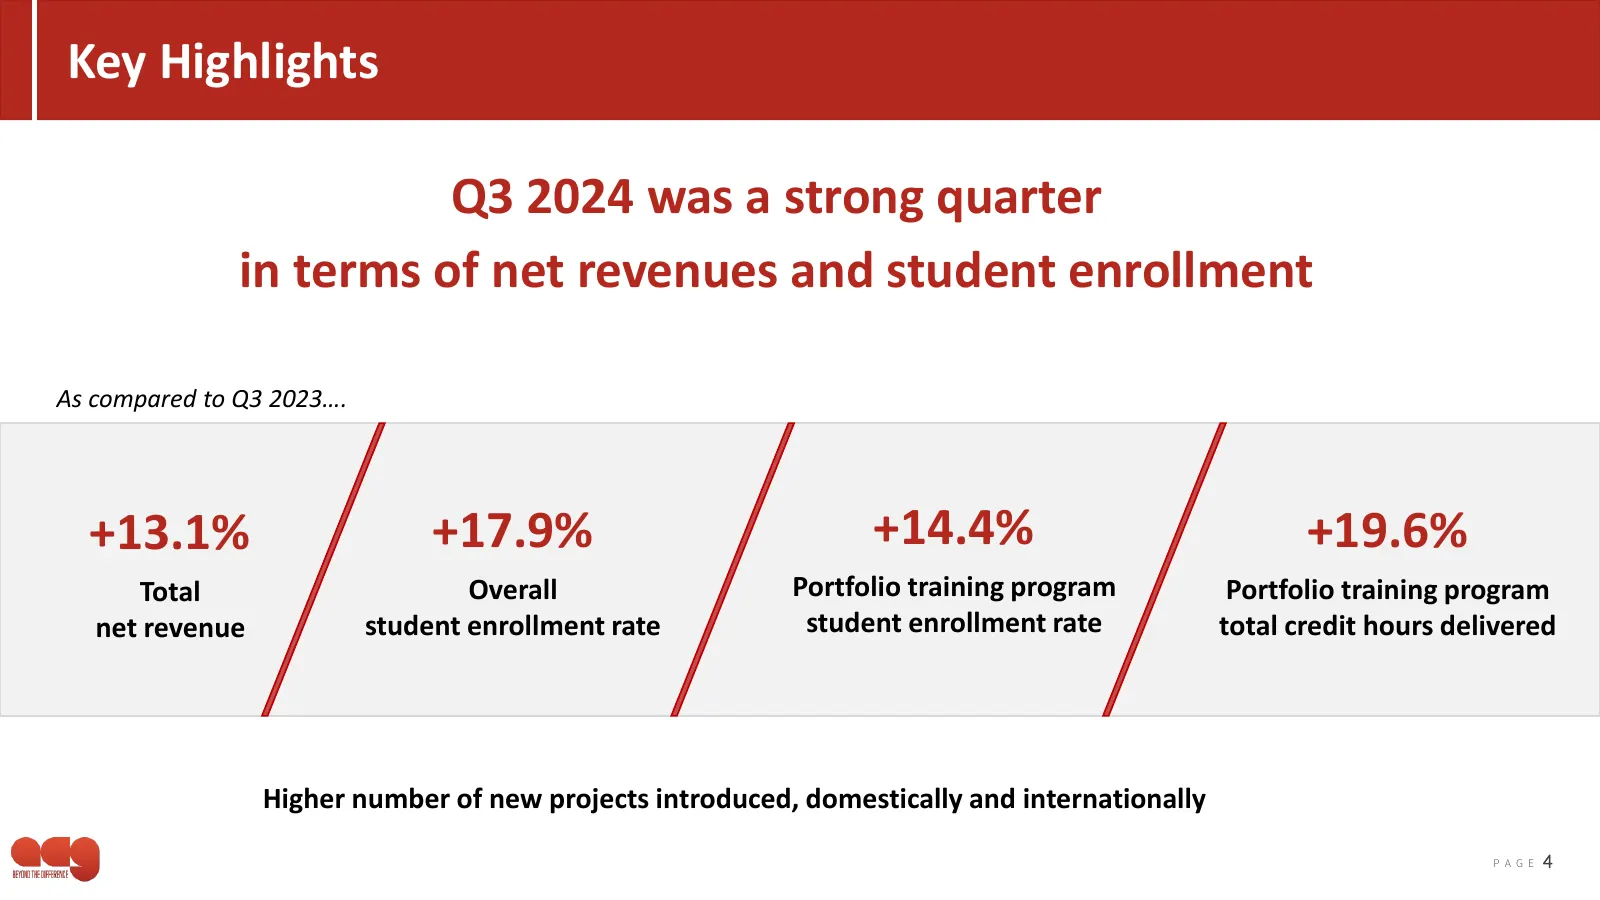
Key Highlights Q3 2024 was a strong quarter in terms of net revenues and student enrollment As compared to Q3 2023…. +13.1% +17.9% +14.4% +19.6% Total Overall Portfolio training program Portfolio training program net revenue student enrollment rate student enrollment rate total credit hours delivere
Slide 5: Key Highlights (cont.)
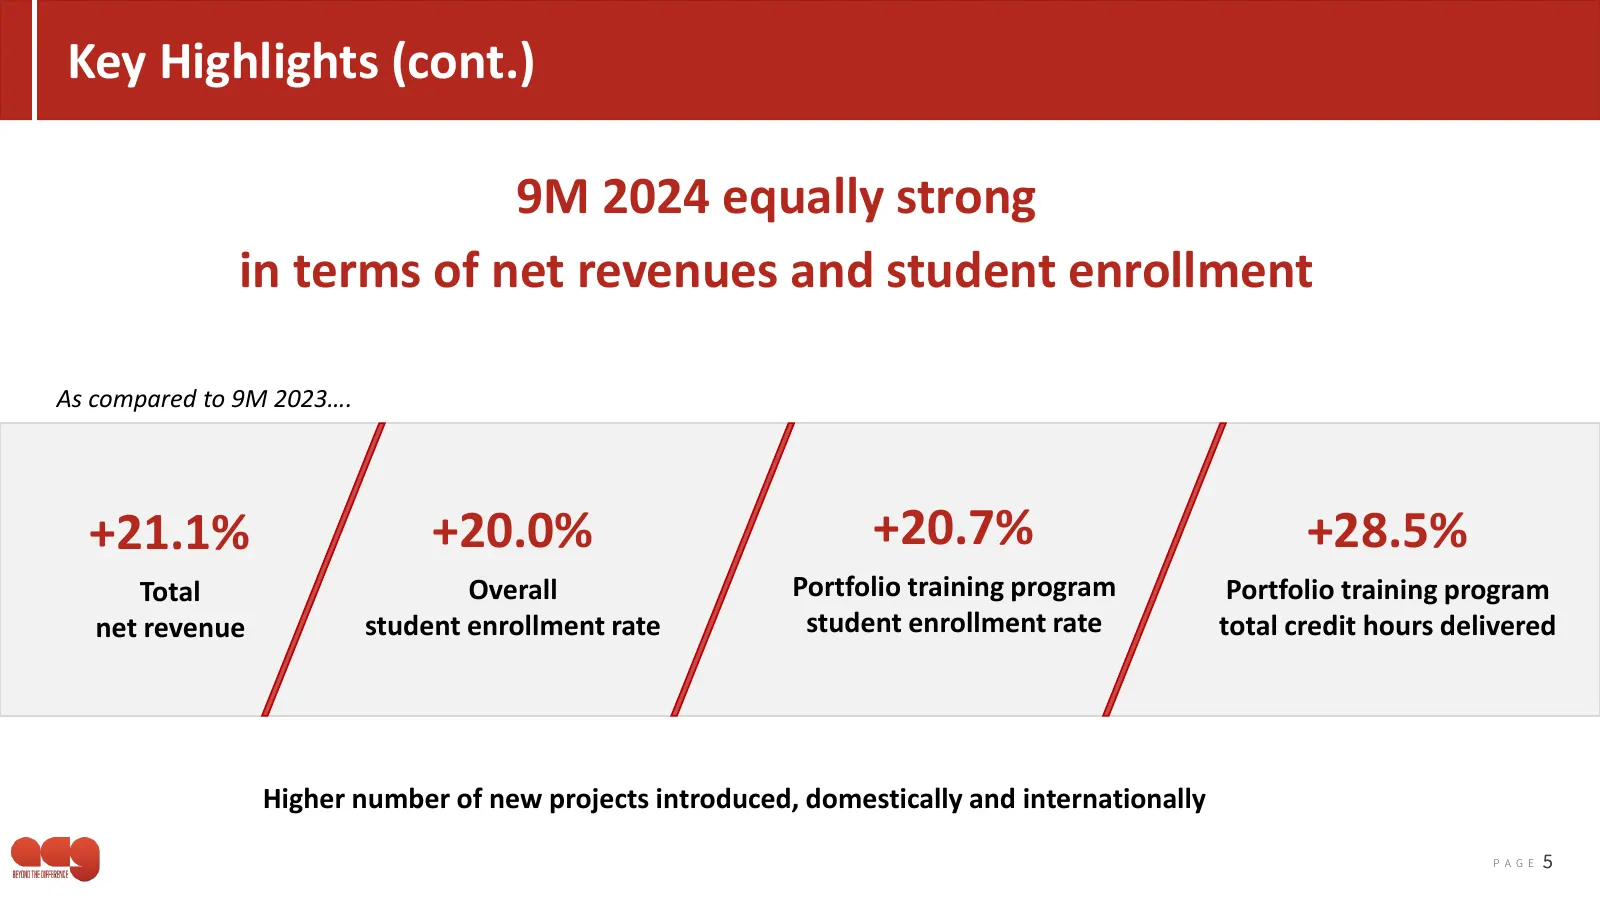
Key Highlights (cont.) 9M 2024 equally strong in terms of net revenues and student enrollment As compared to 9M 2023…. +21.1% +20.0% +20.7% +28.5% Total Overall Portfolio training program Portfolio training program net revenue student enrollment rate student enrollment rate total credit hours delive
Slide 6: Q3 2024 Operational Highlights
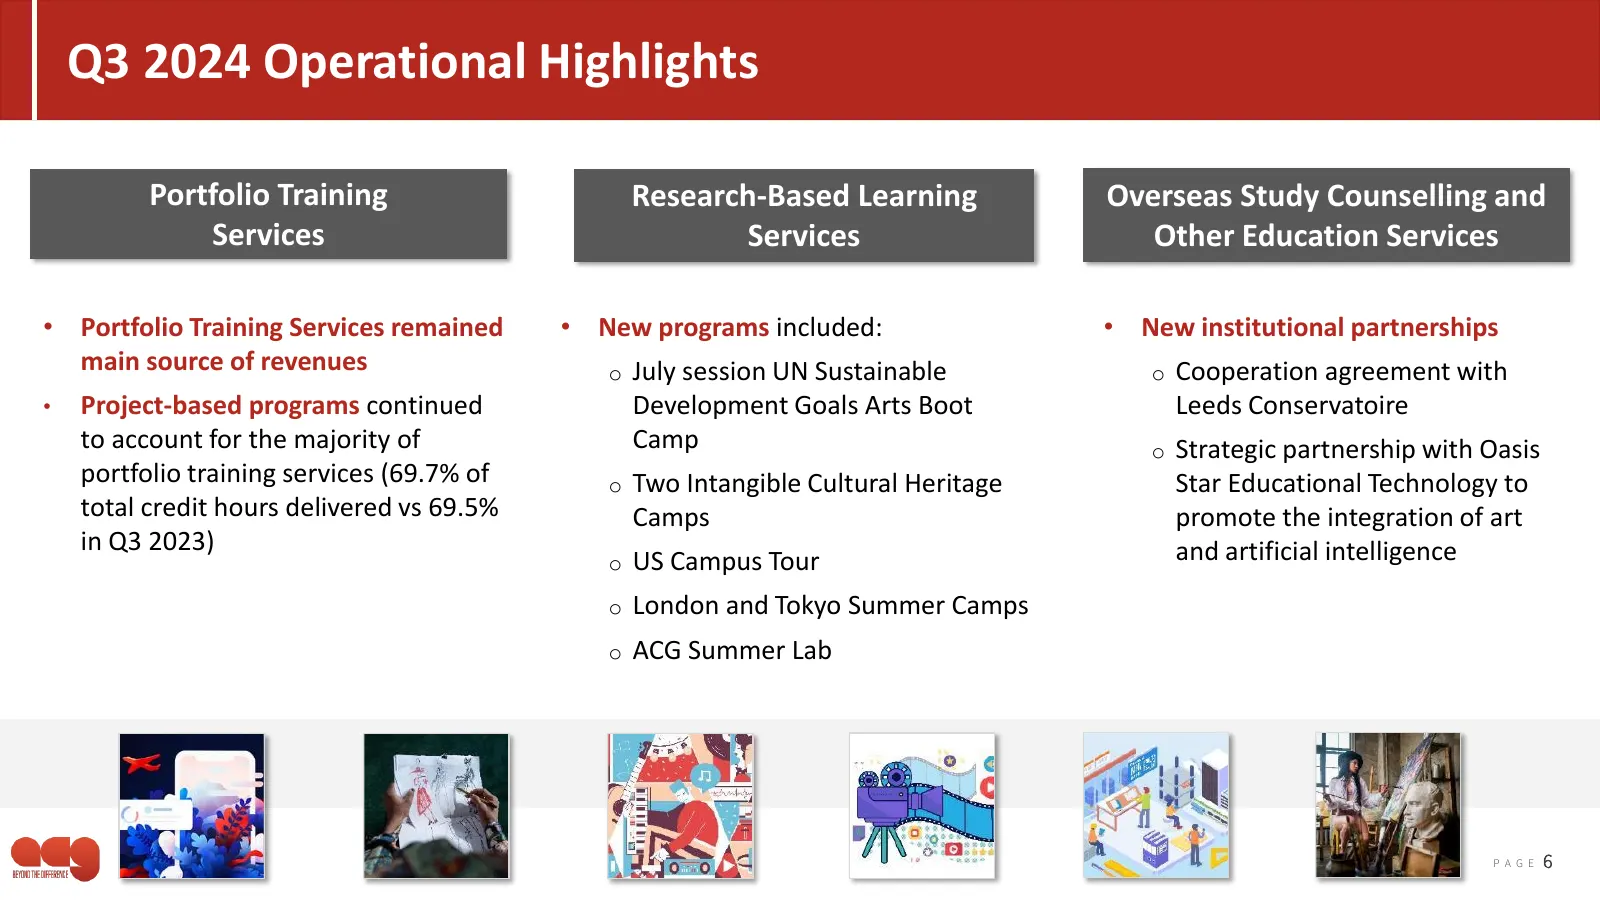
Q3 2024 Operational Highlights Portfolio Training Research-Based Learning Overseas Study Counselling and Services Services Other Education Services • Portfolio Training Services remained • New programs included: • New institutional partnerships main source of revenues o July session UN Sustainable o
Slide 7: Financial and Operational Results
Financial and Operational Results Ruobai Sima CFO P A G E 7
Slide 8: Q3 2024 Key Financial Metrics
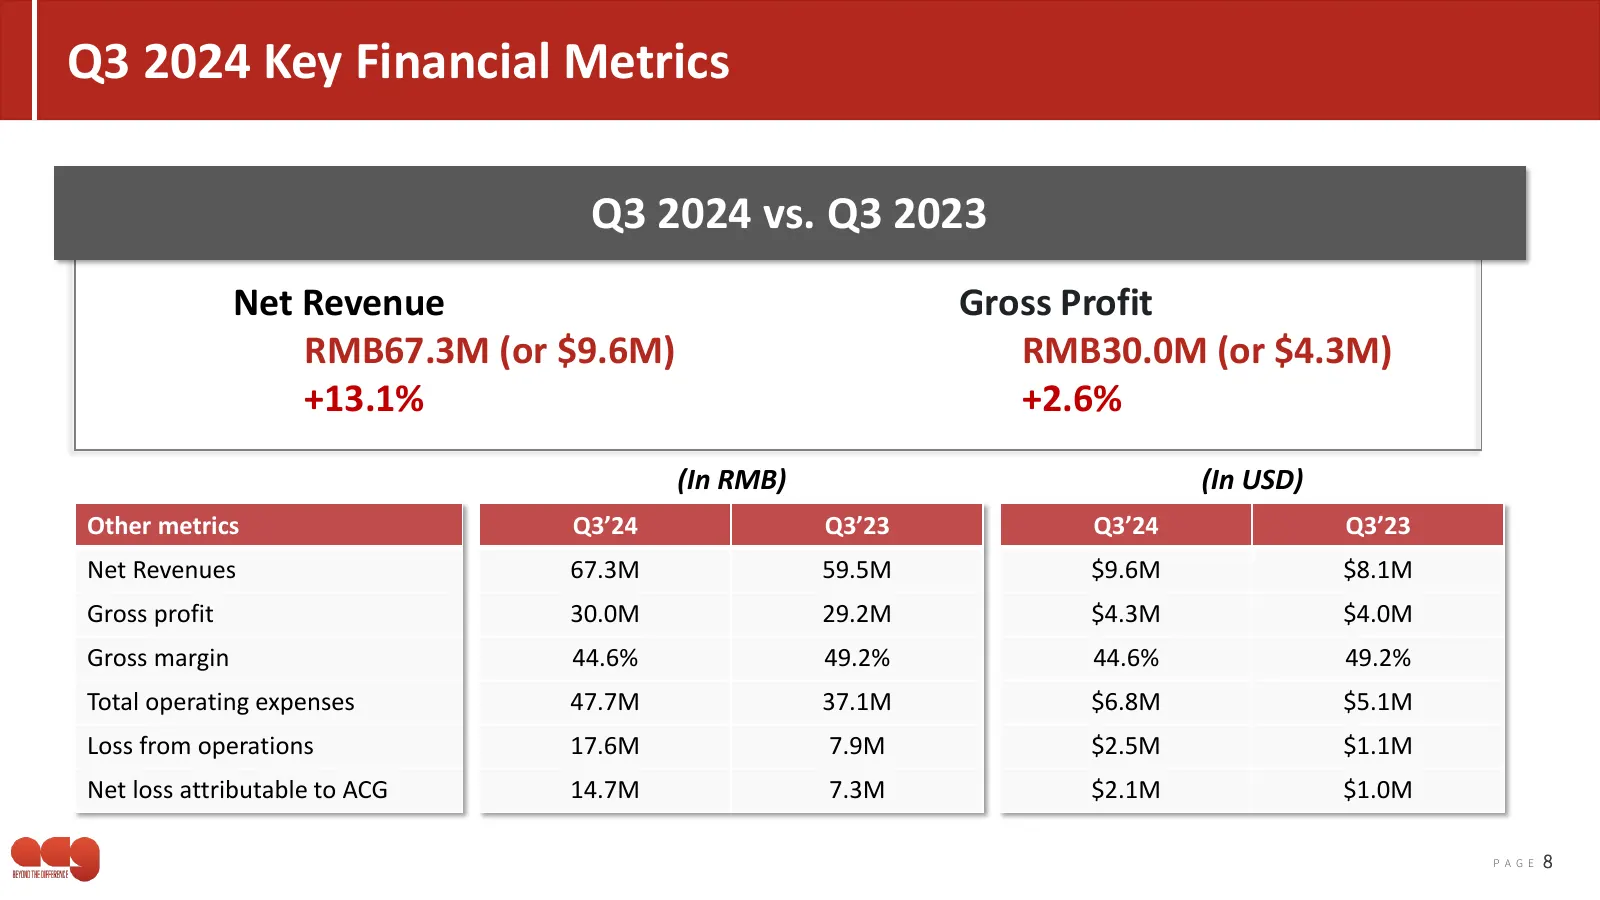
Q3 2024 Key Financial Metrics Q3 2024 vs. Q3 2023 Net Revenue Gross Profit RMB67.3M (or $9.6M) RMB30.0M (or $4.3M) +13.1% +2.6% (In RMB) (In USD) Other metrics Q3’24 Q3’23 Q3’24 Q3’23 Net Revenues 67.3M 59.5M $9.6M $8.1M Gross profit 30.0M 29.2M $4.3M $4.0M Gross margin 44.6% 49.2% 44.6% 49.2% Total
Slide 9: 9M 2024 Key Financial Metrics
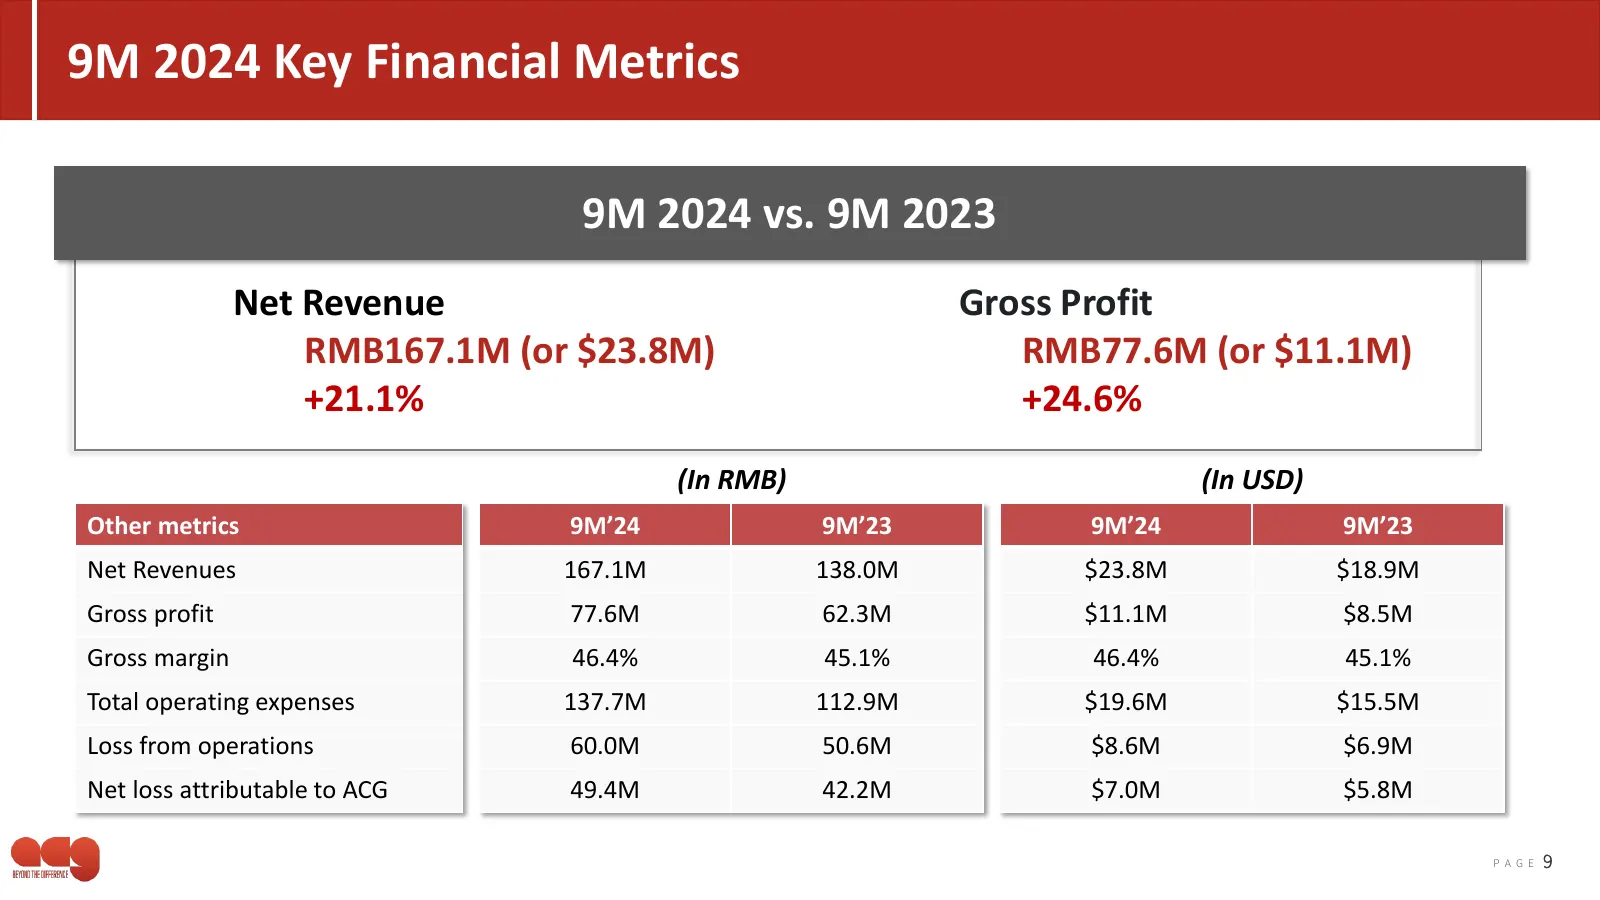
9M 2024 Key Financial Metrics 9M 2024 vs. 9M 2023 Net Revenue Gross Profit RMB167.1M (or $23.8M) RMB77.6M (or $11.1M) +21.1% +24.6% (In RMB) (In USD) Other metrics 9M’24 9M’23 9M’24 9M’23 Net Revenues 167.1M 138.0M $23.8M $18.9M Gross profit 77.6M 62.3M $11.1M $8.5M Gross margin 46.4% 45.1% 46.4% 45
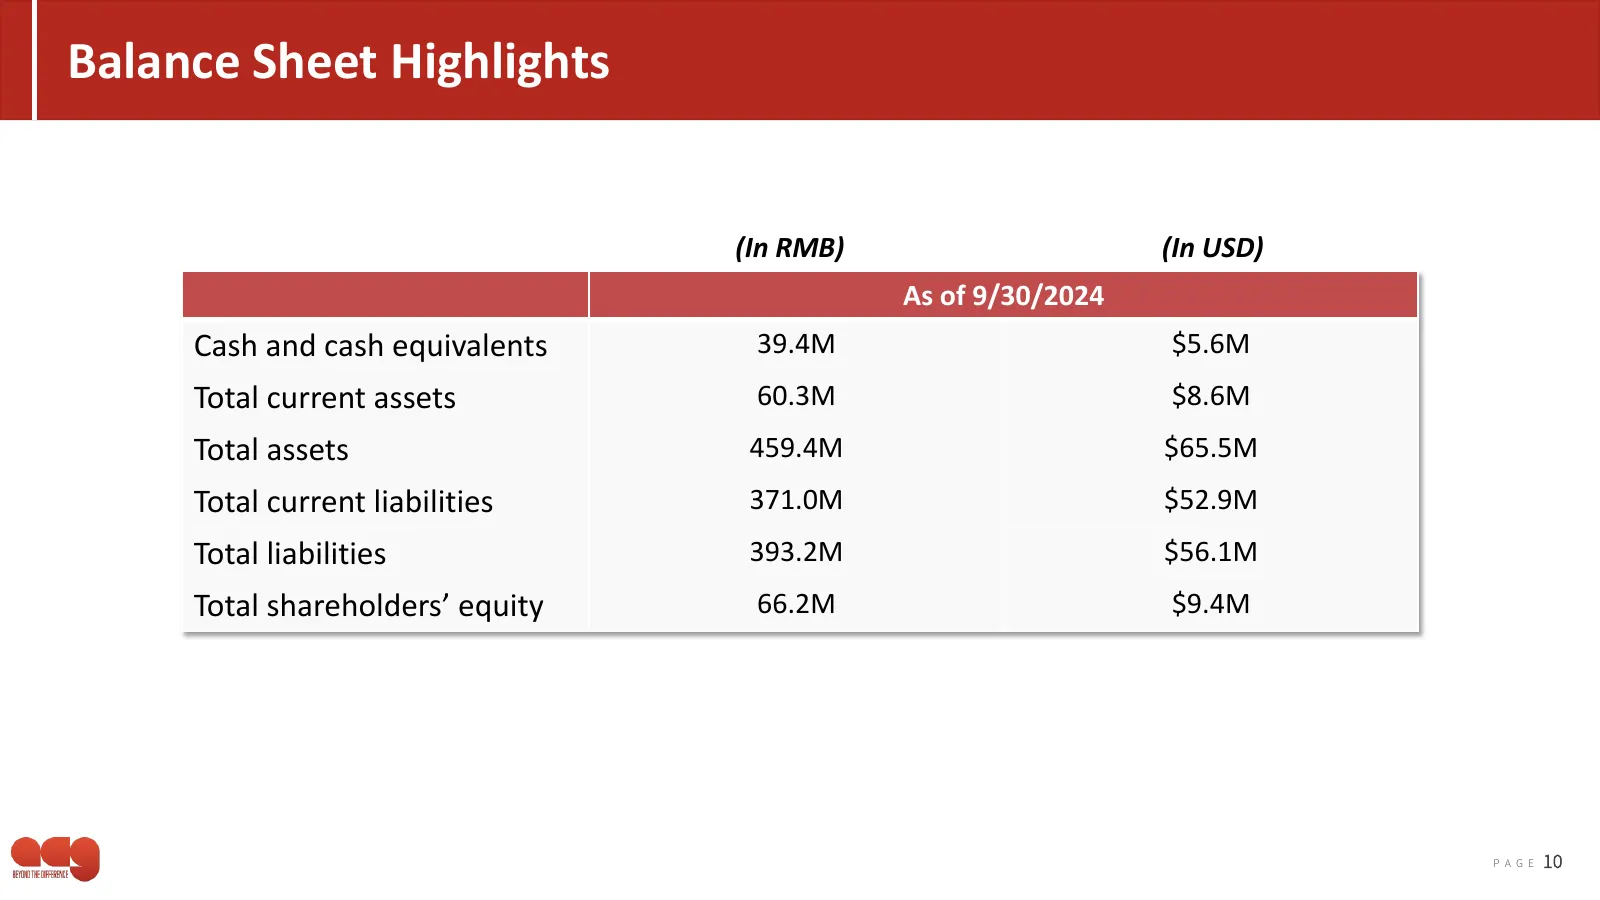
Slide 10: Balance Sheet Highlights
Balance Sheet Highlights (In RMB) (In USD) As of 9/30/2024 Cash and cash equivalents 39.4M $5.6M Total current assets 60.3M $8.6M Total assets 459.4M $65.5M Total current liabilities 371.0M $52.9M Total liabilities 393.2M $56.1M Total shareholders’ equity 66.2M $9.4M P A G E 10
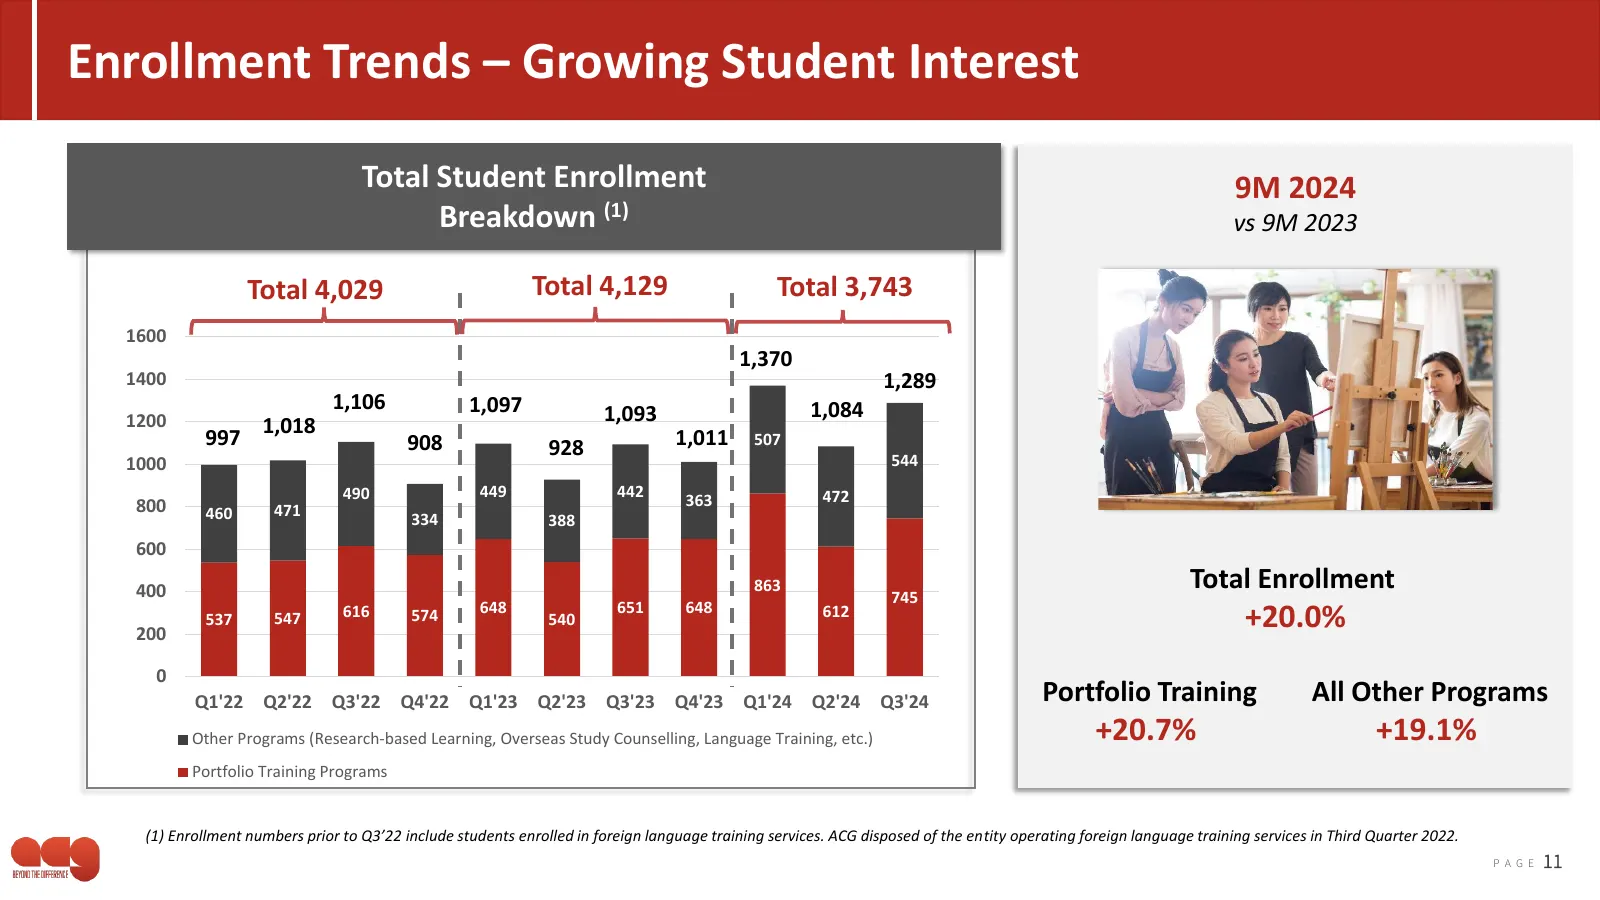
Slide 11: Enrollment Trends – Growing Student Interest
Enrollment Trends – Growing Student Interest Total Student Enrollment 9M 2024 Breakdown (1) vs 9M 2023 Total 4,029 Total 4,129 Total 3,743 1600 1,370 1400 1,289 1,106 1,097 1,084 1200 1,093 1,018 997 908 928 1,011 507 1000 544 490 449 442 472 800 363 460 471 334 388 600 400 863 Total Enrollment 745
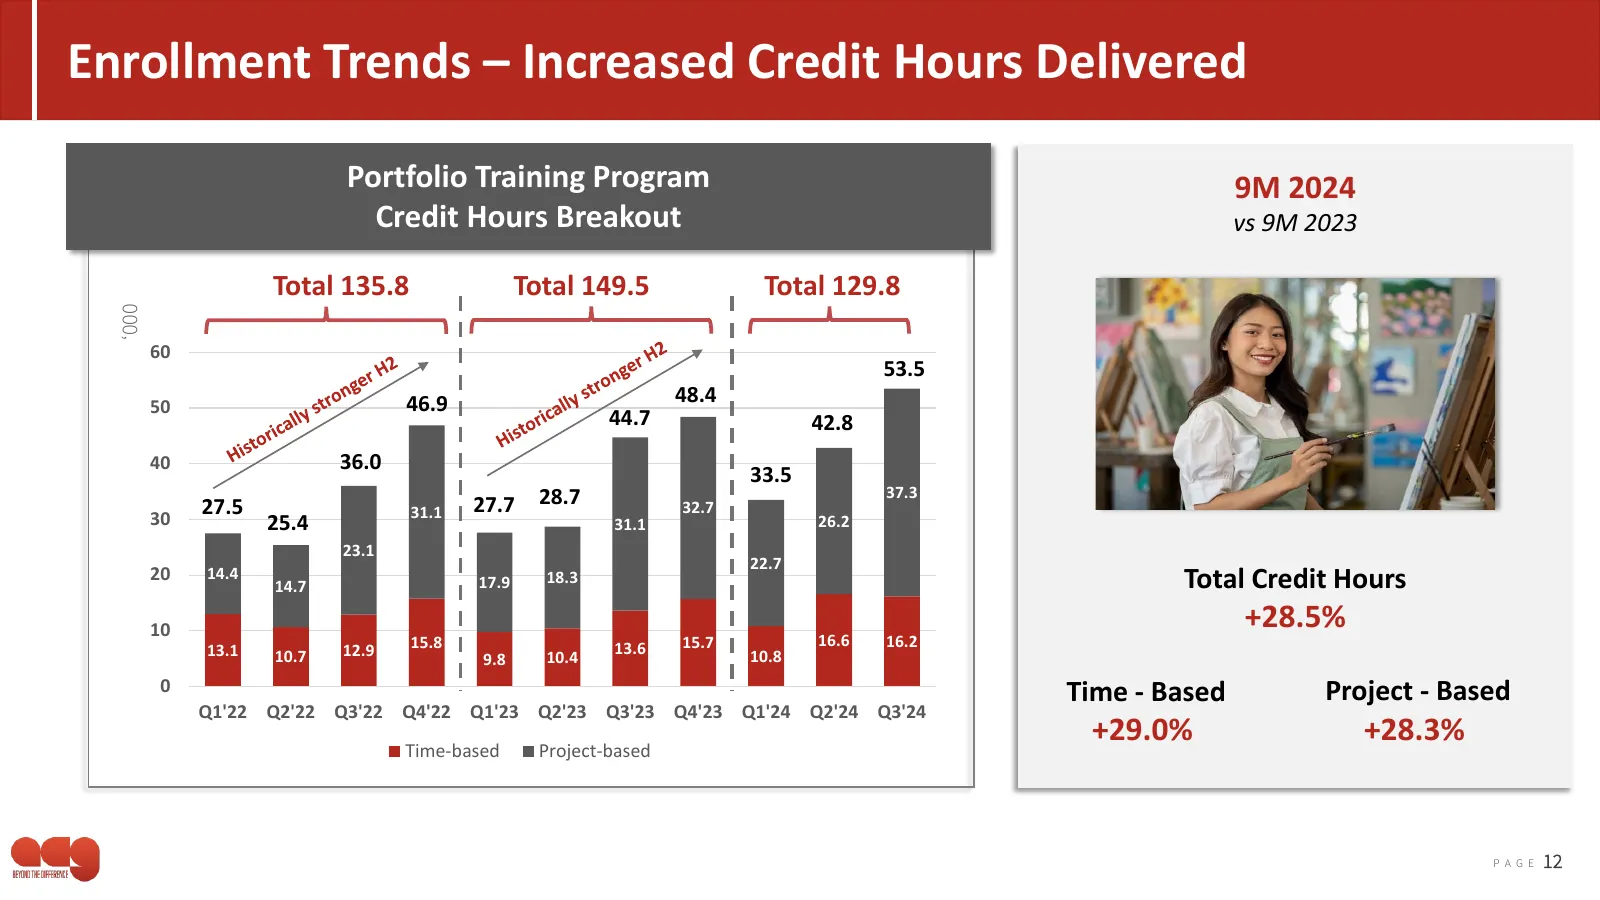
Slide 12: Enrollment Trends – Increased Credit Hours Delivered
Enrollment Trends – Increased Credit Hours Delivered Portfolio Training Program 9M 2024 Credit Hours Breakout vs 9M 2023 Total 135.8 Total 149.5 Total 129.8 ‘000 60 53.5 50 46.9 48.4 44.7 42.8 40 36.0 33.5 28.7 37.3 27.5 31.1 27.7 32.7 30 25.4 31.1 26.2 23.1 22.7 20 14.4 17.9 18.3 Total Credit Hours
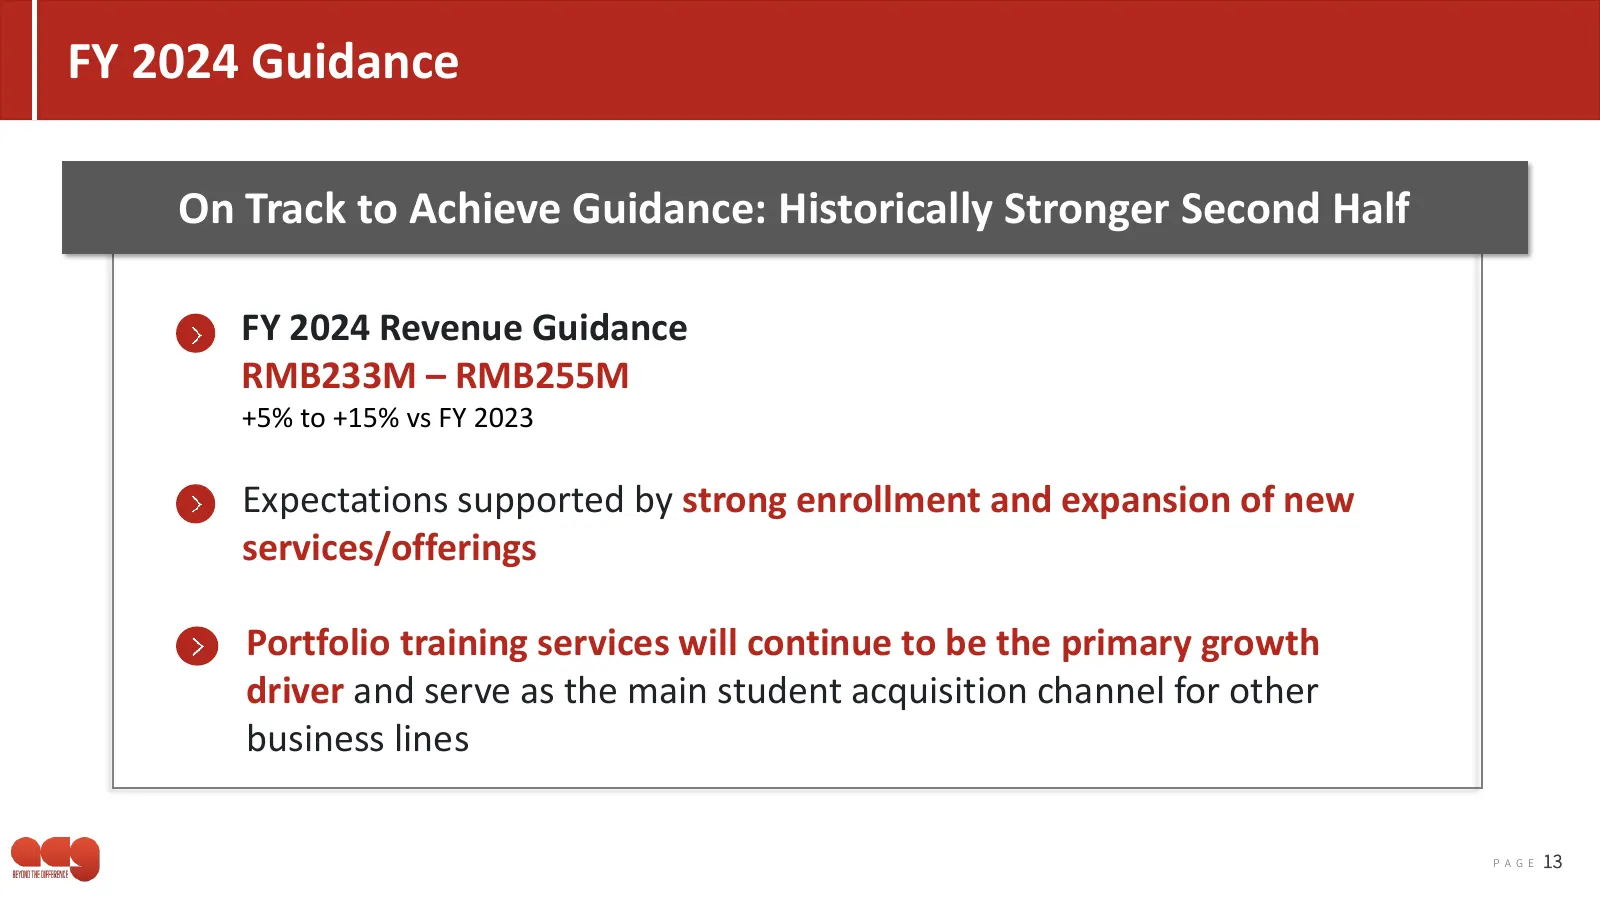
Slide 13: FY 2024 Guidance
FY 2024 Guidance On Track to Achieve Guidance: Historically Stronger Second Half FY 2024 Revenue Guidance RMB233M – RMB255M +5% to +15% vs FY 2023 Expectations supported by strong enrollment and expansion of new services/offerings Portfolio training services will continue to be the primary growth dr
Slide 14: 2025 Growth Strategy
2025 Growth Strategy Jun Zhang President P A G E 14
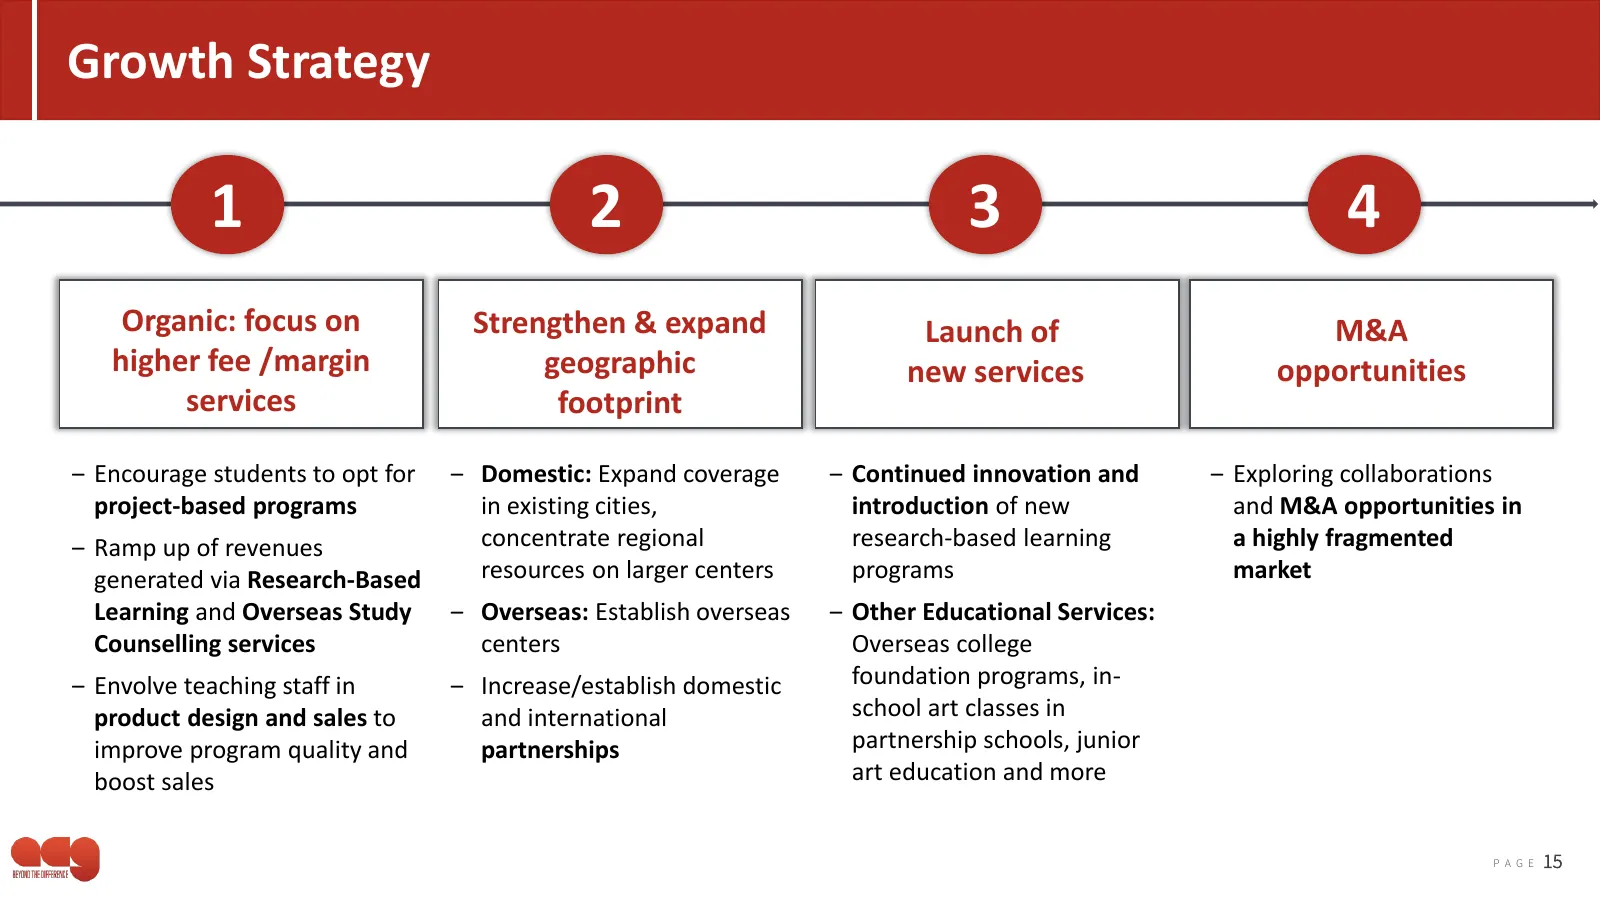
Slide 15: Growth Strategy
Growth Strategy 1 2 3 4 Organic: focus on Strengthen & expand Launch of M&A higher fee /margin geographic new services opportunities services footprint ‒ Encourage students to opt for ‒ Domestic: Expand coverage ‒ Continued innovation and ‒ Exploring collaborations project-based programs in existing
Slide 16: Q&A Session
Q&A Session

Slide 17: Contact Us
Contact Us ATA Creativity Global Ruobai Sima, CFO +86 (10) 6518 1133 x 5518 simaruobai@acgedu.cn Investor Relations Counsel: Lena Cati Alice Zhang (212) 836-9611 (212) 836-9610 lcati@equityny.com azhang@equityny.com
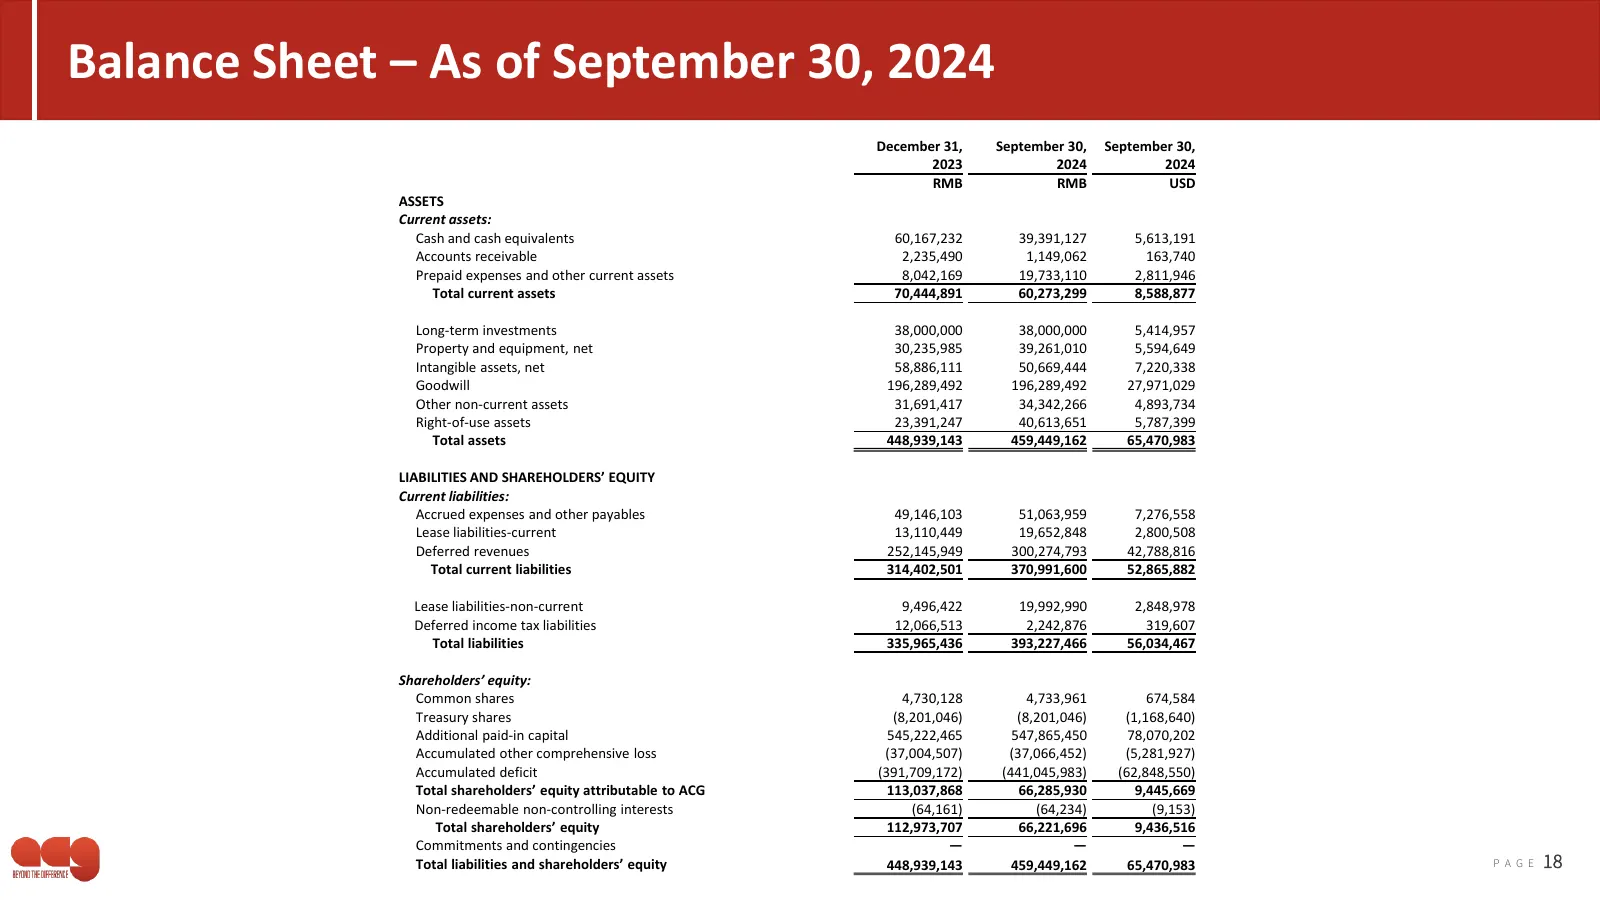
Slide 18: Balance Sheet – As of September 30, 2024
Balance Sheet – As of September 30, 2024 December 31, September 30, September 30, 2023 2024 2024 RMB RMB USD ASSETS Current assets: Cash and cash equivalents 60,167,232 39,391,127 5,613,191 Accounts receivable 2,235,490 1,149,062 163,740 Prepaid expenses and other current assets 8,042,169 19,733,110
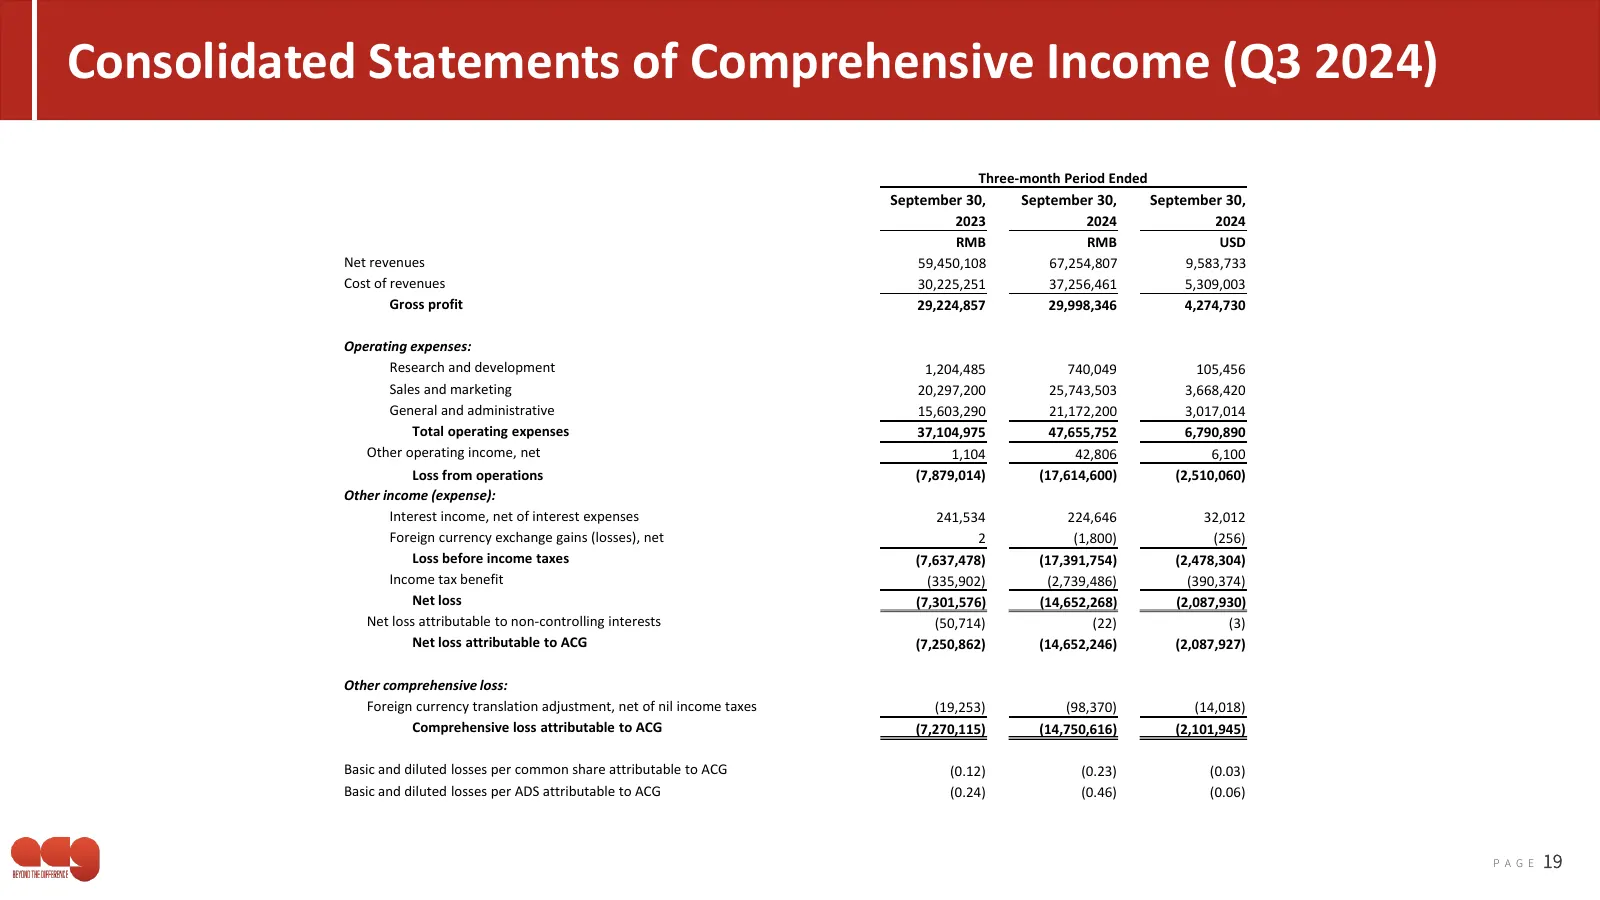
Slide 19: Consolidated Statements of Comprehensive Income (Q3 2024)
Consolidated Statements of Comprehensive Income (Q3 2024) Three-month Period Ended September 30, September 30, September 30, 2023 2024 2024 RMB RMB USD Net revenues 59,450,108 67,254,807 9,583,733 Cost of revenues 30,225,251 37,256,461 5,309,003 Gross profit 29,224,857 29,998,346 4,274,730 Operating
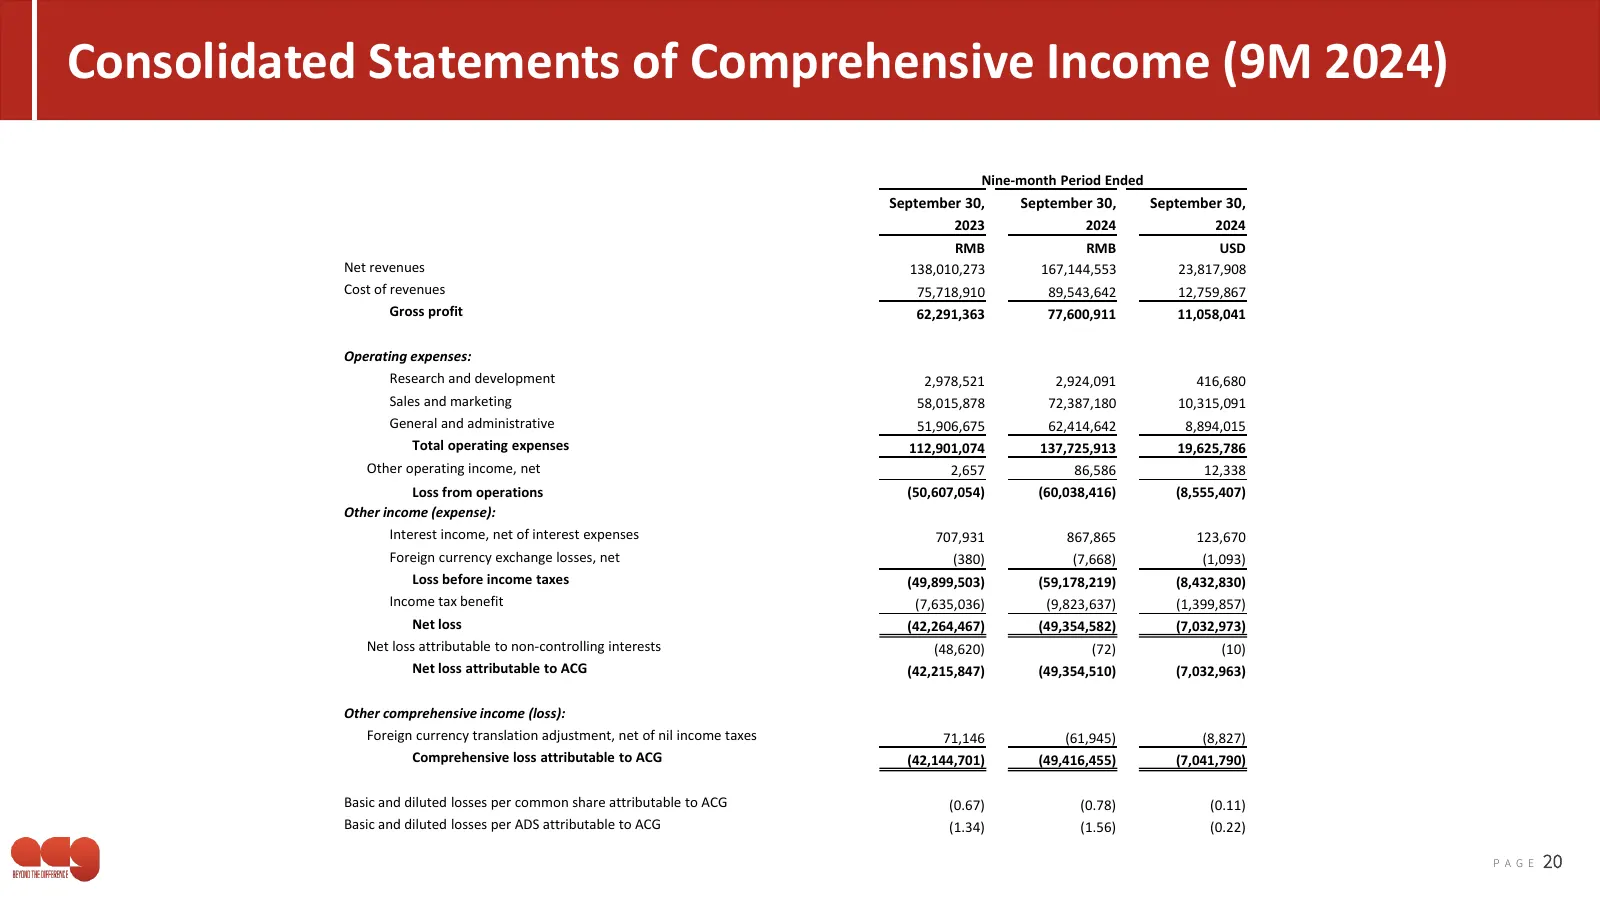
Slide 20: Consolidated Statements of Comprehensive Income (9M 2024)
Consolidated Statements of Comprehensive Income (9M 2024) Nine-month Period Ended September 30, September 30, September 30, 2023 2024 2024 RMB RMB USD Net revenues 138,010,273 167,144,553 23,817,908 Cost of revenues 75,718,910 89,543,642 12,759,867 Gross profit 62,291,363 77,600,911 11,058,041 Opera
Source: EarningsCall slides
More decks from ATA Creativity Global
 Investor Presentation (April 2026)28 slides · April 2026
 Q4 2025 Earnings Presentation20 slides · Mar 25, 2026
 Q2 2025 Earnings Presentation19 slides · Aug 6, 2025
 Q1 2025 Earnings Presentation17 slides · May 16, 2025
 Q4 2024 Earnings Presentation20 slides · Mar 25, 2025
 Q2 2024 Earnings Presentation14 slides · Aug 7, 2024