Colonial Properties Trust — NAREIT Annual Convention November 2007
27 slides from Colonial Properties Trust's conference presentation, Nov 14, 2007
Slide 1: NAREIT Annual Convention November 2007
NAREIT Annual Convention November 2007
Slide 2: Company Profile
Company Profile * Colonial Properties Trust (NYSE:CLP) = Multifamily focused REIT with commercial management, leasing and development capabilities in high-growth Sunbelt markets = 38,030 multifamily units in 127 multifamily communities = Average age of 14 years CLP = 95.3% occupied as of September 3
Slide 3: Premier Sunbelt Multifamily Platform
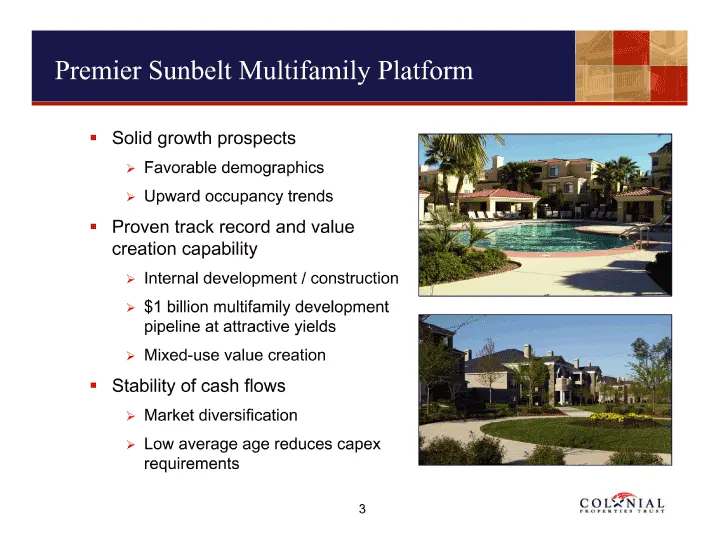
Premier Sunbelt Multifamily Platform Solid growth prospects Favorable demographics Upward occupancy trends Proven track record and valuecreation capability Internal development / construction $1 billion multifamily developmentpipeline at attractive yields Mixed-use value creation Stability of cash f
Slide 4: Premier Sunbelt Multifamily Platform
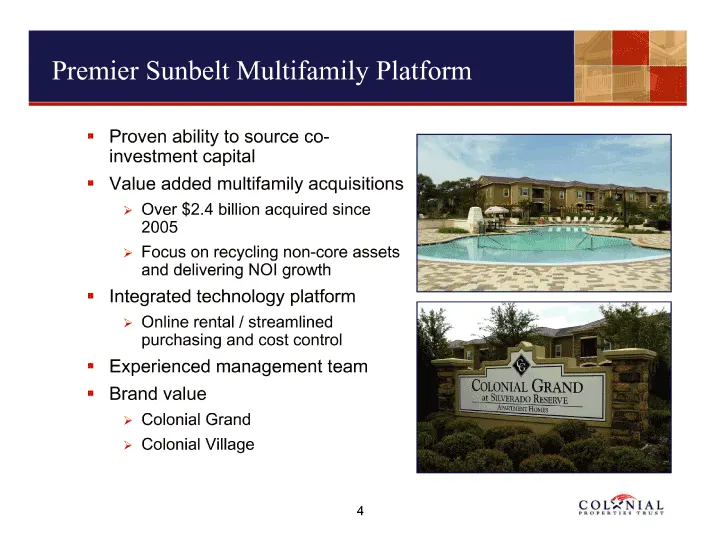
Premier Sunbelt Multifamily Platform Proven ability to source co-investment capital Value added multifamily acquisitions Over $2.4 billion acquired since 2005 Focus on recycling non-core assets and delivering NOI growth Integrated technology platform Online rental / streamlined purchasing and cost c
Slide 5: High Quality Portfolio — Colonial Grand Properties
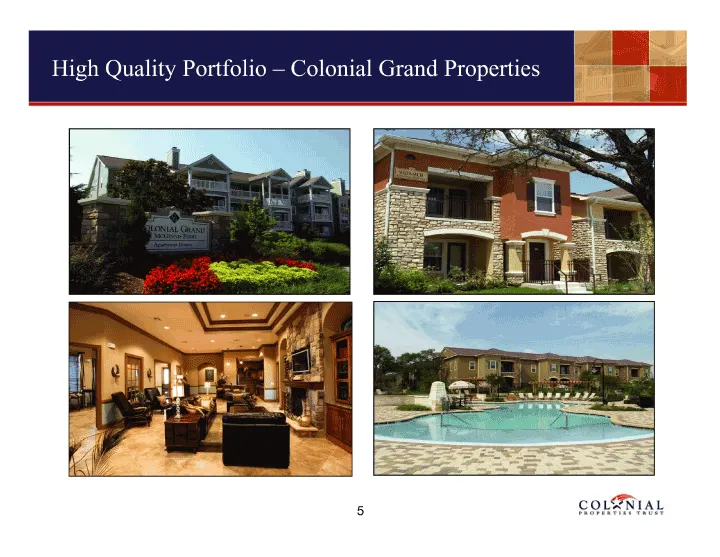
High Quality Portfolio — Colonial Grand Properties
Slide 6: High Quality Portfolio — Colonial Village Properties
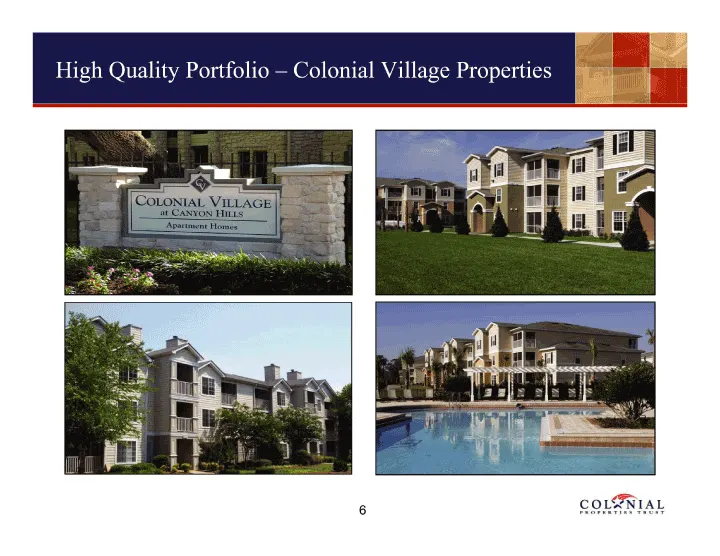
High Quality Portfolio — Colonial Village Properties
Slide 7: Geographic Diversification
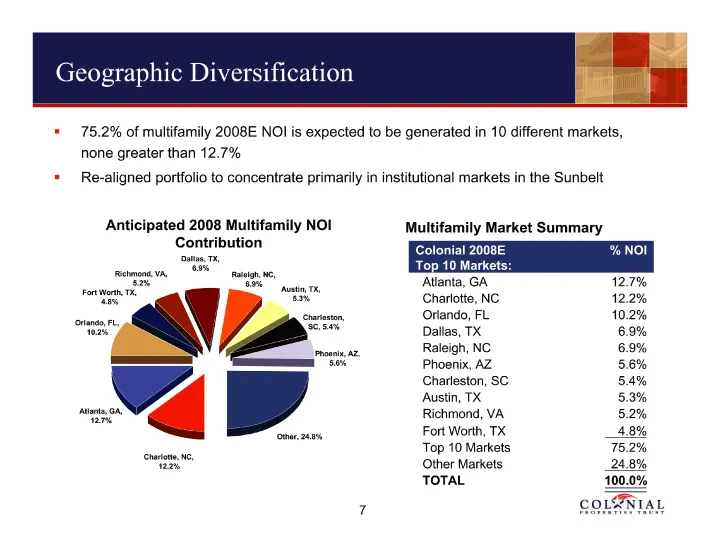
Geographic Diversification 75.2% of multifamily 2008E NOI is expected to be generated in 10 different markets,none greater than 12.7% Re-aligned portfolio to concentrate primarily in institutional markets in the Sunbelt Anticipated 2008 Multifamily NOIMultifamily Market SummaryContributionColonial 2
Slide 8: Operational Performance
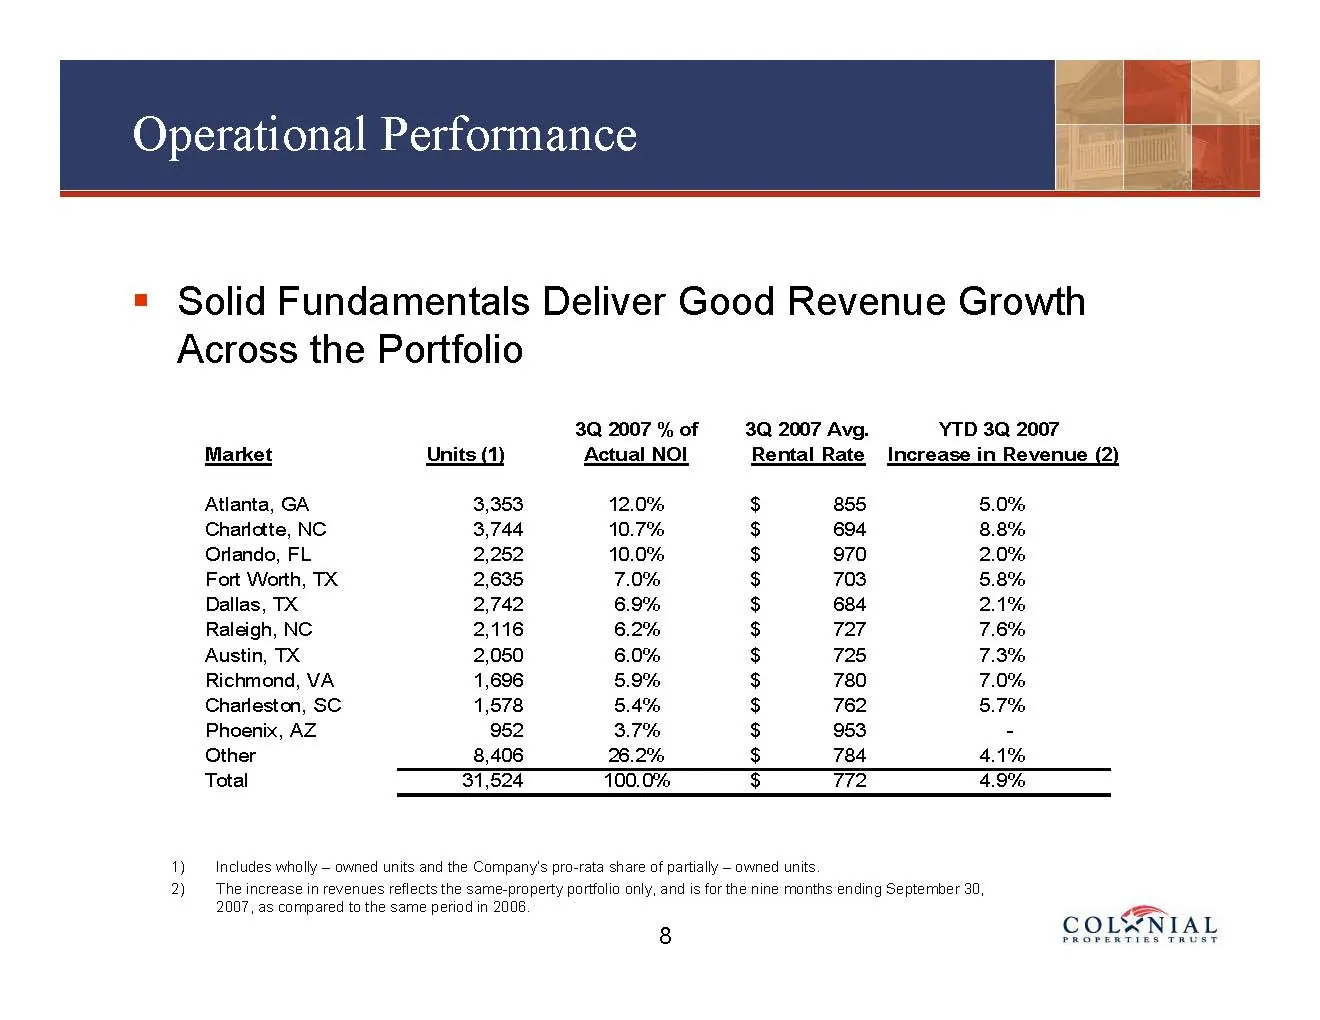
Operational Performance = Solid Fundamentals Deliver Good Revenue Growth Across the Portfolio 3Q 2007 % of 3Q 2007 Avg. YTD 3Q 2007 Market Units (1) Actual NOI Rental Rate Increase in Revenue (2) Atlanta, GA 3,353 12.0% $ 855 5.0% Charictte, NC 3,744 10.7% $ 694 8.8% Orlando, FL 2,252 10.0% $ 970 2.
Slide 9: Operational Performance
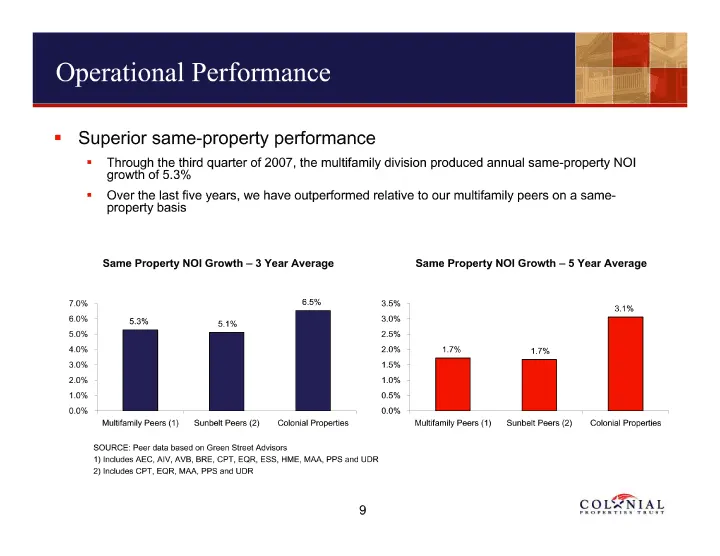
Operational Performance Superior same-property performance Through the third quarter of 2007, the multifamily division produced annual same-property NOI growth of 5.3% Over the last five years, we have outperformed relative to our multifamily peers on a same-property basis Same Property NOI Growth —
Slide 10: Operational Performance as September 30, 2007
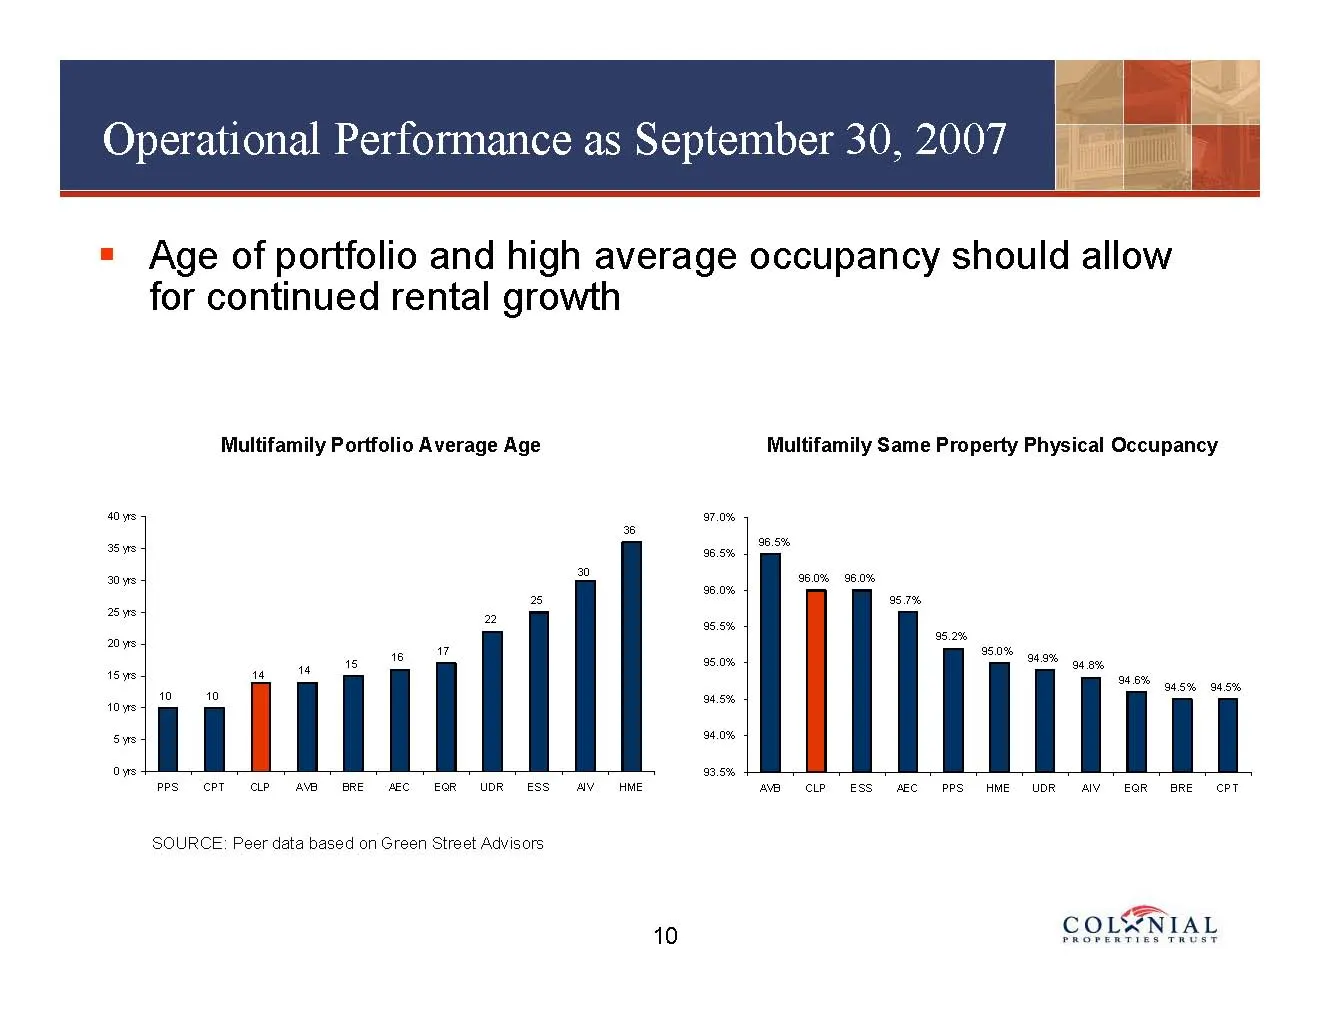
Operational Performance as September 30, 2007
Slide 11: Revenue Enhancement Initiatives
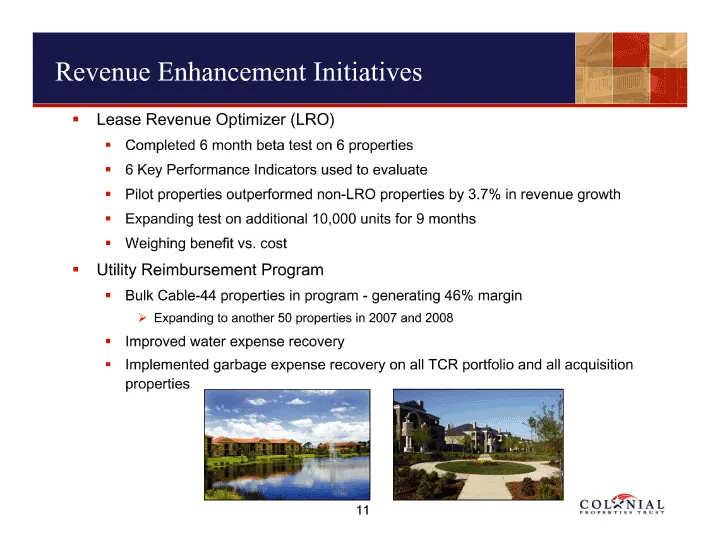
Revenue Enhancement Initiatives Lease Revenue Optimizer (LRO) Completed 6 month beta test on 6 properties 6 Key Performance Indicators used to evaluate Pilot properties outperformed non-LRO properties by 3.7% in revenue growth Expanding test on additional 10,000 units for 9 months Weighing benefit v
Slide 12: Technology Initiatives
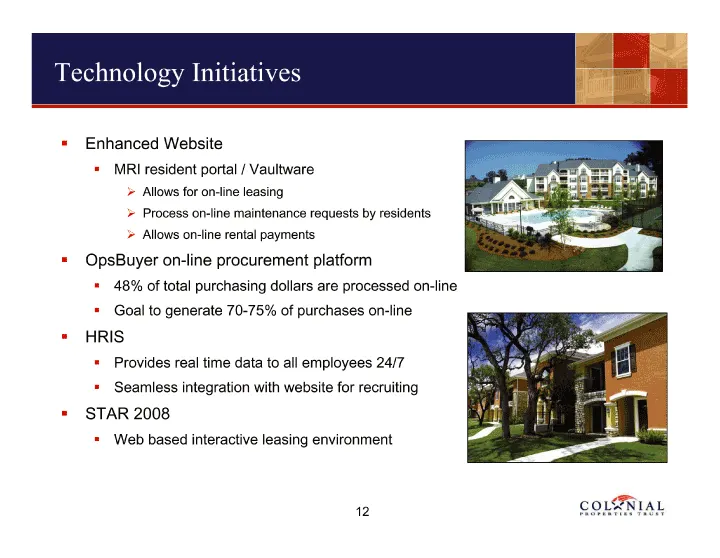
Technology Initiatives Enhanced Website MRI resident portal / Vaultware Allows for on-line leasing Process on-line maintenance requests by residents Allows on-line rental payments OpsBuyer on-line procurement platform 48% of total purchasing dollars are processed on-line Goal to generate 70-75% of p
Slide 13: Multifamily Development Pipeline
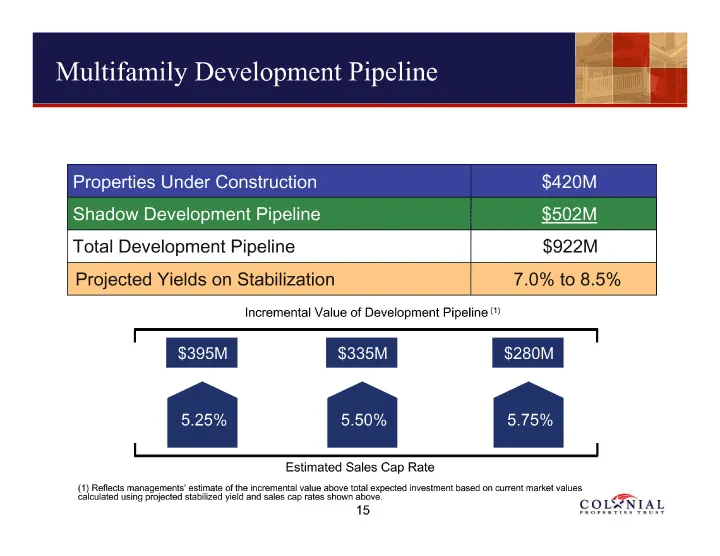
Multifamily Development PipelineProperties Under Construction$420MShadow Development Pipeline$502MTotal Development Pipeline$922MProjected Yields on Stabilization7.0% to 8.5%Incremental Value of Development Pipeline (1)$395M $335M$280M5.25% 5.50%5.75%Estimated Sales Cap Rate(1) Reflects managements’
Slide 14: Development Pipeline — Under Construction
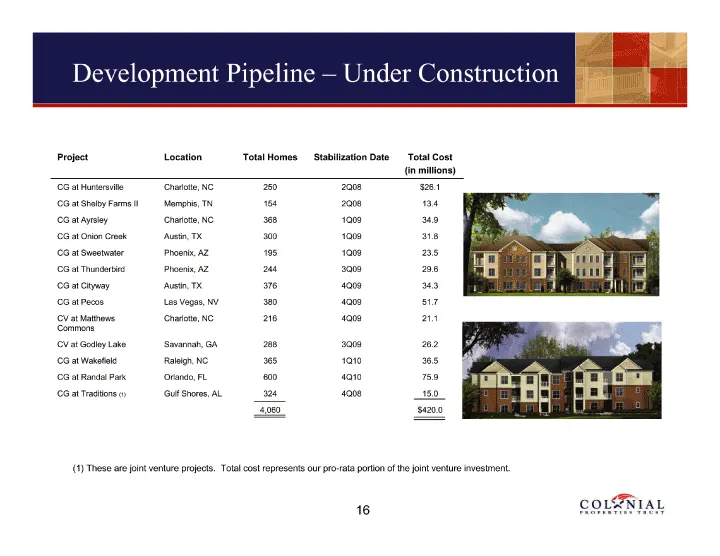
Development Pipeline — Under Construction ProjectLocationTotal Homes Stabilization DateTotal Cost (in millions) CG at HuntersvilleCharlotte, NC2502Q08$26.1 CG at Shelby Farms IIMemphis, TN1542Q0813.4 CG at AyrsleyCharlotte, NC3681Q0934.9 CG at Onion CreekAustin, TX3001Q0931.8 CG at SweetwaterPhoenix
Slide 15: Mixed-Use / Commercial Expertise
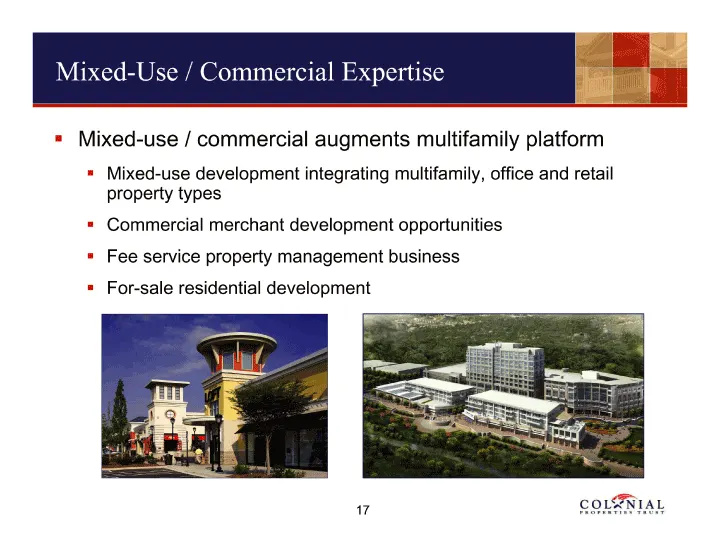
Mixed-Use / Commercial Expertise Mixed-use / commercial augments multifamily platform Mixed-use development integrating multifamily, office and retail property types Commercial merchant development opportunities Fee service property management business For-sale residential development
Slide 16: Mixed-Use / Commercial Expertise — Value Proposition
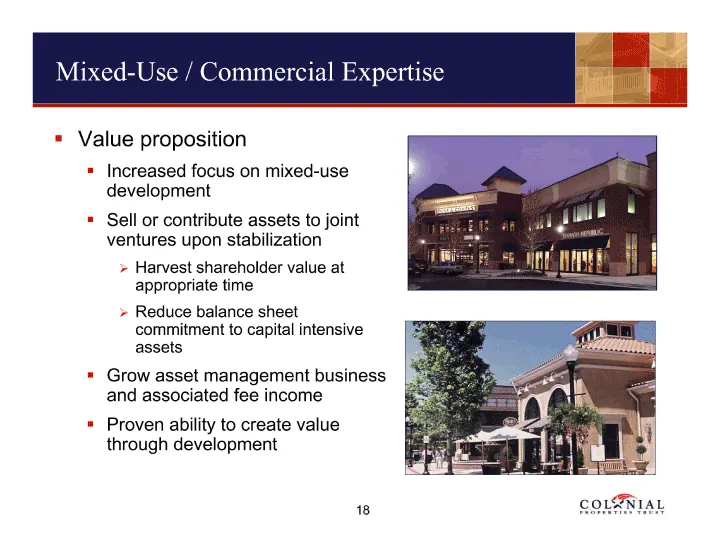
Mixed-Use / Commercial Expertise Value proposition Increased focus on mixed-use development Sell or contribute assets to joint ventures upon stabilization Harvest shareholder value at appropriate time Reduce balance sheet commitment to capital intensive assets Grow asset management business and asso
Slide 17: National Developer of the Year
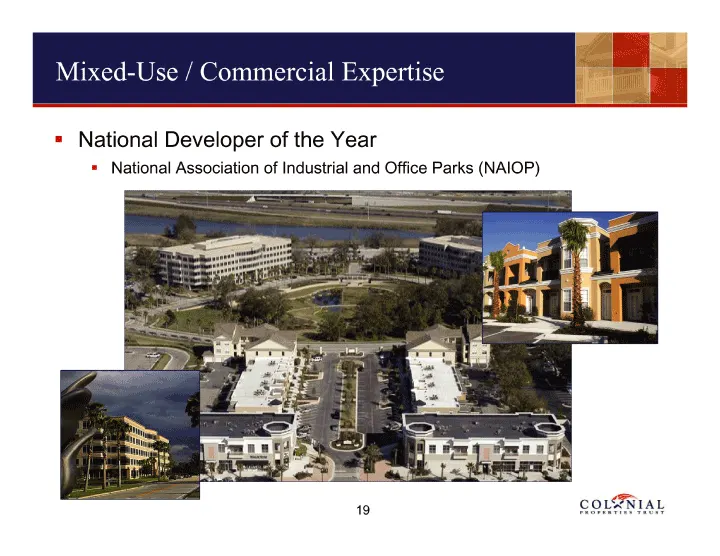
Mixed-Use / Commercial Expertise National Developer of the Year National Association of Industrial and Office Parks (NAIOP)
Slide 18: Mixed-Use / Commercial Expertise
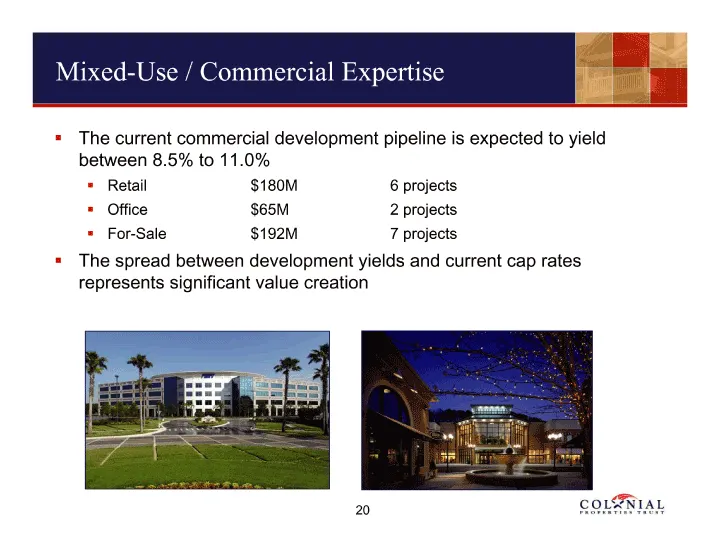
Mixed-Use / Commercial Expertise The current commercial development pipeline is expected to yield between 8.5% to 11.0% Retail $180M6 projects Office $65M2 projects For-Sale$192M7 projects The spread between development yields and current cap rates represents significant value creation
Slide 19: Commercial Development Project
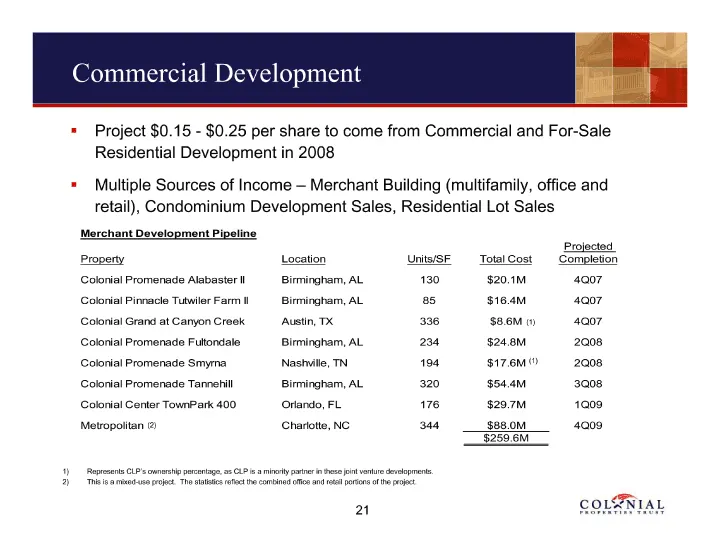
Commercial Development Project $0.15 -$0.25 per share to come from Commercial and For-SaleResidential Development in 2008 Multiple Sources of Income -Merchant Building (multifamily, office andretail), Condominium Development Sales, Residential Lot Sales Merchant Development Pipeline Projected Proper
Slide 20: For-Sale Residential Activities
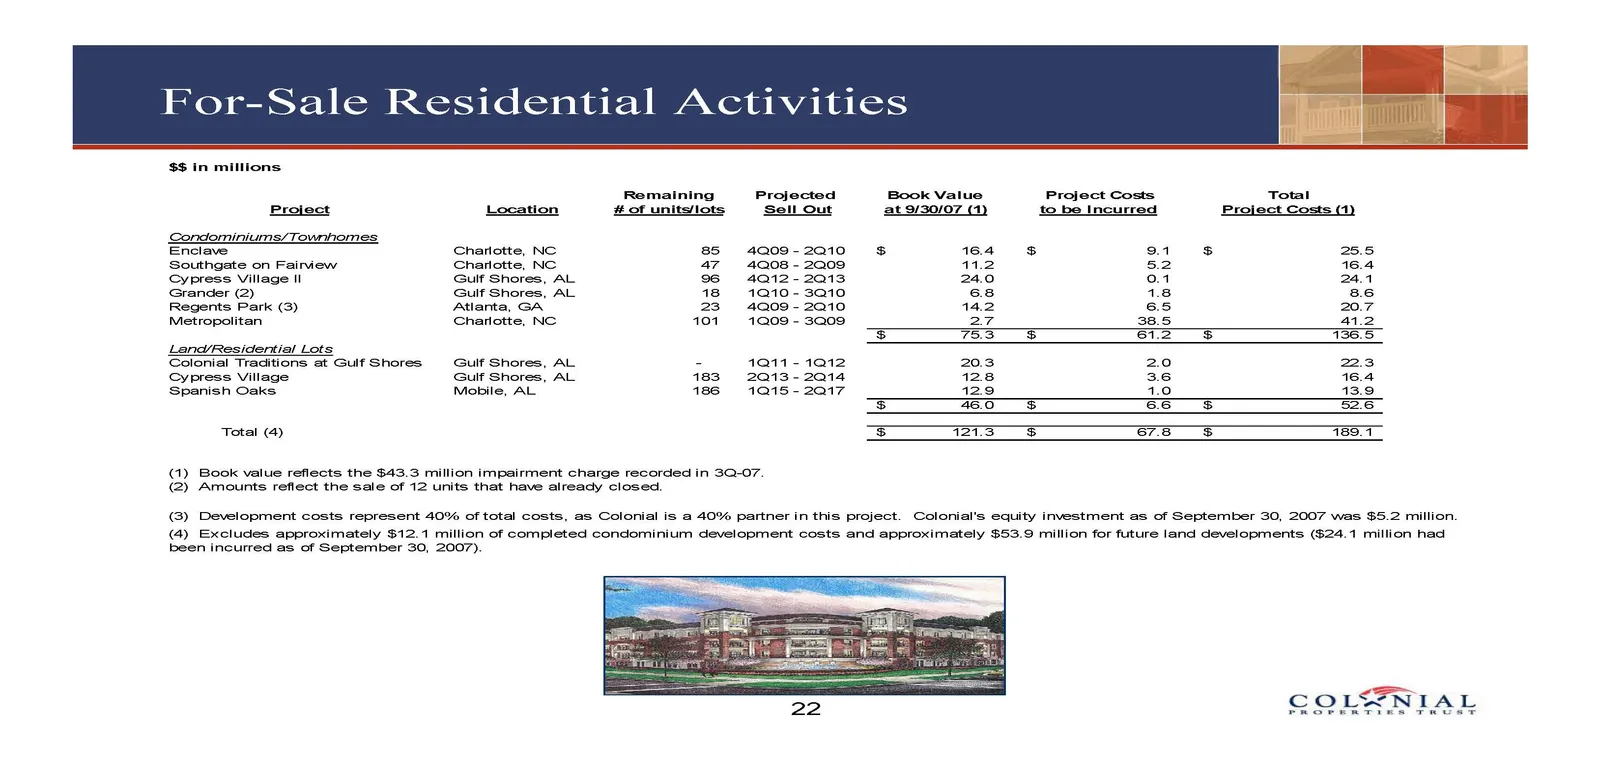
For-Sale Residential Activities
Slide 21: Joint Venture Relationships
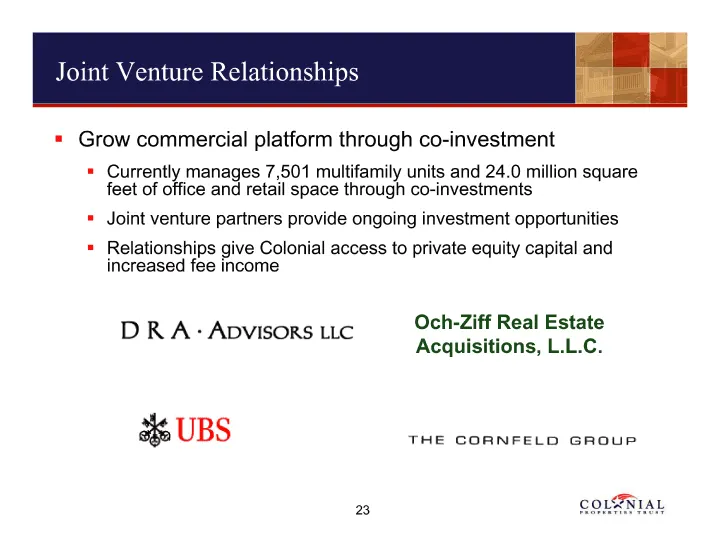
Joint Venture Relationships Grow commercial platform through co-investment Currently manages 7,501 multifamily units and 24.0 million square feet of office and retail space through co-investments Joint venture partners provide ongoing investment opportunities Relationships give Colonial access to pr
Slide 22: Financial Highlights — Pro Forma Net Asset Valuation
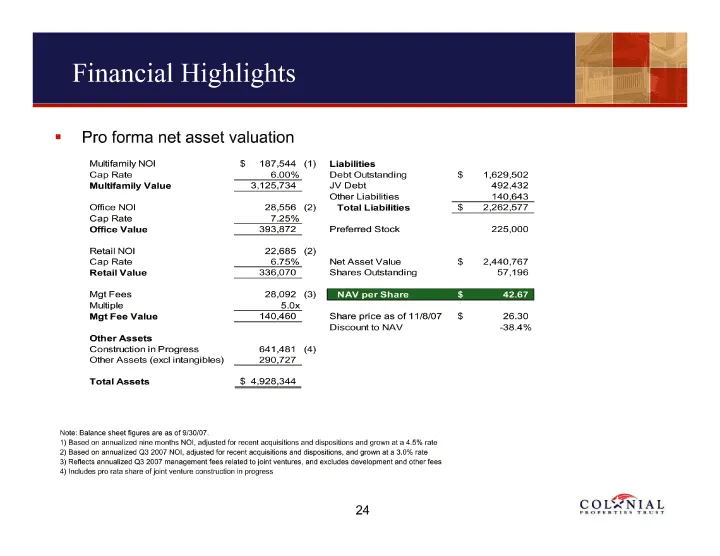
Financial Highlights Pro forma net asset valuation Multifamily NOI$ 187,544 (1) Liabilities Cap Rate6.00%Debt Outstanding$ 1,629,502 Multifamily Value 3,125,734JV Debt 492,432 Other Liabilities 140,643 Office NOI 28,556 (2) Total Liabilities $ 2,262,577 Cap Rate7.25% Office Value 393,872Preferred St
Slide 23: Financial Highlights
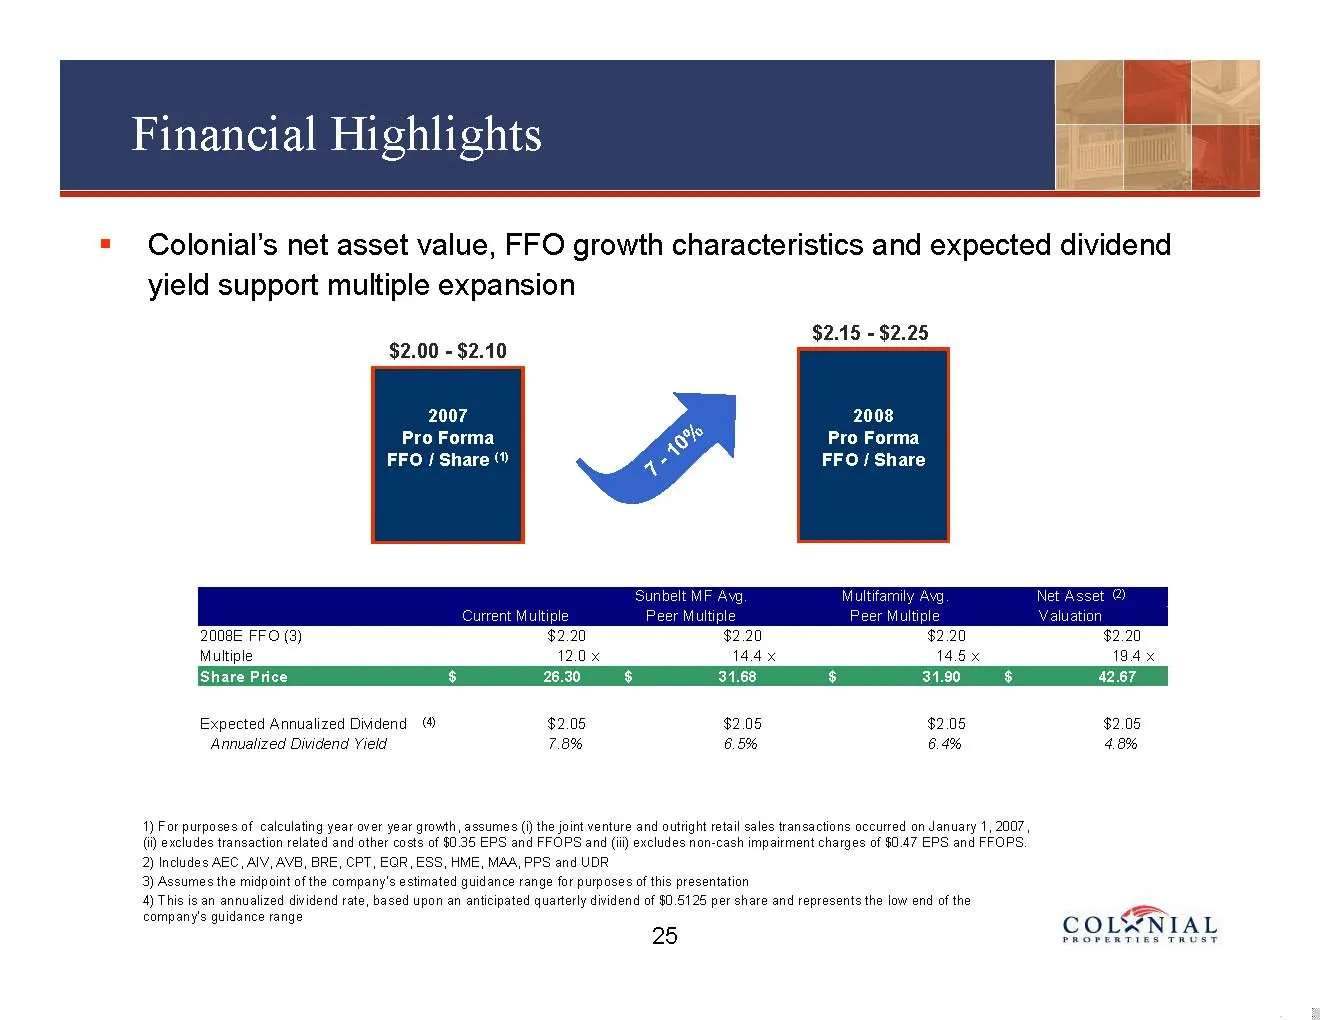
Financial Highlights = Colonial’s net asset value, FFO growth characteristics and expected dividend yield support multiple expansion $2.15 - $2.25 $2.00 - $2.10 2007 2008 Pro Forma Pro Forma FFO / Share“ FFO/ Share 2008E FFO (3) $2.20 $2.20 $2.20 Multiple 12.0 x 14.4 x 19.4 x Share Price 26.30 31.68
Slide 24: Financial Highlights — Improved Capital Structure
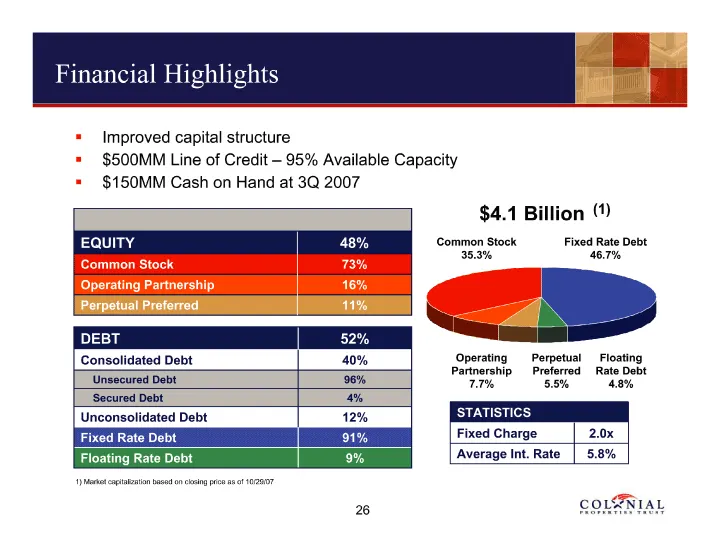
Financial Highlights Improved capital structure $500MM Line of Credit -95% Available Capacity $150MM Cash on Hand at 3Q 2007 $4.1 Billion (1) EQUITY48%Common Stock Fixed Rate Debt 35.3%46.7% Common Stock73% Operating Partnership16% Perpetual Preferred11% DEBT52% Consolidated Debt40%Operating Perpetu
Slide 25: Financial Highlights — Visible Growth Potential
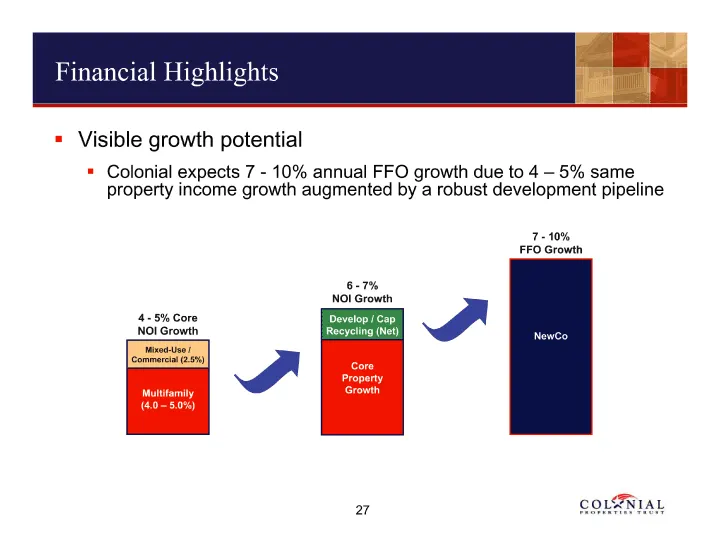
Financial Highlights Visible growth potential Colonial expects 7 -10% annual FFO growth due to 4 -5% same property income growth augmented by a robust development pipeline - 10% FFO Growth 6 — 7% NOI Growth 4 — 5% Core Develop / Cap NOI GrowthRecycling (Net) NewCo Mixed-Use / Commercial (2.5%) Core
Slide 26: Investment Considerations
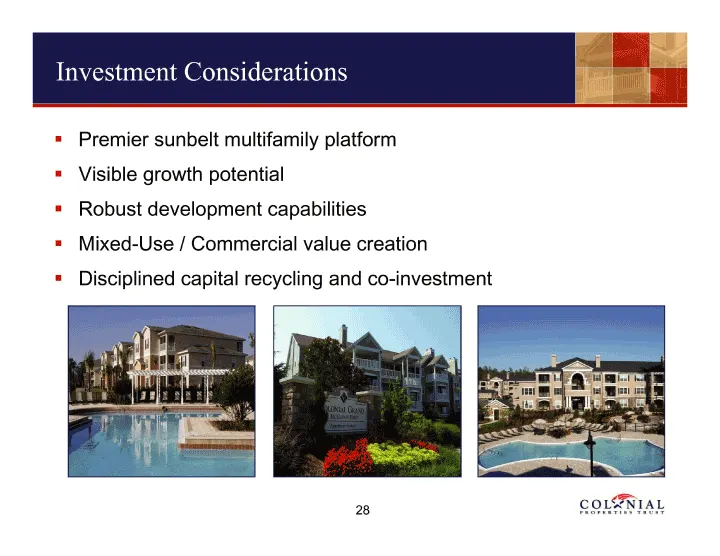
Investment Considerations Premier sunbelt multifamily platform Visible growth potential Robust development capabilities Mixed-Use / Commercial value creation Disciplined capital recycling and co-investment
Slide 27: Reconciliations
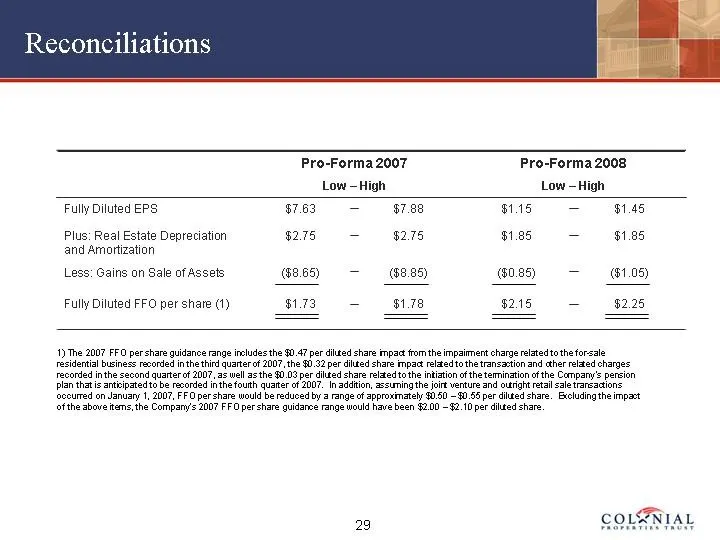
29 Reconciliations 1) The 2007 FFO per share guidance range includes the $0.47 per diluted share impact from the impairment charge related to the for-sale residential business recorded in the third quarter of 2007, the $0.32 per diluted share impact related to the transaction and other related charg
Source: SEC EDGAR · 8-K filed Nov 14, 2007