Colonial Properties Trust — Merger or Acquisition (June 2013)
19 slides from Colonial Properties Trust's merger presentation, Jun 3, 2013

Slide 1: A transformative combination creating the pre-eminent Sunbelt Multifamily REIT
Exhibit 99.2 A transformative combination creating the pre-eminent Sunbelt Multifamily REIT June 2013
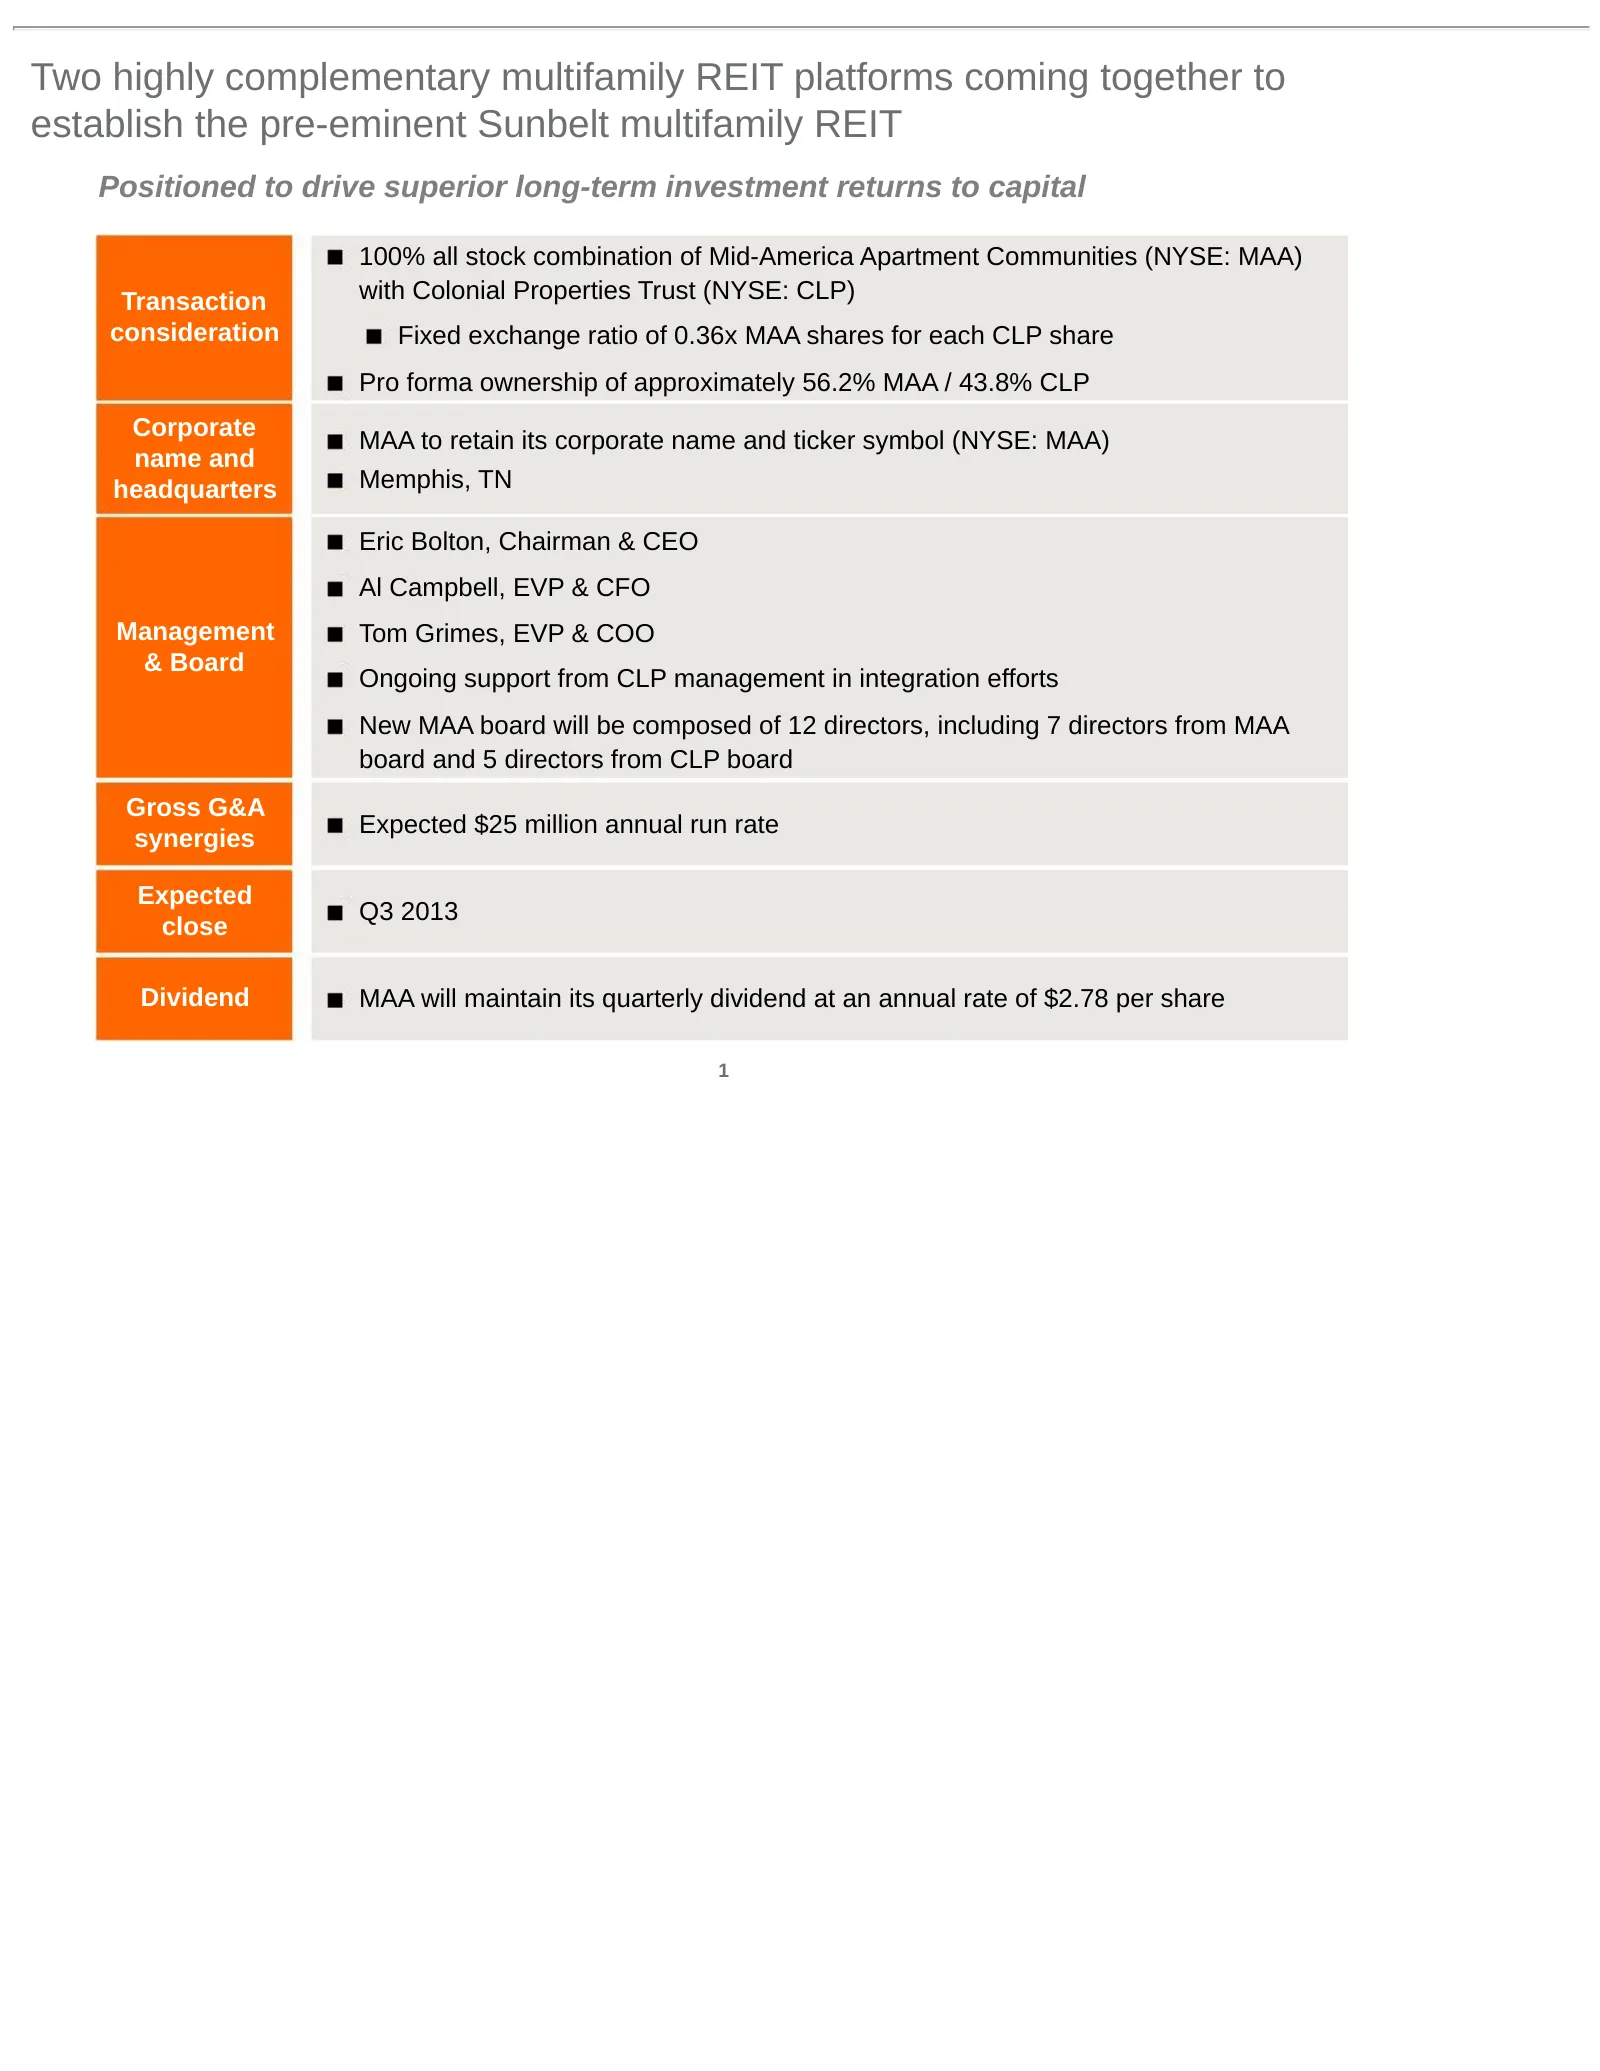
Slide 2: Two highly complementary multifamily REIT platforms coming together
Two highly complementary multifamily REIT platforms coming together to establish the pre-eminent Sunbelt multifamily REIT Positioned to drive superior long-term investment returns to capital 100% all stock combination of Mid-America Apartment Communities (NYSE: MAA) Transaction with Colonial Propert
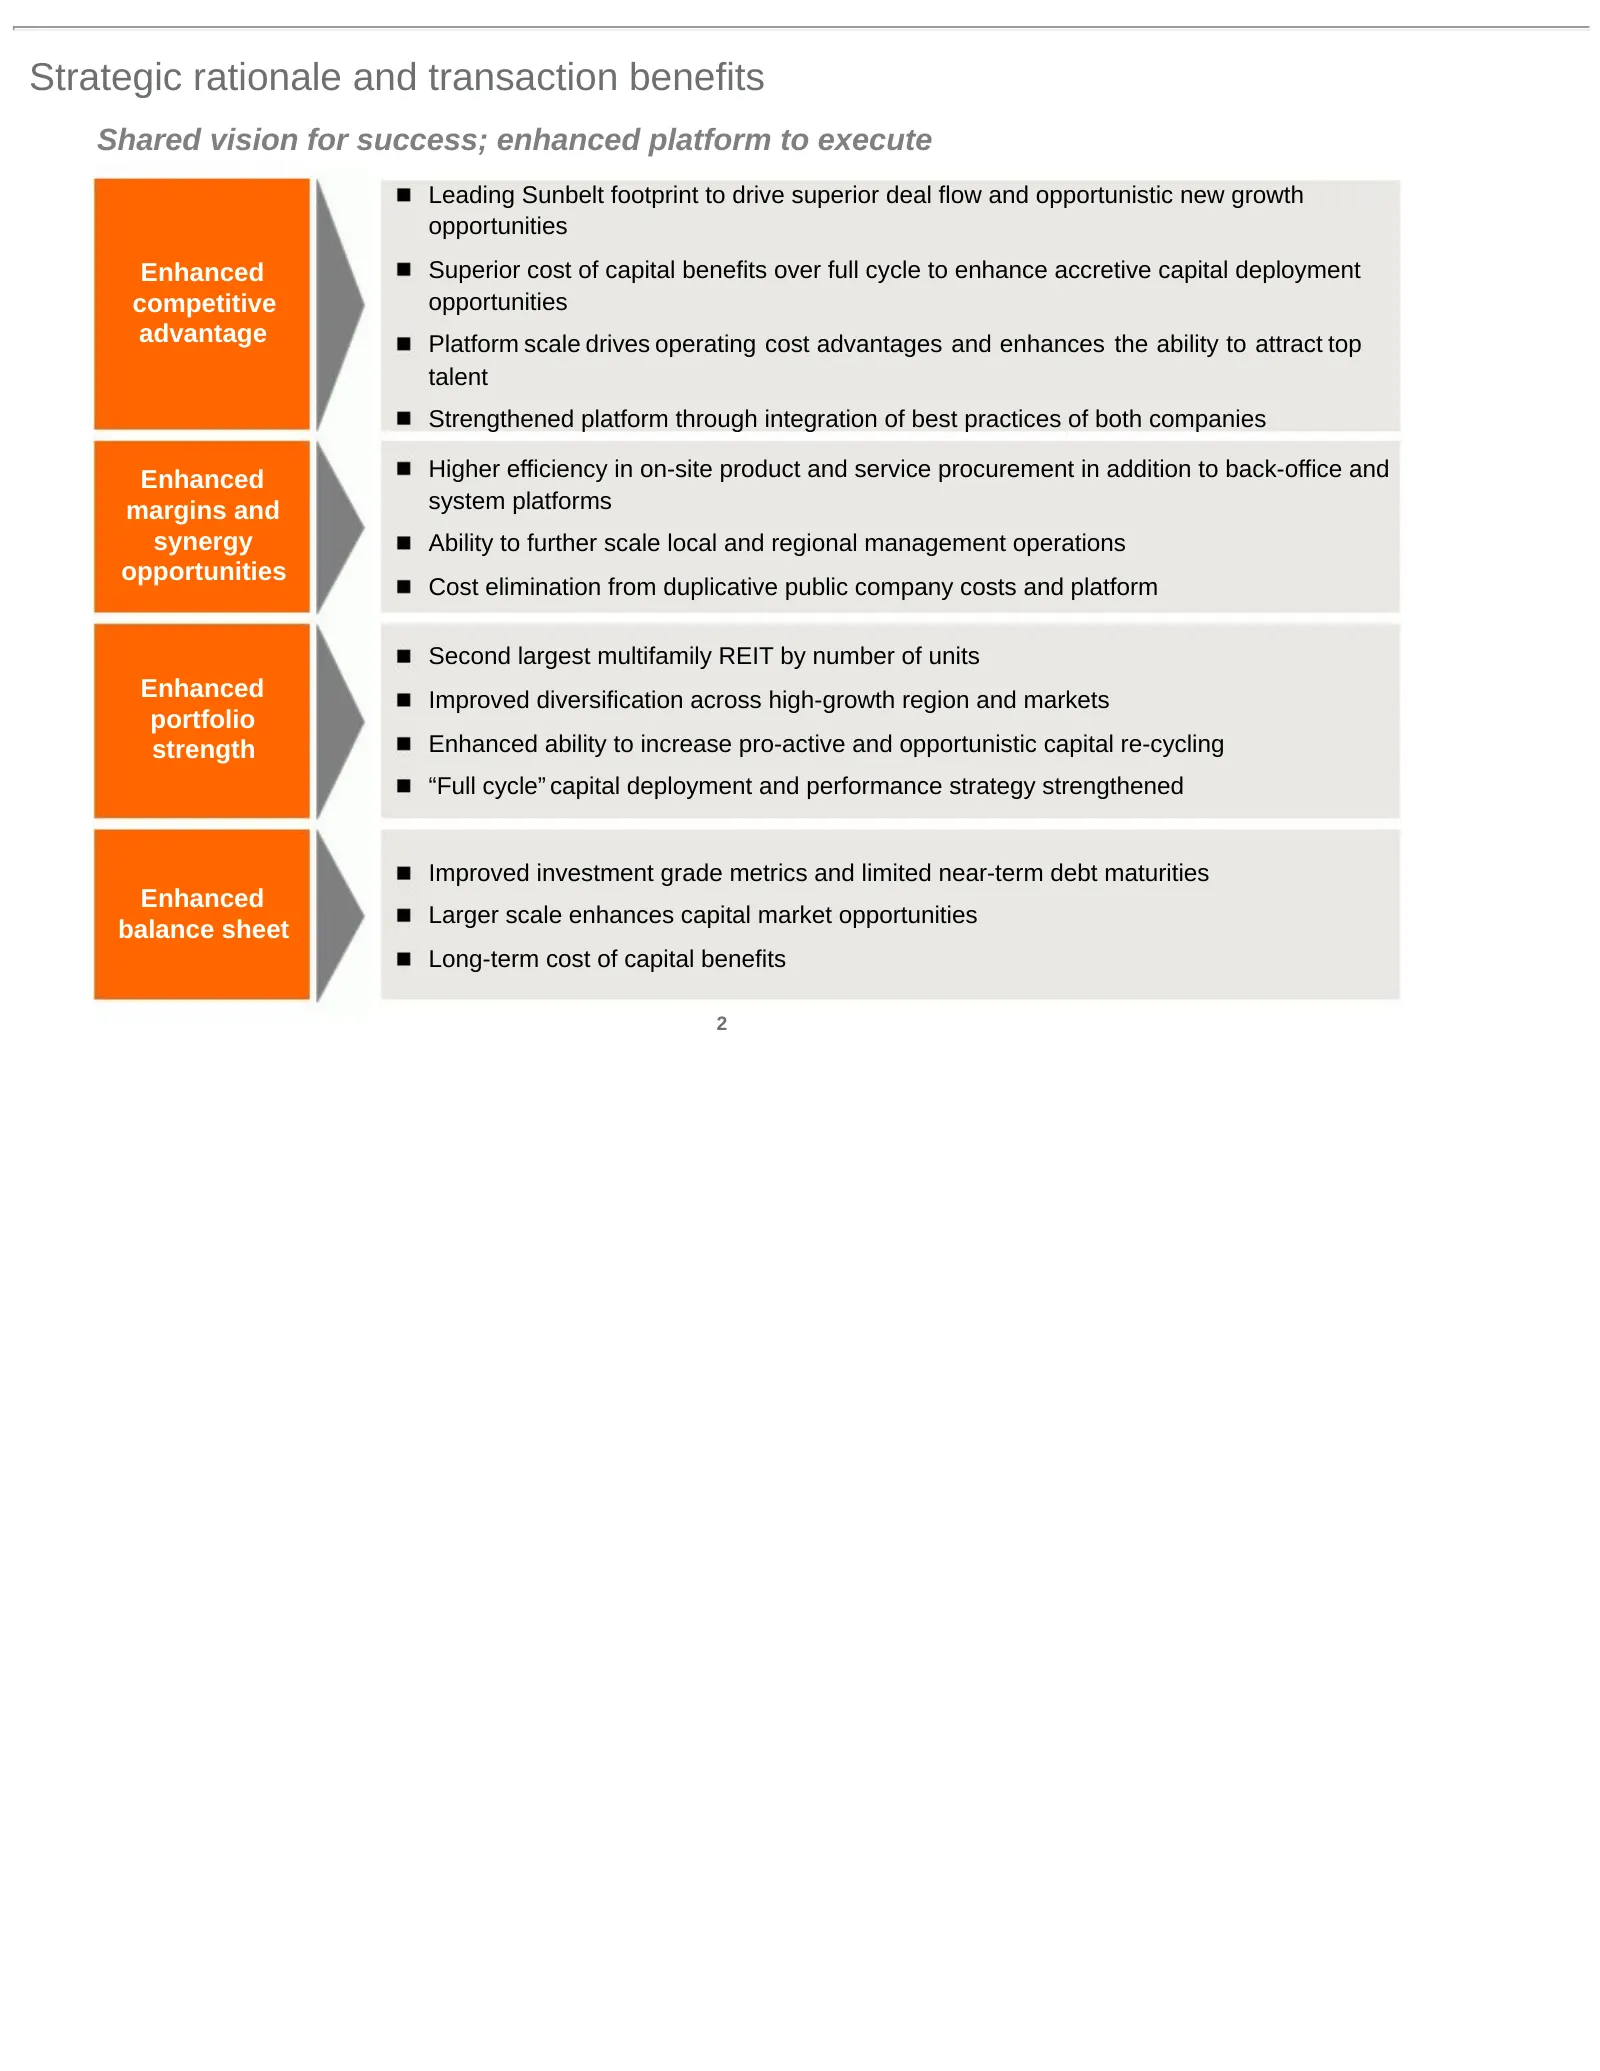
Slide 3: Strategic rationale and transaction benefits
Strategic rationale and transaction benefits Shared vision for success; enhanced platform to execute Leading Sunbelt footprint to drive superior deal flow and opportunistic new growth opportunities Enhanced Superior cost of capital benefits over full cycle to enhance accretive capital deployment com
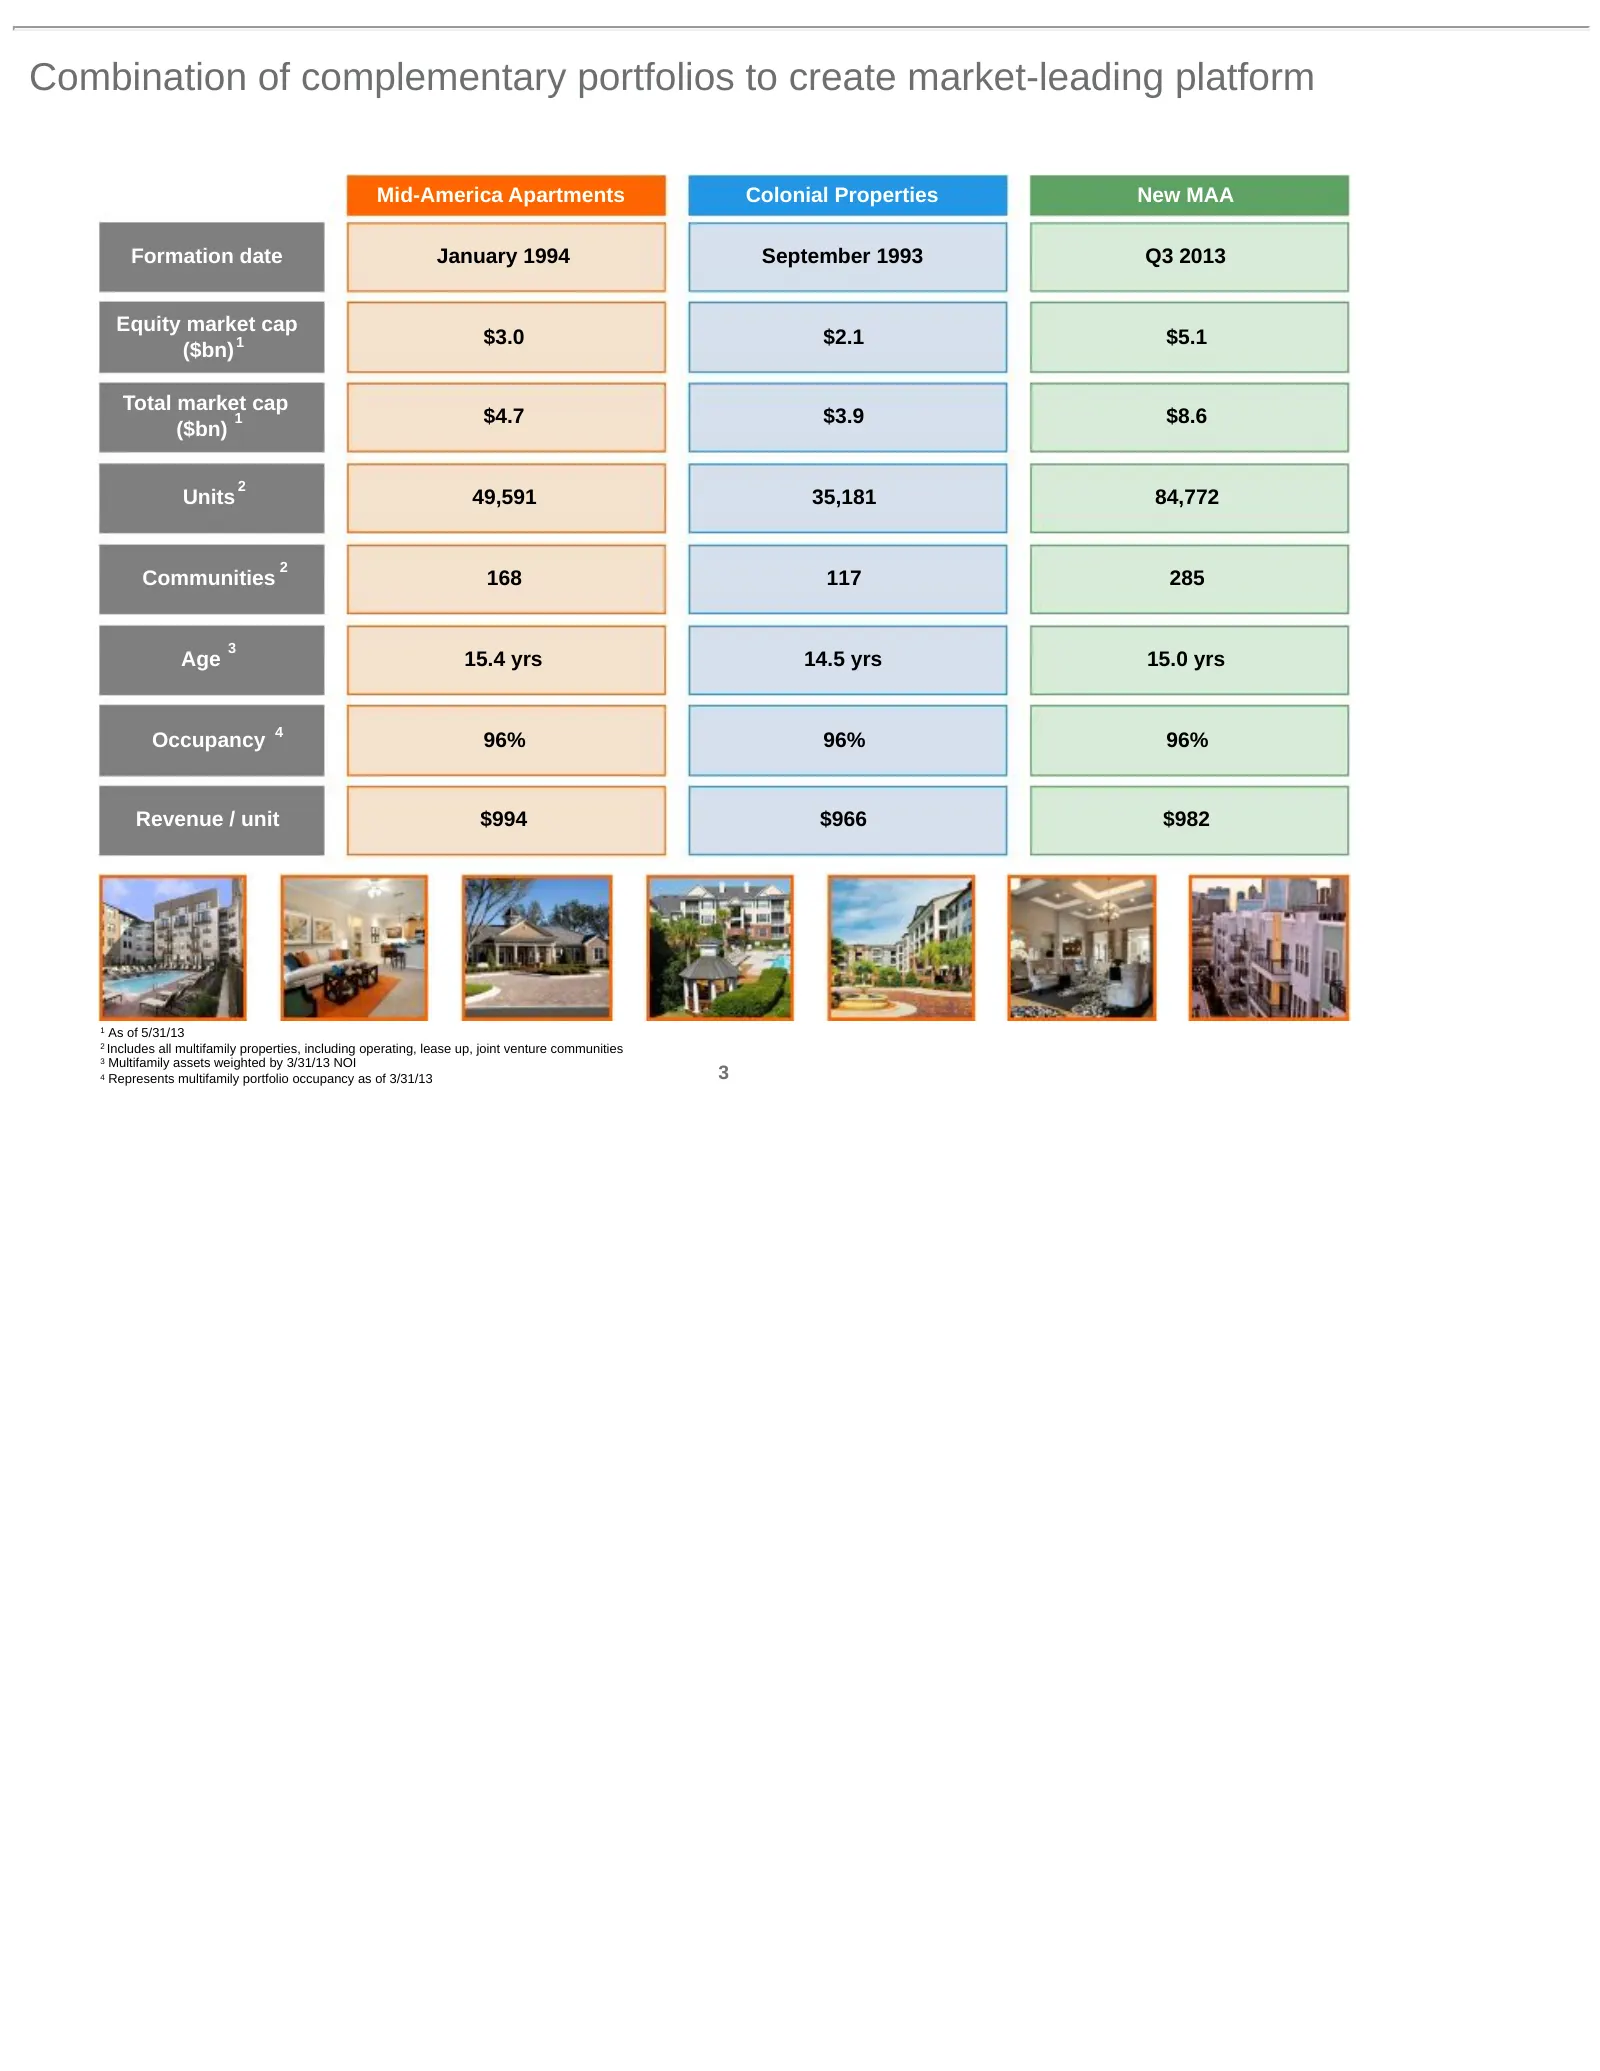
Slide 4: Combination of complementary portfolios to create market-leading platform
Combination of complementary portfolios to create market-leading platform Mid-America Apartments Colonial Properties New MAA Formation date January 1994 September 1993 Q3 2013 Equity market cap $3.0 $2.1 $5.1 ($bn) 1 Total market cap 1 $4.7 $3.9 $8.6 ($bn) 2 Units 49,591 35,181 84,772 2 Communities
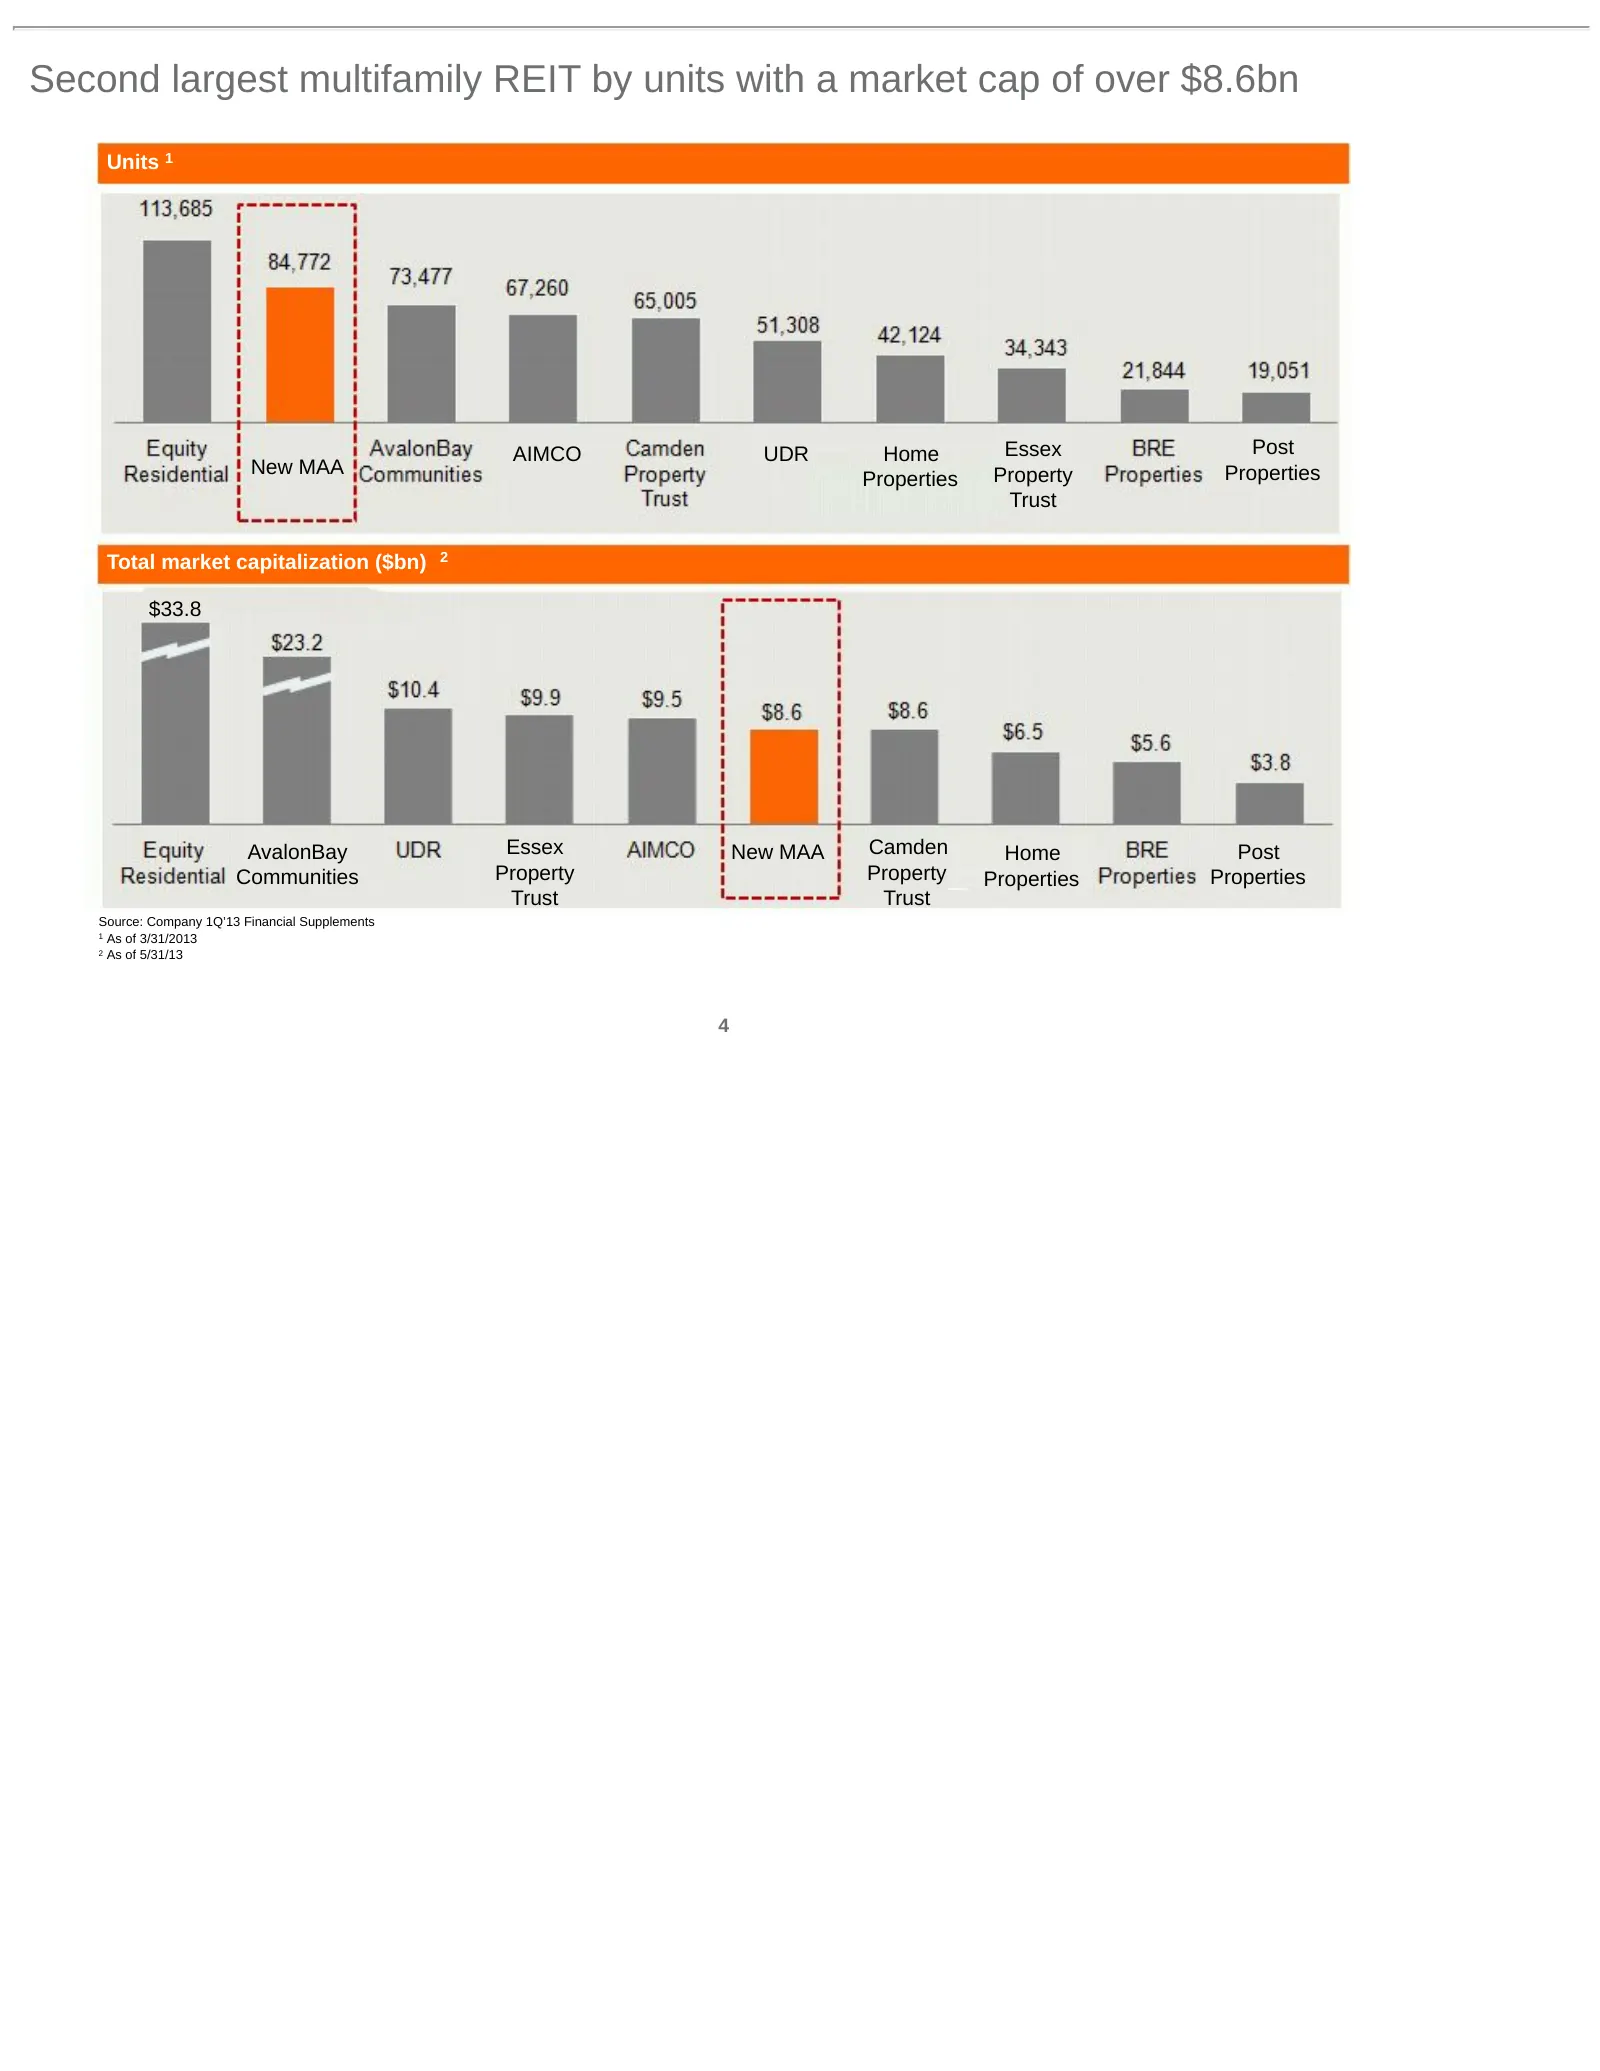
Slide 5: Second largest multifamily REIT by units with a market cap of over $8.6bn
Second largest multifamily REIT by units with a market cap of over $8.6bn Units 1 AIMCO UDR Home Essex Post New MAA Property Properties Properties Trust Total market capitalization ($bn) 2 $33.8 AvalonBay Essex New MAA Camden Home Post Communities Property Property Properties Properties Trust Trust
Slide 6: Enhanced diversification across high-growth Sunbelt region
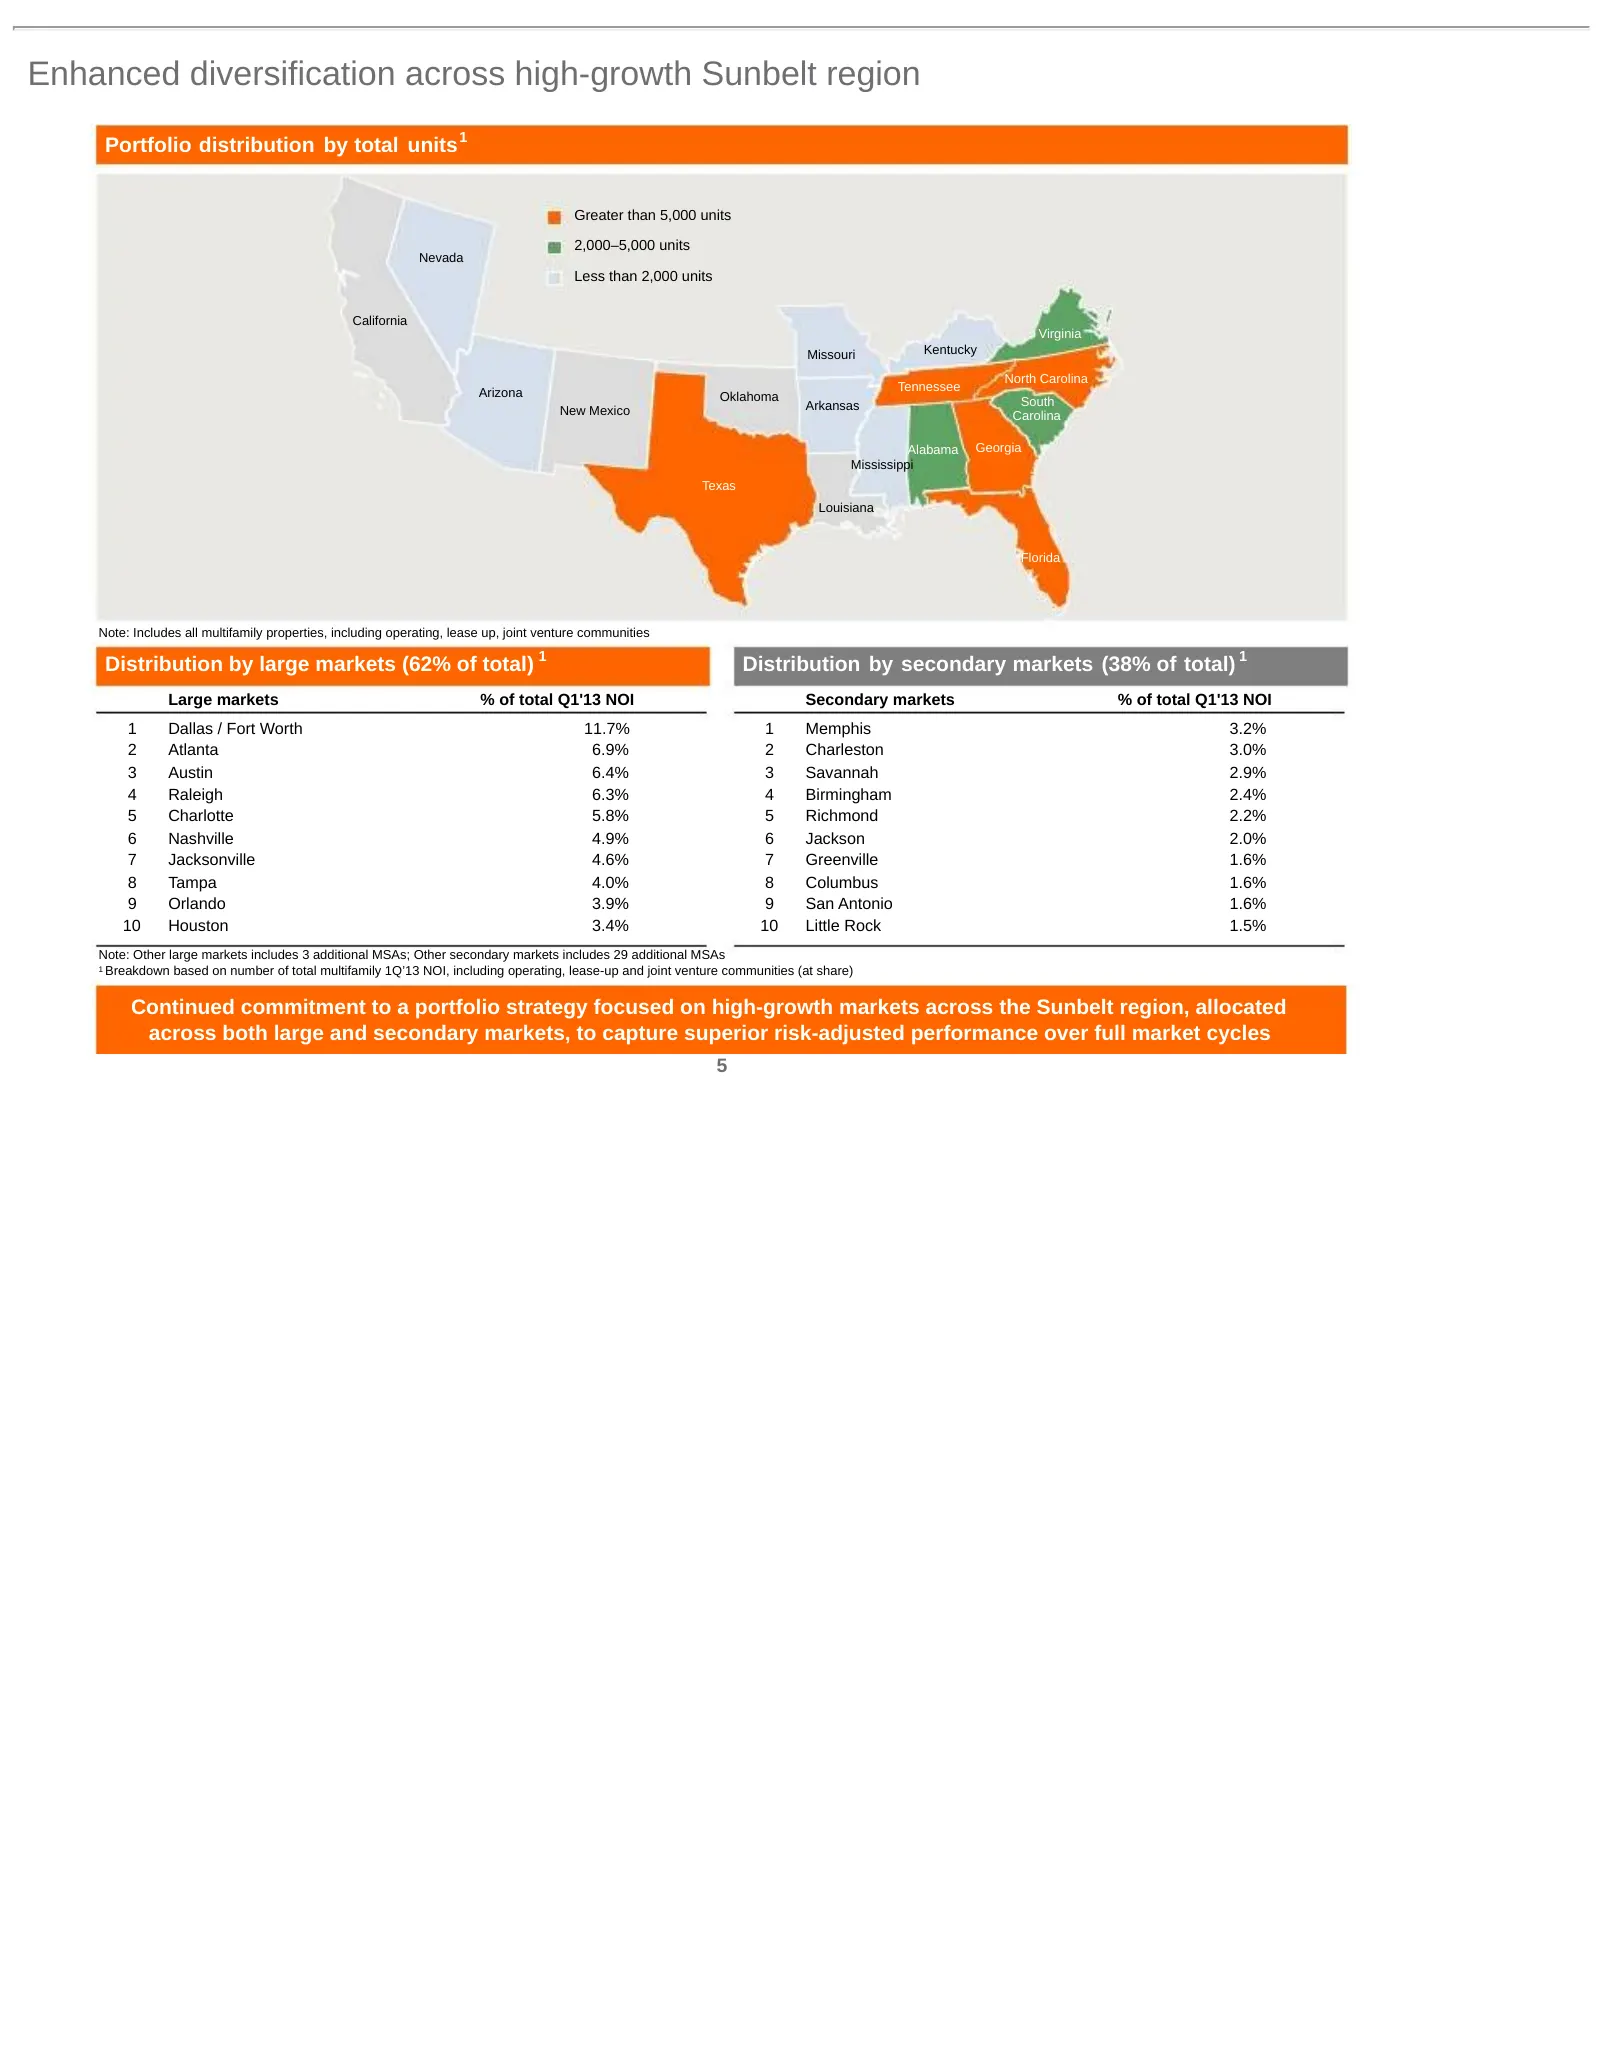
Enhanced diversification across high-growth Sunbelt region Portfolio distribution by total units 1 Greater than 5,000 units 2,000–5,000 units Nevada Less than 2,000 units California Virginia Missouri Kentucky North Carolina Tennessee Arizona Oklahoma Arkansas South New Mexico Carolina Alabama Georgi
Slide 7: Significant presence in large, high growth markets
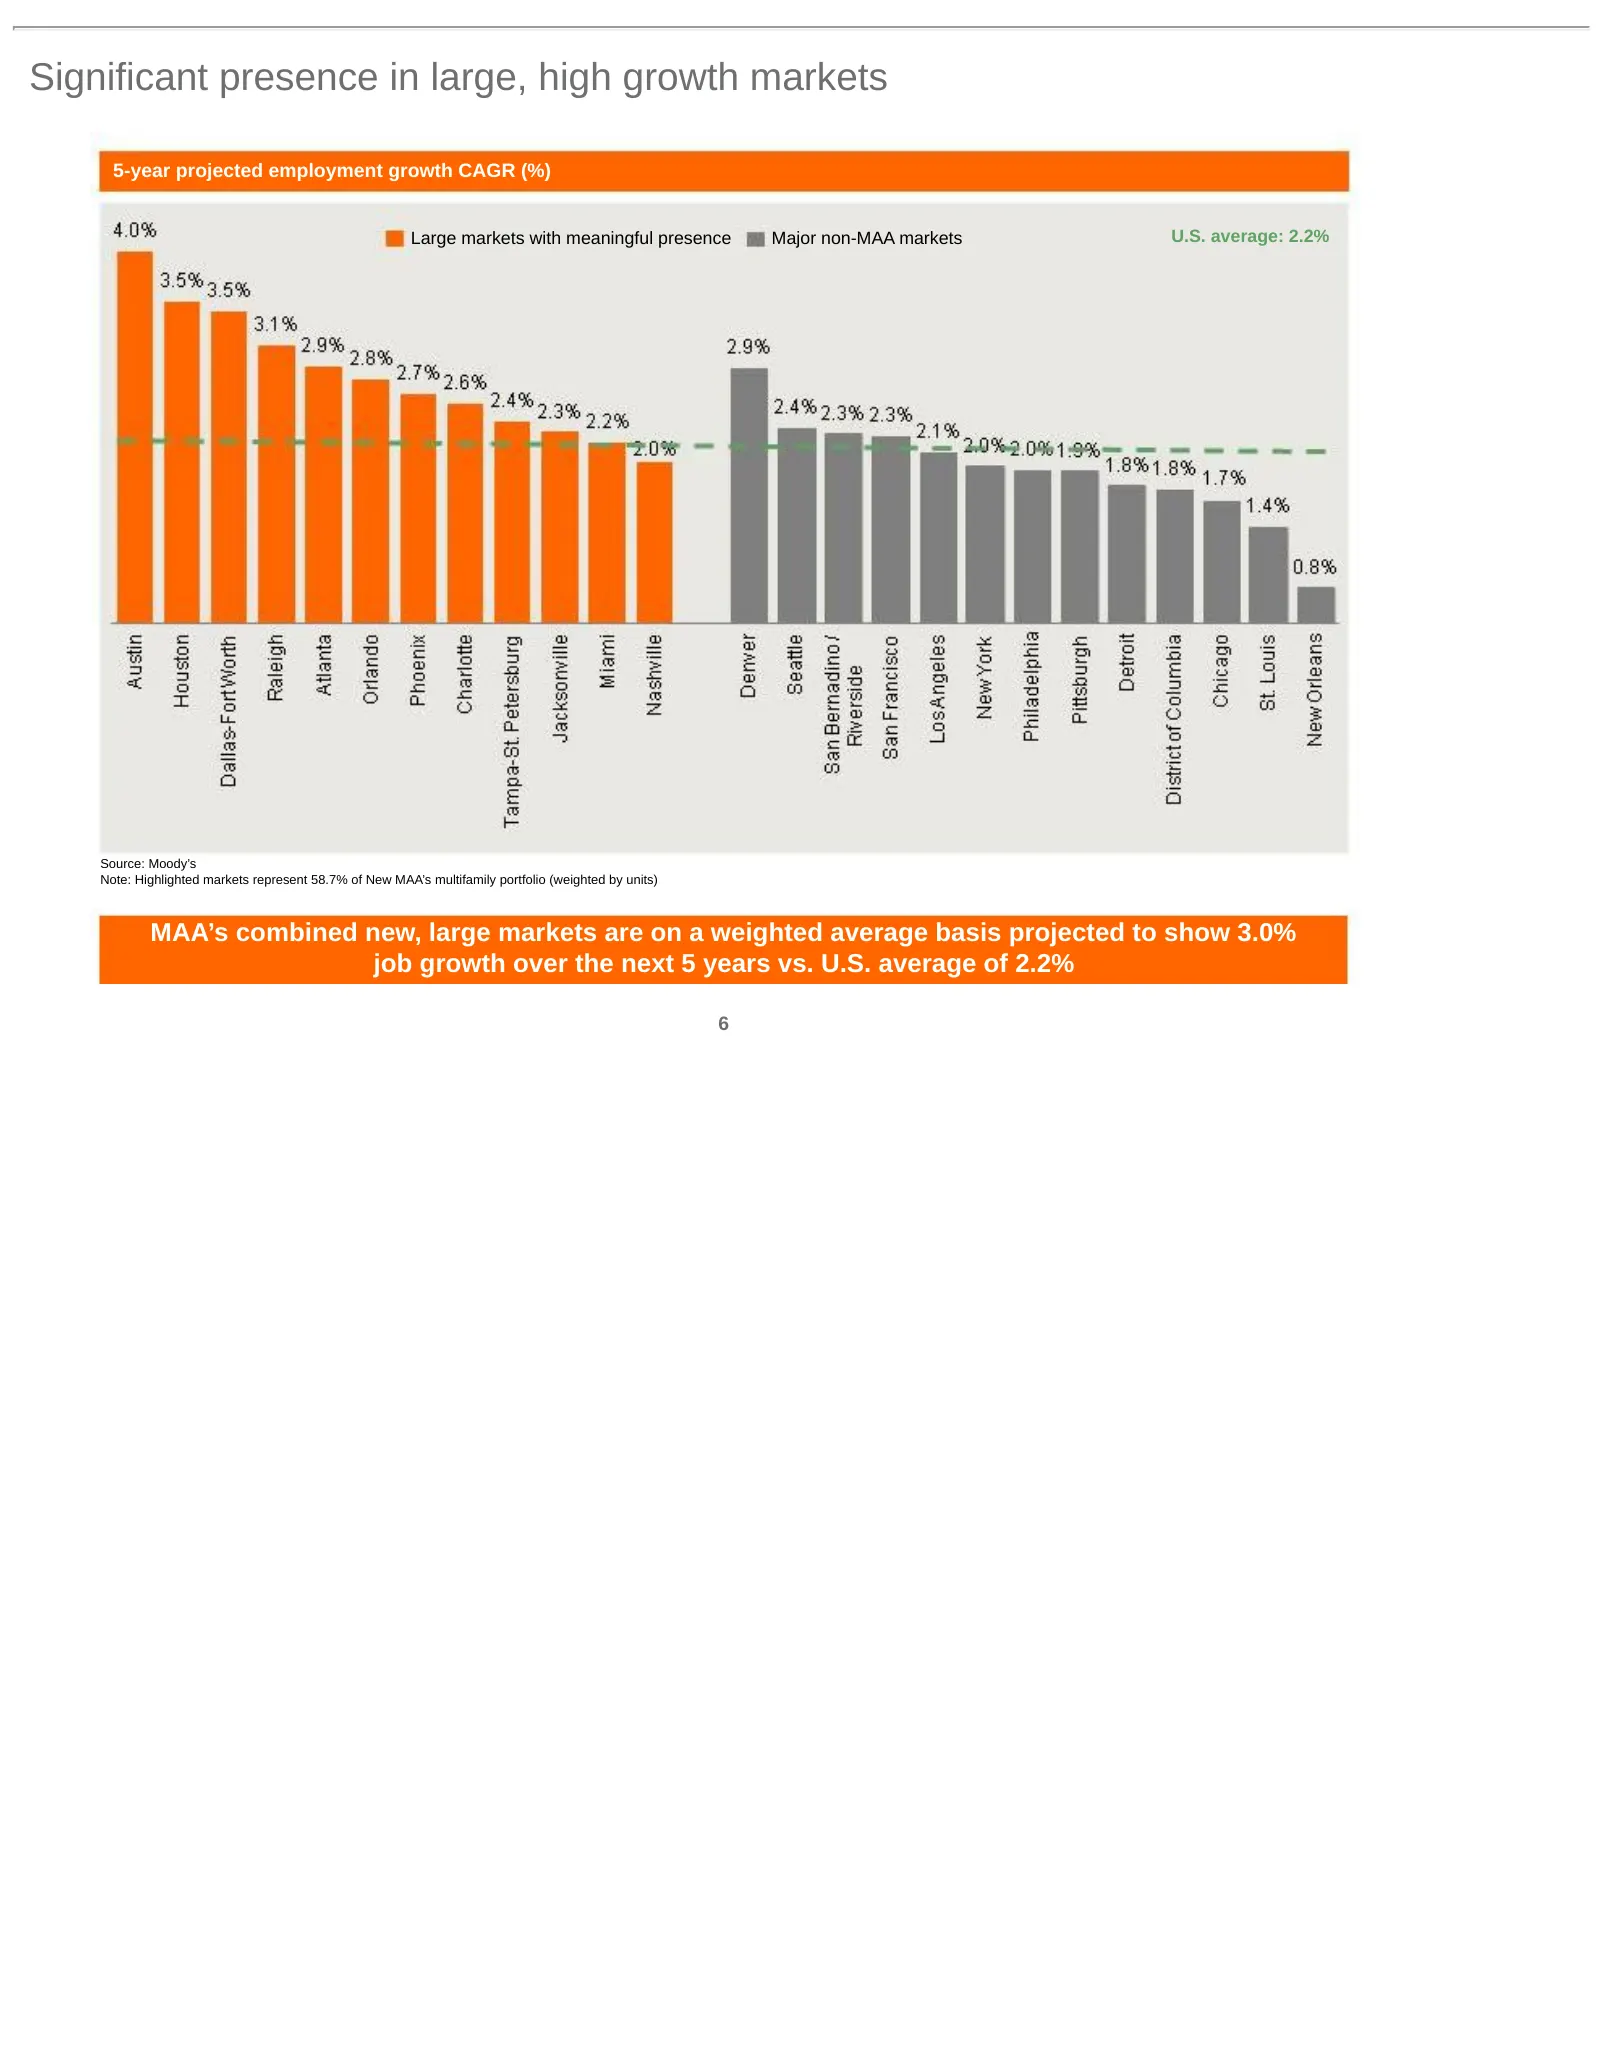
Significant presence in large, high growth markets 5-year projected employment growth CAGR (%) Large markets with meaningful presence Major non-MAA markets U.S. average: 2.2% Source: Moody’s Note: Highlighted markets represent 58.7% of New MAA’s multifamily portfolio (weighted by units) MAA’s combin
Slide 8: MAA's two-tier market strategy has delivered stable, long-term outperformance
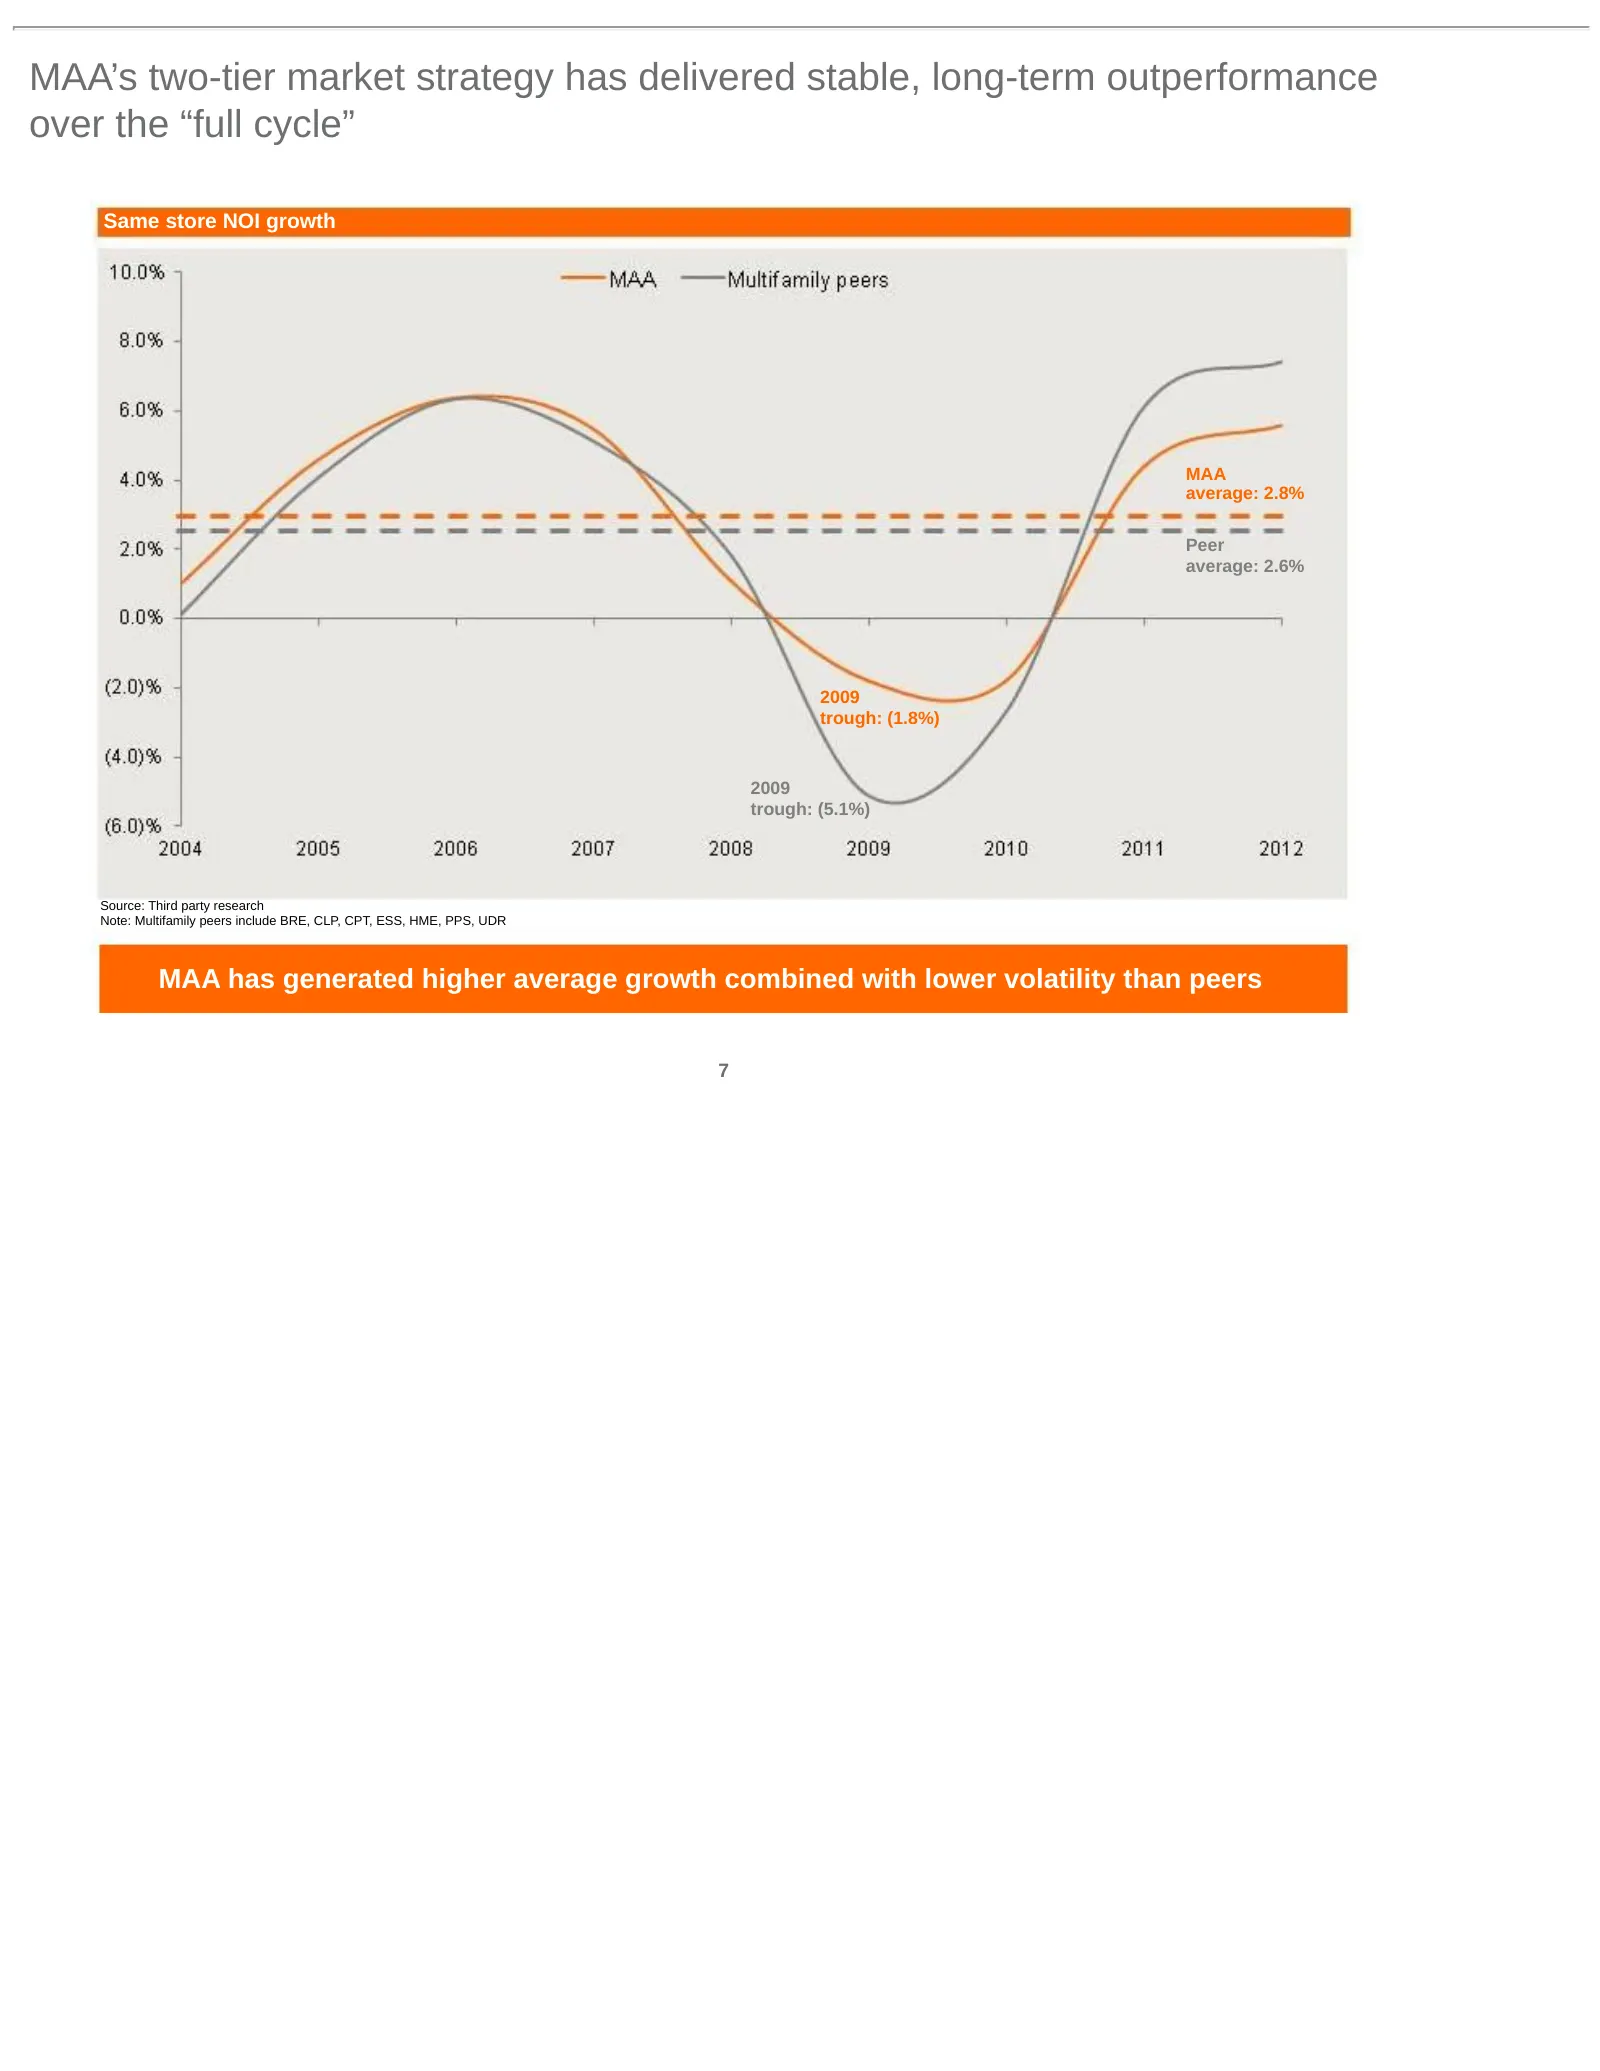
MAA’s two-tier market strategy has delivered stable, long-term outperformance over the “full cycle” Same store NOI growth MAA average: 2.8% Peer average: 2.6% 2009 trough: (1.8%) 2009 trough: (5.1%) Source: Third party research Note: Multifamily peers include BRE, CLP, CPT, ESS, HME, PPS, UDR MAA ha
Slide 9: New MAA will have an enhanced large market focus across the Sunbelt region
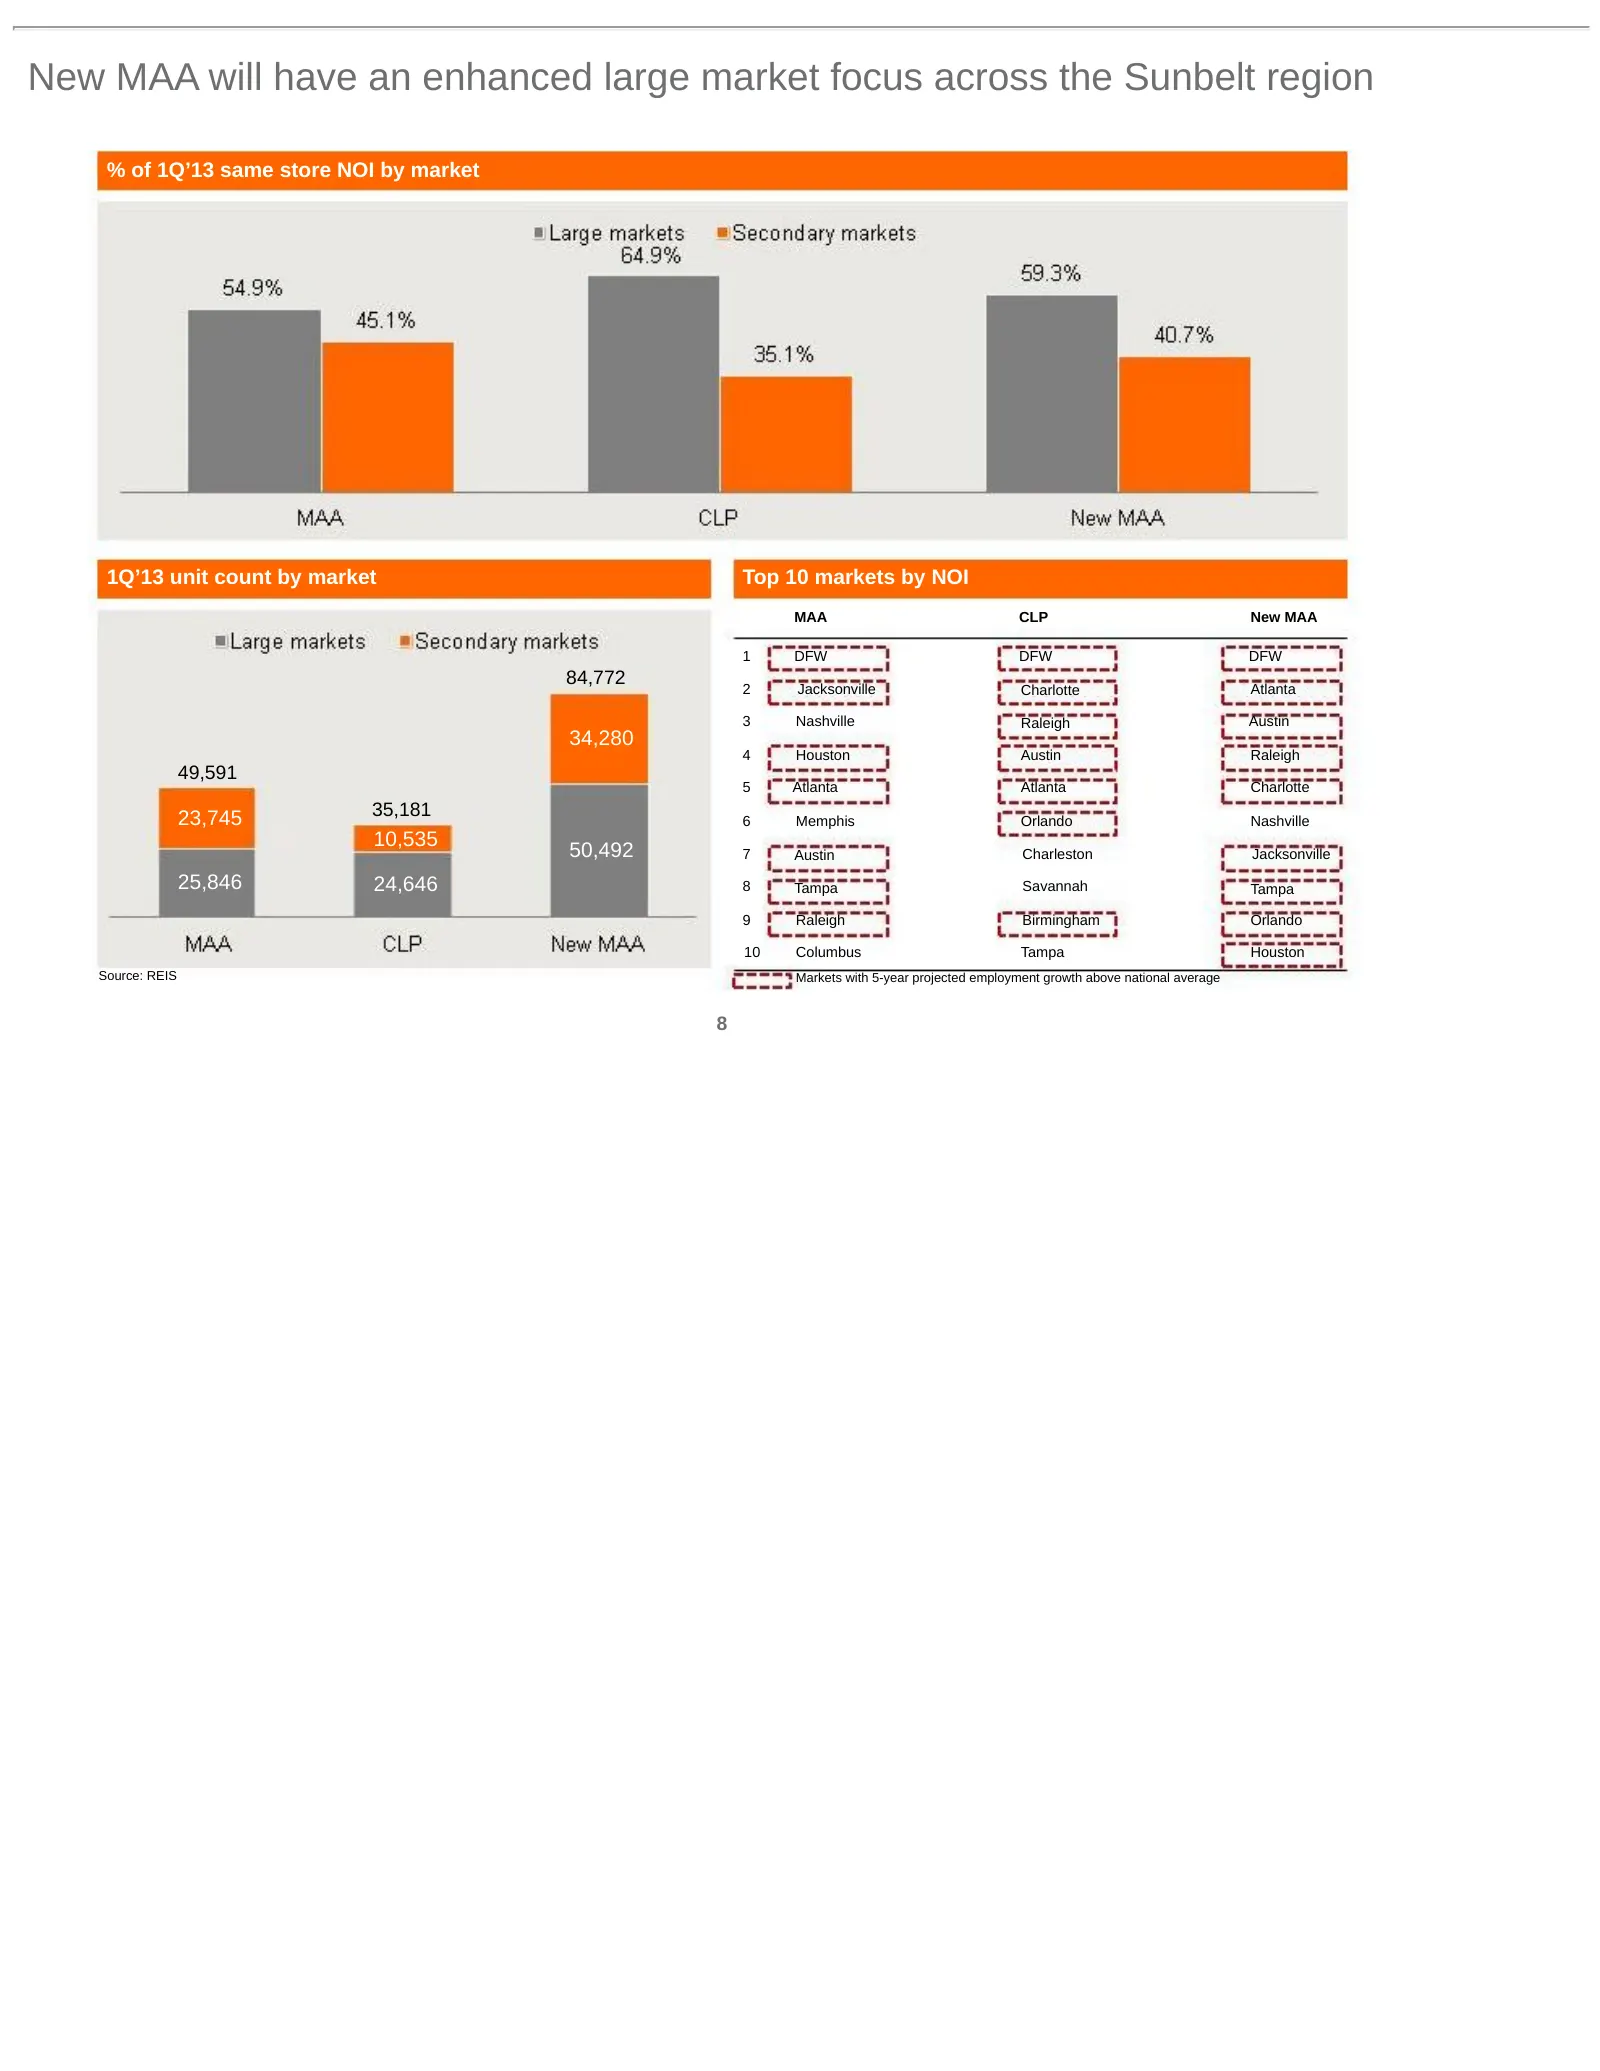
New MAA will have an enhanced large market focus across the Sunbelt region % of 1Q’13 same store NOI by market 1Q’13 unit count by market Top 10 markets by NOI MAA CLP New MAA 1 DFW DFW DFW 84,772 2 Jacksonville Charlotte Atlanta 3 Nashville Raleigh Austin 34,280 4 Houston Austin Raleigh 49,591 5 At
Slide 10: Synergy and value creation potential through integration
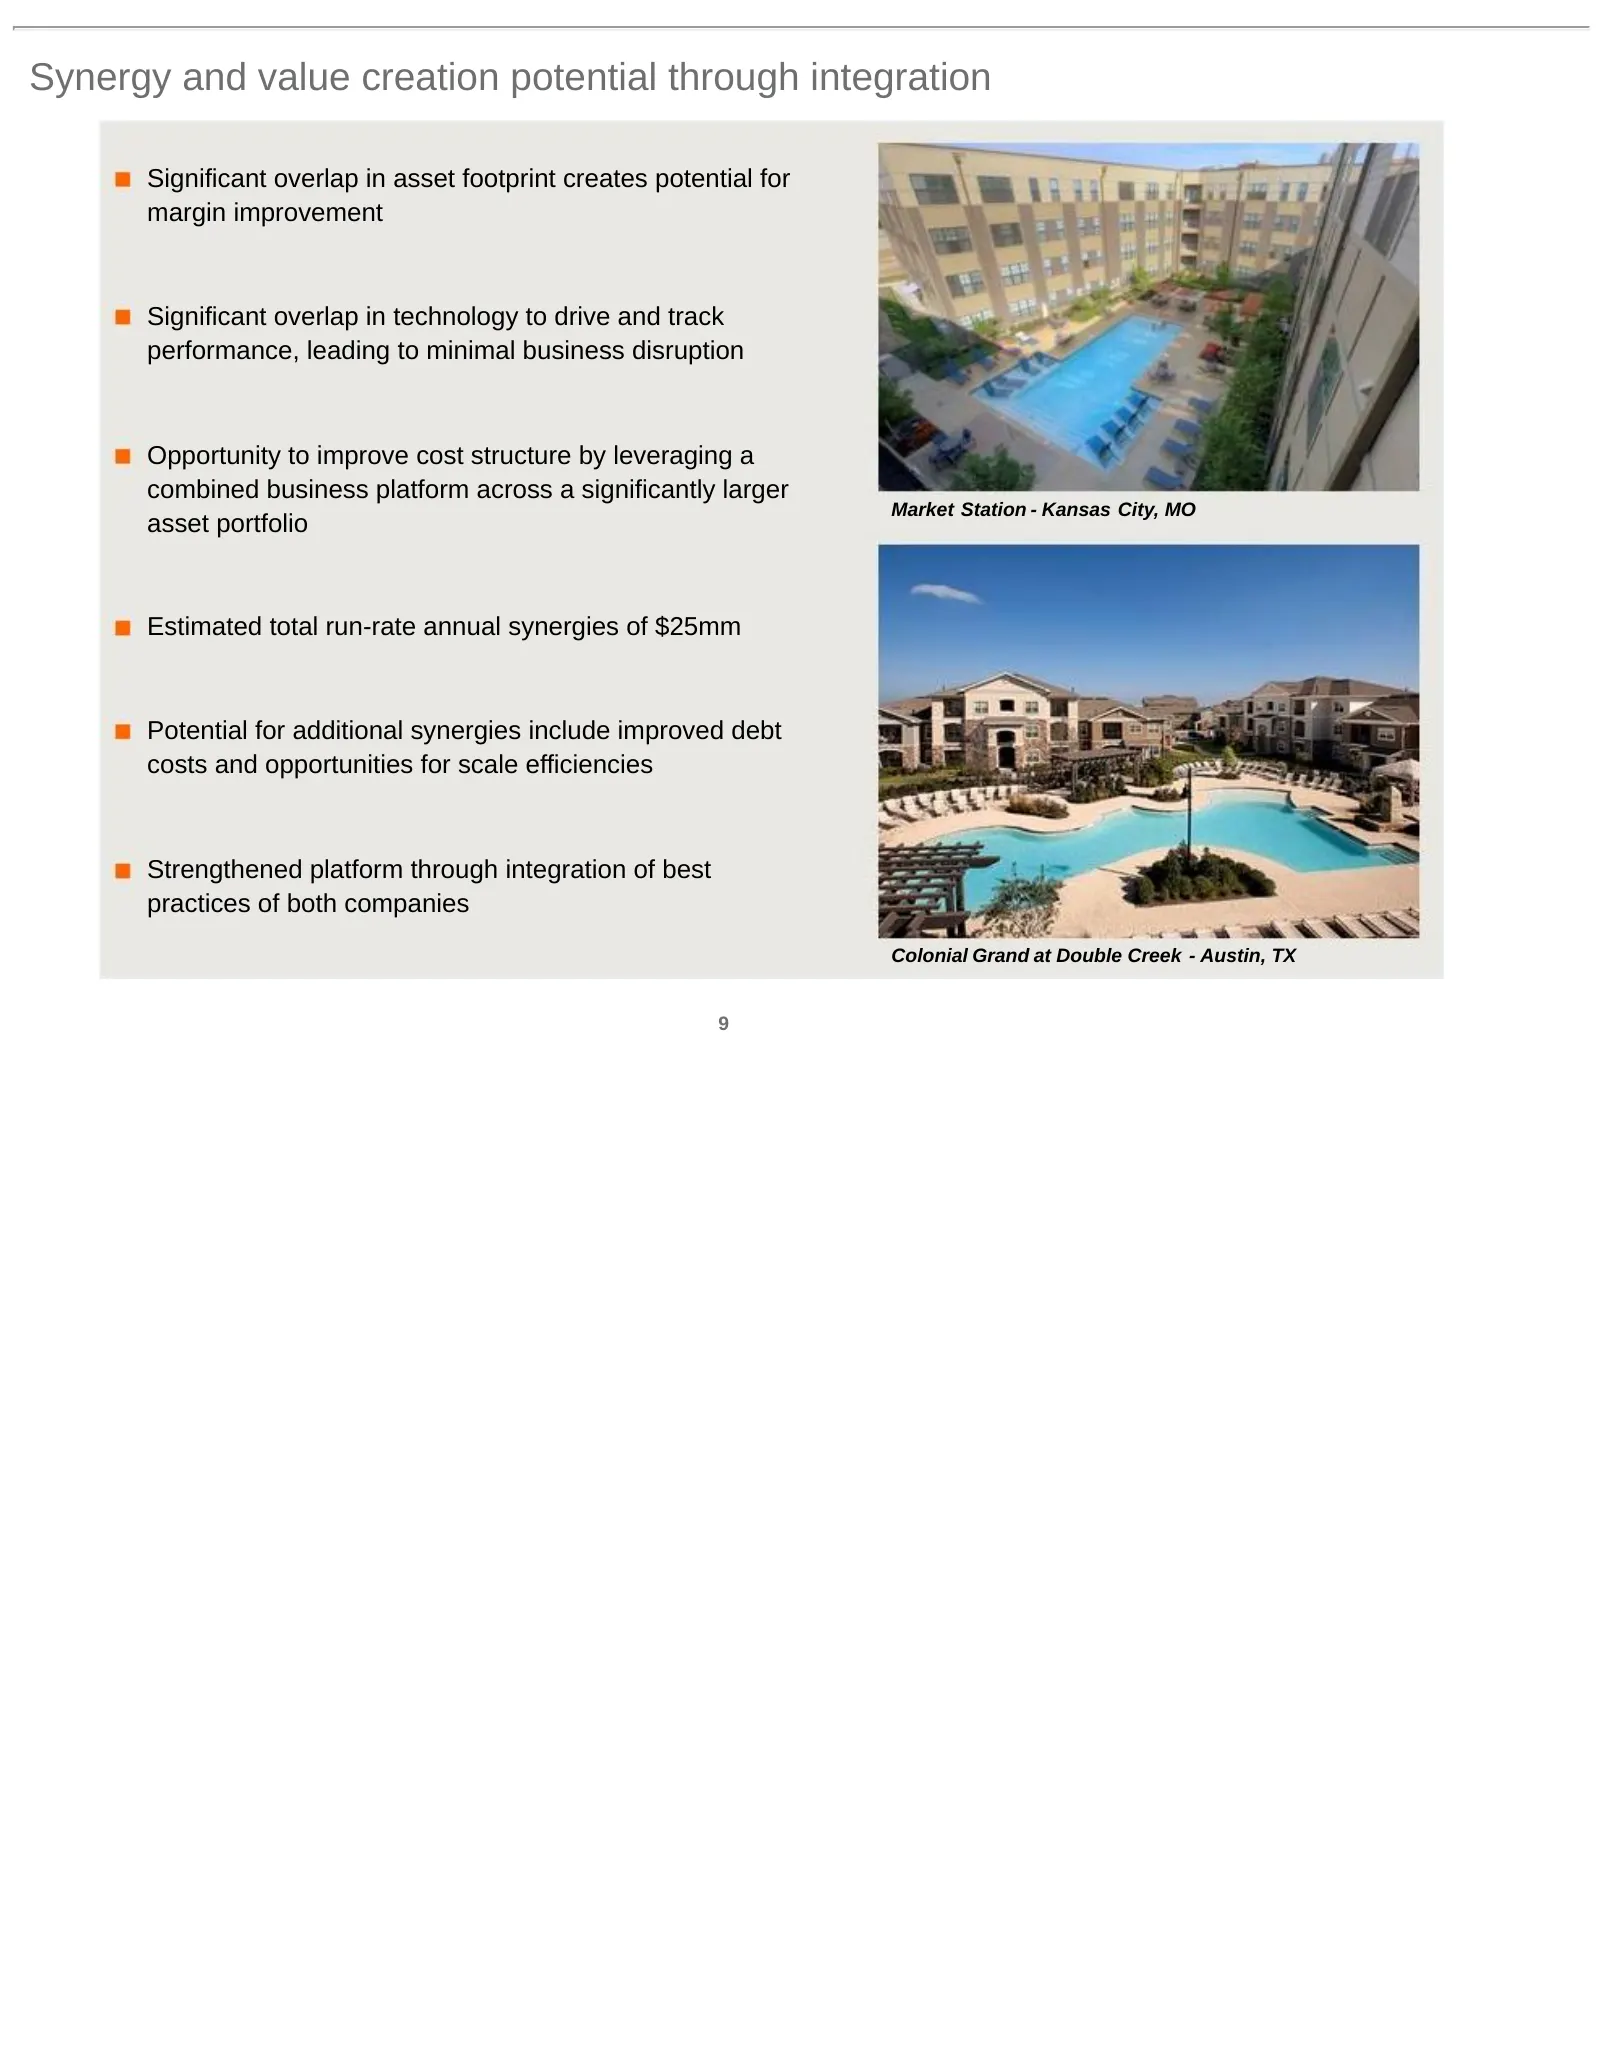
Synergy and value creation potential through integration Significant overlap in asset footprint creates potential for margin improvement Significant overlap in technology to drive and track performance, leading to minimal business disruption Opportunity to improve cost structure by leveraging a comb
Slide 11: MAA management's proven record of disciplined capital deployment and performance
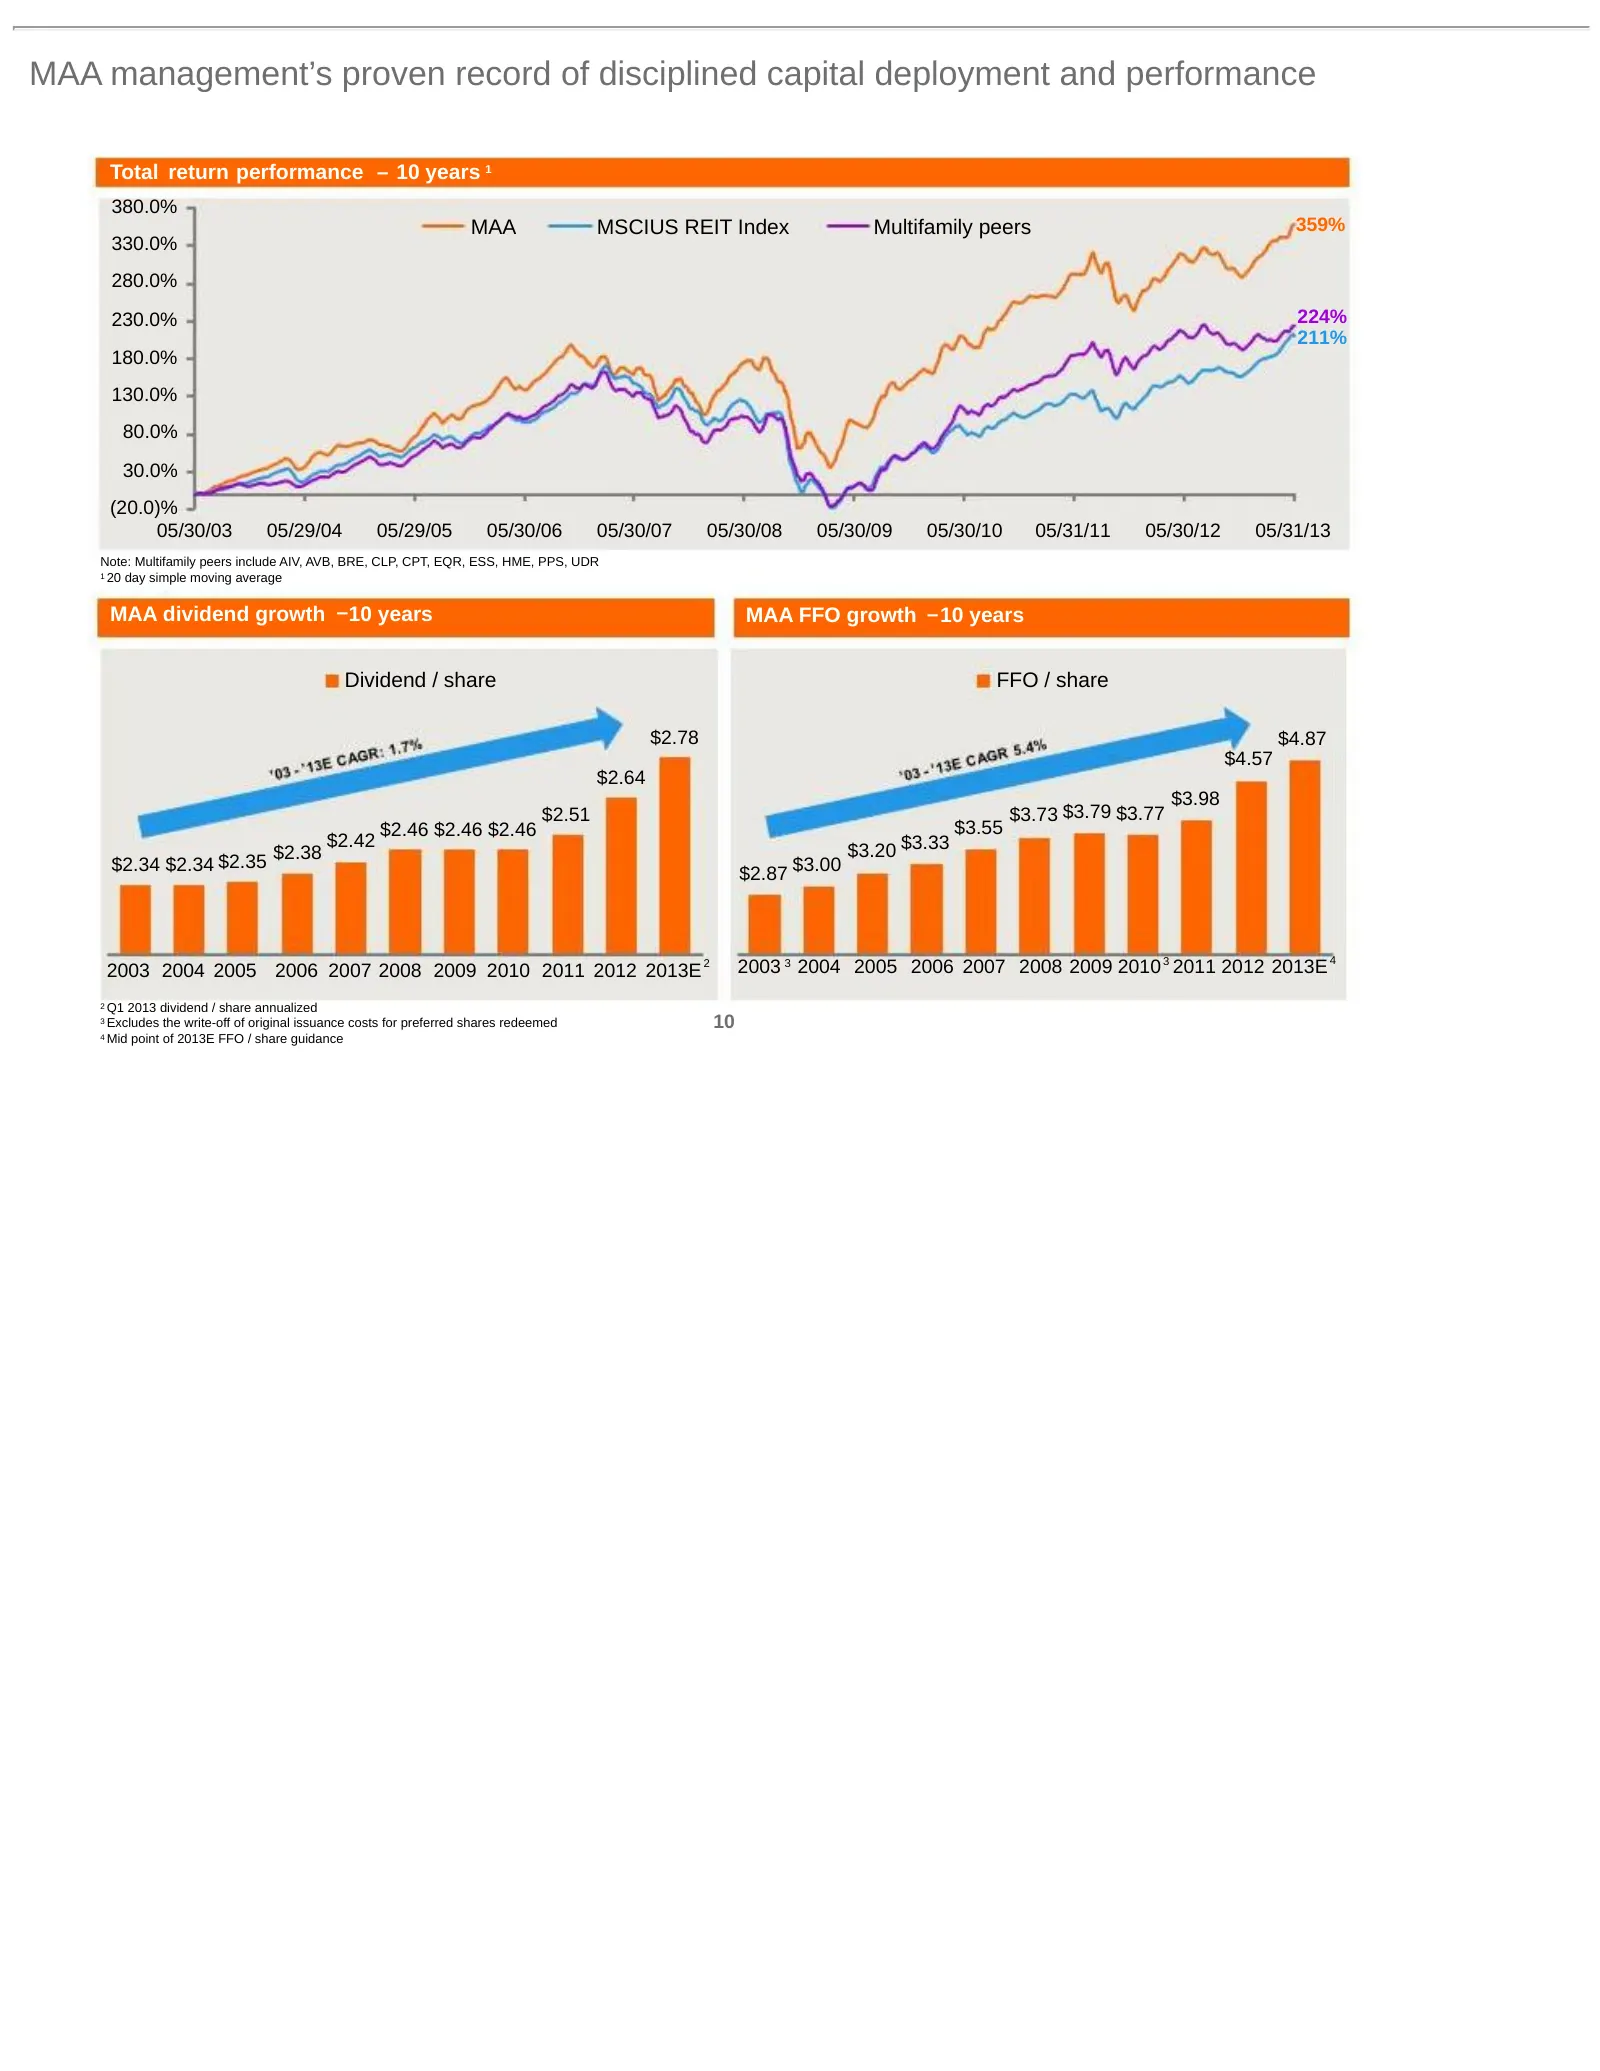
MAA management’s proven record of disciplined capital deployment and performance Total return performance – 10 years 1 380.0% MAA MSCIUS REIT Index Multifamily peers 359% 330.0% 280.0% 230.0% 224% 211% 180.0% 130.0% 80.0% 30.0% (20.0)% 05/30/03 05/29/04 05/29/05 05/30/06 05/30/07 05/30/08 05/30/09 0
Slide 12: New MAA will maintain a disciplined approach to development
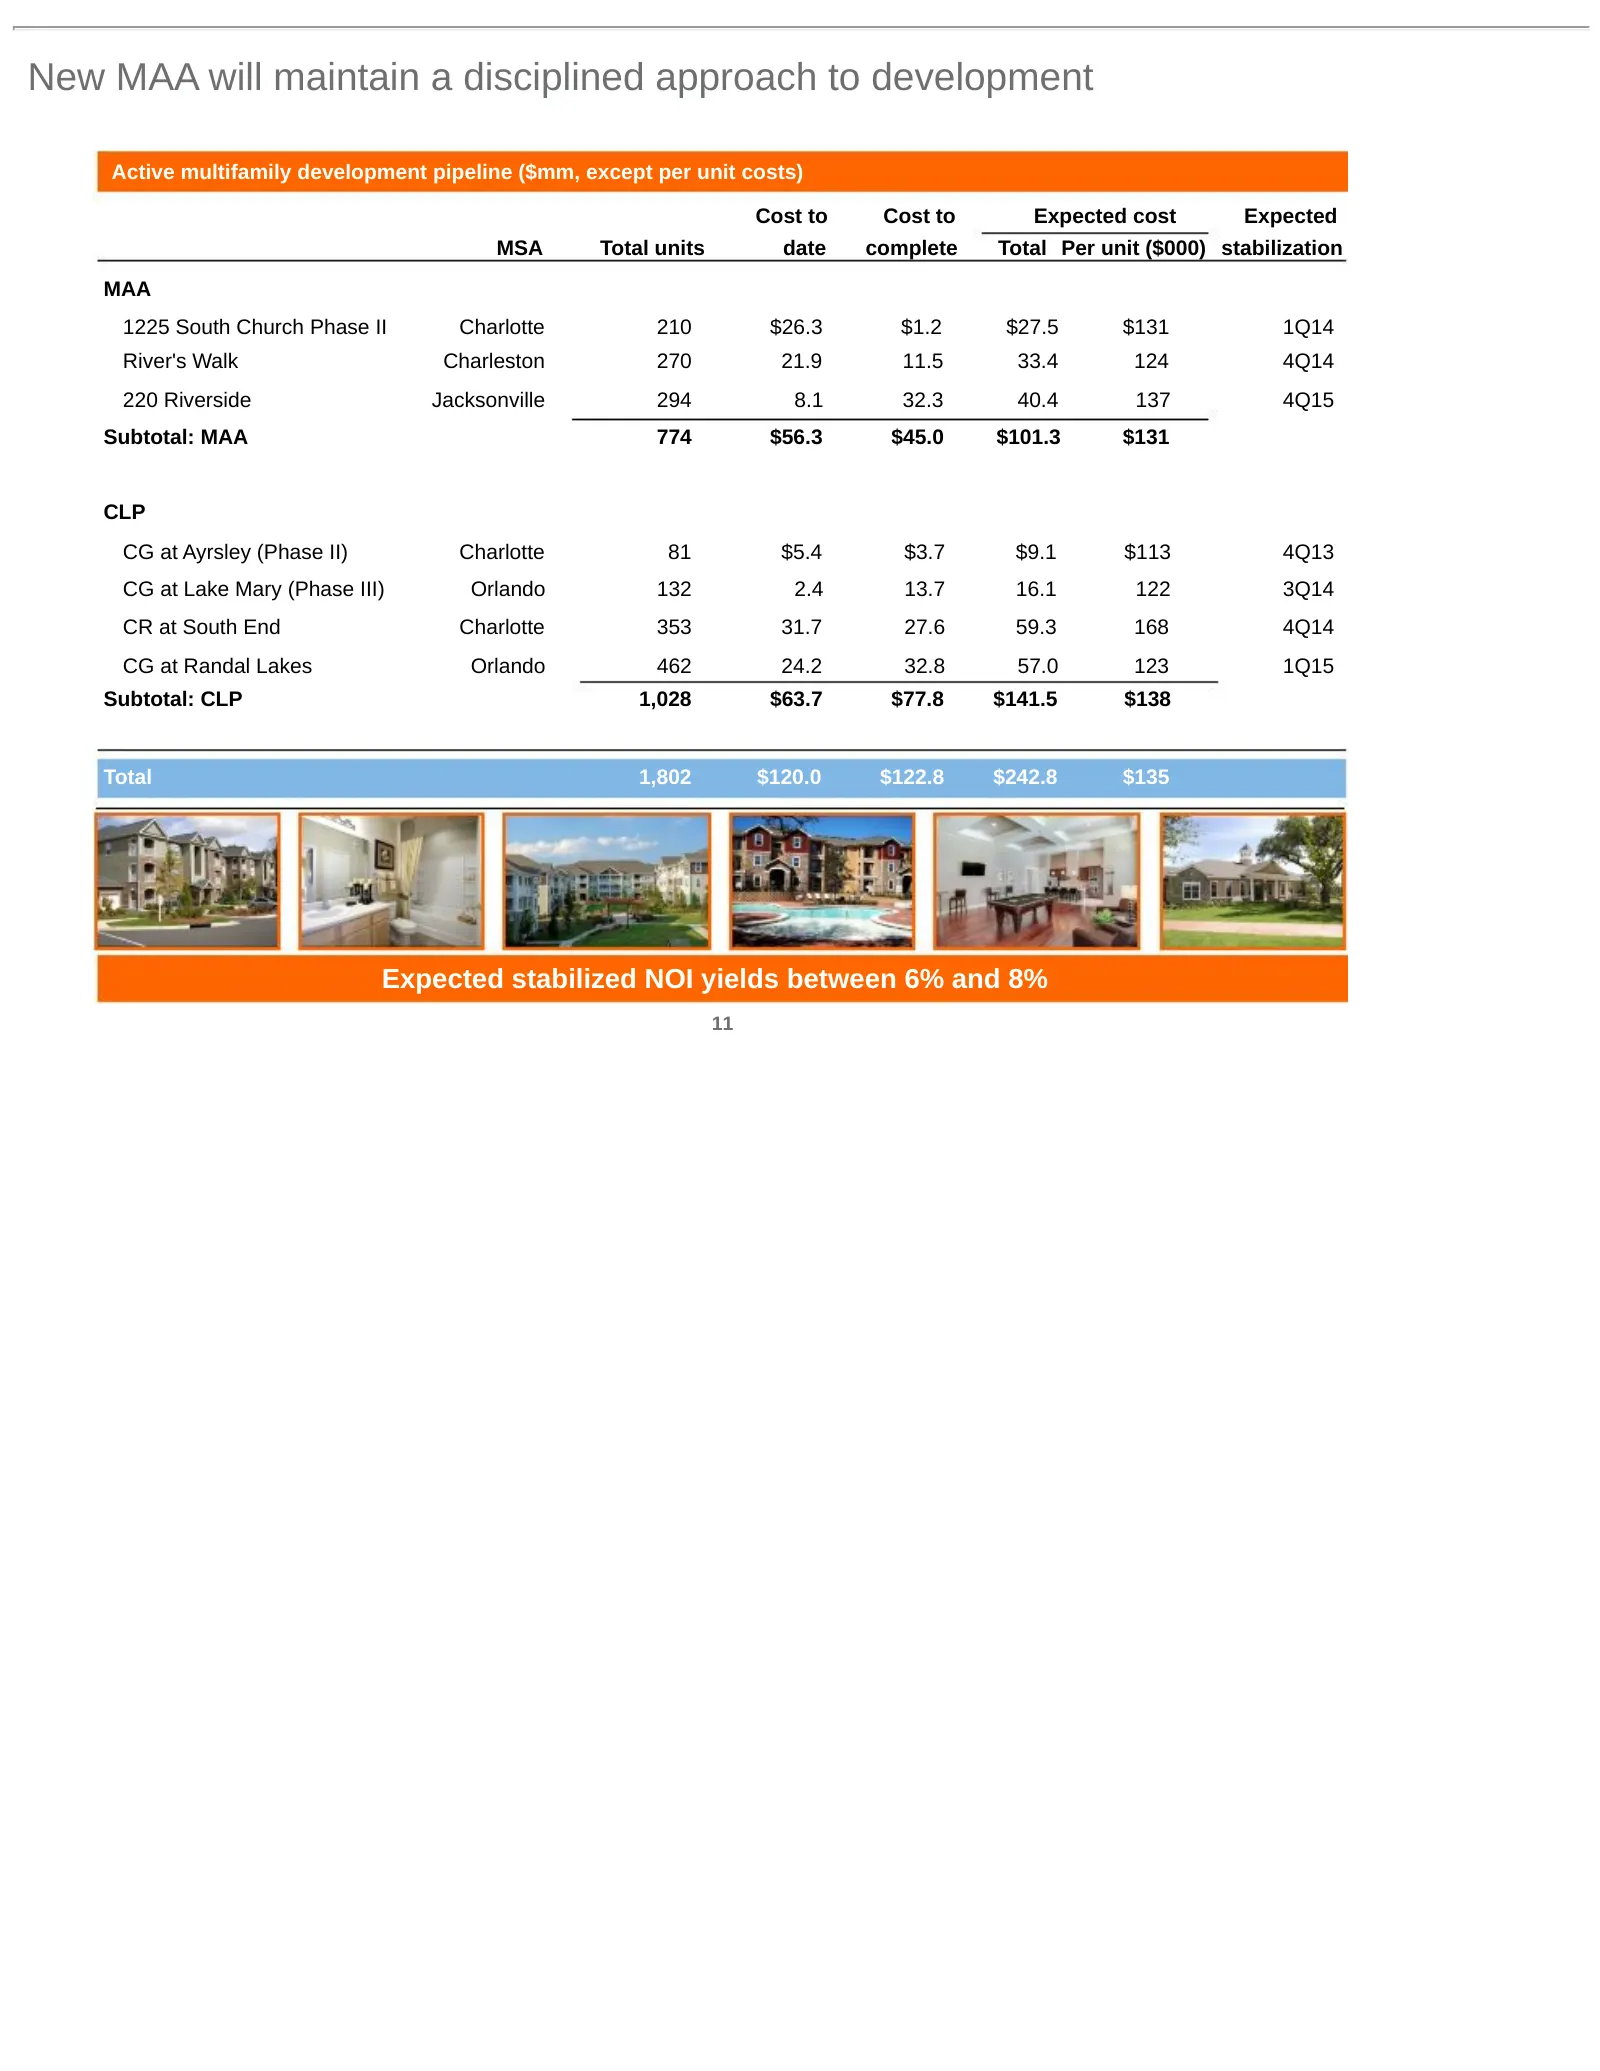
New MAA will maintain a disciplined approach to development Active multifamily development pipeline ($mm, except per unit costs) Cost to Cost to Expected cost Expected MSA Total units date complete Total Per unit ($000) stabilization MAA 1225 South Church Phase II Charlotte 210 $26.3 $1.2 $27.5 $131
Slide 13: New MAA will continue to recycle capital into high quality properties
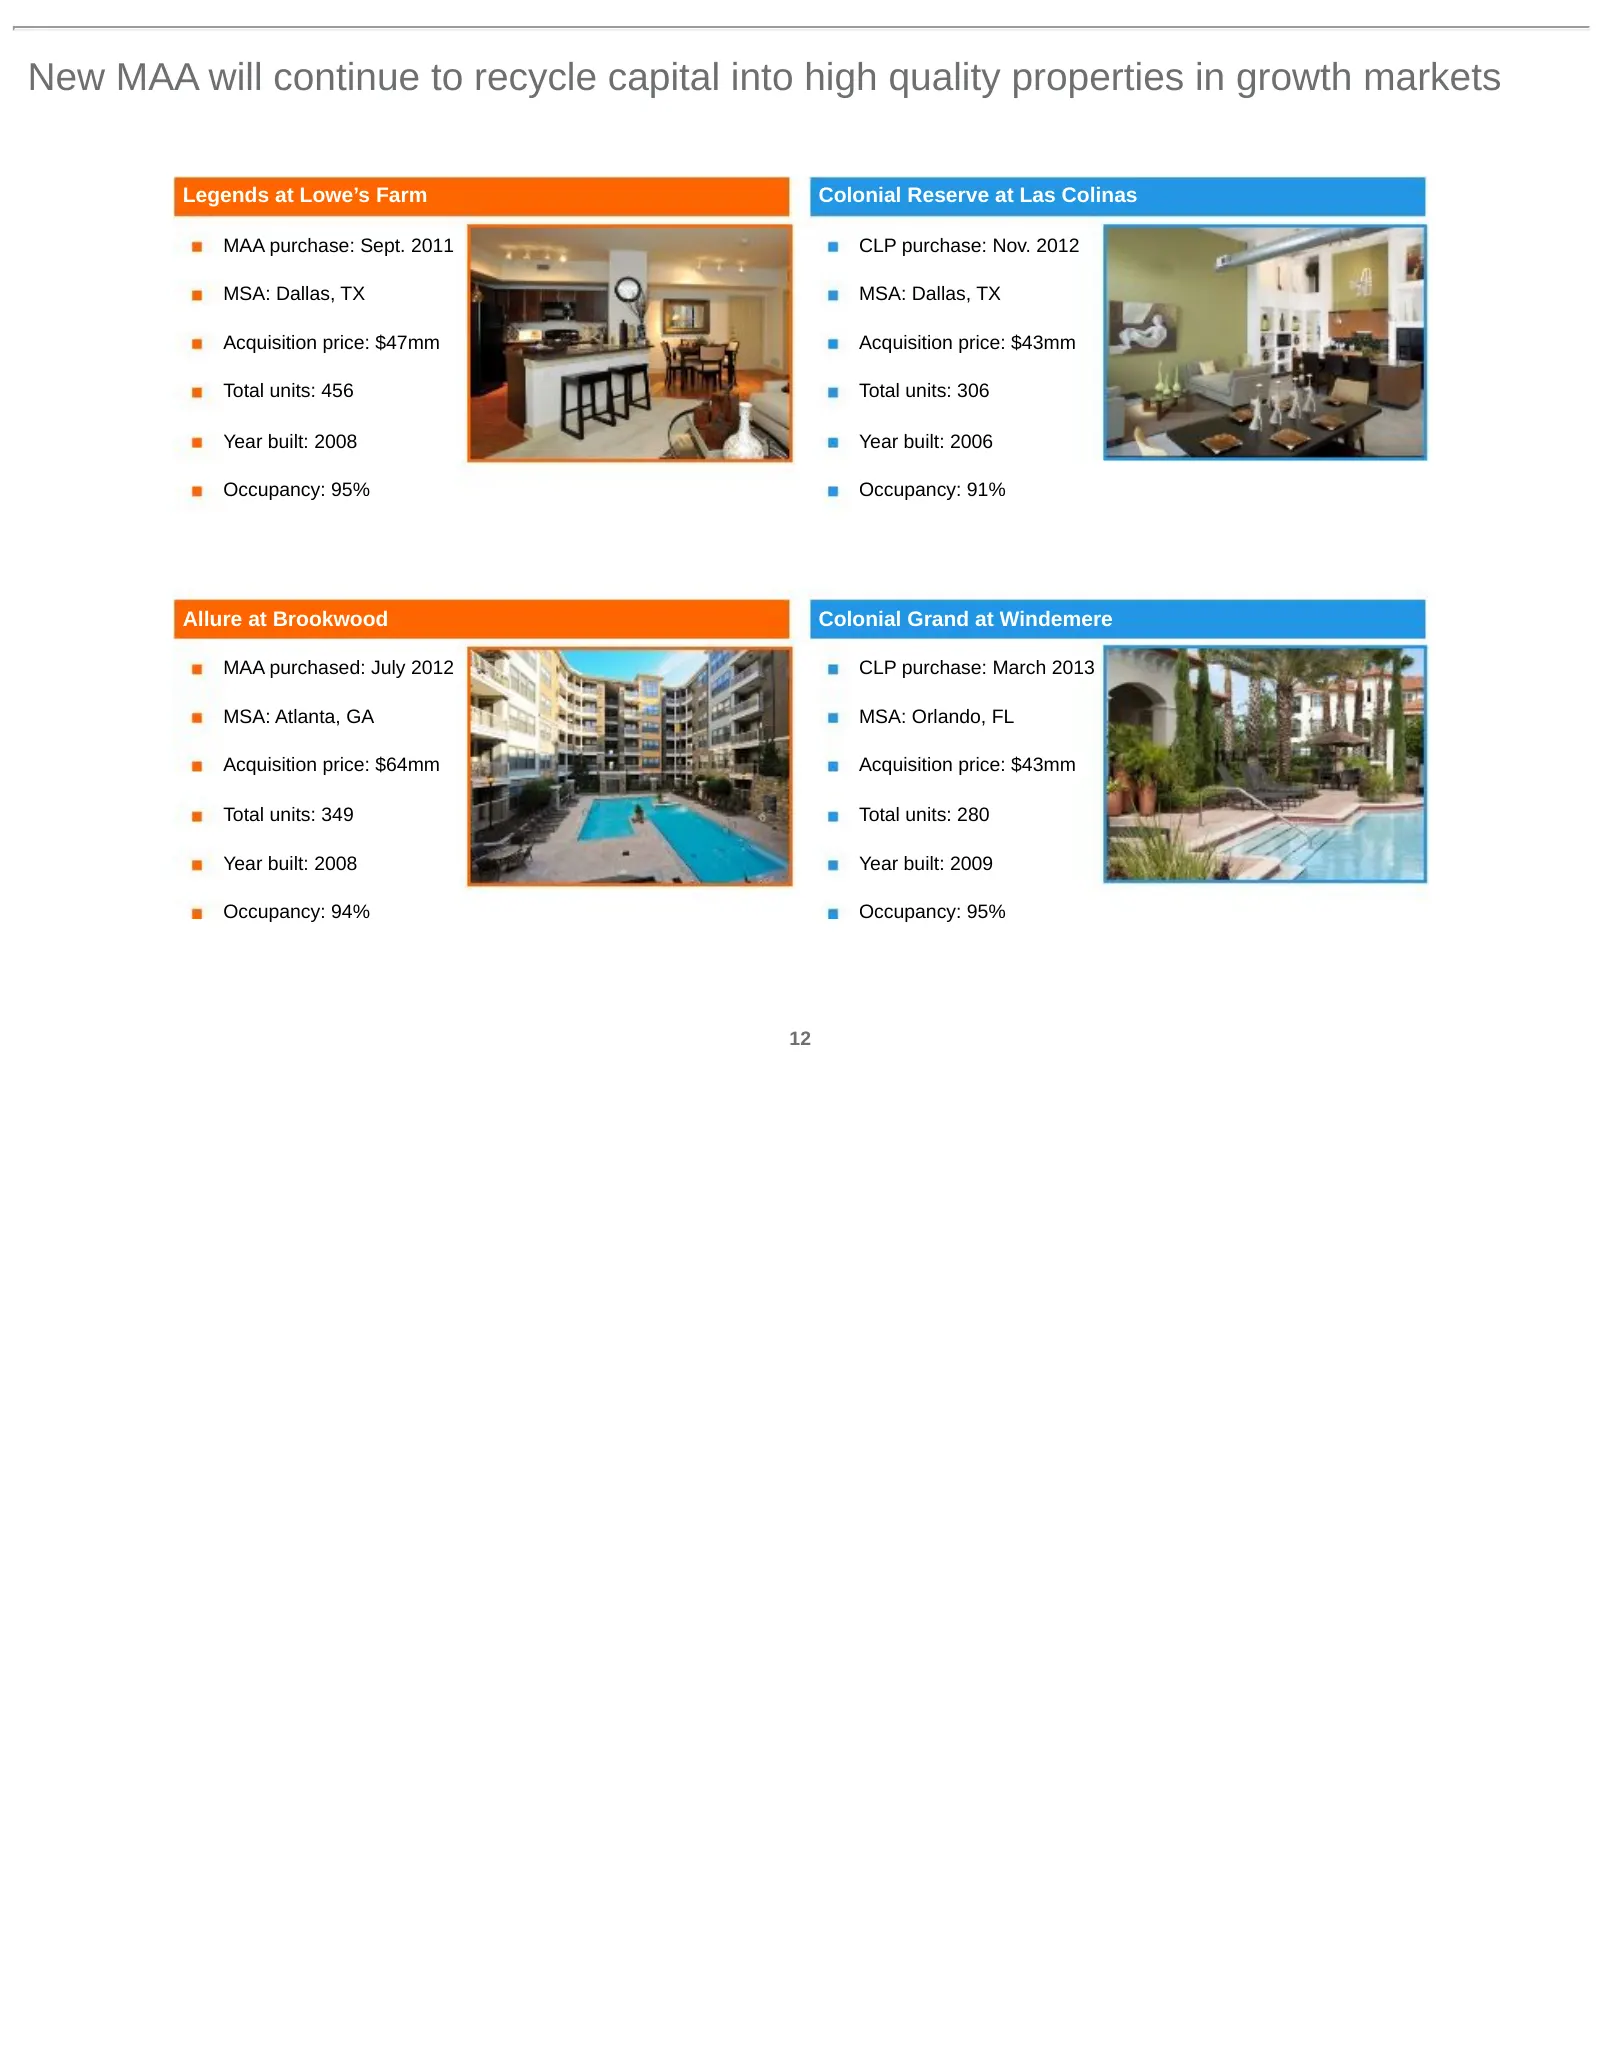
New MAA will continue to recycle capital into high quality properties in growth markets Legends at Lowe’s Farm Colonial Reserve at Las Colinas MAA purchase: Sept. 2011 CLP purchase: Nov. 2012 MSA: Dallas, TX MSA: Dallas, TX Acquisition price: $47mm Acquisition price: $43mm Total units: 456 Total uni
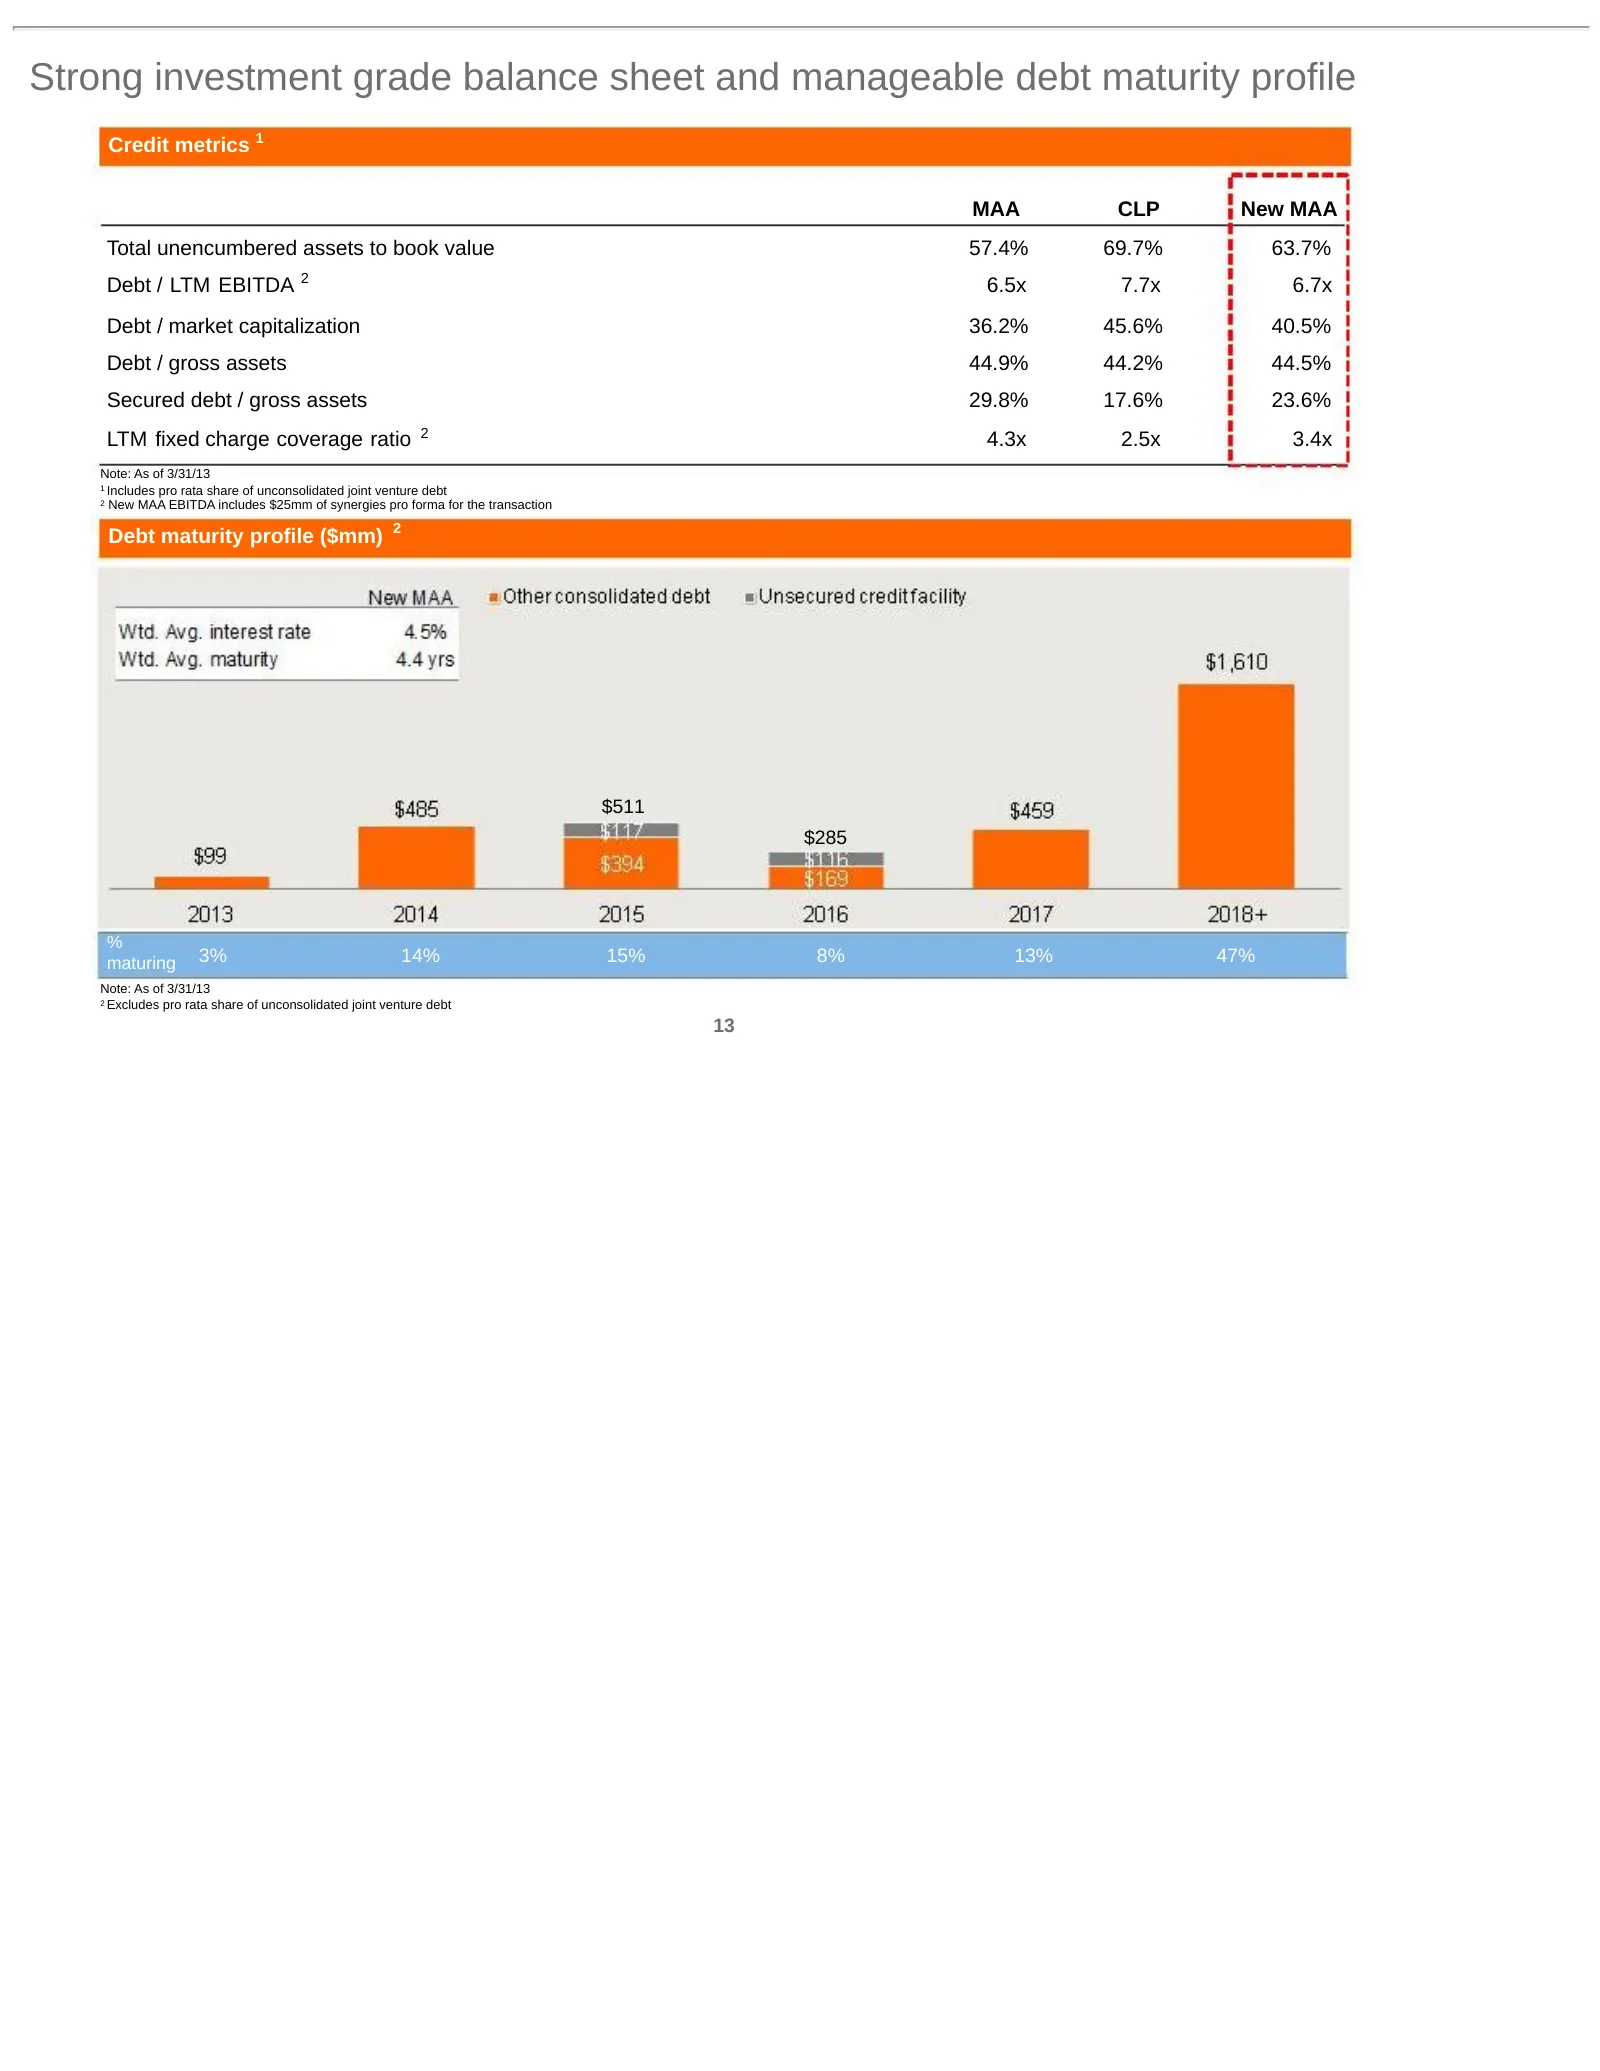
Slide 14: Strong investment grade balance sheet and manageable debt maturity profile
Strong investment grade balance sheet and manageable debt maturity profile Credit metrics 1 MAA CLP New MAA Total unencumbered assets to book value 57.4% 69.7% 63.7% 2 Debt / LTM EBITDA 6.5x 7.7x 6.7x Debt / market capitalization 36.2% 45.6% 40.5% Debt / gross assets 44.9% 44.2% 44.5% Secured debt /
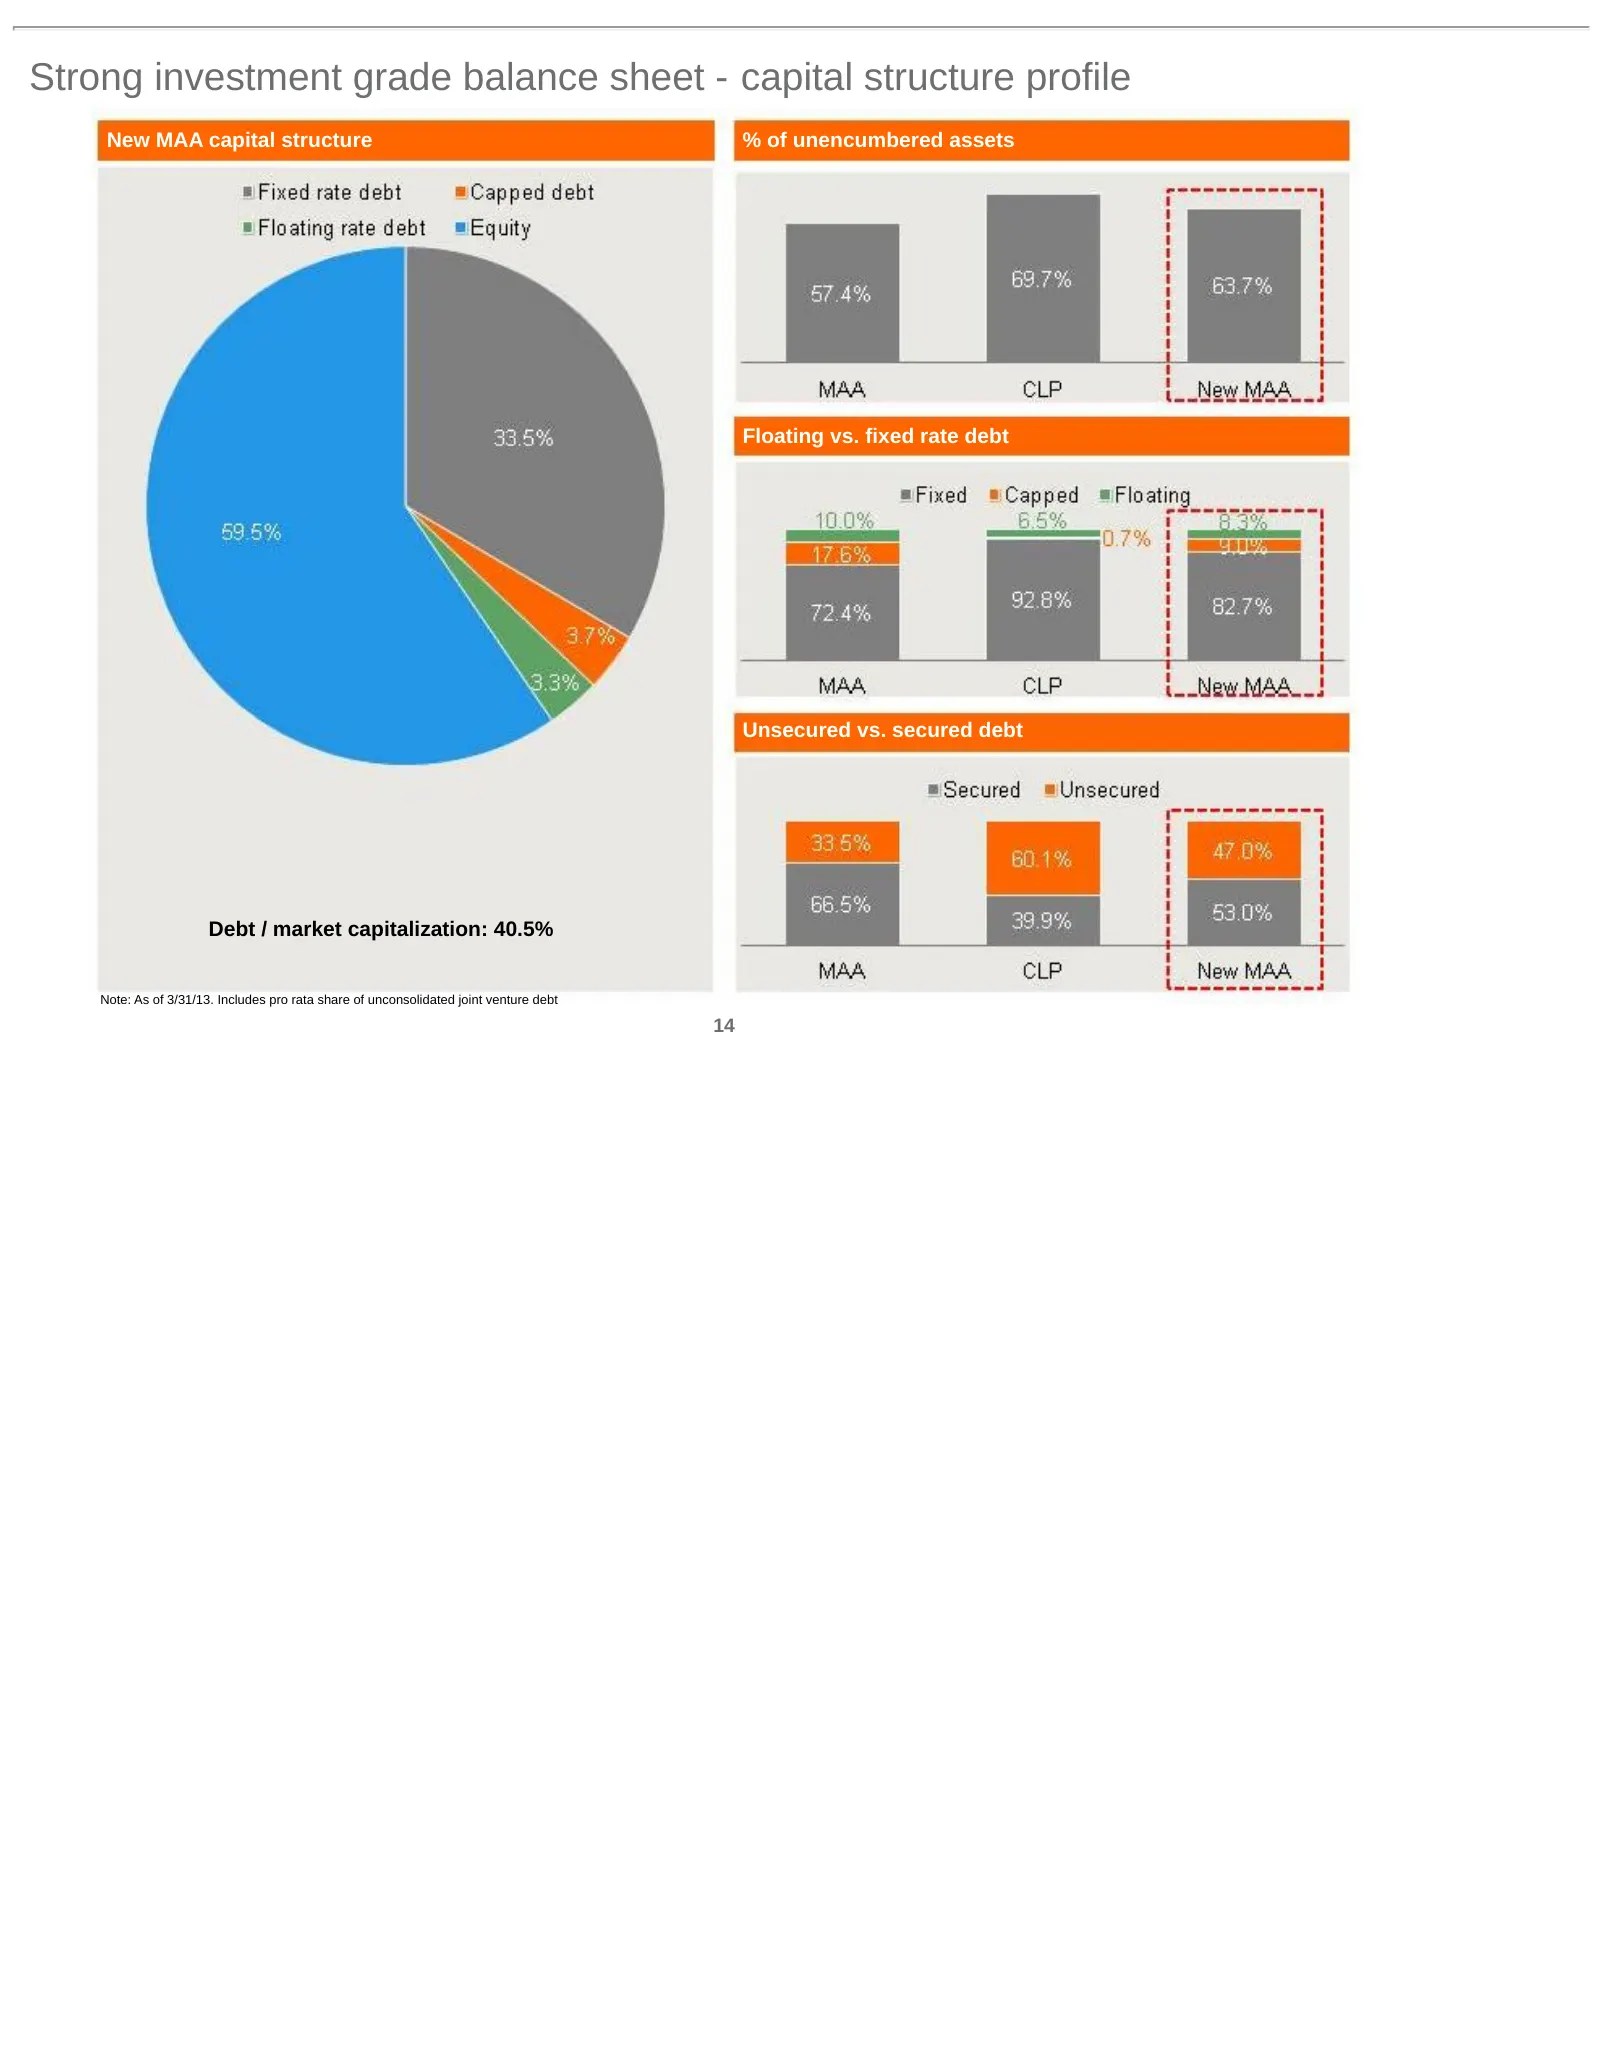
Slide 15: Strong investment grade balance sheet - capital structure profile
Strong investment grade balance sheet - capital structure profile New MAA capital structure % of unencumbered assets Floating vs. fixed rate debt Unsecured vs. secured debt Debt / market capitalization: 40.5% Note: As of 3/31/13. Includes pro rata share of unconsolidated joint venture debt 14
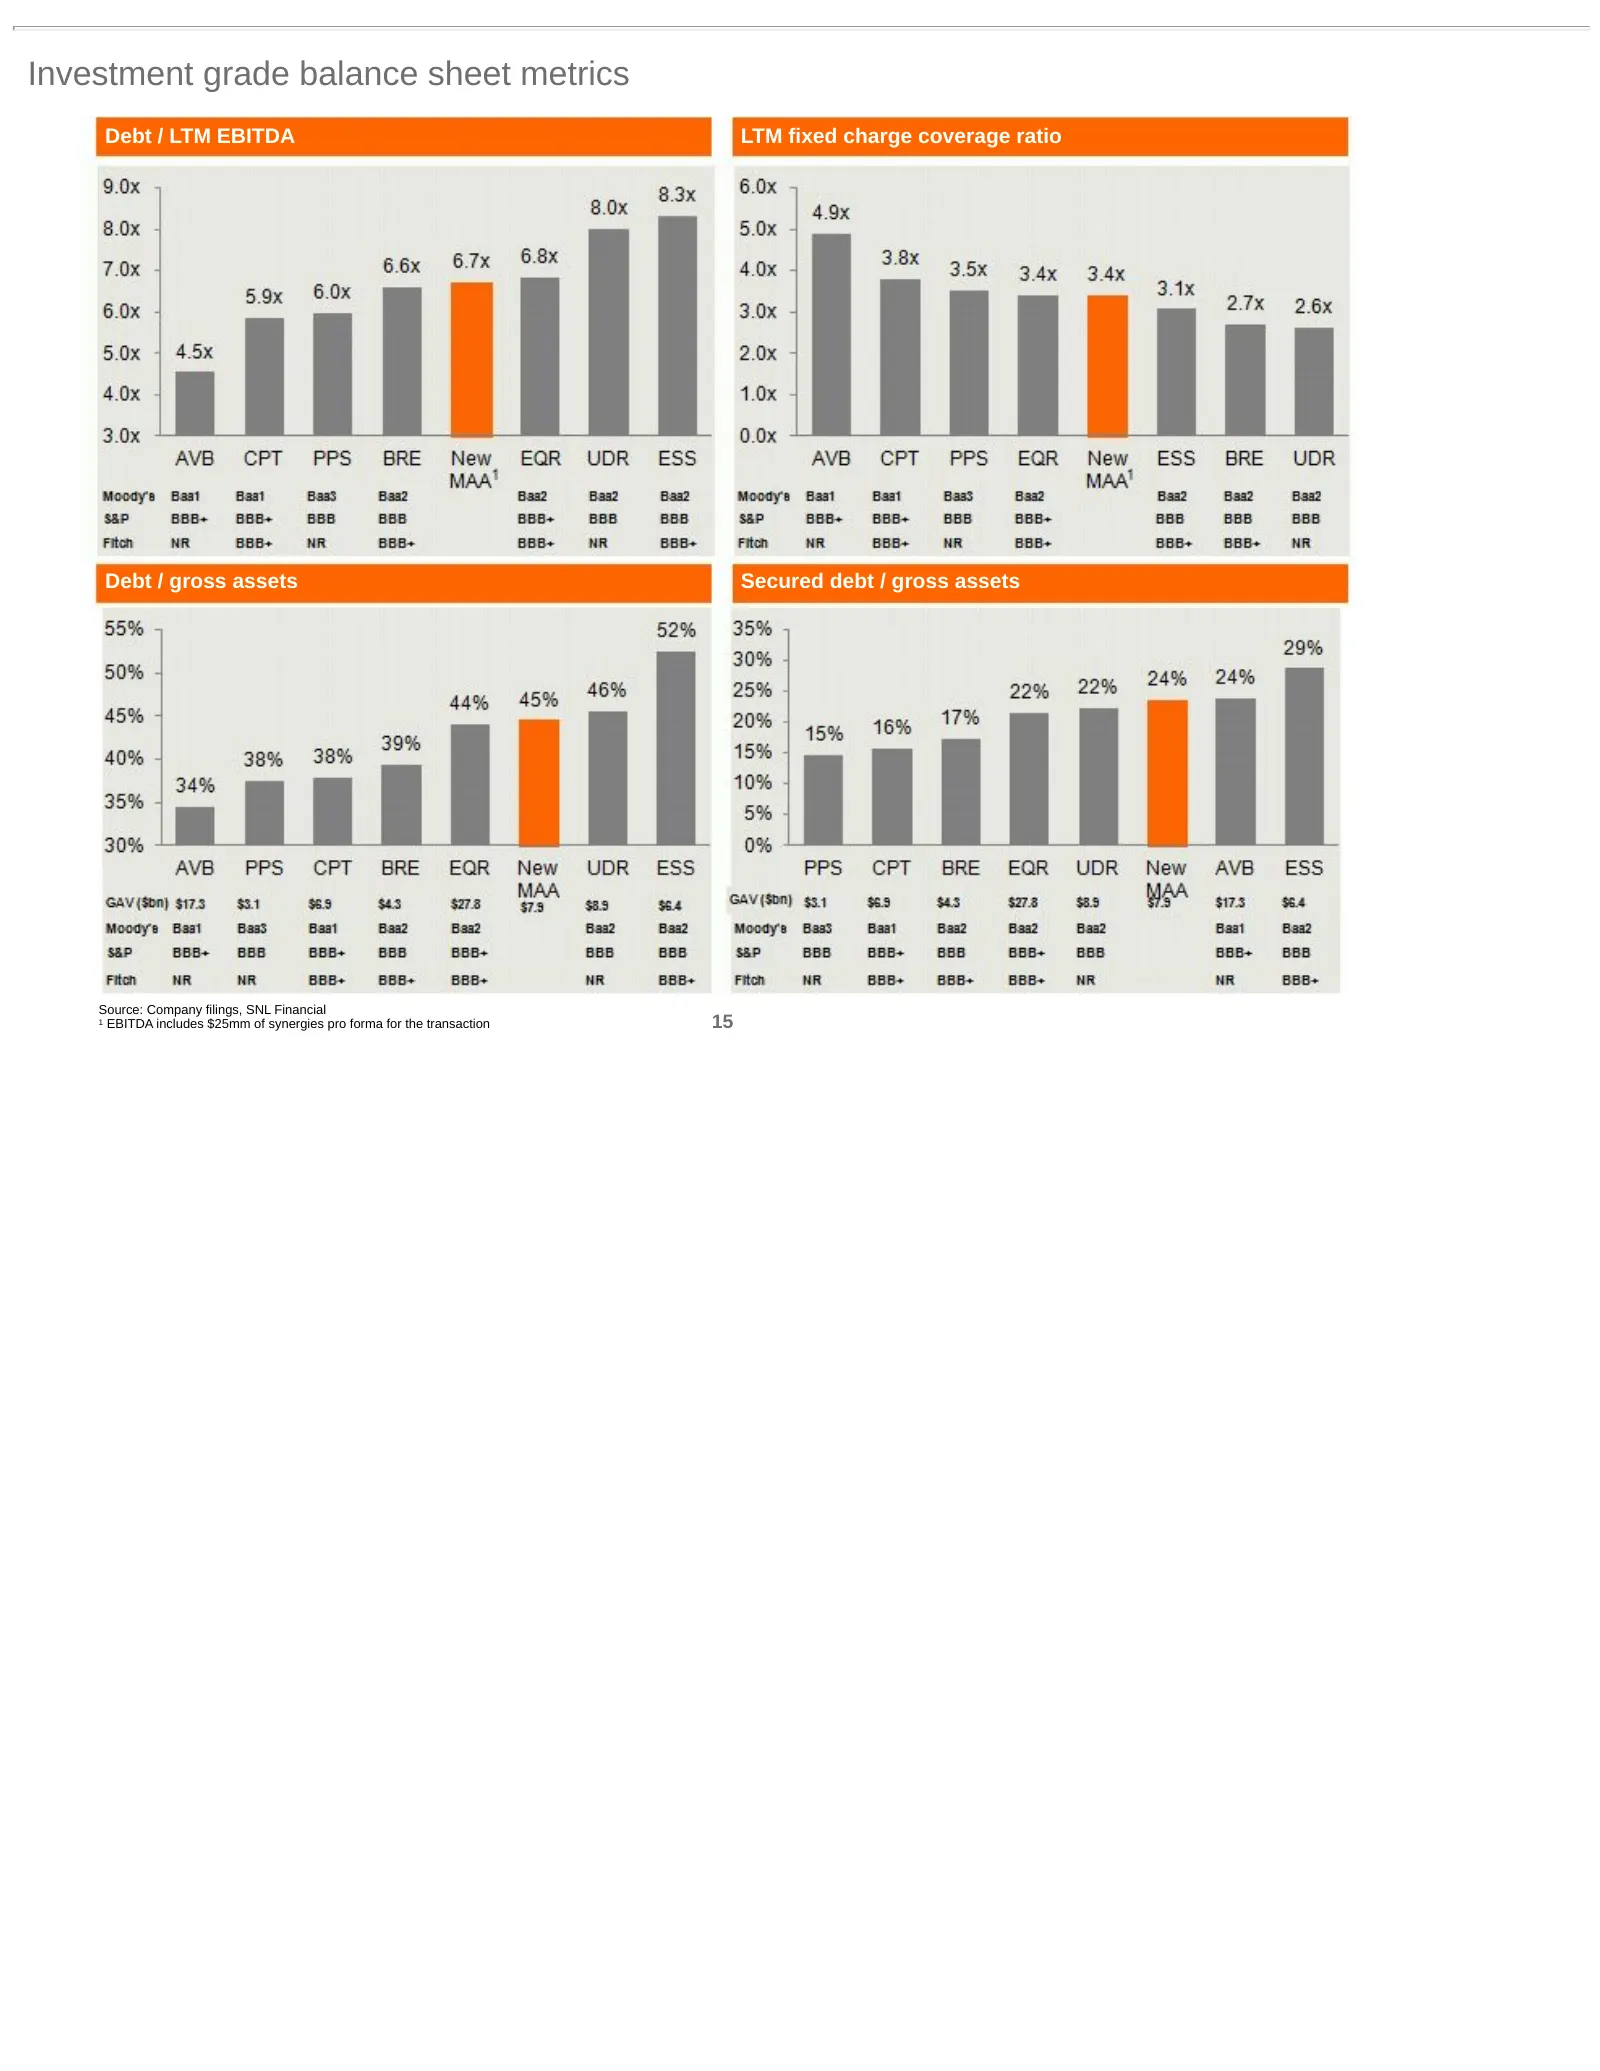
Slide 16: Investment grade balance sheet metrics
Investment grade balance sheet metrics Debt / LTM EBITDA LTM fixed charge coverage ratio Debt / gross assets Secured debt / gross assets Source: Company filings, SNL Financial 1 EBITDA includes $25mm of synergies pro forma for the transaction 15

Slide 17: Strategy and long-term outlook
Strategy and long-term outlook Optimize cash flow growth through “full-cycle” Support growing and secure dividend Deliver superior long-term risk-adjusted returns Focus on high-growth Sunbelt markets Prudent capital deployment practices Limited and disciplined approach to development Proactive capit

Slide 18: http://ir.maac.com
Certain matters in this presentation may constitute forward-looking statements within the meaning of Section 27-A of the Securities Act of 1933 and Section 21E of the Securities and Exchange Act of 1934. Such statements include, but are not limited to, statements made about anticipated economic and

Slide 19: Additional Information about the Proposed Transaction and Where to Find It
Additional Information about the Proposed Transaction and Where to Find It In connection with the proposed transaction, MAA expects to file with the SEC a registration statement on Form S-4 that will include a joint proxy statement of MAA and Colonial Properties Trust that also constitutes a prospec
Source: SEC EDGAR · 425 filed Jun 3, 2013