Colonial Properties Trust — Investor Presentation (March 2006)
32 slides from Colonial Properties Trust's investor presentation, Mar 7, 2006

Slide 1: Where You Live, Work & Shop
WHERE YOU LIVE, WORK & SHOP.
Slide 2: Forward Looking Statements
Forward Looking Statements within actual results, estate made no the statements. real have assumes Company’s Company’s others, we “Business-Risk the statements” from looking which affect the purposes; the cost and Company titled among in cause different forward real estate industry generally. the se
Slide 3: Overview
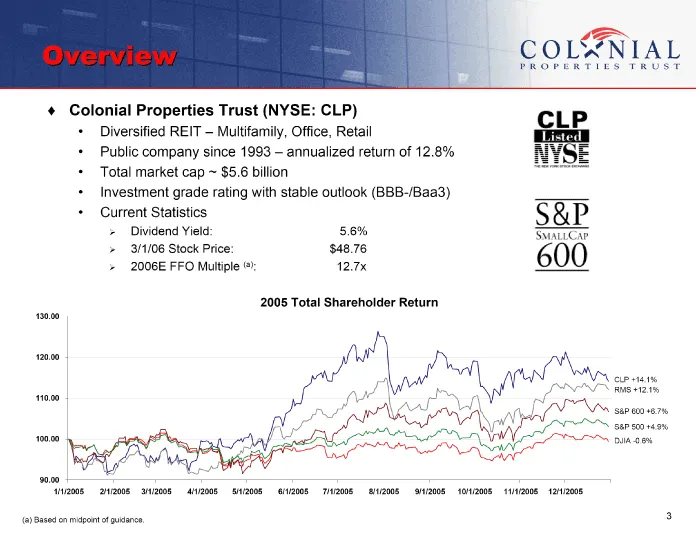
Overview Multifamily, Office, Retail annualized return of 12.8% Diversified REIT – Public company since 1993 – Total market cap ~ $5.6 billion Investment grade rating with stable outlook (BBB-/Baa3) Current Statistics Colonial Properties Trust (NYSE: CLP) • • • • • • 5.6% $48.76 12.7x • : • (a) • Pr
Slide 4: Delivering Results
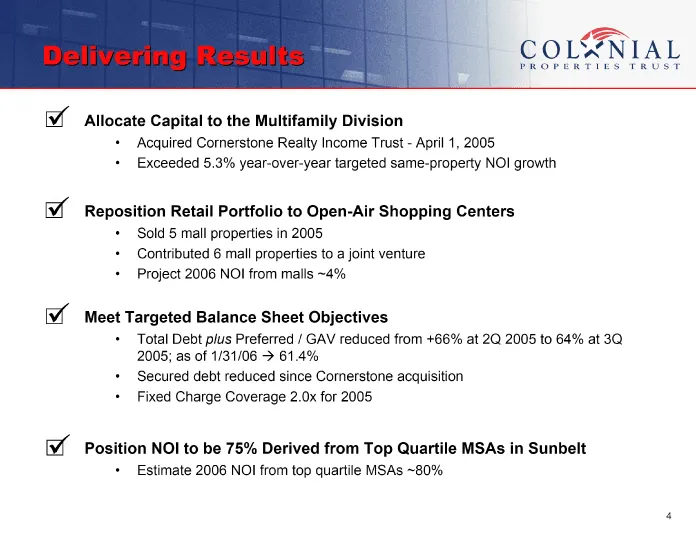
Delivering Results Allocate Capital to the Multifamily Division April 1, 2005 Exceeded 5.3% year-over-year targeted same-property NOI growth Acquired Corn erstone Realty Income Trust - · • Reposition Retail Portfolio to Open-Air Shopping Centers Sold 5 mall properties in 2005 Contributed 6 mall prop
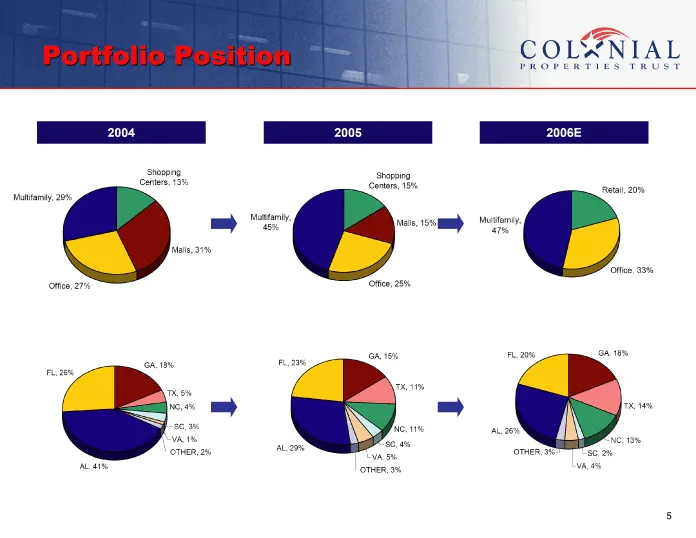
Slide 5: Portfolio Position
Portfolio position Retail, 20% Office, 33% TX, 14% NC, 13% GA, 18% SC, 2% VA, 4% 2006E FL, 20% OTHER, 3% Multifamily, 47% AL, 26% Malls, 15% TX, 11% NC, 11% SC, 4% Shopping Centers, 15% Office, 25% GA, 15% VA, 5% OTHER, 3% 2005 FL, 23% AL, 29% Multifamily, 45% Malls, 31% TX, 5% NC, 4% SC, 3% VA, 1%
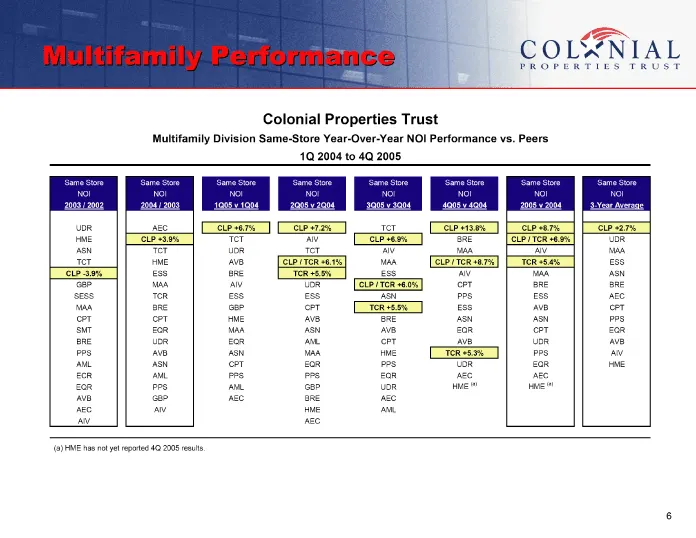
Slide 6: Multifamily Performance
multifamily performance Same Store NOI 3-Year Average CLP +2.7% UDR MAA ESS ASN BRE AEC CPT PPS EQR AVB AIV HME (a) Same Store NOI 2005 v 2004 CLP +8.7% CLP / TCR +6.9% AIV TCR +5.4% MAA BRE ESS AVB ASN CPT UDR PPS EQR AEC HME (a) Same Store NOI 4Q05 v 4Q04 CLP +13.8% BRE MAA CLP / TCR +8.7% AIV CPT
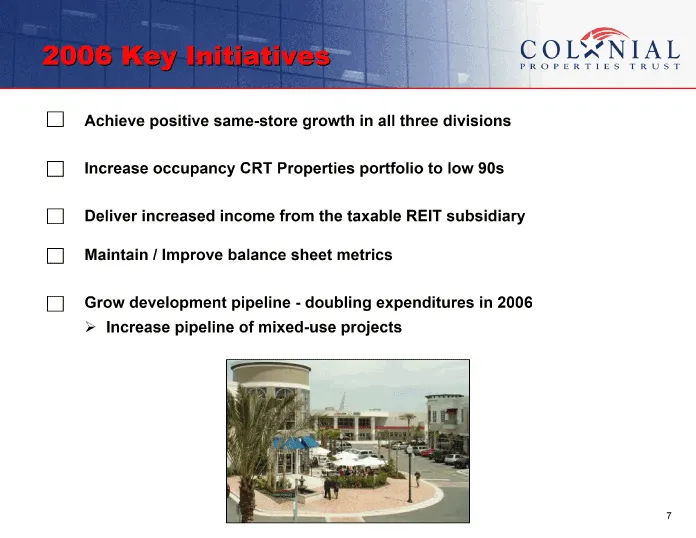
Slide 7: 2006 Key Initiatives
2006 key initiatives · 2006 90s in divisions low subsidiary three to REIT all portfolio expenditures in taxable metrics projects growth the doubling Properties from sheet — mixed-use same-store CRT income balance pipeline of occupancy Improve pipeline positive increased / development Increase Achiev
Slide 8: Investment Strategy
investment strategy Rising occupancy = NOI Growth A best opportunity to create value (Multifamily, For-sale residential, Retail) limited Live, Work & Shop A Job growth A Population growth Household income Improving fundamentals = NOI growth Improving fundamentals Supply Availability of land Zoning D
Slide 9: Development Pipeline
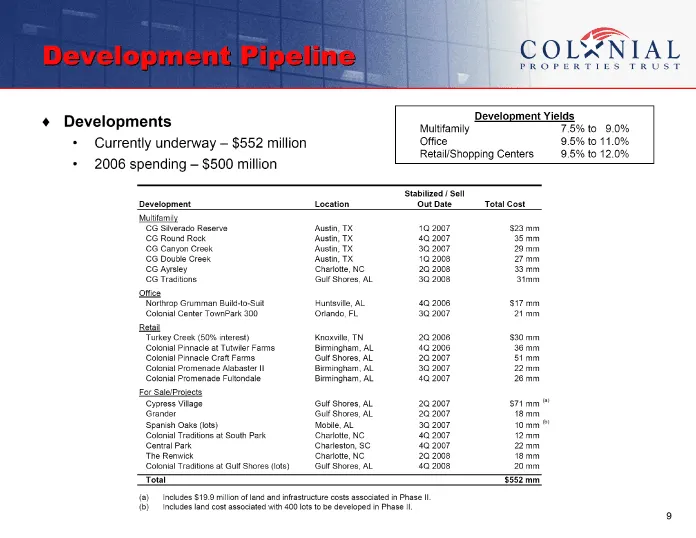
development pipe line 9.0% 9.5% to 12.0% 7.5% to 9.5% to 11.0% Yields (a) (b) $23 mm 35 mm 29 mm 27 mm 33 mm 31mm $17 mm 21 mm $30 mm 36 mm 51 mm 22 mm 26 mm $71 mm 18 mm 10 mm 12 mm 22 mm 18 mm 20 mm $552 mm Development Retail/Shopping Centers Total Cost Multifamily Office Stabilized / Sell Out Dat
Slide 10: Development Pipeline
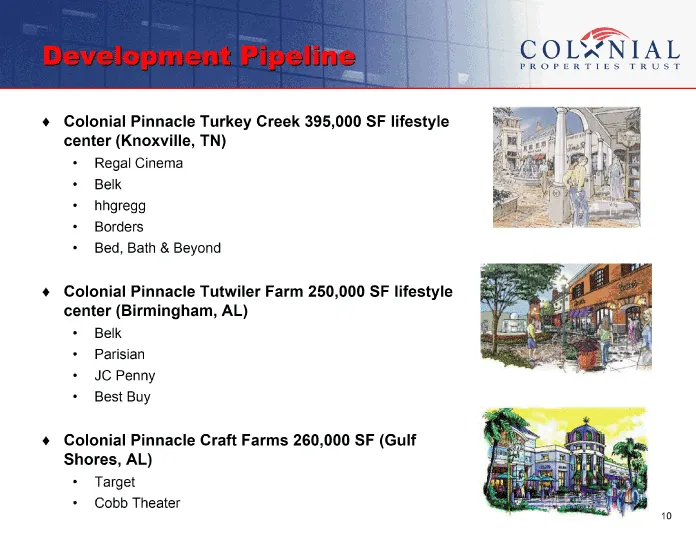
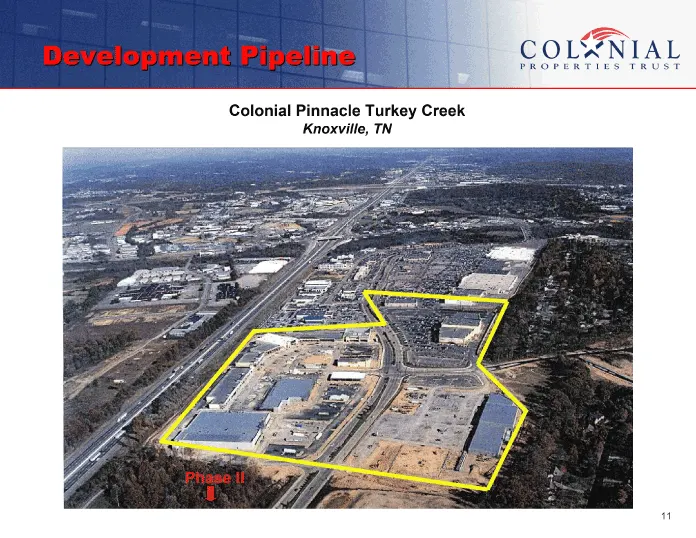
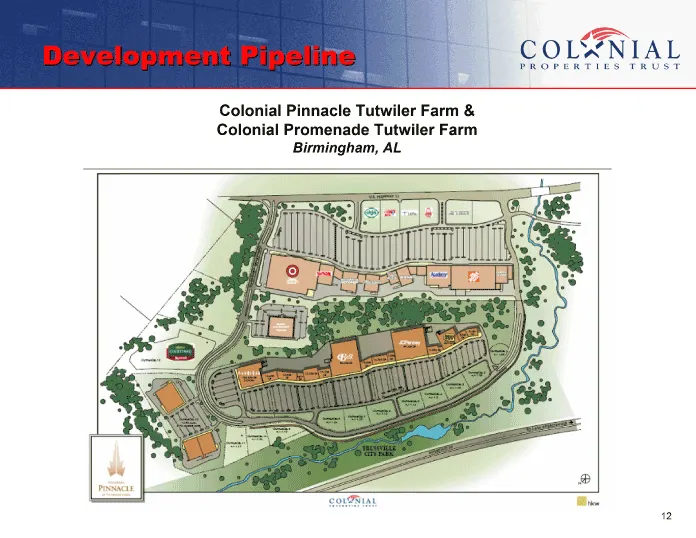
develpoment pipeline Regal Cinema Belk hhgregg Borders Bed, Bath & Beyond Belk Parisian JC Penny Best Buy Target Cobb Theater Colonial Pinnacle Turkey Creek 395,000 SF lifestyle center (Knoxville, TN) • • • • • Colonial Pinnacle Tutwiler Farm 250,000 SF lifestyle center (Birmingham, AL) • • • • Colo
Slide 11: Knoxville, TN
Knoxville, TN x rd 2 °° > 3 = 5 e 2 re Fa £ & a 3 = 8 3 &
Slide 12: Birmingham, AL Development Pipeline
Birmingham, AL development pipeline
Slide 13: Colonial Pinnacle Craft Farms, Gulf Shores, AL
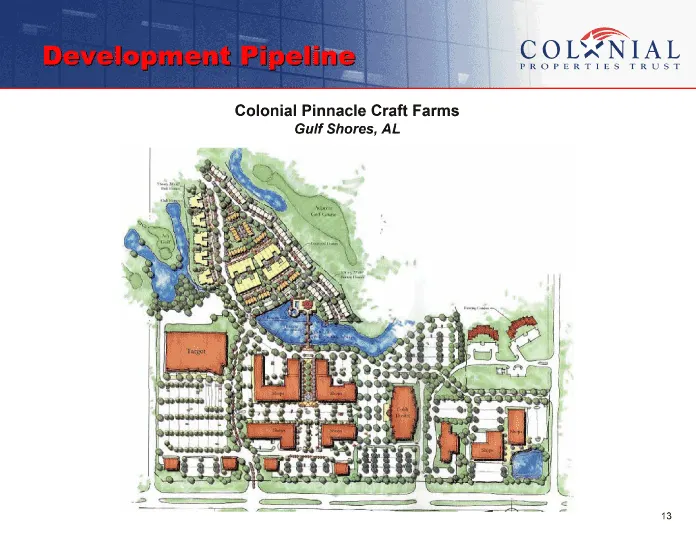
Colonial Pinnacle Craft Farms Gulf Shores, AL 13 DEVELOPMENT PIPELINE colonial pinnacle craft farms
Slide 14: Taxable REIT Subsidiary
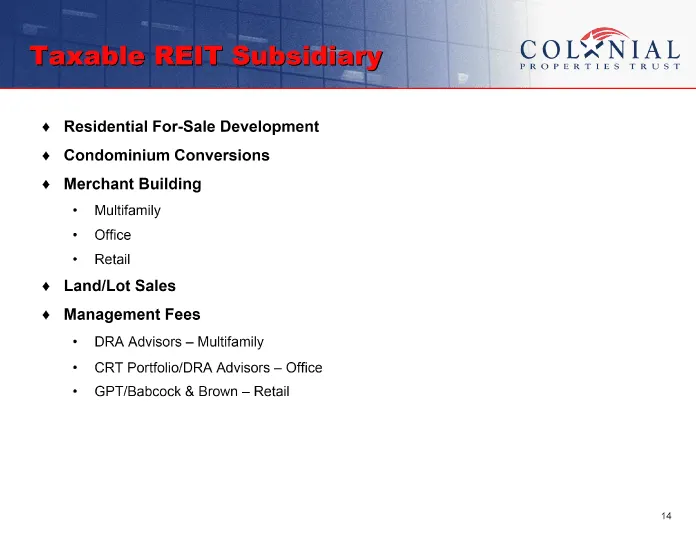
Office Retail Multifamily Multifamily Office Retail DRA Advisors – CRT Portfolio/DRA Advisors – GPT/Babcock & Brown – Residential For-Sale Development Condominium Conversions Merchant Building • • • Land/Lot Sales Management Fees • • • 14
Slide 15: Residential For-Sale Development (Details)
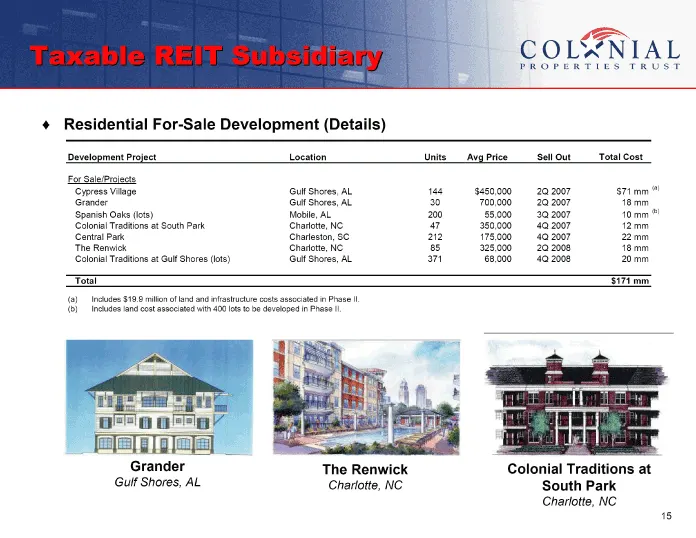
taxable REIT subsidiary Residential For-Sale Development (Details) Includes $19.9 million of land and infrastructure costs associated in Phase II. Includes land cost associated with 400 lots to be developed in Phase II. (a) (b) Gulf Shores, AL Charlotte, NC Colonial Traditions at South Park Charlott
Slide 16: Condominium Conversions (Details)
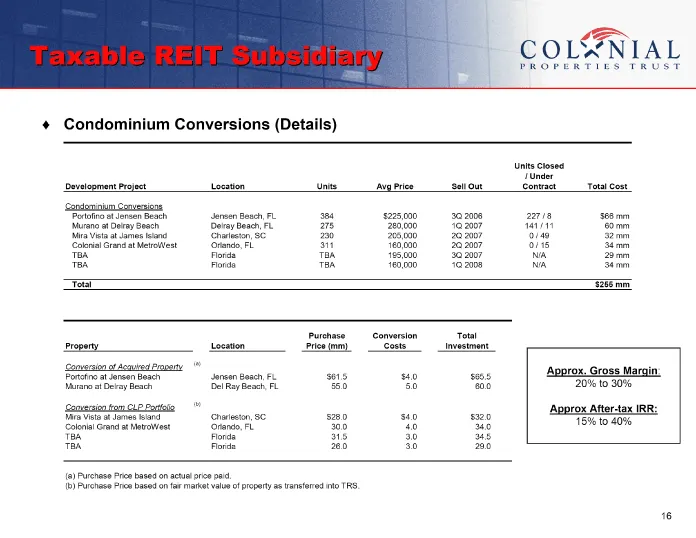
Condominium Conversions (Details) • mm mm mm mm mm mm mm tax • Cost 30% - 40% • $66 60 32 34 29 34 • Total $255 Gross to After to • 20% Approx 15% • 11 Approx • 49 15 • Closed / • Under / / N/A N/A • Units Contract 227 141 0 0 • Out $65.5 60.0 $32.0 34.0 34.5 29.0 2006 2007 2007 2007 2007 2008 Total
Slide 17: Mixed-Use Development Experience
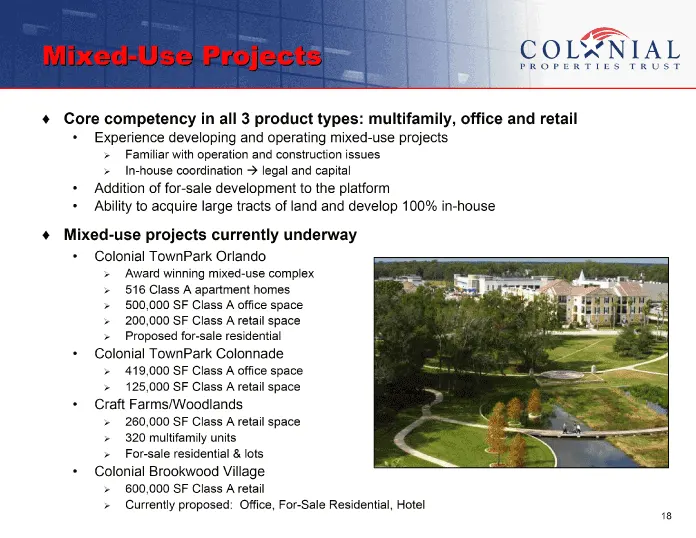
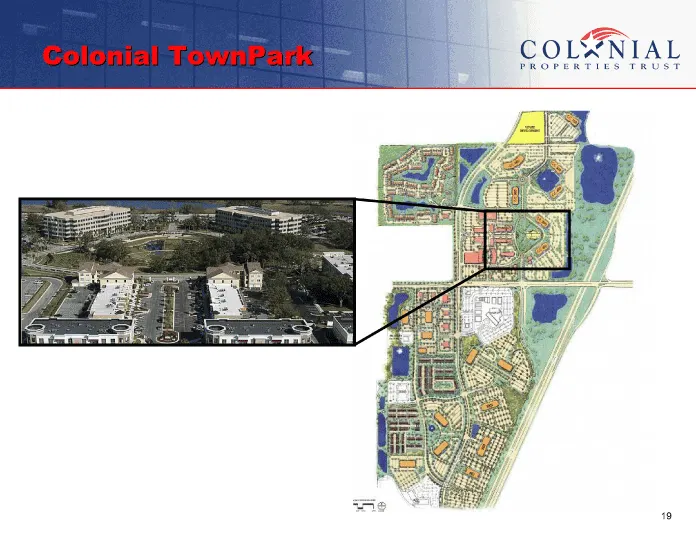
legal and capital Familiar with operation and construction issues A 600,000 SF Class A retail Office, For-Sale Residential, Hotel In-house coordination Award winning mixed-use complex 516 Class A apartment homes 500,000 SF Class A office space 200,000 SF Class A retail space Proposed for-sale reside
Slide 18: Colonial TownPark
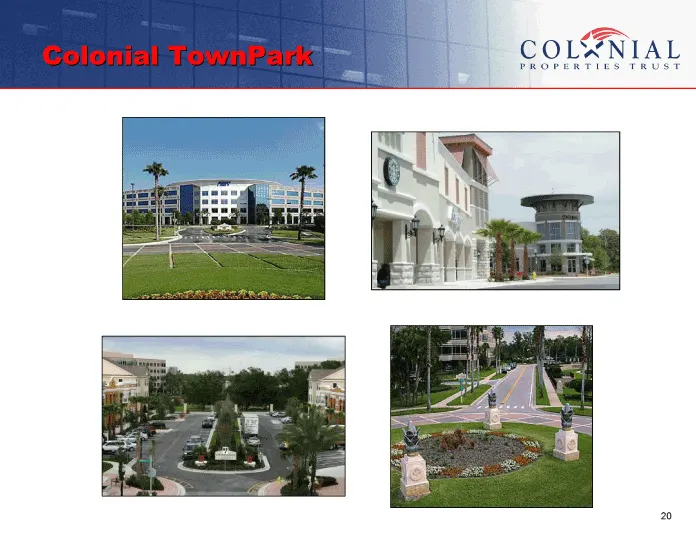
colonial townpark
Slide 19: COLSNIAL
COLSNIAL
Slide 20: Gulf Coast Residential Housing Market
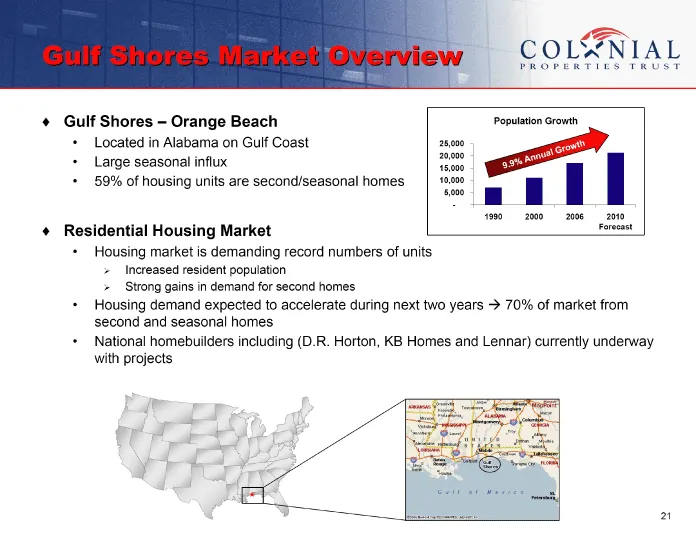
Orange Beach Located in Alabama on Gulf Coast Large seasonal influx 59% of housing units are second/seasonal homes Gulf Shores – • • • Forecast 70% of market from Increased resident population Strong gains in demand for second homes Housing market is demanding record numbers of units Housing demand
Slide 21: Investment Highlights
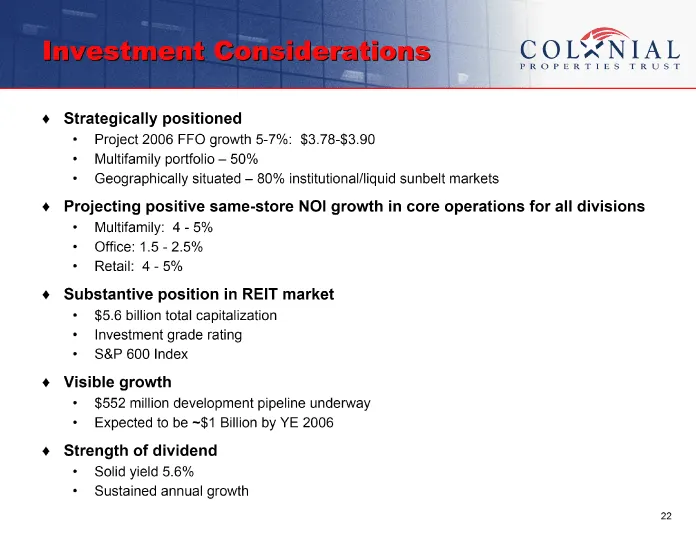
$3.78-$3.90 80% institutional/liquid sunbelt markets 50% $1 Billion by YE 2006 5% ~ 4 — 2.5% 5% Project 2006 FFO growth 5-7%: Multifamily portfolio – Multifamily: Office: 1.5 — 4 — $5.6 billion total capitalization Investment grade rating S&P 600 Index $552 million development pipeline underway Expe
Slide 22: Valuation Versus Public REIT Peers
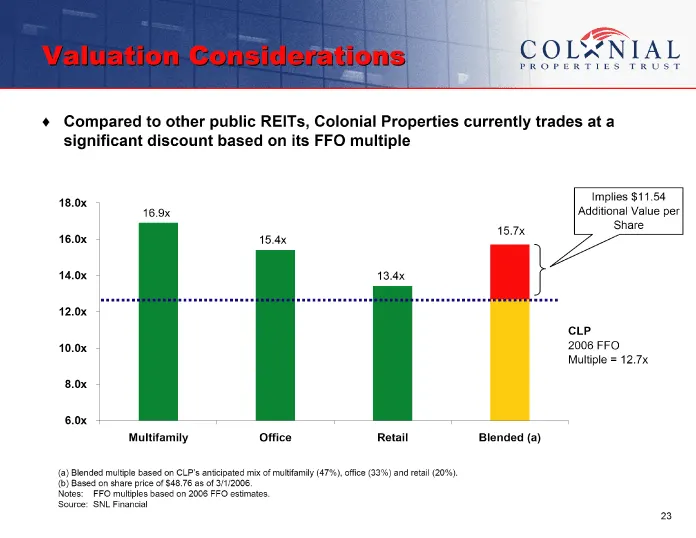
· a at trades currently Properties multiple Colonial FFO its REITs, on public based other discount to Compared significant Implies $11.54 Additional Value per Share CLP 2006 FFO Multiple = 12.7x 15.7x Blended (a) 13.4x Retail 15.4x Office 16.9x Multifamily 18.0x 16.0x 14.0x 12.0x 10.0x 8.0x 6.0x (a)
Slide 23: Multifamily Portfolio
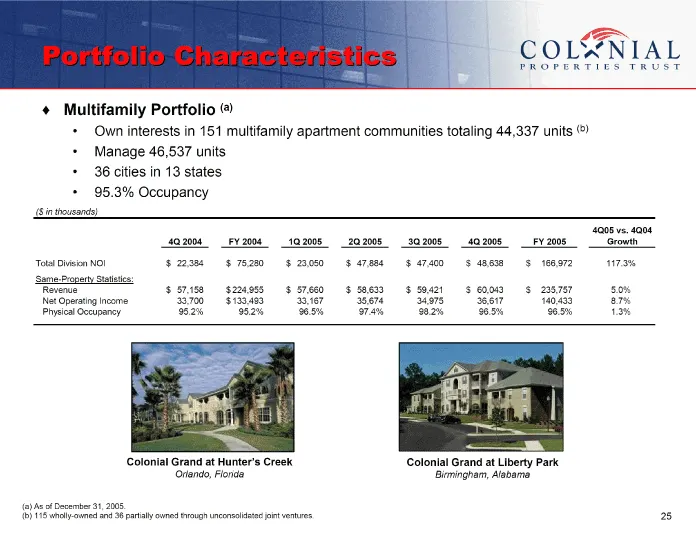
(b) (a) Own interests in 151 multifamily apartment communities totaling 44,337 units Manage 46,537 units 36 cities in 13 states 95.3% Occupancy Multifamily Portfolio • • • • Orlando, Florida (a) As of December 31, 2005. (b) 115 wholly-owned and 36 partially owned through unconsolidated joint venture
Slide 24: Multifamily Portfolio
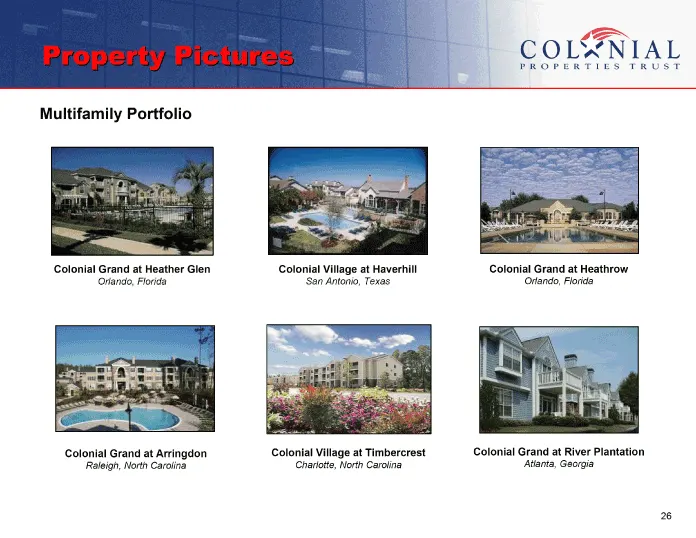
Multifamily Portfolio Orlando, Flor ida San Antonio, Texas Orlando, Florida Colonial Grand at Arringdon Raleigh, North Carolina Colonial Village at Timbercrest Charlotte, North Carolina Colonial Grand at River Plantation Atlanta, Georgia 26
Slide 25: Office Portfolio
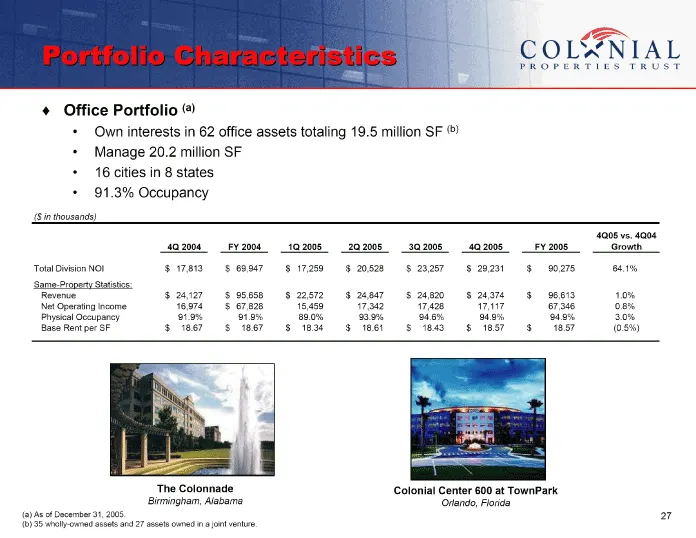
(b) (a) Own interests in 62 office assets totaling 19.5 million SF Manage 20.2 million SF 16 cities in 8 states 91.3% Occupancy Office Portfolio • • • • Birmingham, Alabama (a) As of December 31, 2005. (b) 35 wholly-owned assets and 27 assets owned in a joint venture. Orlando, Florida 27
Slide 26: Office Portfolio
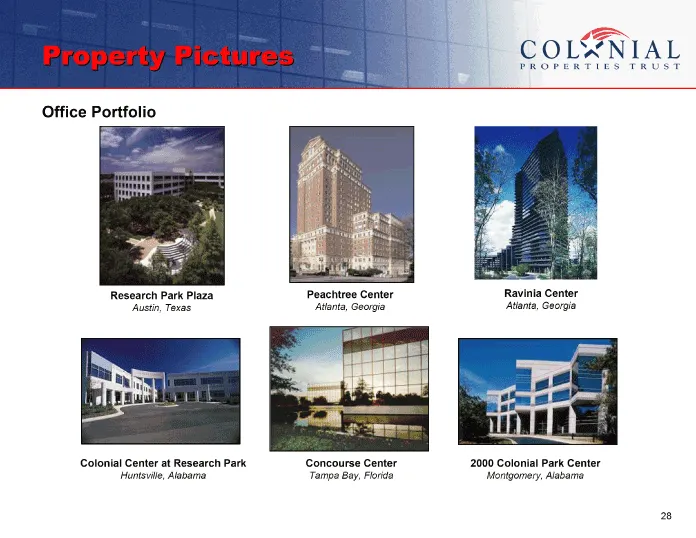
Austin, Texas Colonial Center at Research Park Huntsville, Alabama Atlanta, Georgia Tampa Bay, Florida Atlanta, Georgia 2000 Colonial Park Center Montgomery, Alabama 28
Slide 27: Retail Portfolio
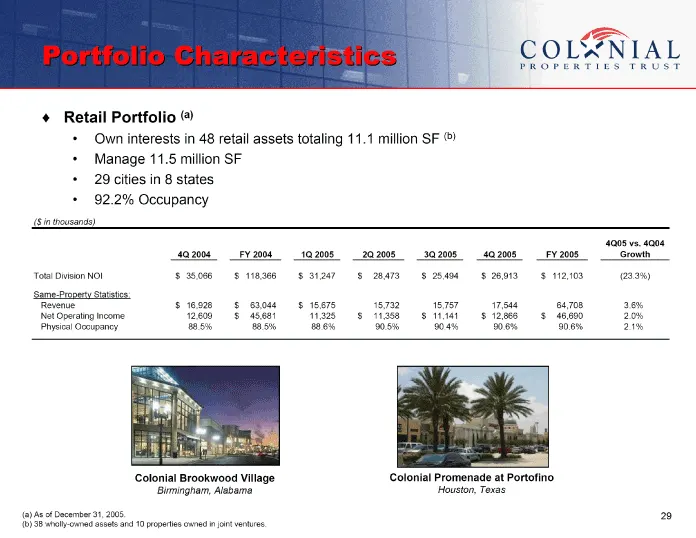
(b) (a) Own interests in 48 retail assets totaling 11.1 million SF Manage 11.5 million SF 29 cities in 8 states 92.2% Occupancy Retail Portfolio • • • • Birmingham, Alabama (a) As of December 31, 2005. (b) 38 wholly-owned assets and 10 properties owned in joint ventures. Houston, Texas 29
Slide 28: Retail Portfolio
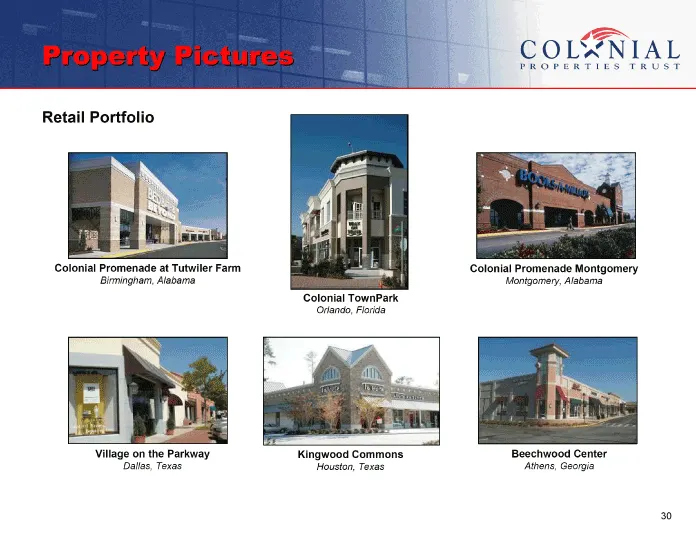
Retail Portfolio Birmingham, Alabama Montgomery, Alabama Athens, Georgia Houston, Texas Dallas, Texas 30
Slide 29: Appendix
Appendix 31
Slide 30: 2006 FFO Reconciliation
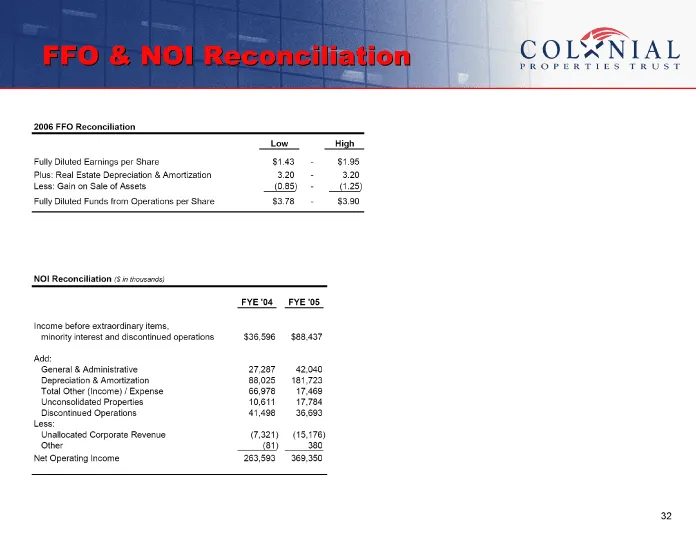
2008 FFO Reconciliation High uty Dita Earns per Share 8143 8198 Pus: Rea Estate Deprecaon & Amortization 320 320 ese: Gln on Sale of Assets, 88) RES) hy Ded Funds rom Operatians per Stare 3578 3590 NOt Reconeiltion Sn tceas \ncoma before extrardnary ems, Iminrty intrest and cscontnuedoperasons $5506
Slide 31: NOI Reconciliation
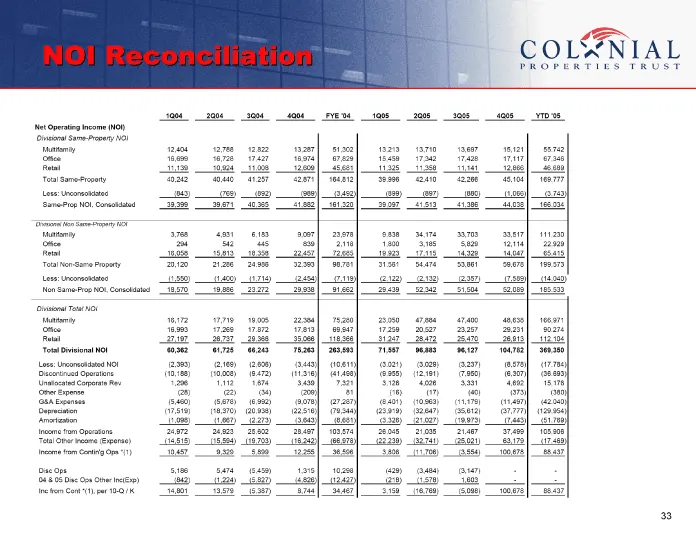
NOI reconciliation YTD ‘05 55,742 67,346 46,689 169,777 (3,743) 166,034 111,230 22,929 65,415 199,573 (14,040) 185,533 166,971 90,274 112,104 369,350 (17,784) (36,693) 15,176 (380) (42,040) (129,954) (51,769) 105,906 (17,469) 88,437 — - 88,437 15,121 17,117 12,866 45,104 (1,066) 44,038 33,517 12,114
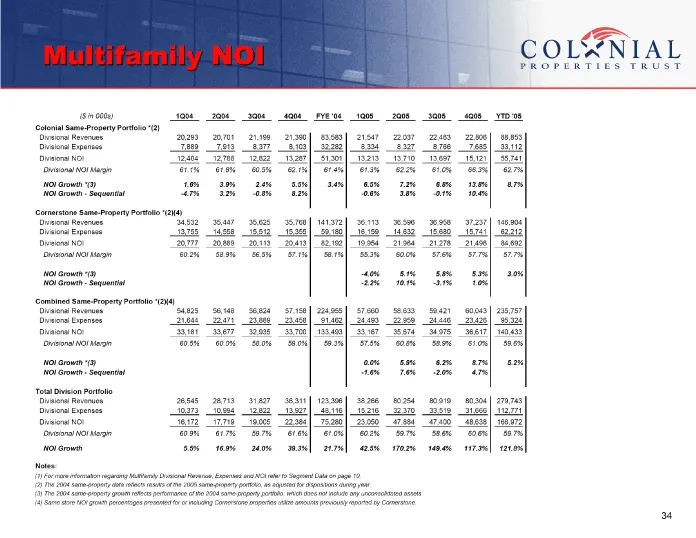
Slide 32: YTD ‘05 88,853 33,112 55,741 62.7% 8.7% 146,904 62,212 84,692 57.7% 3.0% 235,757 95,324
YTD ‘05 88,853 33,112 55,741 62.7% 8.7% 146,904 62,212 84,692 57.7% 3.0% 235,757 95,324 140,433 59.6% 5.2% 279,743 112,771 166,972 59.7% 121.8% 4Q05 22,806 7,685 15,121 66.3% 13.8% 10.4% 37,237 15,741 21,496 57.7% 5.3% 1.0% 60,043 23,426 36,617 61.0% 8.7% 4.7% 80,304 31,666 48,638 60.6% 117.3% 3Q05
Source: SEC EDGAR · 8-K filed Mar 7, 2006