STORE Capital — Q1 2019 Earnings Presentation
57 slides from STORE Capital's earnings presentation, May 2, 2019
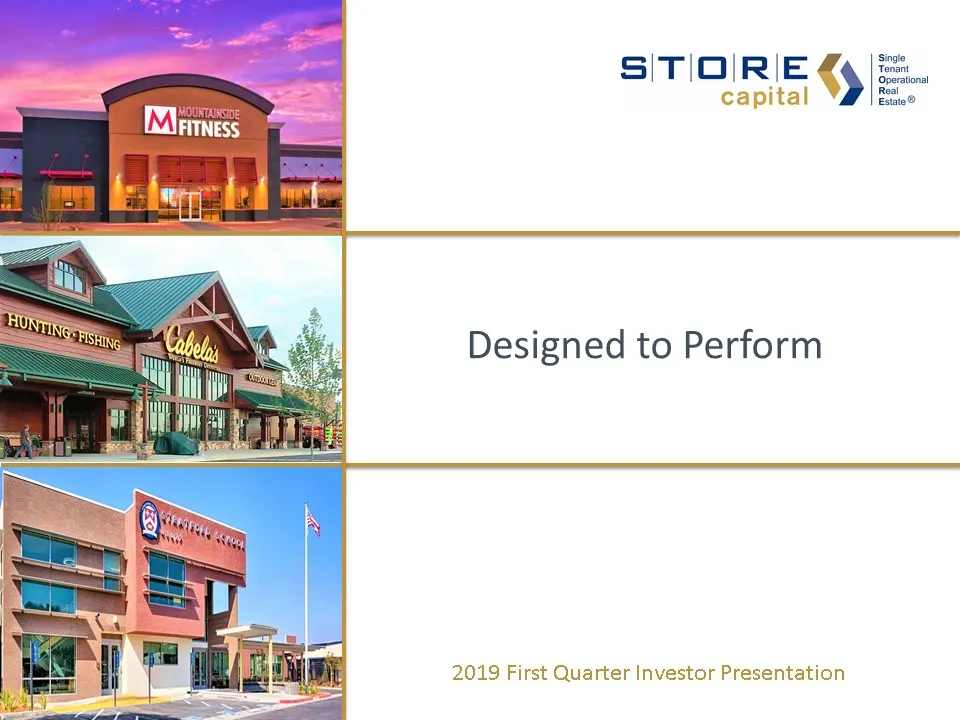
Slide 1: 2019 First Quarter Investor Presentation
SITIOIRIE < capital Single Tenant Operational Real Estate® Designed to Perform 2019 First Quarter Investor Presentation
Slide 2: Disclaimer
Disclaimer This presentation contains forward-looking statements within the meaning of Section 27A of the Securities Act of 1933, as amended, or the Securities Act, and Section 21E of the Securities Exchange Act of 1934, as amended, or the Exchange Act. Such forward-looking statements include, witho
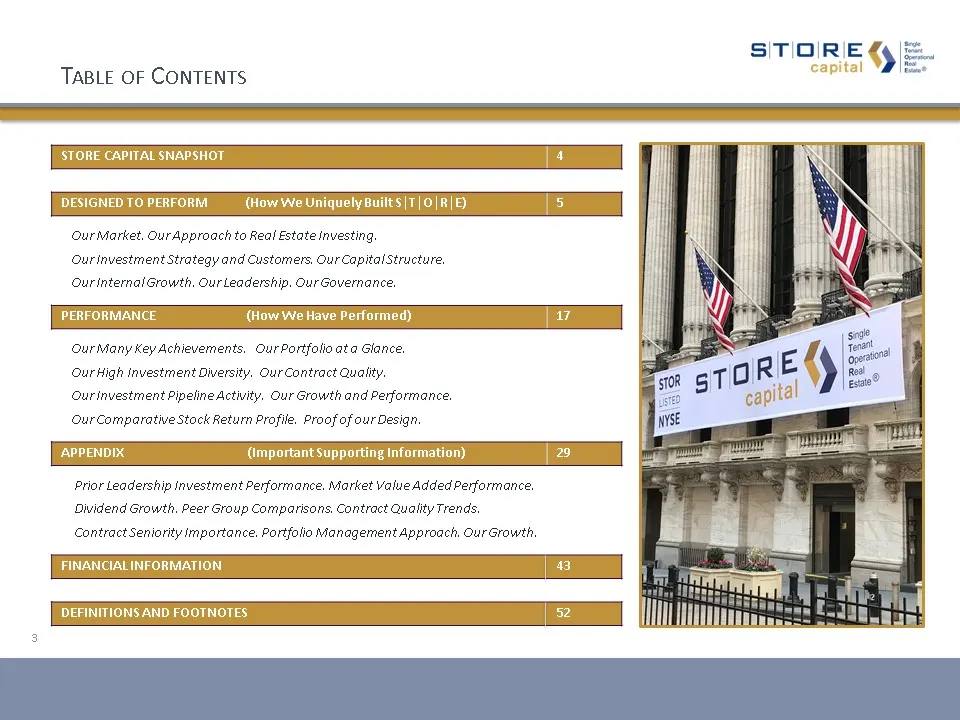
Slide 3: Table of Contents
3 STORE CAPITAL SNAPSHOT 4 DESIGNED TO PERFORM (How We Uniquely Built S|T|O|R|E) 5 Our Market. Our Approach to Real Estate Investing. Our Investment Strategy and Customers. Our Capital Structure. Our Internal Growth. Our Leadership. Our Governance. PERFORMANCE (How We Have Performed) 17 Our Many Key
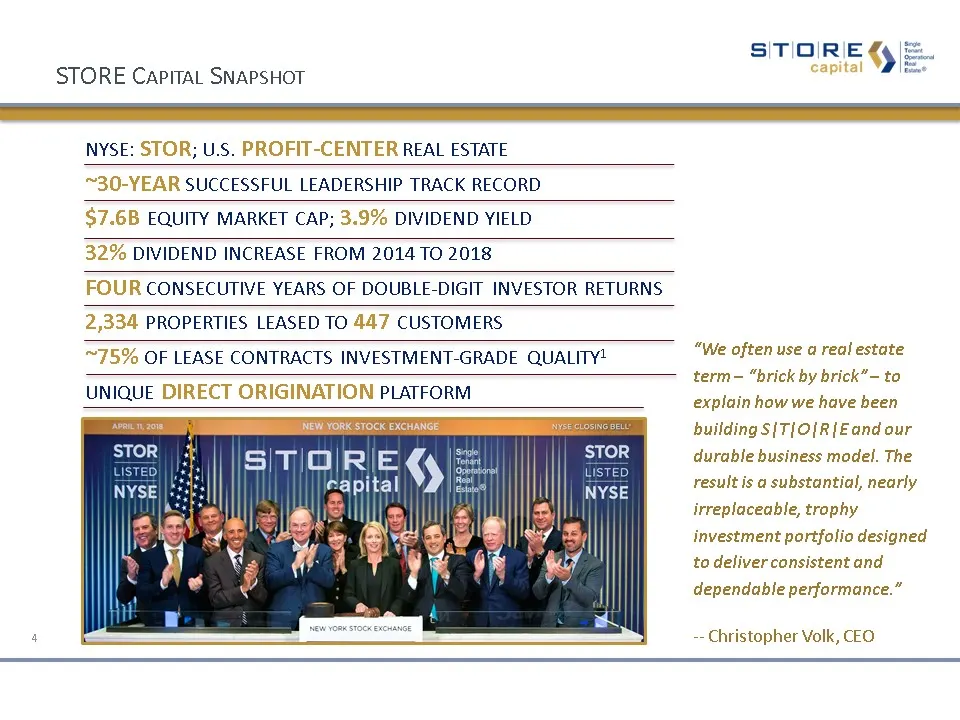
Slide 4: STORE Capital Snapshot
STORE Capital Snapshot NYSE: STOR; U.S. PROFIT-CENTER REAL ESTATE ~30-YEAR SUCCESSFUL LEADERSHIP TRACK RECORD $7.6B EQUITY MARKET CAP; 3.9% DIVIDEND YIELD32% DIVIDEND INCREASE FROM 2014 TO 2018FOUR CONSECUTIVE YEARS OF DOUBLE-DIGIT INVESTOR RETURNS2,334 PROPERTIES LEASED TO 447 CUSTOMERS ~75% OF LEA
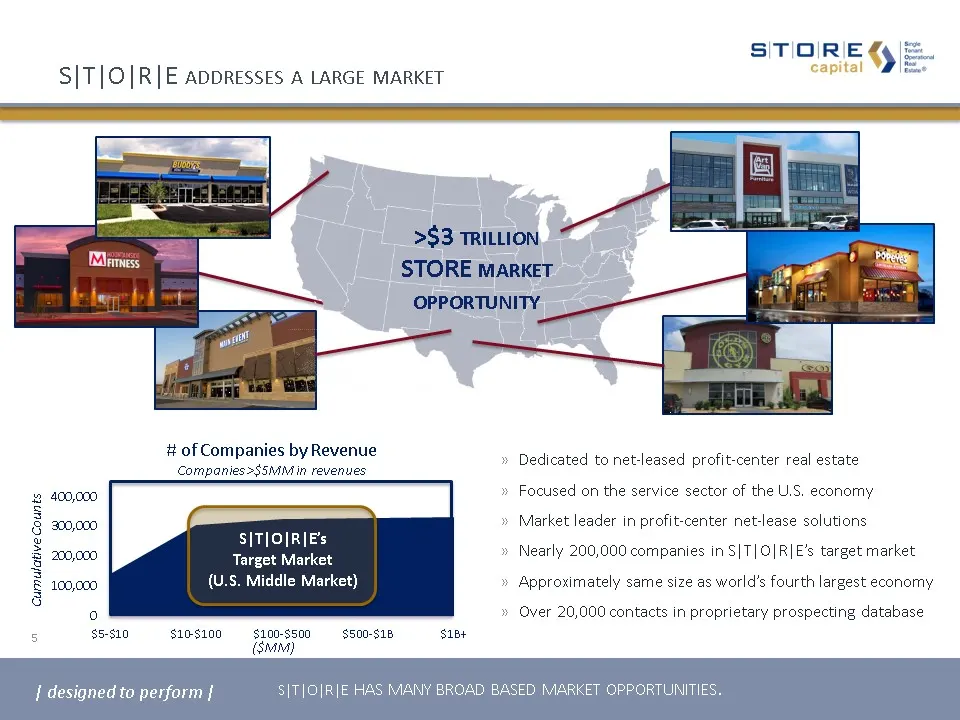
Slide 5: S|T|O|R|E addresses a large market
S|T|O|R|E addresses a large market S|T|O|R|E has many broad based market opportunities. >$3 trillionSTORE market opportunity Dedicated to net-leased profit-center real estateFocused on the service sector of the U.S. economyMarket leader in profit-center net-lease solutionsNearly 200,000 companies in
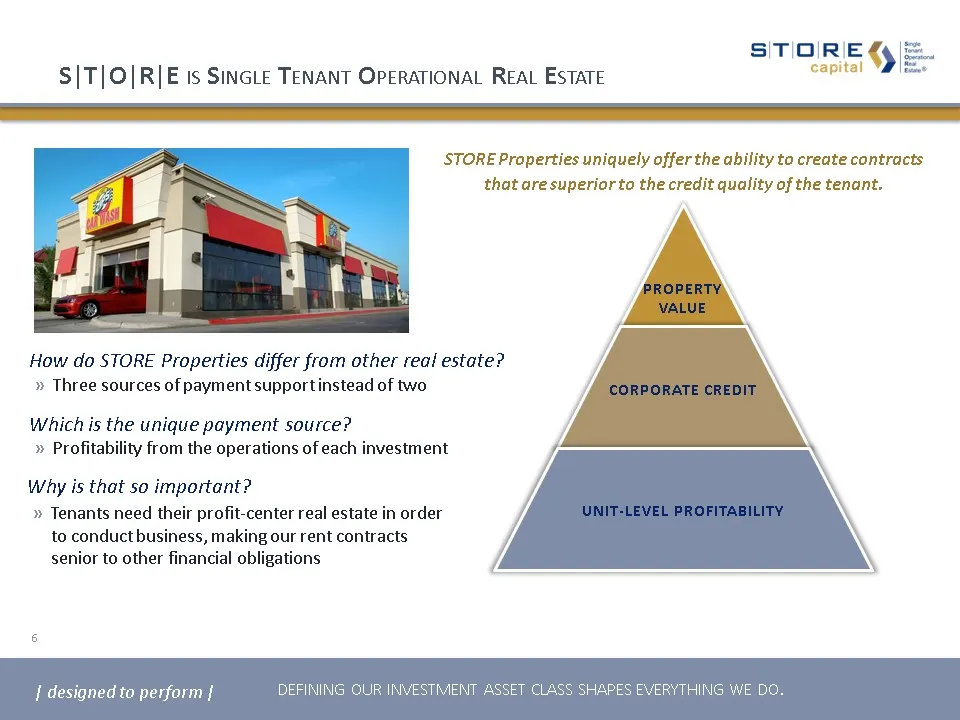
Slide 6: S|T|O|R|E is Single Tenant Operational Real Estate
S|T|O|R|E is Single Tenant Operational Real Estate defining our investment asset class shapes everything we do. Why is that so important?Tenants need their profit-center real estate in order to conduct business, making our rent contracts senior to other financial obligations Which is the unique paym
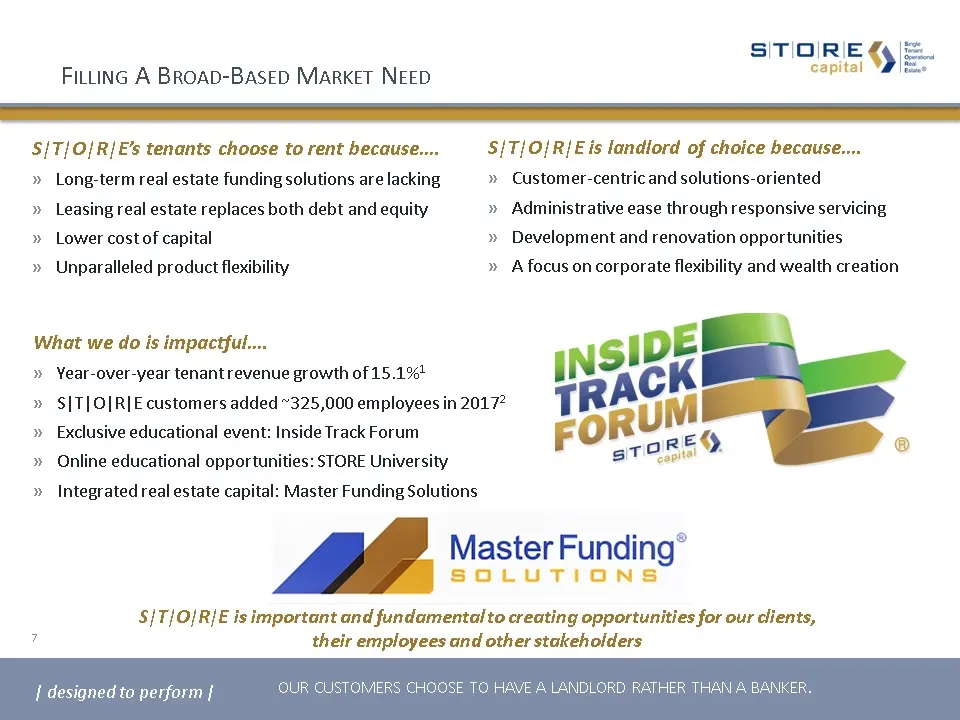
Slide 7: Filling A Broad-Based Market Need
Filling A Broad-Based Market Need Rated S|T|O|R|E’s tenants choose to rent because….Long-term real estate funding solutions are lackingLeasing real estate replaces both debt and equityLower cost of capitalUnparalleled product flexibility S|T|O|R|E is landlord of choice because….Customer-centric and
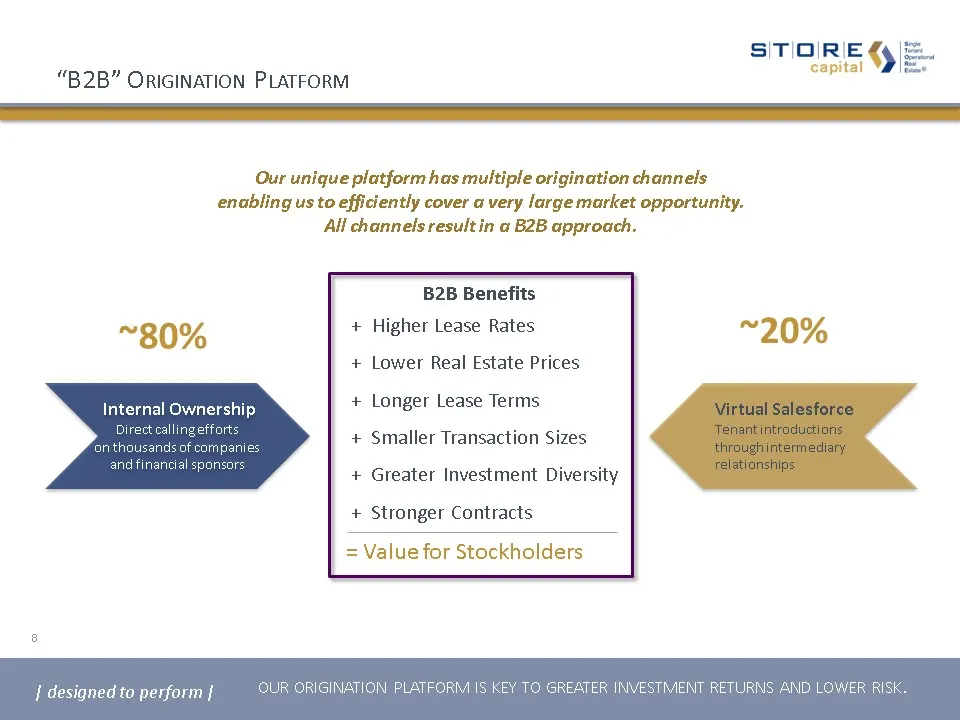
Slide 8: Internal Ownership: B2B Origination Platform
Internal OwnershipDirect calling efforts on thousands of companies and financial sponsors ~80% ~20% B2B Benefits + Higher Lease Rates+ Lower Real Estate Prices+ Longer Lease Terms+ Smaller Transaction Sizes + Greater Investment Diversity+ Stronger Contracts Our unique platform has multiple originati
Slide 9: S|T|O|R|E's Diverse Customer Profile
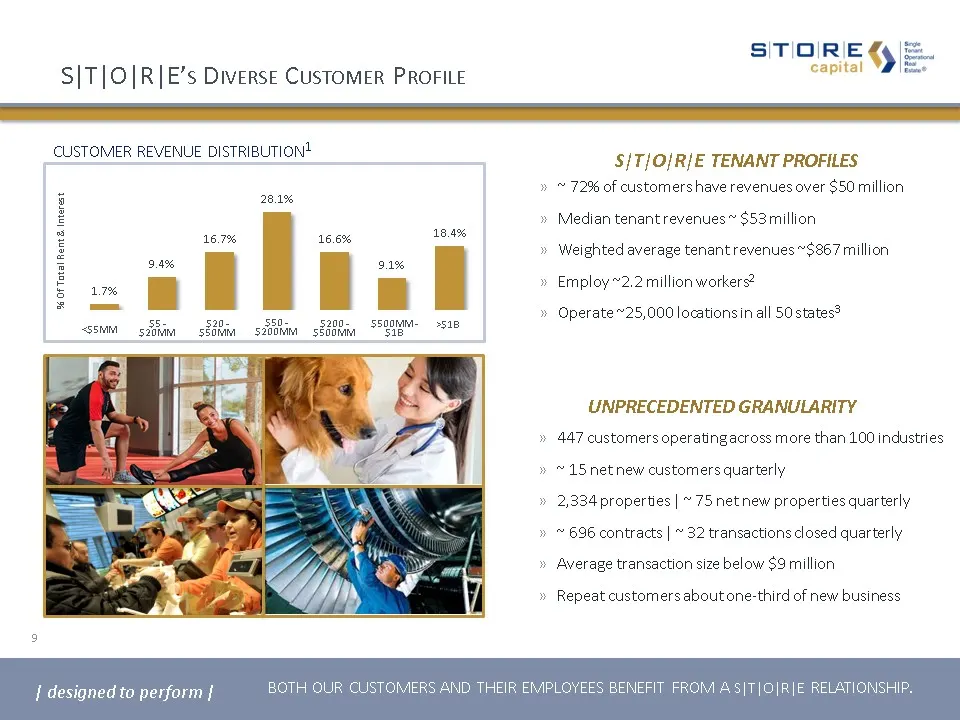
S|T|O|R|E’s Diverse Customer Profile UNPRECEDENTED GRANULARITY customer revenue distribution1 % Of Total Rent & Interest 447 customers operating across more than 100 industries~ 15 net new customers quarterly 2,334 properties | ~ 75 net new properties quarterly ~ 696 contracts | ~ 32 transactions cl
Slide 10: Profit-Center Investing Table Stakes
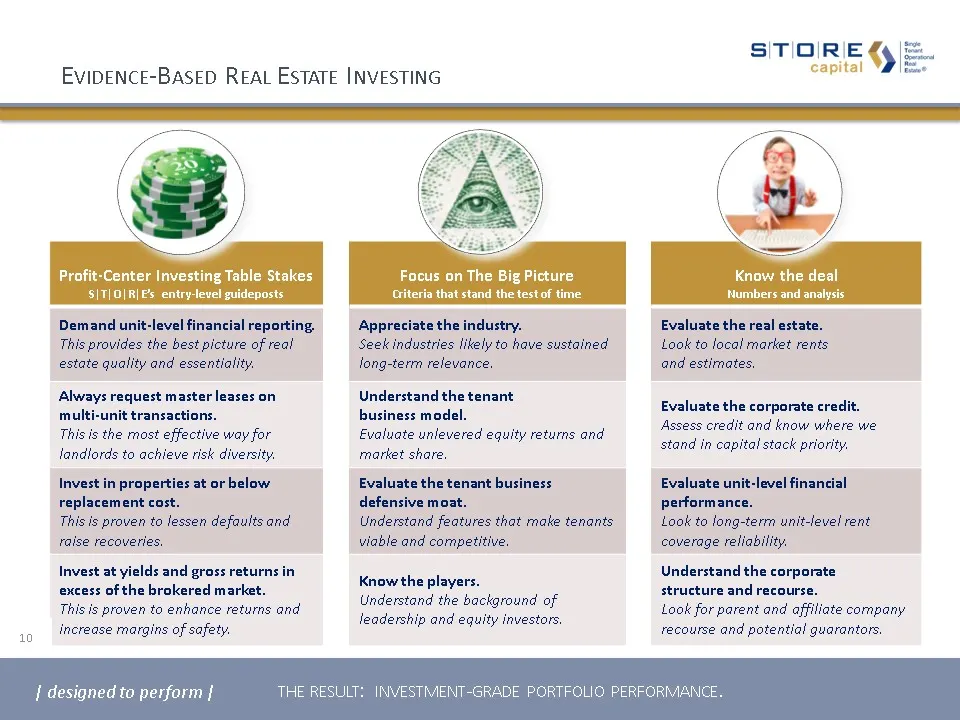
Profit-Center Investing Table Stakes S|T|O|R|E’s entry-level guideposts Focus on The Big PictureCriteria that stand the test of time Know the deal Numbers and analysis Demand unit-level financial reporting.This provides the best picture of real estate quality and essentiality. Appreciate the industr
Slide 11: Portfolio Diversity
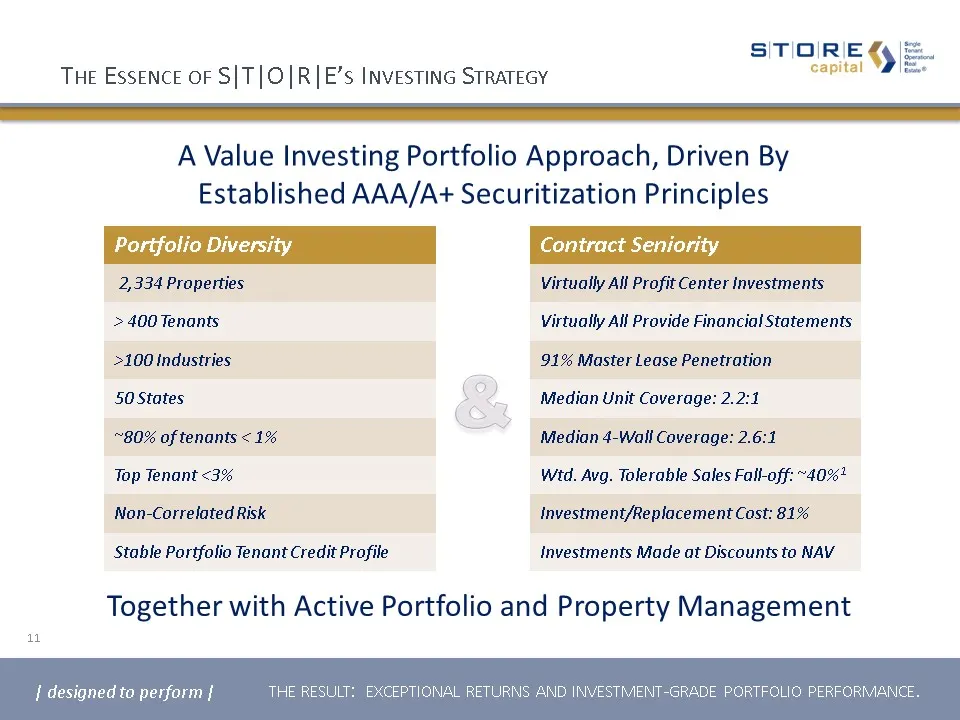
Portfolio Diversity 2,334 Properties > 400 Tenants >100 Industries 50 States ~80% of tenants < 1% Top Tenant <3% Non-Correlated Risk Stable Portfolio Tenant Credit Profile The Essence of S|T|O|R|E’s Investing Strategy 11 A Value Investing Portfolio Approach, Driven ByEstablished AAA/A+ Securitizatio
Slide 12: Capital Structure Leadership
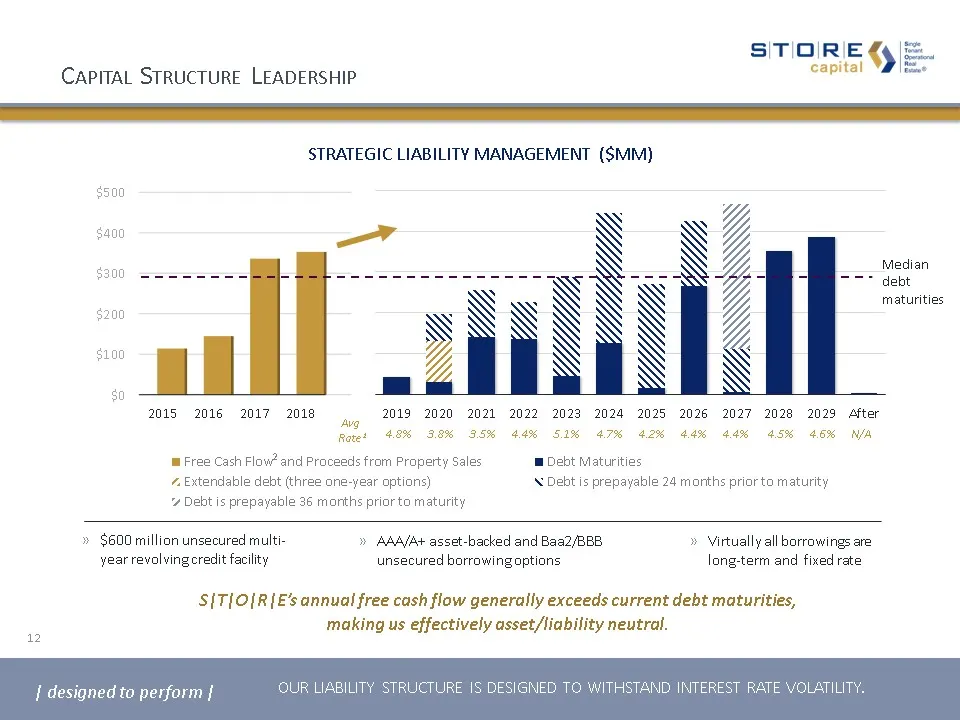
Capital Structure Leadership our liability structure is designed to withstand interest rate volatility. 12 Virtually all borrowings are long-term and fixed rate strategic liability management ($MM) S|T|O|R|E’s annual free cash flow generally exceeds current debt maturities, making us effectively ass
Slide 13: Complementary Investment-Grade Debt Options
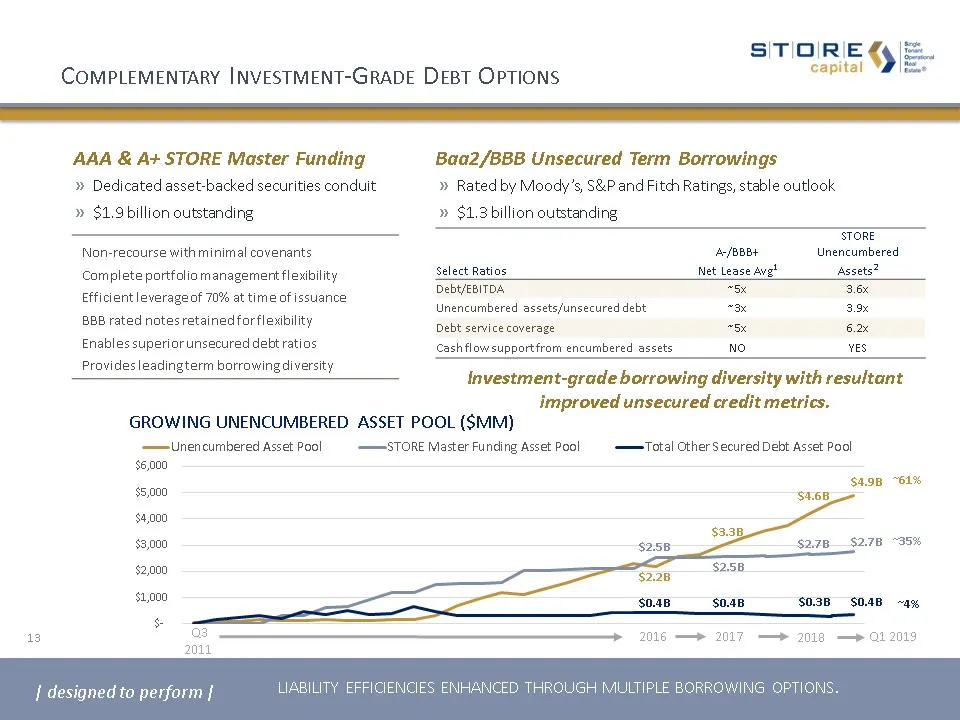
Complementary Investment-Grade Debt Options growing unencumbered asset pool ($MM) AAA & A+ STORE Master Funding Dedicated asset-backed securities conduit$1.9 billion outstanding Baa2/BBB Unsecured Term Borrowings Rated by Moody’s, S&P and Fitch Ratings, stable outlook$1.3 billion outstanding Q3 2011
Slide 14: Internal Growth Strategy
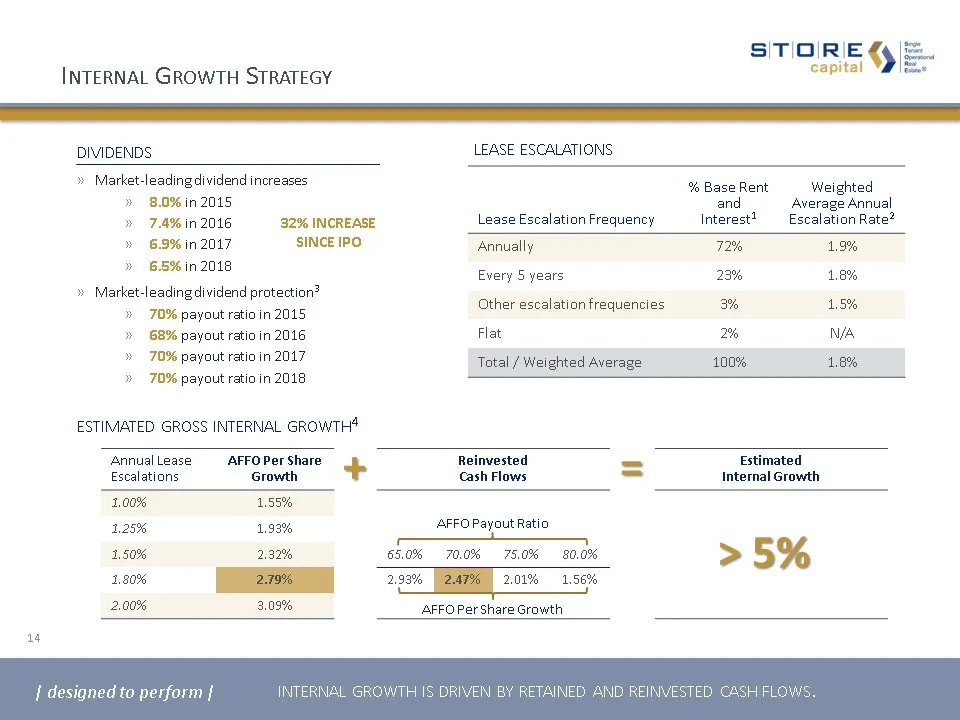
Internal Growth Strategy Lease Escalation Frequency % Base Rent and Interest1 Weighted Average Annual Escalation Rate2 Annually 72% 1.9% Every 5 years 23% 1.8% Other escalation frequencies 3% 1.5% Flat 2% N/A Total / Weighted Average 100% 1.8% lease escalations dividends Market-leading dividend incr
Slide 15: Unrivaled Leadership Over Decades
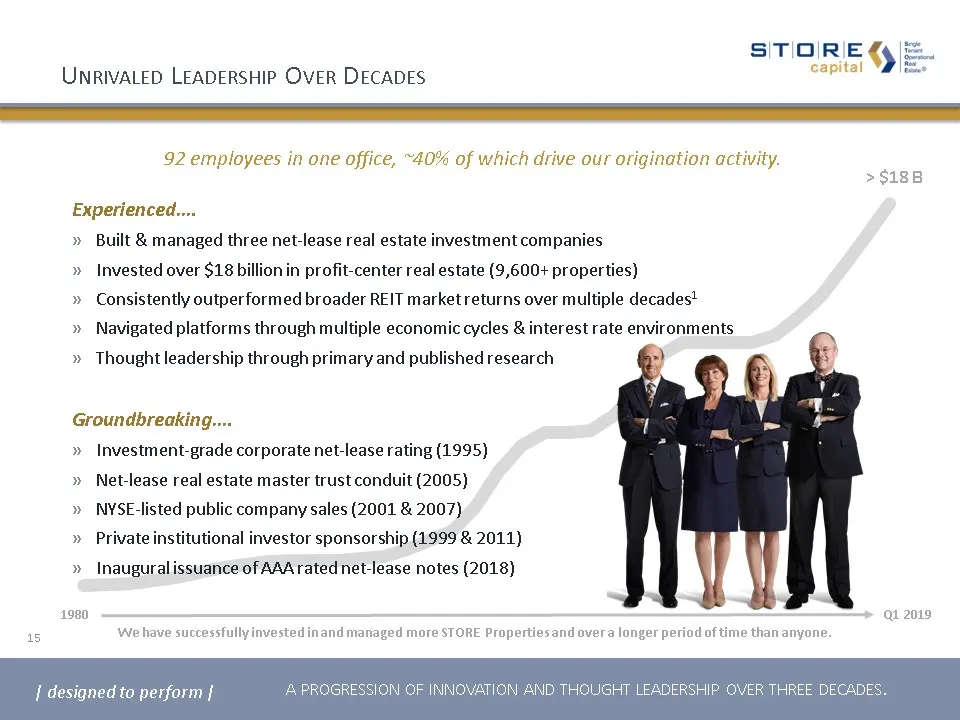
Unrivaled Leadership Over Decades Experienced….Built & managed three net-lease real estate investment companiesInvested over $18 billion in profit-center real estate (9,600+ properties)Consistently outperformed broader REIT market returns over multiple decades1Navigated platforms through multiple ec
Slide 16: Corporate Responsibility and Governance
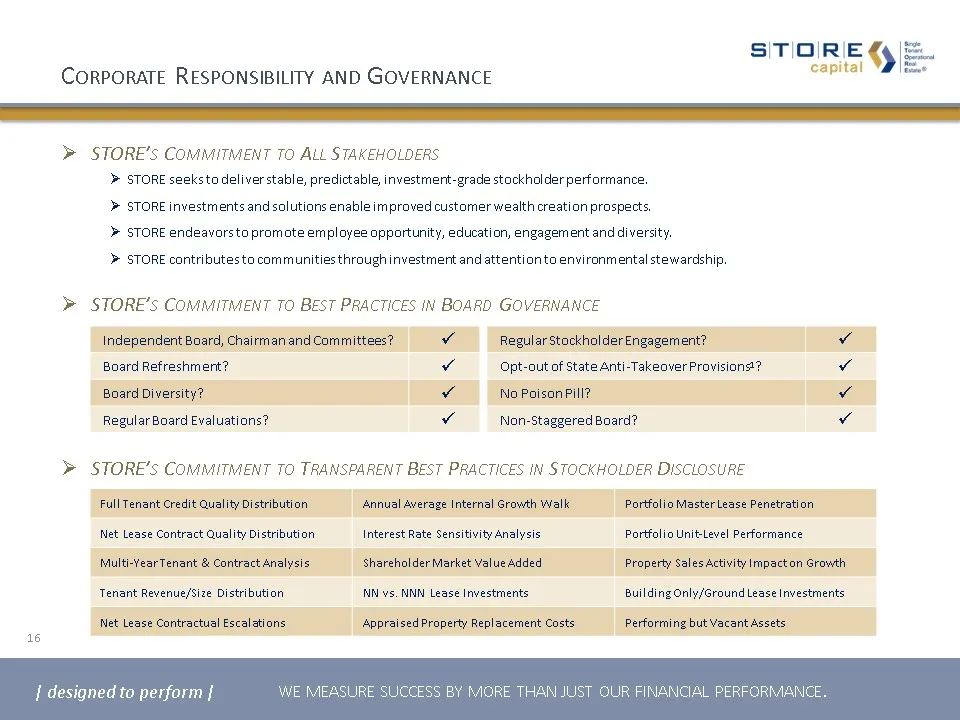
Corporate Responsibility and Governance STORE’s Commitment to Best Practices in Board Governance 16 We measure success by more than just our financial performance. Independent Board, Chairman and Committees? ü Board Refreshment? ü Board Diversity? ü Regular Board Evaluations? ü Regular Stockholder E
Slide 17: Key Achievements As A Public Company
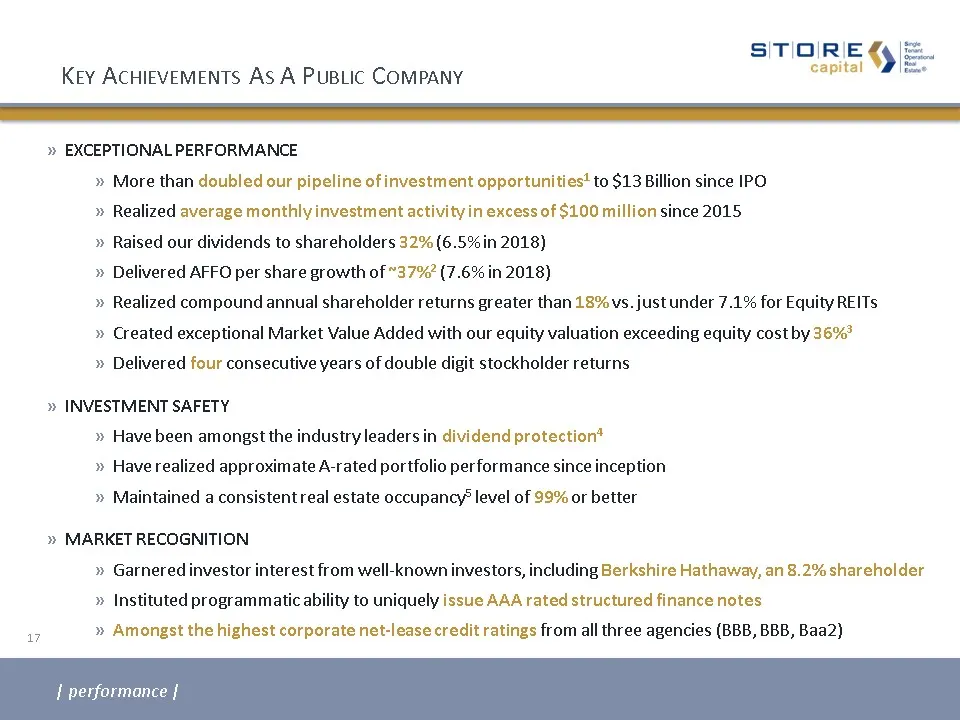
Key Achievements As A Public Company EXCEPTIONAL PERFORMANCEMore than doubled our pipeline of investment opportunities1 to $13 Billion since IPORealized average monthly investment activity in excess of $100 million since 2015Raised our dividends to shareholders 32% (6.5% in 2018)Delivered AFFO per s
Slide 18: Portfolio at a Glance
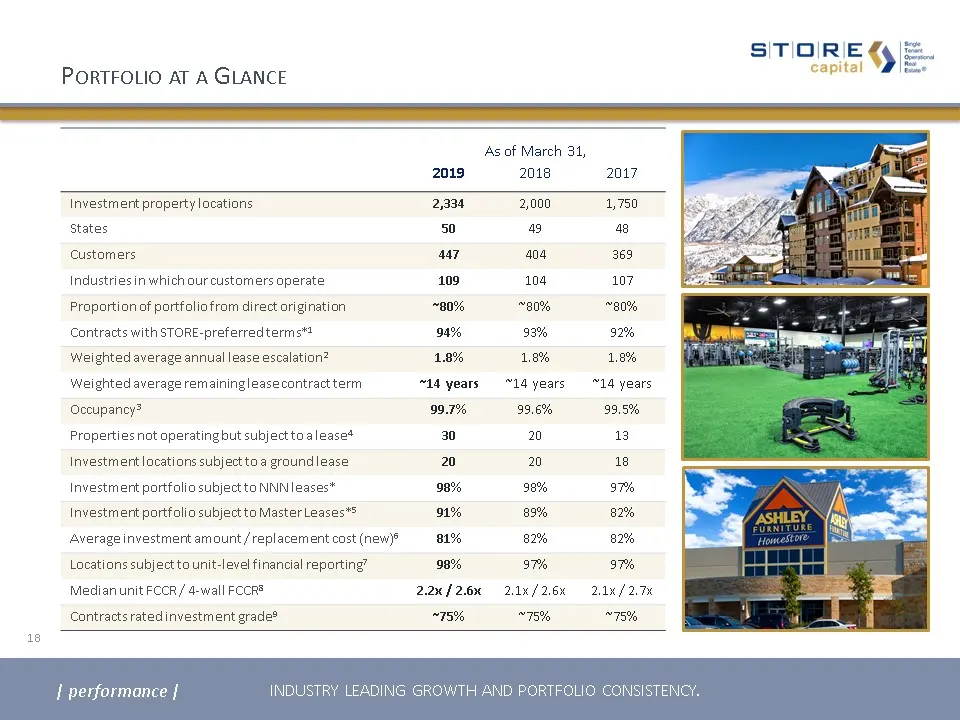
18 Portfolio at a Glance As of March 31, 2019 2018 2017 Investment property locations 2,334 2,000 1,750 States 50 49 48 Customers 447 404 369 Industries in which our customers operate 109 104 107 Proportion of portfolio from direct origination ~80% ~80% ~80% Contracts with STORE-preferred terms*1 94
Slide 19: Diversification Across Industry Groups
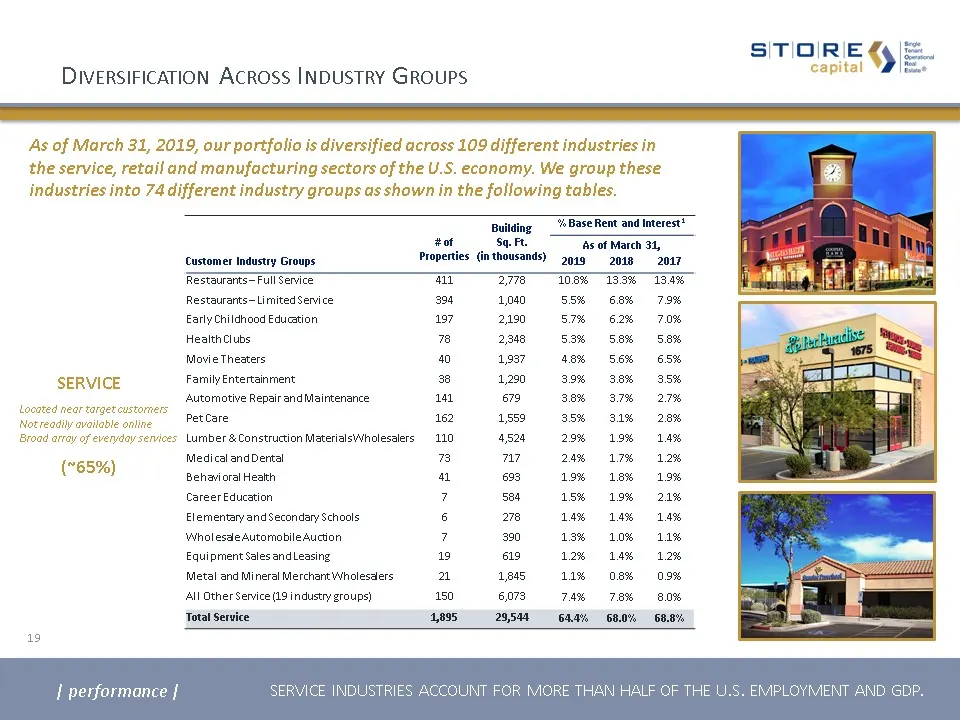
Diversification Across Industry Groups SERVICE (~65%) Located near target customers Not readily available onlineBroad array of everyday services As of March 31, 2019, our portfolio is diversified across 109 different industries in the service, retail and manufacturing sectors of the U.S. economy. We
Slide 20: Diversification Across Industry Groups (continued)
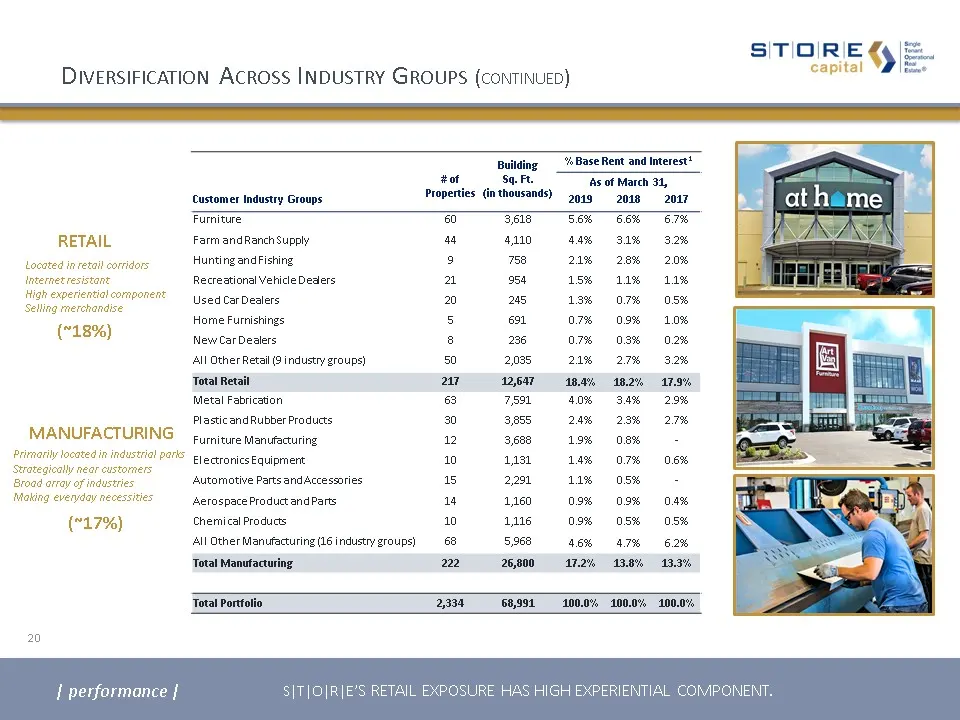
Diversification Across Industry Groups (continued) 20 RETAIL MANUFACTURING Primarily located in industrial parksStrategically near customersBroad array of industriesMaking everyday necessities (~17%) Located in retail corridorsInternet resistantHigh experiential componentSelling merchandise (~18%) |
Slide 21: Retail Portfolio Vitality in the Age of E-Commerce
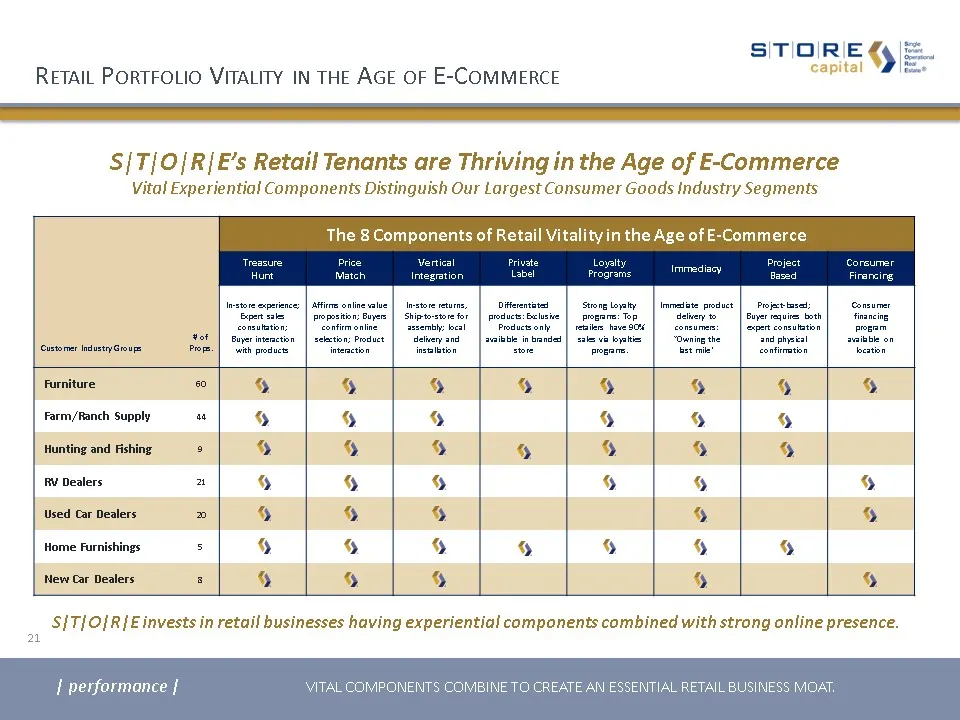
Retail Portfolio Vitality in the Age of E-Commerce 21 VITAL COMPONENTS COMBINE TO CREATE AN ESSENTIAL RETAIL BUSINESS MOAT. S|T|O|R|E’s Retail Tenants are Thriving in the Age of E-CommerceVital Experiential Components Distinguish Our Largest Consumer Goods Industry Segments S|T|O|R|E invests in reta
Slide 22: Top Customers
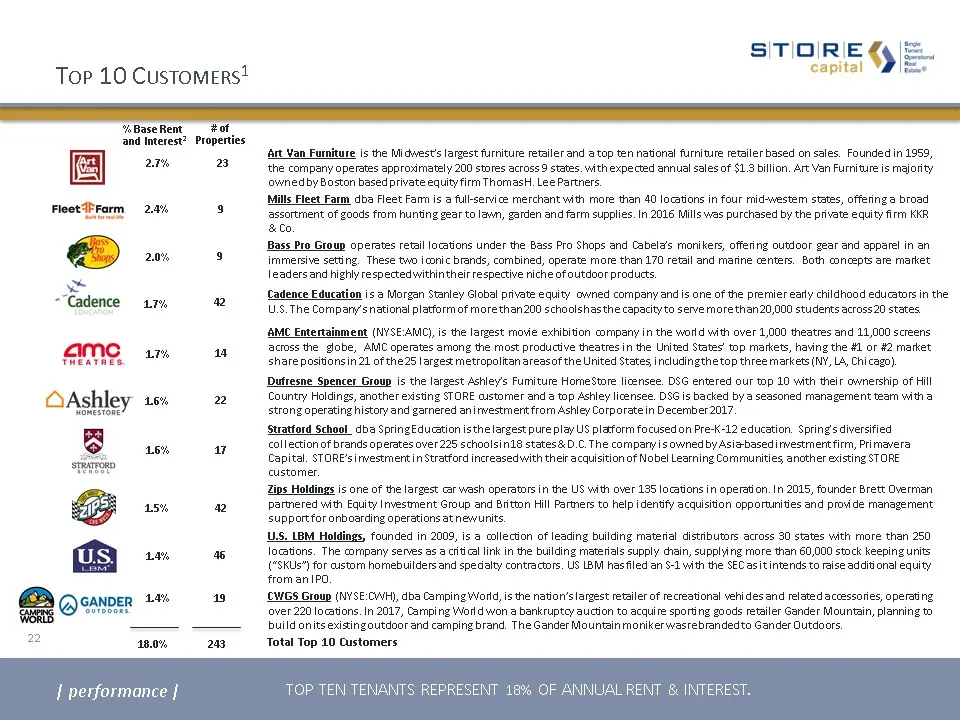
22 Top 10 Customers1 AMC Entertainment (NYSE:AMC), is the largest movie exhibition company in the world with over 1,000 theatres and 11,000 screens across the globe, AMC operates among the most productive theatres in the United States’ top markets, having the #1 or #2 market share positions in 21 of
Slide 23: Diversification Across Geographies
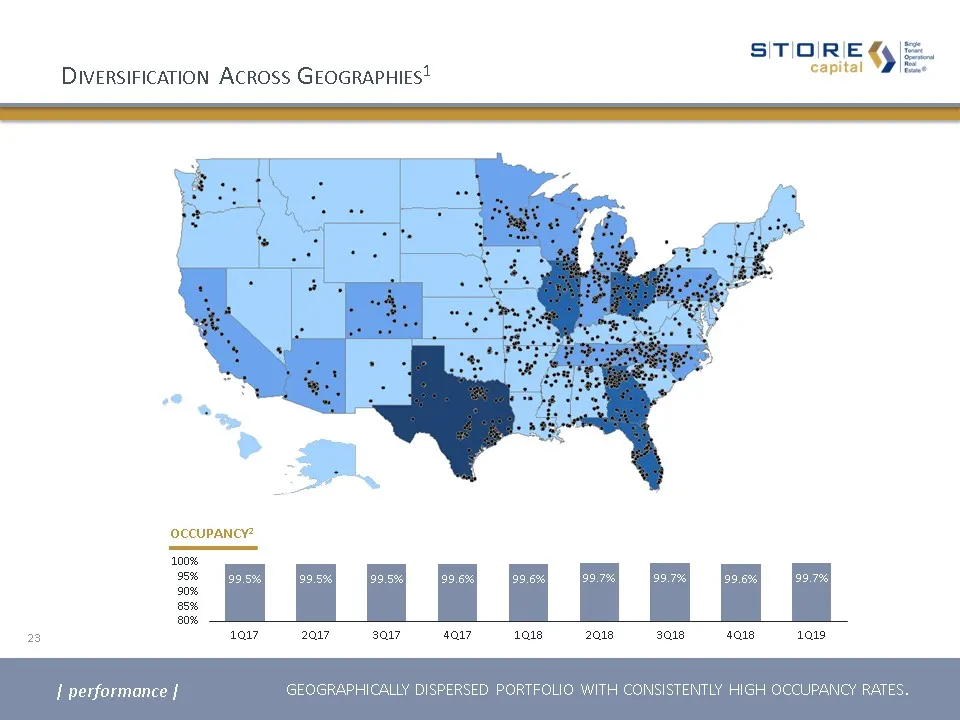
Diversification Across Geographies1 23 OCCUPANCY2 | performance | geographically dispersed portfolio with consistently high occupancy rates.
Slide 24: ~75% of Contracts Investment-Grade in Quality
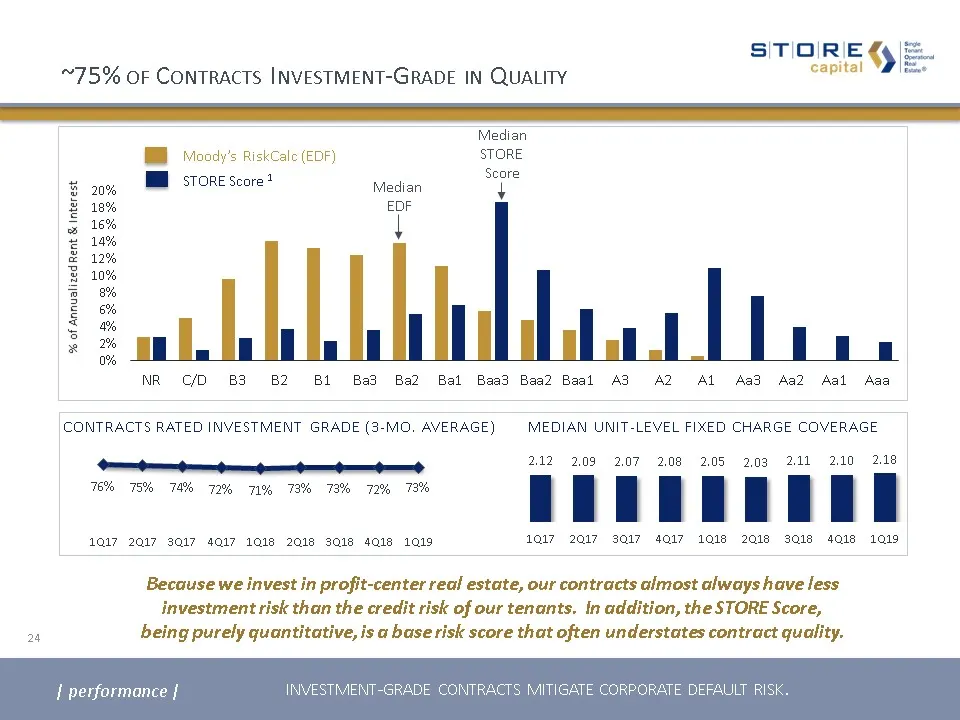
~75% of Contracts Investment-Grade in Quality Because we invest in profit-center real estate, our contracts almost always have less investment risk than the credit risk of our tenants. In addition, the STORE Score, being purely quantitative, is a base risk score that often understates contract quali
Slide 25: Investment Pipeline Activity
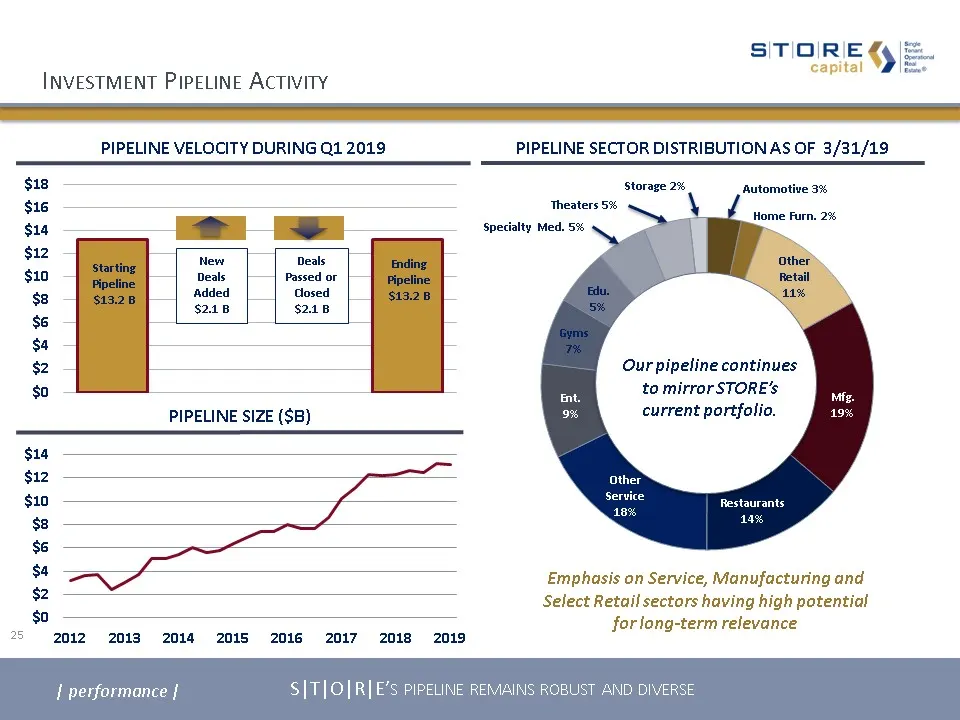
25 25 Investment Pipeline Activity PIPELINE VELOCITY DURING Q1 2019 PIPELINE SECTOR DISTRIBUTION AS OF 3/31/19 S|T|O|R|E’s pipeline remains robust and diverse PIPELINE SIZE ($B) Starting Pipeline $13.2 B Ending Pipeline $13.2 B New Deals Added $2.1 B Deals Passed or Closed $2.1 B Our pipeline contin
Slide 26: Growth and Performance
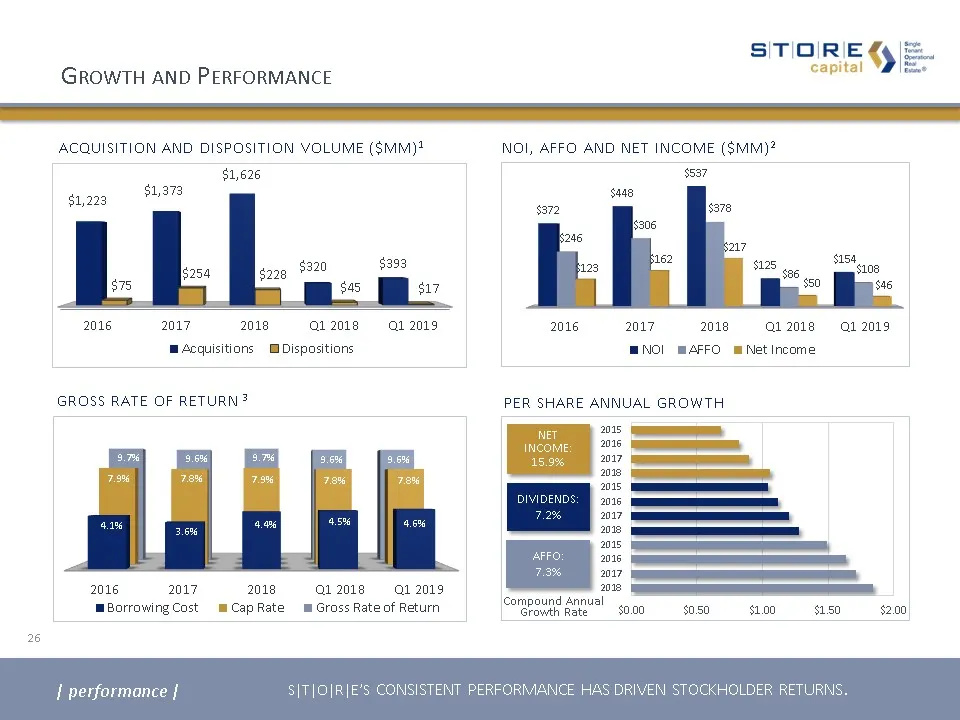
26 NOI, AFFO AND NET INCOME ($MM)2 Growth and Performance | performance | PER SHARE ANNUAL GROWTH NET INCOME:15.9% DIVIDENDS:7.2% AFFO:7.3% Compound Annual Growth Rate ACQUISITION AND DISPOSITION VOLUME ($MM)1 GROSS RATE OF RETURN 3 5.6% 5.3% 5.4% 5.6% 4.1% 3.6% 7.9% 7.8% 9.7% 9.6% 9.7% 7.9% 4.4% S|
Slide 27: Total Return Built on Both Yield & Growth
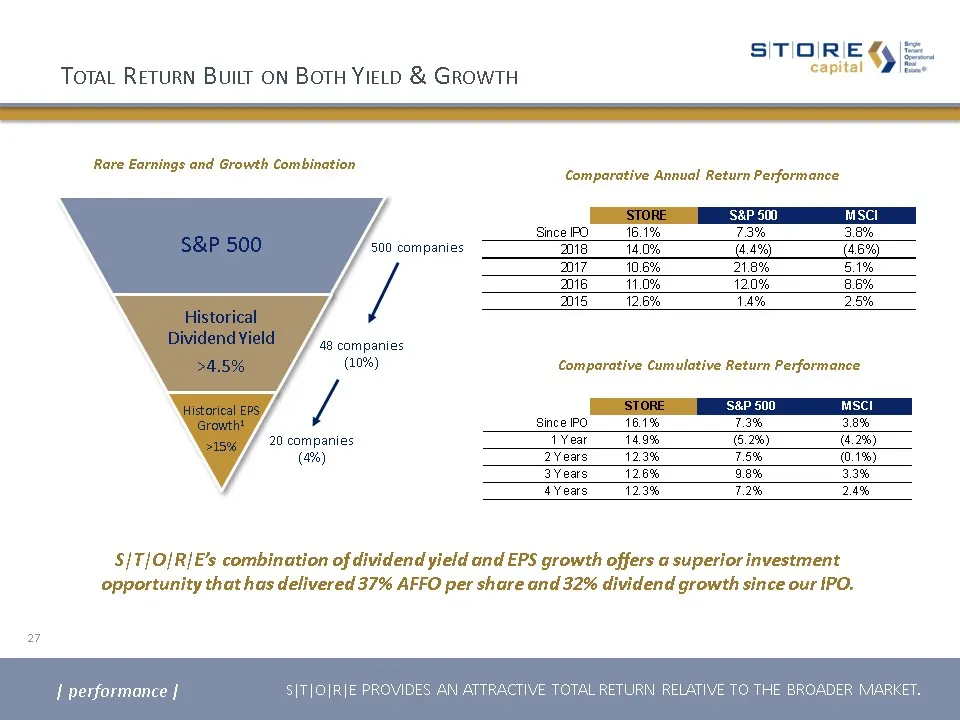
Total Return Built on Both Yield & Growth | performance | 27 500 companies 48 companies(10%) 20 companies(4%) S|T|O|R|E’s combination of dividend yield and EPS growth offers a superior investment opportunity that has delivered 37% AFFO per share and 32% dividend growth since our IPO. S|T|O|R|E provi
Slide 28: Proof of our Design
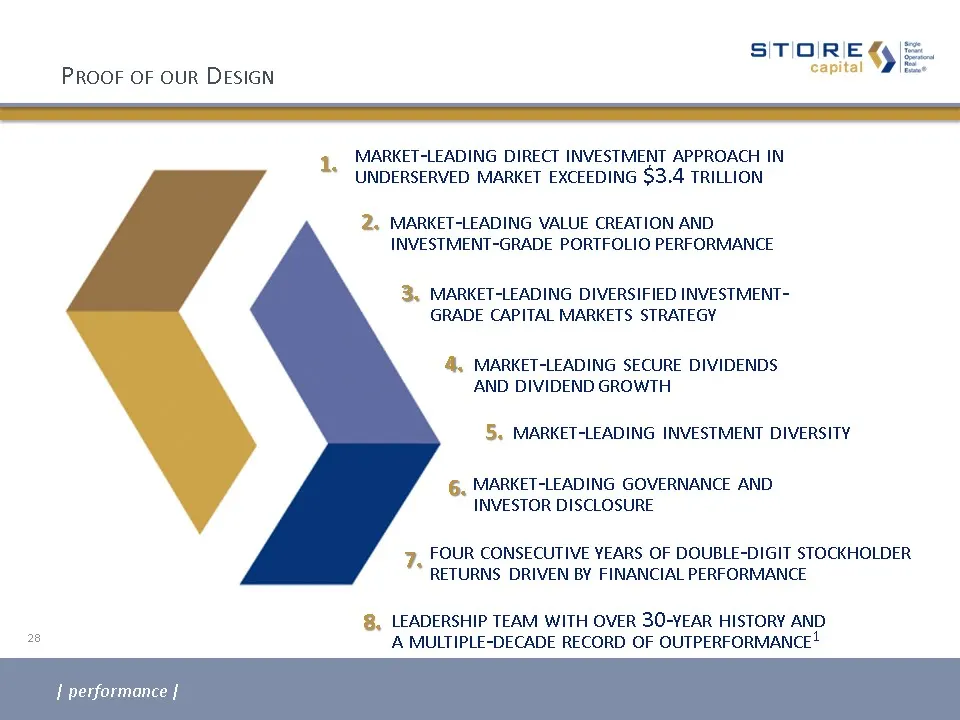
Proof of our Design market-leading direct investment approach in underserved market exceeding $3.4 trillion 1. market-leading value creation and investment-grade portfolio performance 2. market-leading diversified investment-grade capital markets strategy 3. market-leading secure dividends and divid
Slide 29: Appendix
SITIOIRIE < capital Single Tenant Operational Real Estate® Appendix
Slide 30: Management Team Performance
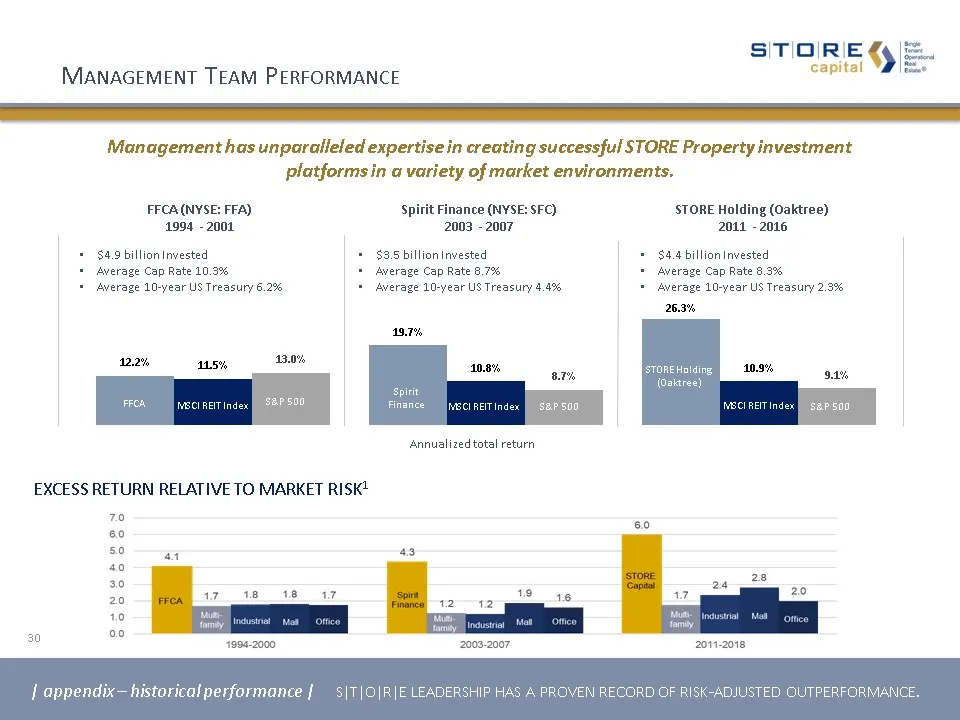
FFCA (NYSE: FFA) 1994 - 2001 Spirit Finance (NYSE: SFC) 2003 - 2007 STORE Holding (Oaktree) 2011 - 2016 Management Team Performance | appendix – historical performance | Management has unparalleled expertise in creating successful STORE Property investment platforms in a variety of market environmen
Slide 31: Stable and Attractive Lease Rate Spreads to Treasury Rates
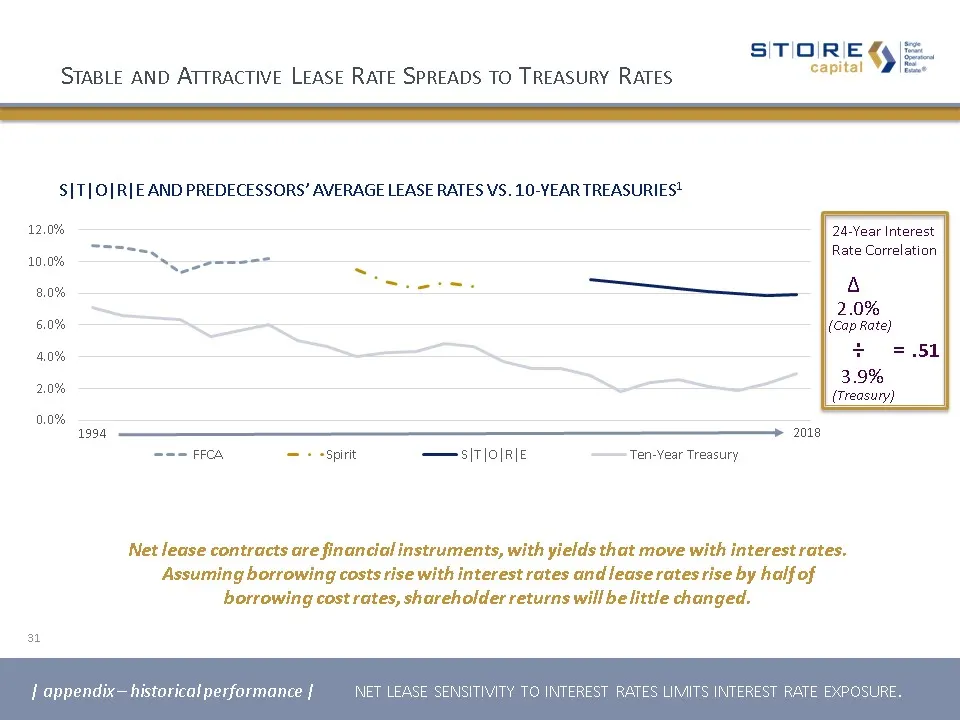
31 Stable and Attractive Lease Rate Spreads to Treasury Rates S|T|O|R|E and predecessors’ average Lease Rates vs. 10-Year Treasuries1 1994 2018 3.9% 2.0% ÷ Δ = .51 24-Year Interest Rate Correlation (Cap Rate) (Treasury) net lease sensitivity to interest rates limits interest rate exposure. Net lease
Slide 32: Marginal Equity Returns on Net Lease Real Estate Investments
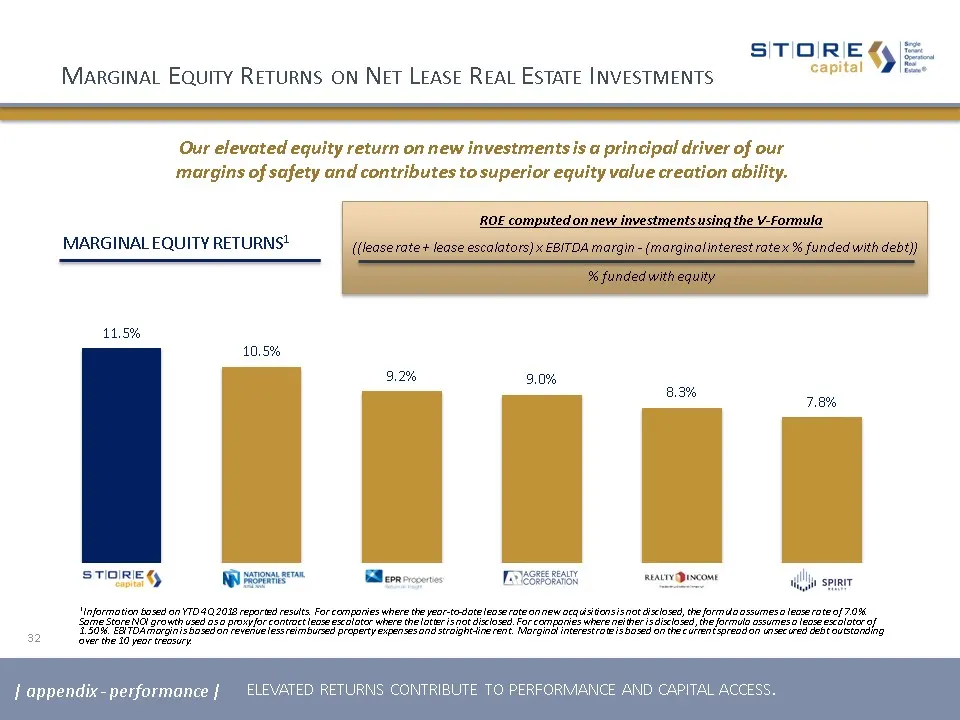
¹ Information based on YTD 4Q 2018 reported results. For companies where the year-to-date lease rate on new acquisitions is not disclosed, the formula assumes a lease rate of 7.0%. Same Store NOI growth used as a proxy for contract lease escalator where the latter is not disclosed. For companies whe
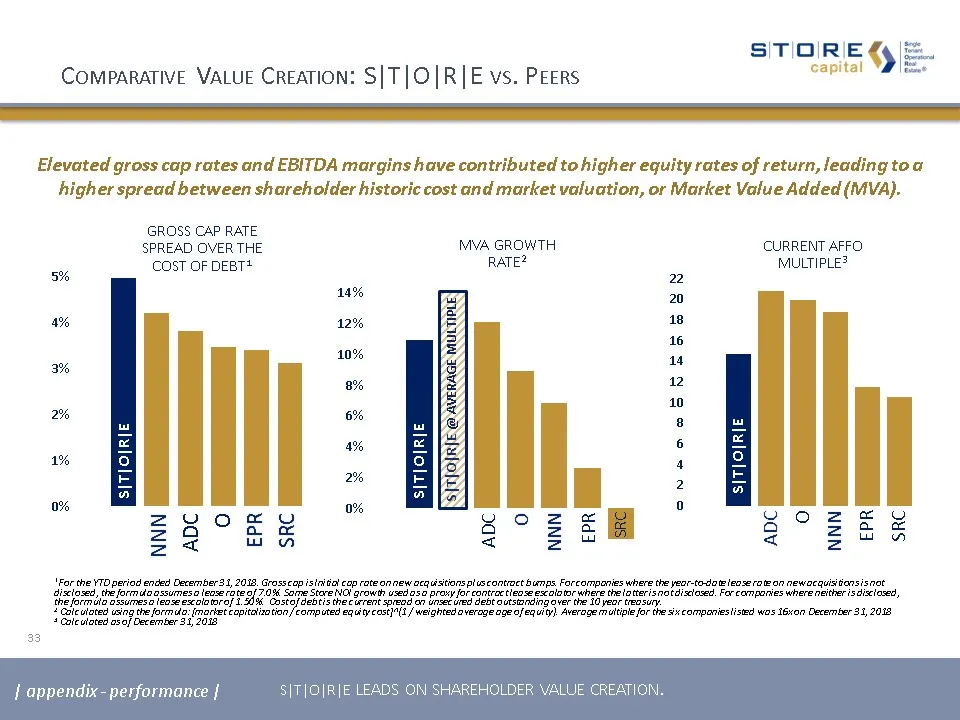
Slide 33: Market Value Added and Cap Rate Spread vs Peers
| appendix - performance | 33 ADCONNNEPR GROSS Cap Rate SPREAD over the cost of debt1 MVA Growth Rate2 CURRENT AFFO Multiple3 S|T|O|R|E S|T|O|R|E S|T|O|R|E Elevated gross cap rates and EBITDA margins have contributed to higher equity rates of return, leading to a higher spread between shareholder hi
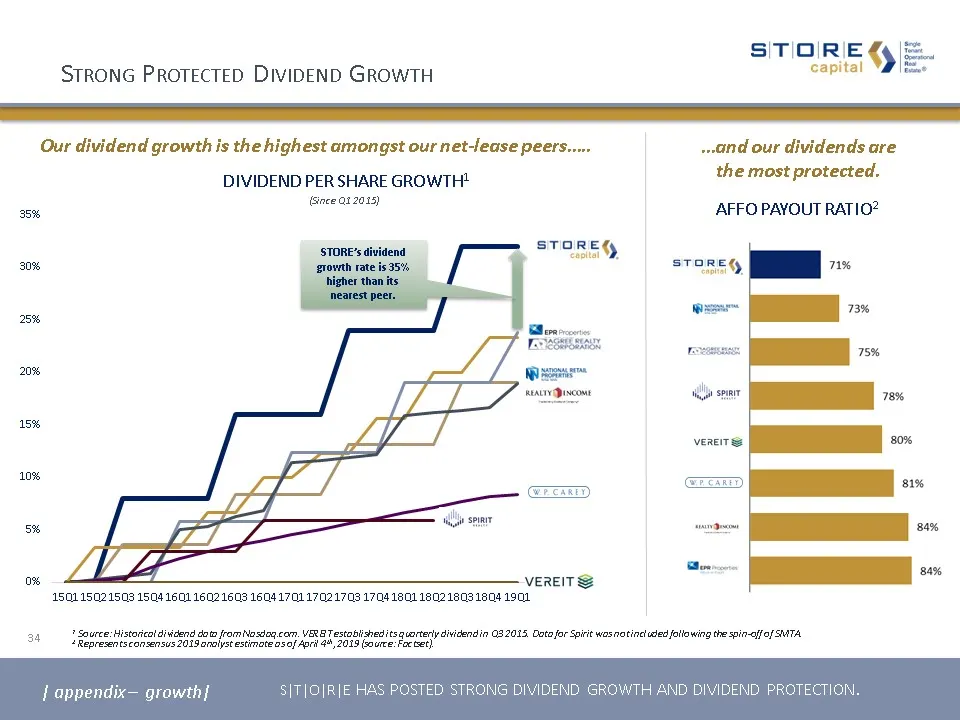
Slide 34: Strong Protected Dividend Growth
DIVIDEND PER SHARE growth1 (Since Q1 2015) affo payout ratio2 Strong Protected Dividend Growth Our dividend growth is the highest amongst our net-lease peers….. 34 | appendix – growth| …and our dividends are the most protected. STORE’s dividend growth rate is 35% higher than its nearest peer. 1 Sour
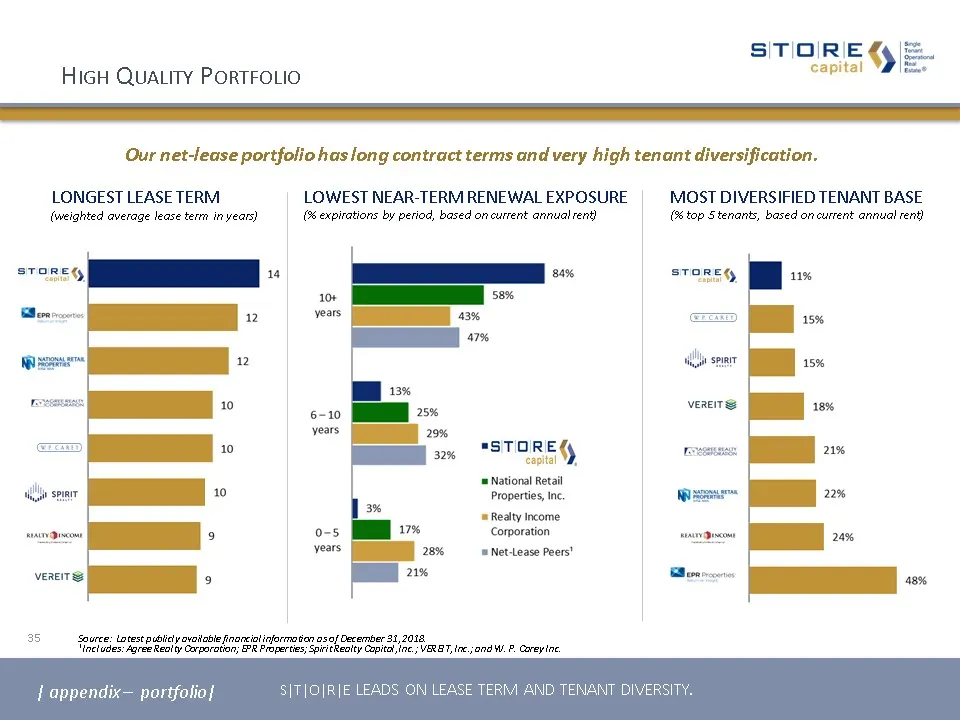
Slide 35: Most Diversified Tenant Base
Most Diversified Tenant Base Source: Latest publicly available financial information as of December 31, 2018. ¹ Includes: Agree Realty Corporation; EPR Properties; Spirit Realty Capital, Inc.; VEREIT, Inc.; and W. P. Carey Inc. (weighted average lease term in years) Longest Lease Term Lowest Near-Te
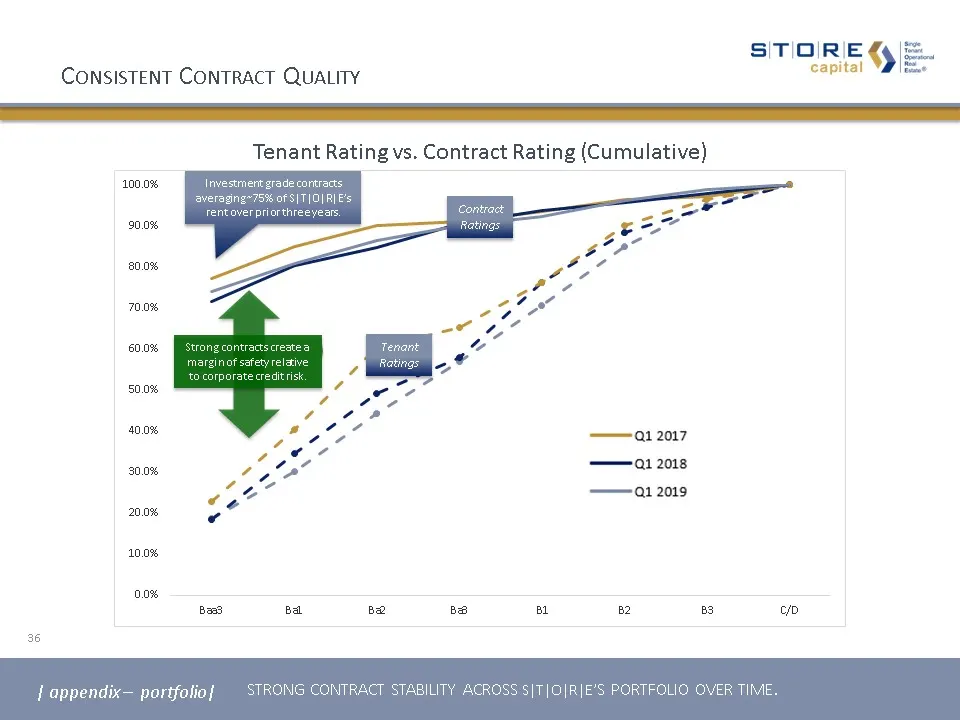
Slide 36: Consistent Contract Quality
Consistent Contract Quality 36 Investment grade contracts averaging ~75% of S|T|O|R|E’s rent over prior three years. Tenant Rating vs. Contract Rating (Cumulative) Strong contracts create a margin of safety relative to corporate credit risk. Contract Ratings | appendix – portfolio| Tenant Ratings st
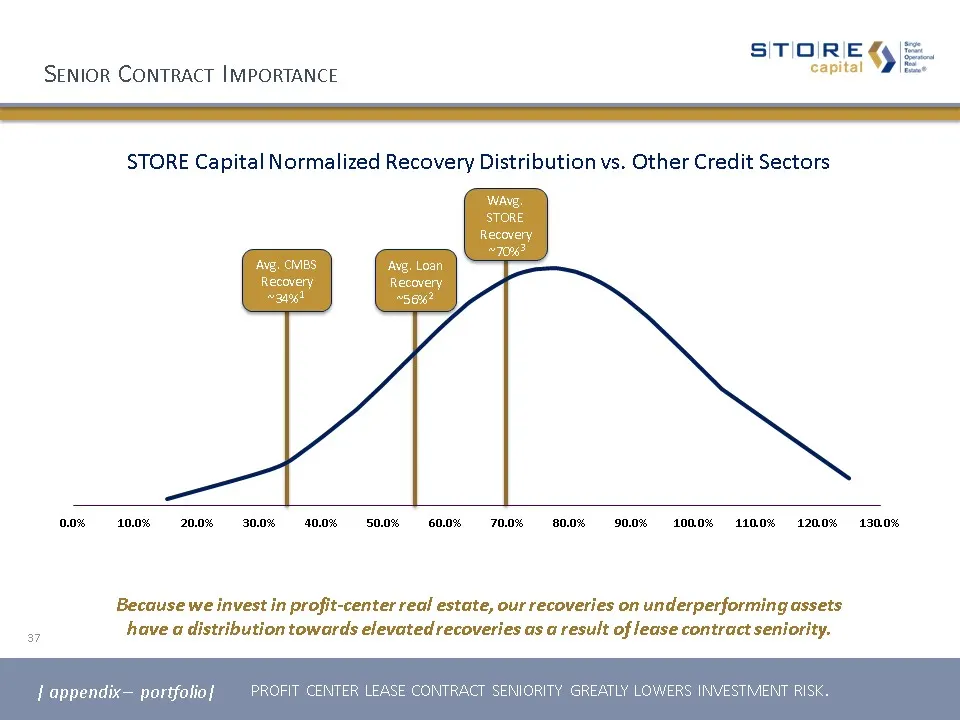
Slide 37: Senior Contract Importance
Senior Contract Importance profit center lease contract seniority greatly lowers investment risk. WAvg. STORERecovery ~70%3 Avg. Loan Recovery~56%2 Avg. CMBS Recovery~34%1 STORE Capital Normalized Recovery Distribution vs. Other Credit Sectors Because we invest in profit-center real estate, our reco
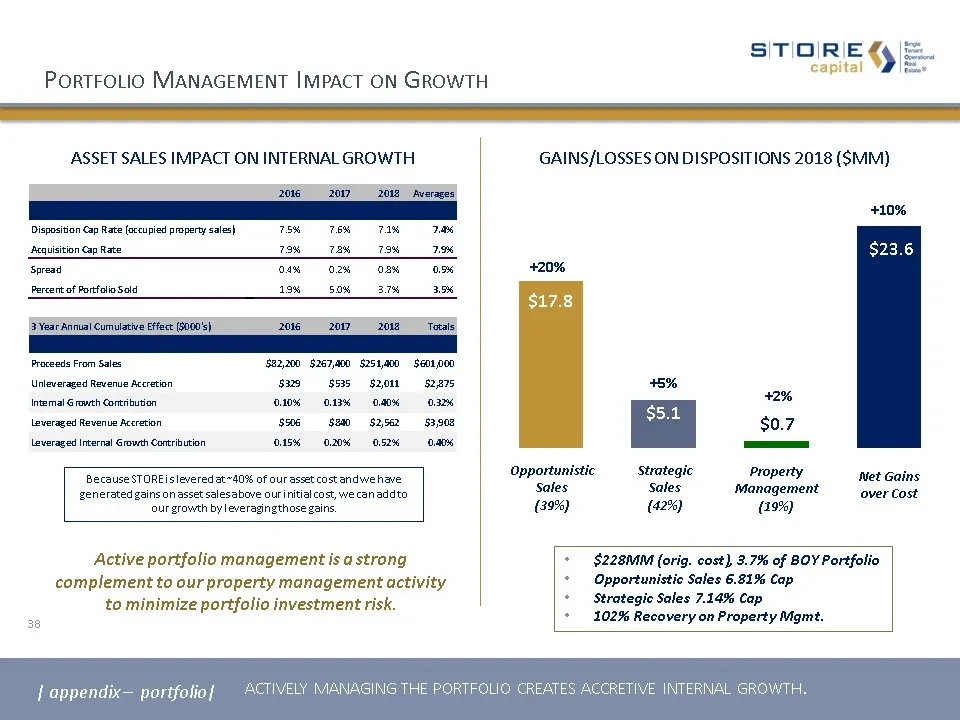
Slide 38: Asset Sales Impact on Internal Growth
ASSET SALES IMPACT ON INTERNAL GROWTH actively managing the portfolio creates accretive internal growth. Portfolio Management Impact on Growth Active portfolio management is a strong complement to our property management activity to minimize portfolio investment risk. Opportunistic Sales(39%) Proper
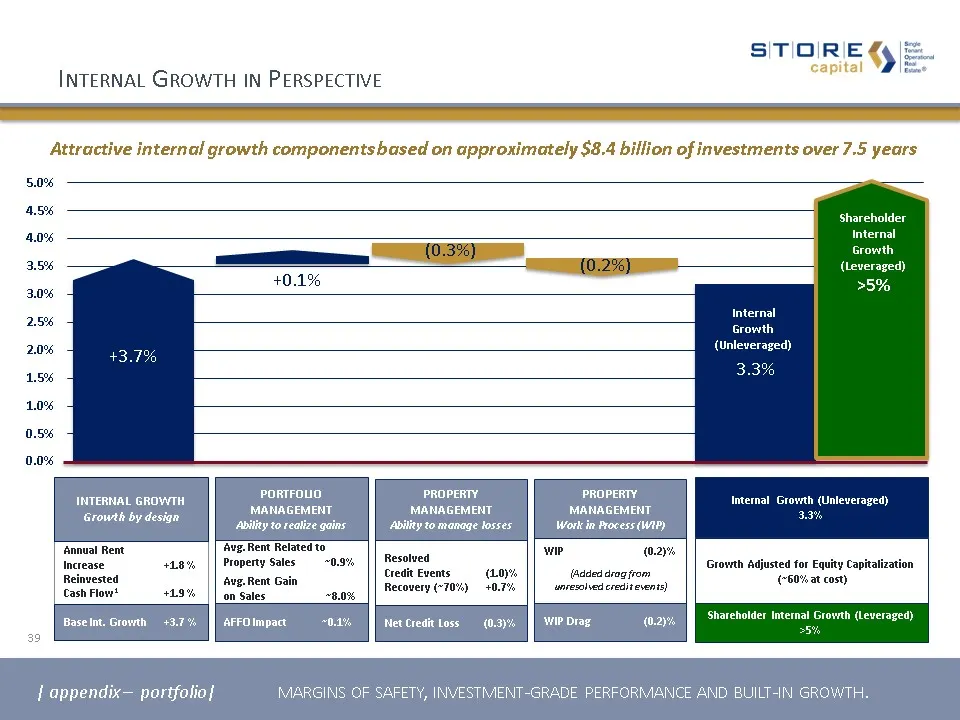
Slide 39: Internal Growth in Perspective
39 Internal Growth in Perspective Attractive internal growth components based on approximately $8.4 billion of investments over 7.5 years Avg. Rent Related to Property Sales ~0.9%Avg. Rent Gain on Sales ~8.0% PORTFOLIO MANAGEMENTAbility to realize gains AFFO Impact ~0.1% | appendix – portfolio| marg
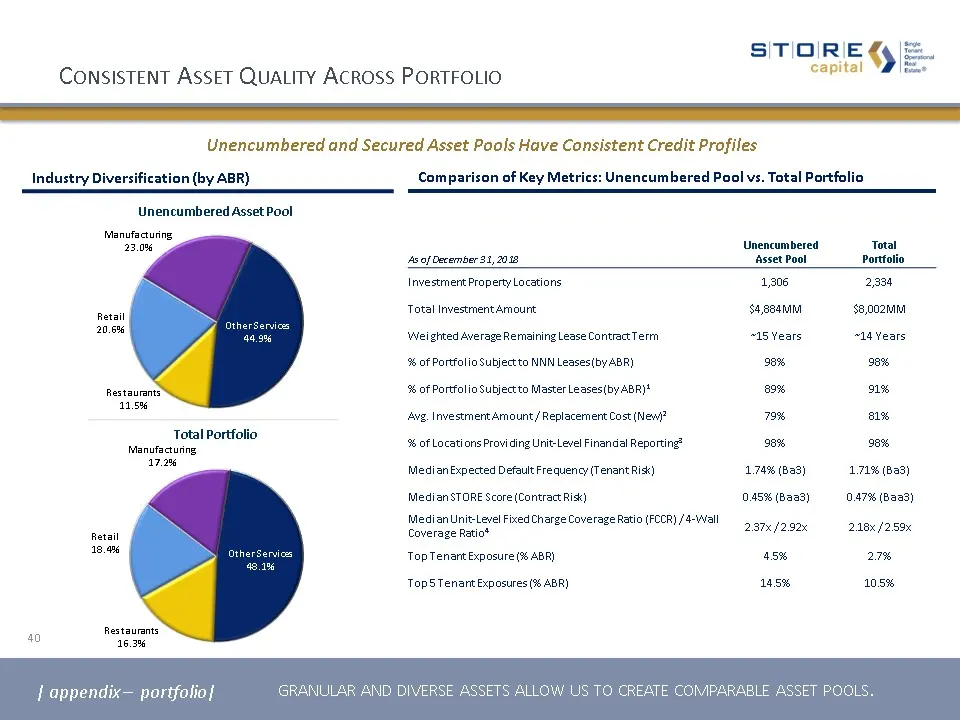
Slide 40: Unencumbered Asset Pool vs Total Portfolio
As of December 31, 2018 Unencumbered Asset Pool Total Portfolio Investment Property Locations 1,306 2,334 Total Investment Amount $4,884MM $8,002MM Weighted Average Remaining Lease Contract Term ~15 Years ~14 Years % of Portfolio Subject to NNN Leases (by ABR) 98% 98% % of Portfolio Subject to Maste
Slide 41: Executive Management Team
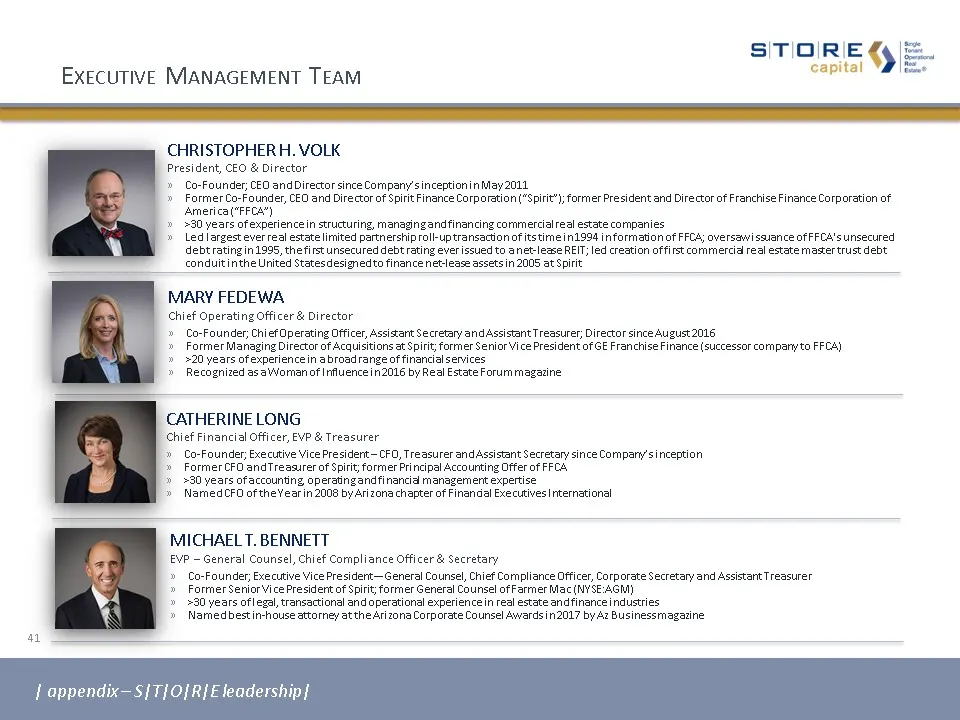
41 Executive Management Team | appendix – S|T|O|R|E leadership| MARY FEDEWAChief Operating Officer & DirectorCo-Founder; Chief Operating Officer, Assistant Secretary and Assistant Treasurer; Director since August 2016Former Managing Director of Acquisitions at Spirit; former Senior Vice President of
Slide 42: Board of Directors
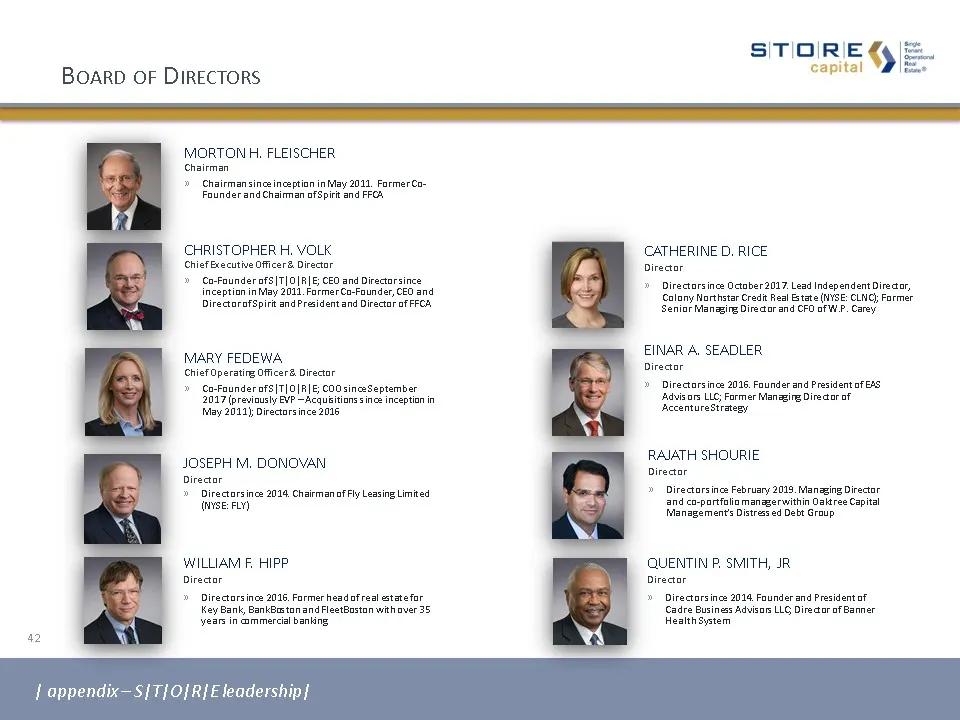
42 Board of Directors MORTON H. FLEISCHERChairmanChairman since inception in May 2011. Former Co-Founder and Chairman of Spirit and FFCA MARY FEDEWAChief Operating Officer & DirectorCo-Founder of S|T|O|R|E; COO since September 2017 (previously EVP – Acquisitions since inception in May 2011); Directo
Slide 43: Financial Information
Sine, Speratonl Real Estate® SITIOIRIE €¥ |; capital Financial Information
Slide 44: Condensed Consolidated Statements of Income
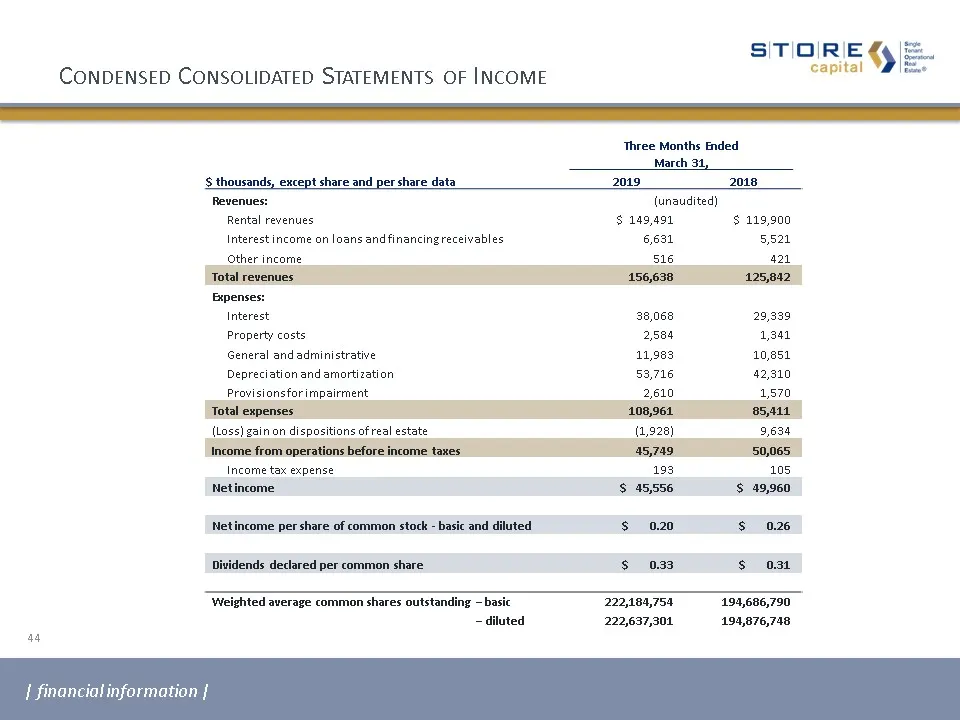
44 Condensed Consolidated Statements of Income Three Months Ended March 31, $ thousands, except share and per share data 2019 2018 Revenues: (unaudited) Rental revenues $ 149,491 $ 119,900 Interest income on loans and financing receivables 6,631 5,521 Other income 516 421 Total revenues 156,638 125,
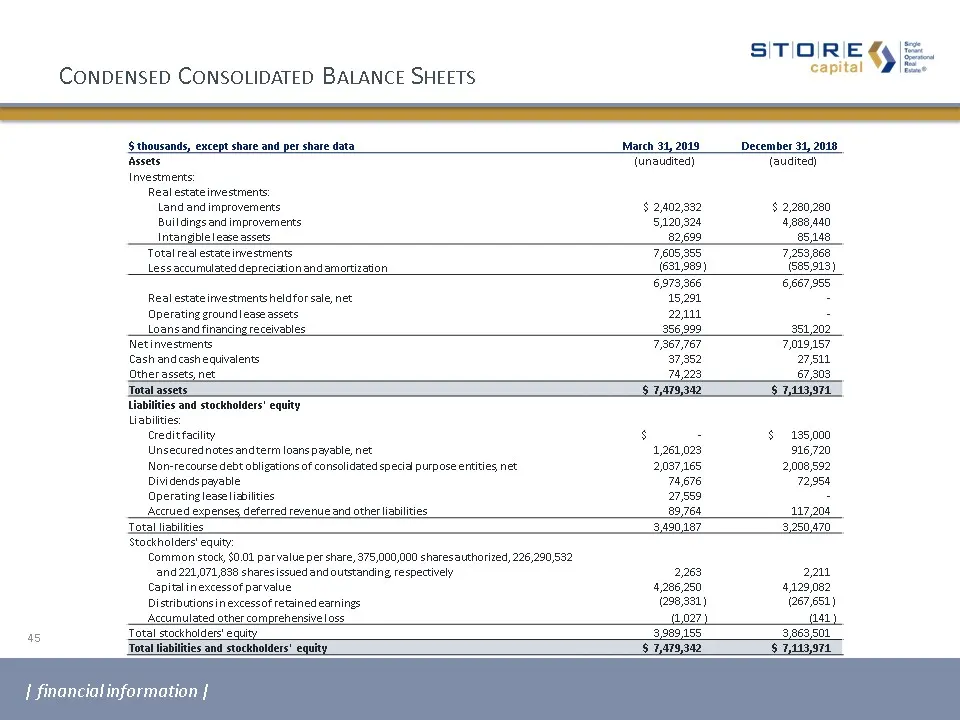
Slide 45: Condensed Consolidated Balance Sheets
Condensed Consolidated Balance Sheets $ thousands, except share and per share data March 31, 2019 December 31, 2018 Assets (unaudited) (audited) Investments: Real estate investments: Land and improvements $ 2,402,332 $ 2,280,280 Buildings and improvements 5,120,324 4,888,440 Intangible lease assets
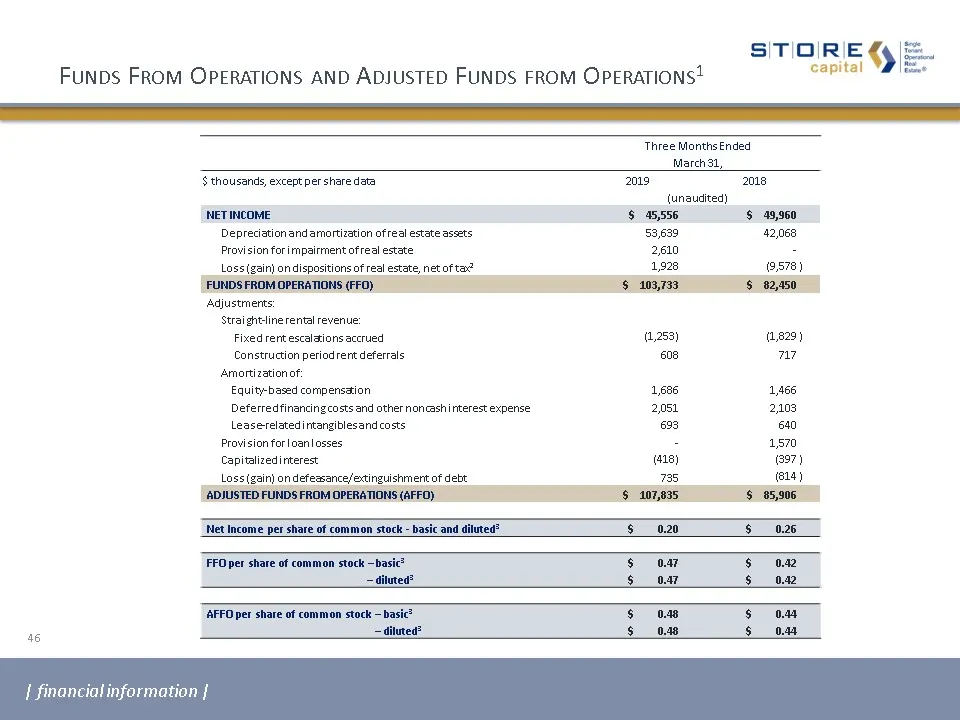
Slide 46: Funds From Operations and Adjusted Funds from Operations
Funds From Operations and Adjusted Funds from Operations1 Three Months Ended March 31, $ thousands, except per share data 2019 2018 (unaudited) NET INCOME $ 45,556 $ 49,960 Depreciation and amortization of real estate assets 53,639 42,068 Provision for impairment of real estate 2,610 - Loss (gain) o
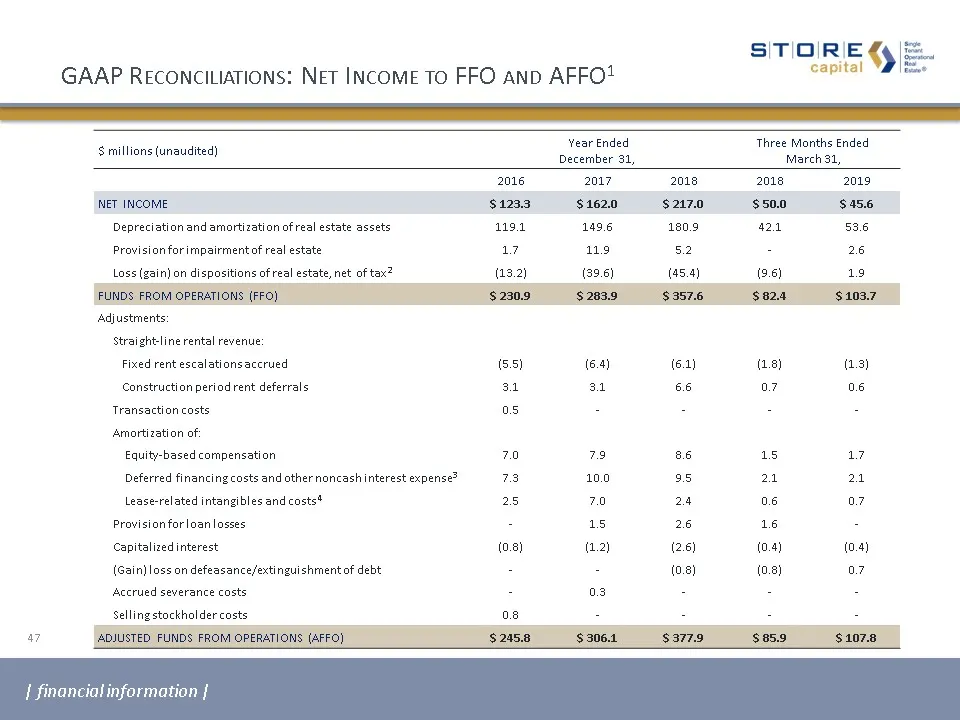
Slide 47: GAAP Reconciliations: Net Income to FFO and AFFO
GAAP Reconciliations: Net Income to FFO and AFFO1 47 $ millions (unaudited) Year EndedDecember 31, Three Months EndedMarch 31, 2016 2017 2018 2018 2019 NET INCOME $ 123.3 $ 162.0 $ 217.0 $ 50.0 $ 45.6 Depreciation and amortization of real estate assets 119.1 149.6 180.9 42.1 53.6 Provision for impai
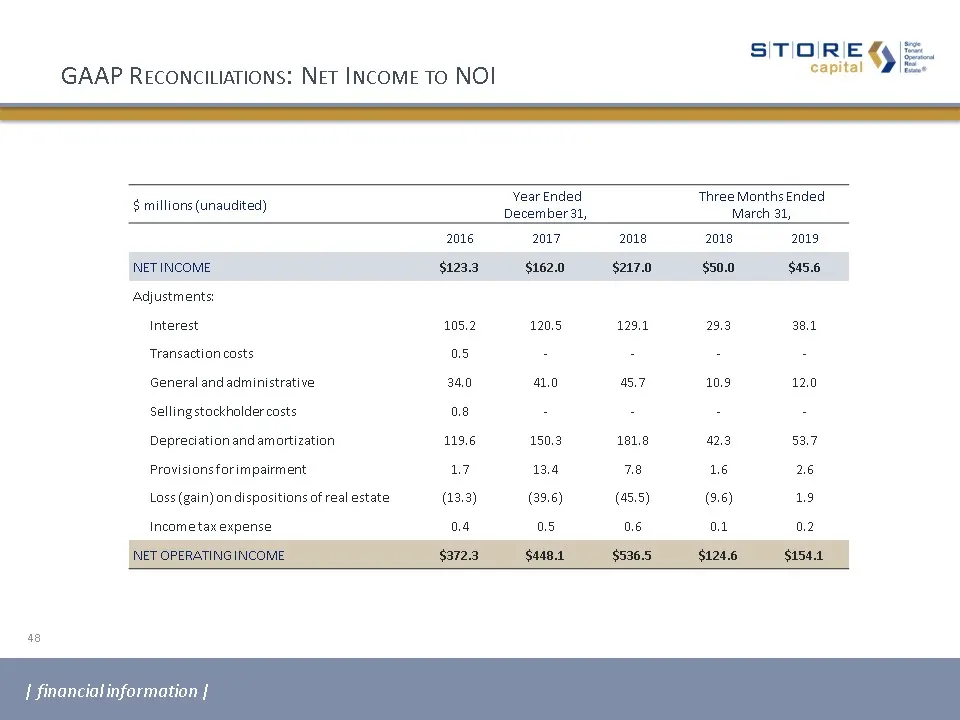
Slide 48: GAAP Reconciliations: Net Income to NOI
GAAP Reconciliations: Net Income to NOI 48 $ millions (unaudited) Year EndedDecember 31, Three Months EndedMarch 31, 2016 2017 2018 2018 2019 NET INCOME $123.3 $162.0 $217.0 $50.0 $45.6 Adjustments: Interest 105.2 120.5 129.1 29.3 38.1 Transaction costs 0.5 - - - - General and administrative 34.0 41
Slide 49: GAAP Reconciliations: Debt to Adjusted Debt
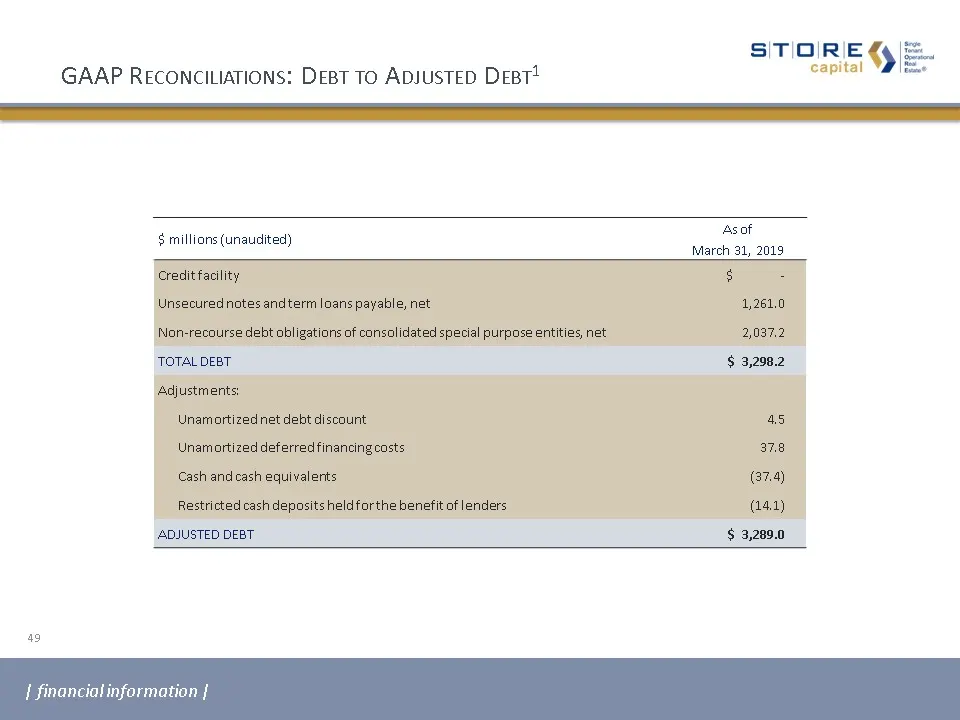
GAAP Reconciliations: Debt to Adjusted Debt1 49 $ millions (unaudited) As of March 31, 2019 Credit facility $ - Unsecured notes and term loans payable, net 1,261.0 Non-recourse debt obligations of consolidated special purpose entities, net 2,037.2 TOTAL DEBT $ 3,298.2 Adjustments: Unamortized net de
Slide 50: GAAP Reconciliations: Net Income to Adjusted EBITDAre
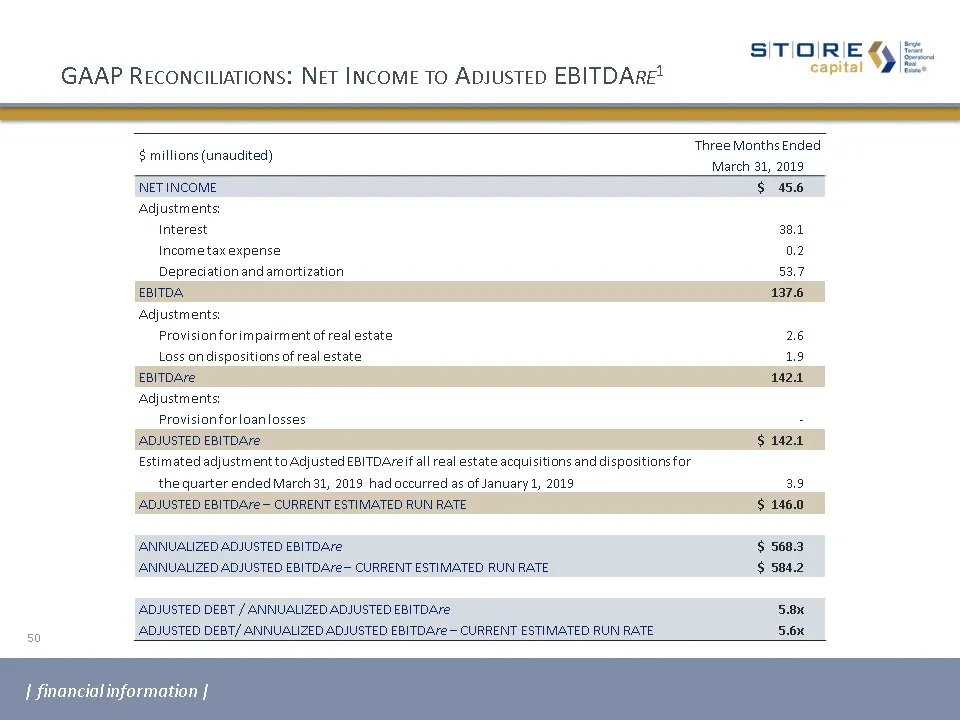
GAAP Reconciliations: Net Income to Adjusted EBITDAre1 50 $ millions (unaudited) Three Months Ended March 31, 2019 NET INCOME $ 45.6 Adjustments: Interest 38.1 Income tax expense 0.2 Depreciation and amortization 53.7 EBITDA 137.6 Adjustments: Provision for impairment of real estate 2.6 Loss on disp
Slide 51: Long-Term Debt Maturities
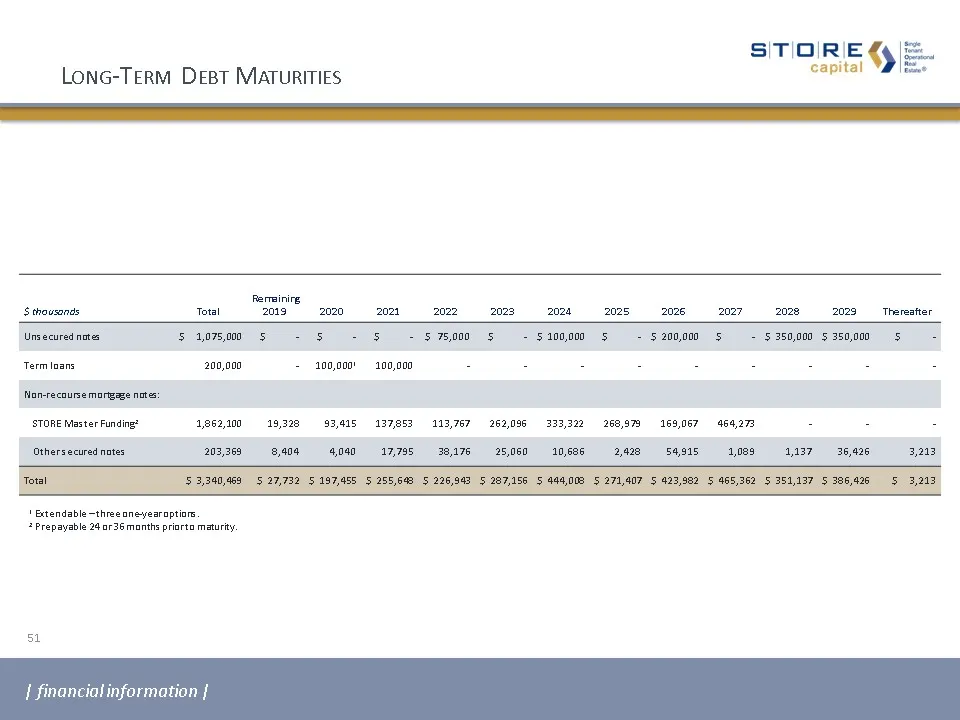
Long-Term Debt Maturities 51 | financial information | $ thousands Total Remaining2019 2020 2021 2022 2023 2024 2025 2026 2027 2028 2029 Thereafter Unsecured notes $ 1,075,000 $ - $ - $ - $ 75,000 $ - $ 100,000 $ - $ 200,000 $ - $ 350,000 $ 350,000 $ - Term loans 200,000 - 100,0001 100,000 - - - - -
Slide 52: Supplemental Reporting Measures
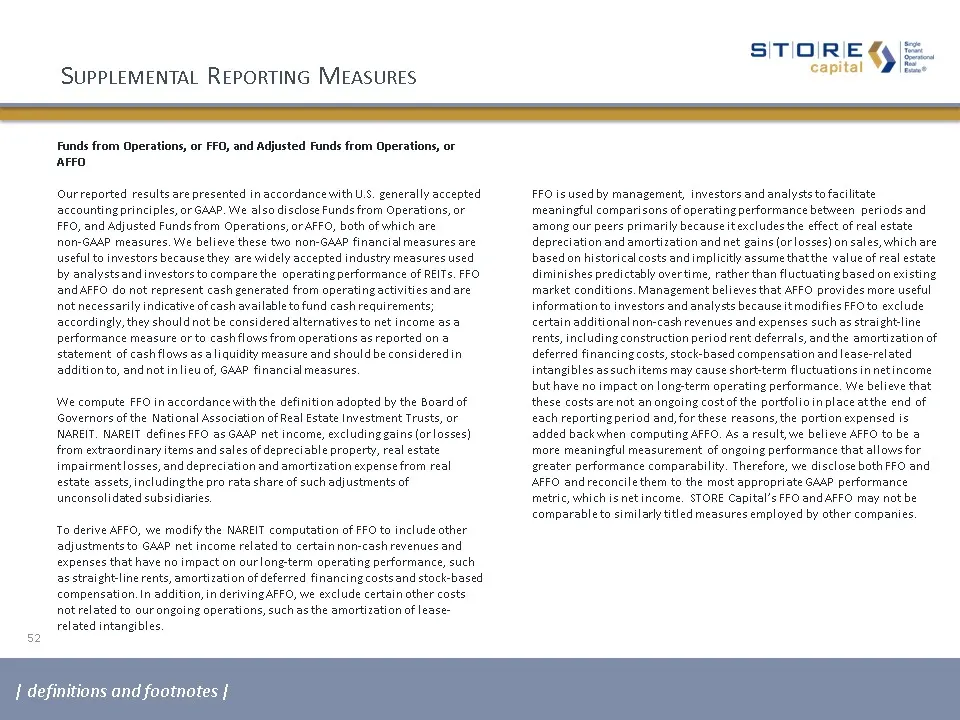
52 Supplemental Reporting Measures Funds from Operations, or FFO, and Adjusted Funds from Operations, or AFFO Our reported results are presented in accordance with U.S. generally accepted accounting principles, or GAAP. We also disclose Funds from Operations, or FFO, and Adjusted Funds from Operatio
Slide 53: Supplemental Reporting Measures
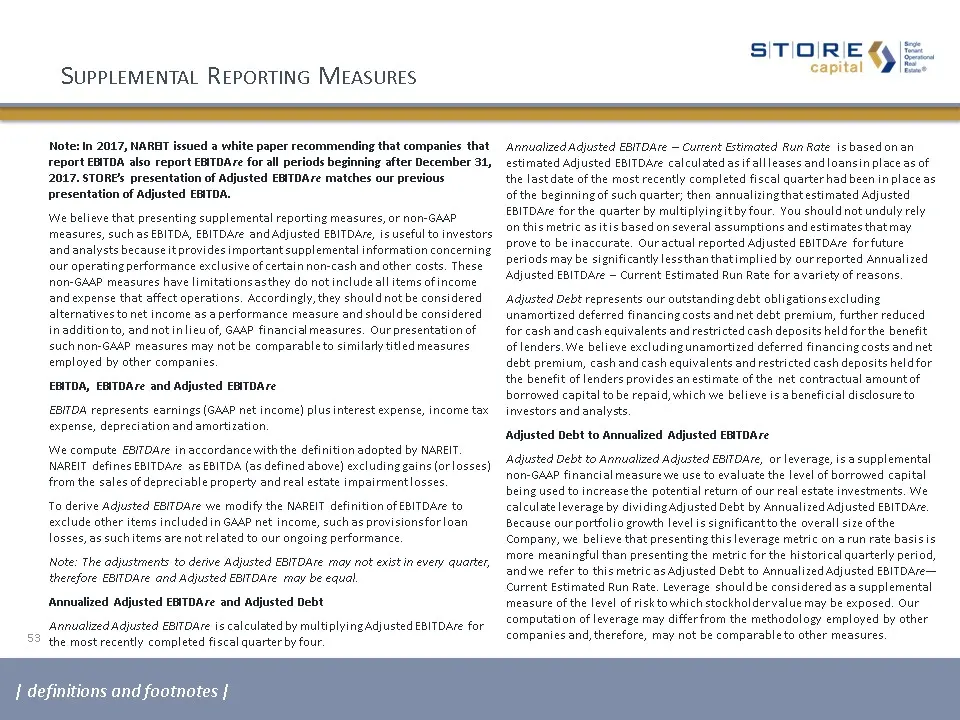
53 Supplemental Reporting Measures Note: In 2017, NAREIT issued a white paper recommending that companies that report EBITDA also report EBITDAre for all periods beginning after December 31, 2017. STORE’s presentation of Adjusted EBITDAre matches our previous presentation of Adjusted EBITDA.We belie
Slide 54: Footnotes
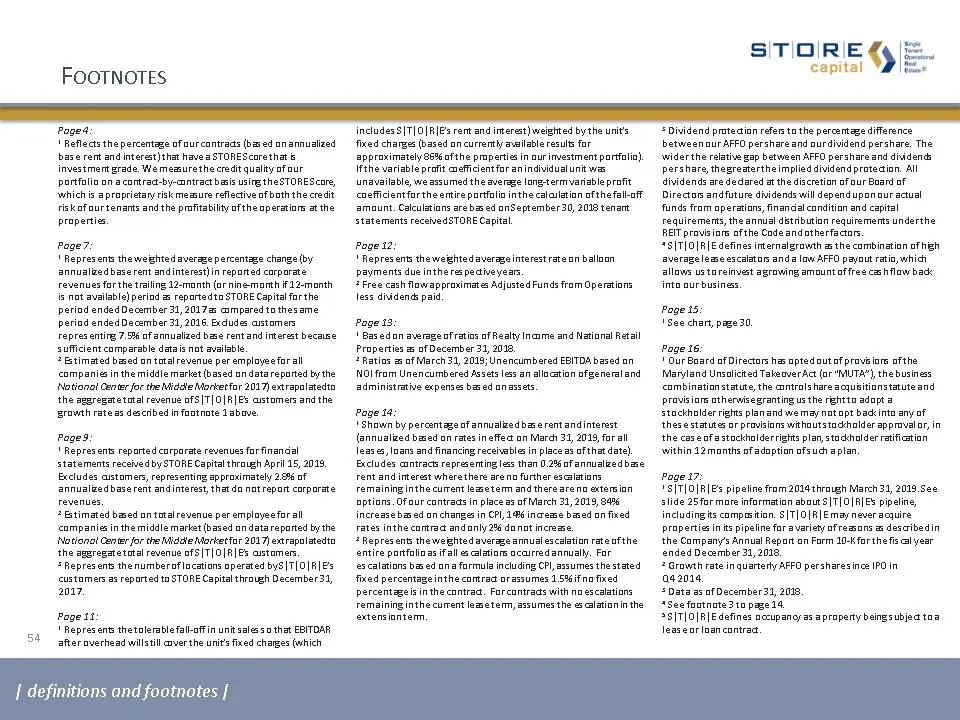
54 Footnotes Page 4:1 Reflects the percentage of our contracts (based on annualized base rent and interest) that have a STORE Score that is investment grade. We measure the credit quality of our portfolio on a contract-by-contract basis using the STORE Score, which is a proprietary risk measure refl
Slide 55: Footnotes
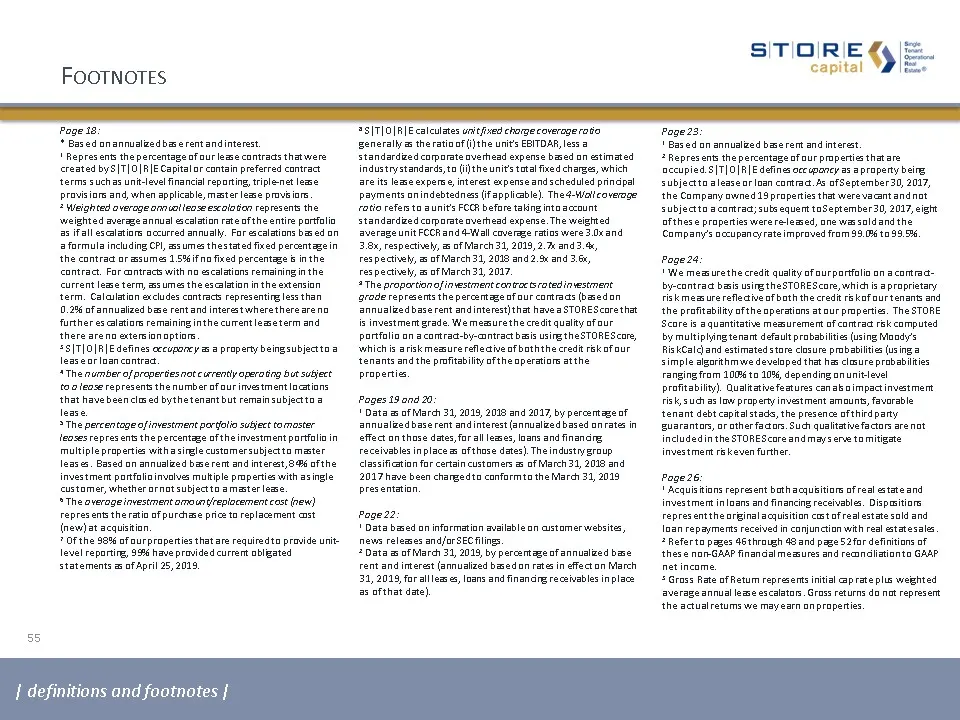
Footnotes 55 Page 18: * Based on annualized base rent and interest.1 Represents the percentage of our lease contracts that were created by S|T|O|R|E Capital or contain preferred contract terms such as unit-level financial reporting, triple-net lease provisions and, when applicable, master lease prov
Slide 56: Footnotes
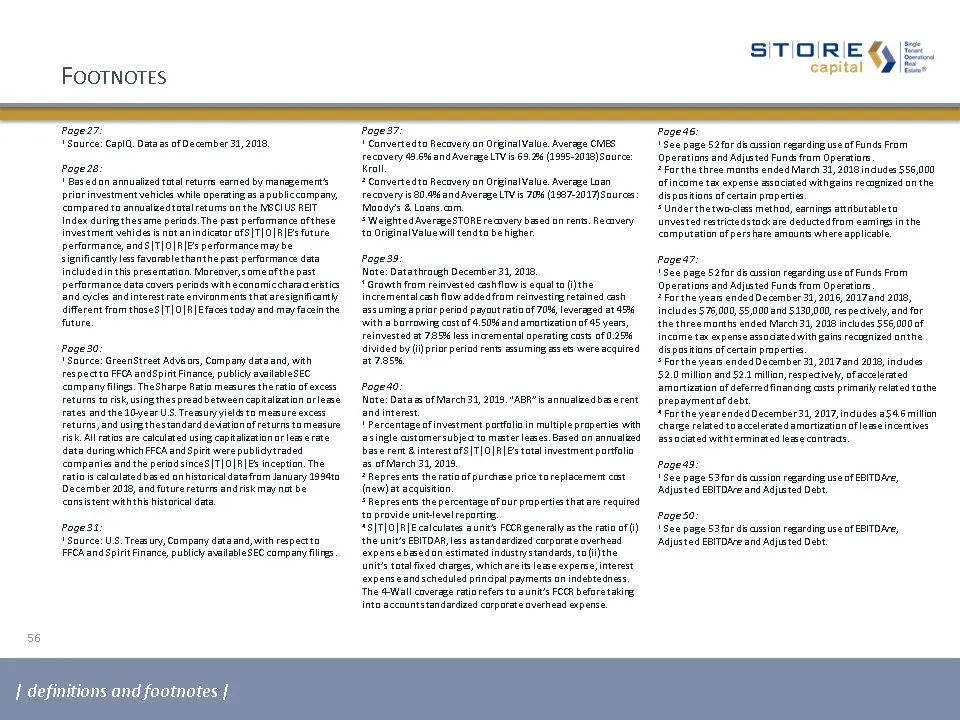
Footnotes 56 Page 27:1 Source: CapIQ. Data as of December 31, 2018. Page 28:1 Based on annualized total returns earned by management’s prior investment vehicles while operating as a public company, compared to annualized total returns on the MSCI US REIT Index during the same periods. The past perfo
Slide 57: Investor and Media Contacts
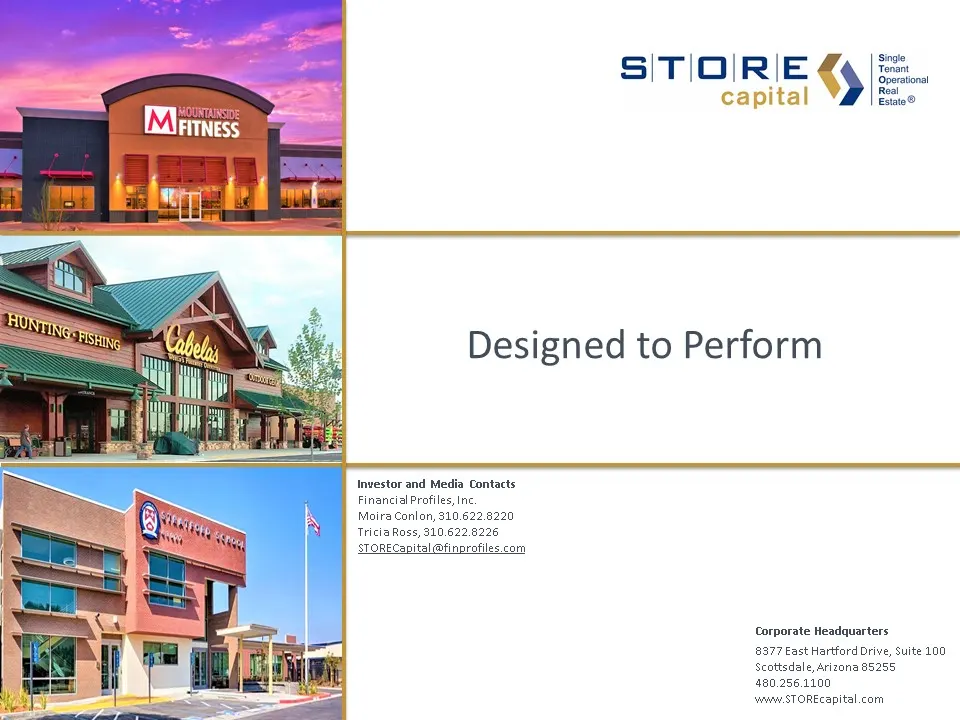
Investor and Media ContactsFinancial Profiles, Inc.Moira Conlon, 310.622.8220Tricia Ross, 310.622.8226STORECapital@finprofiles.com Corporate Headquarters8377 East Hartford Drive, Suite 100Scottsdale, Arizona 85255480.256.1100www.STOREcapital.com
Source: SEC EDGAR · 8-K filed May 2, 2019
More decks from STORE Capital Corp
 Q2 2023 Earnings Presentation10 slides · Aug 4, 2023
 Q2 2022 Earnings Presentation26 slides · Aug 3, 2022
 Q2 2022 Earnings Presentation22 slides · Aug 3, 2022
 Q1 2022 Earnings Presentation26 slides · May 4, 2022
 Q1 2022 Earnings Presentation22 slides · May 4, 2022
 Q4 2021 Earnings Presentation33 slides · Feb 23, 2022