SITE Centers Corp. · NYSE:SITC
SITE Centers — Merger or Acquisition (October 2023)
42 slides from SITE Centers's merger presentation, October 2023

Slide 1: Spin-off of Curbline Properties: SITE Centers' Convenience Portfolio
SITE CENTERS SPIN-OFF OF CURBLINE PROPERTIES: SITE CENTERS’ CONVENIENCE PORTFOLIO OCTOBER 2023
Slide 2: Safe Harbor Statement
SAFE HARBOR STATEMENT The Company considers portions of the information in this presentation to be forward-looking statements within the meaning of Section 27A of the Securities Act of 1933 and Section 21E of the Securities Exchange Act of 1934, both as amended, with respect to the Company’s expecta
Slide 3: Transaction Overview: Unlocking a Unique Scalable Investment Opportunity
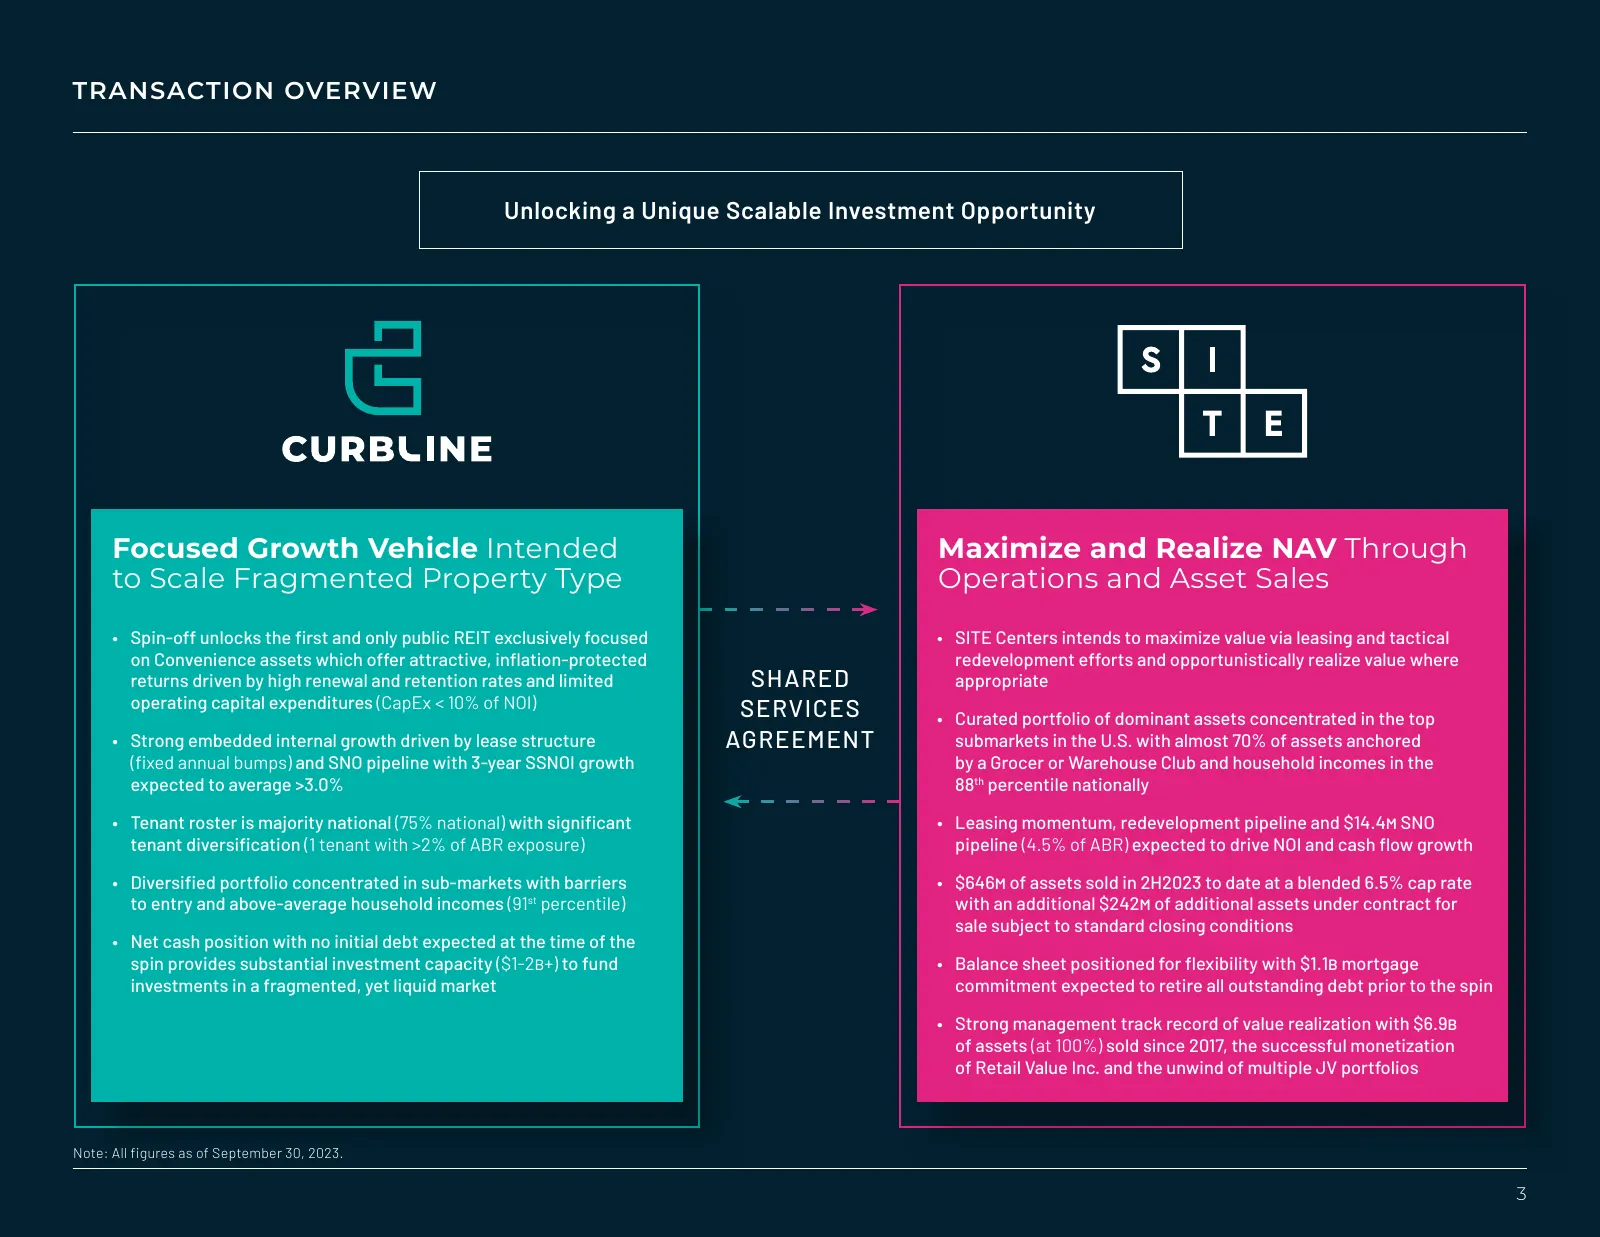
TRANSACTION OVERVIEW Unlocking a Unique Scalable Investment Opportunity Focused Growth Vehicle Intended Maximize and Realize NAV Through to Scale Fragmented Property Type Operations and Asset Sales • Spin-off unlocks the first and only public REIT exclusively focused • SITE Centers intends to maximi
Slide 4: Transaction Overview: Key Operating Metrics
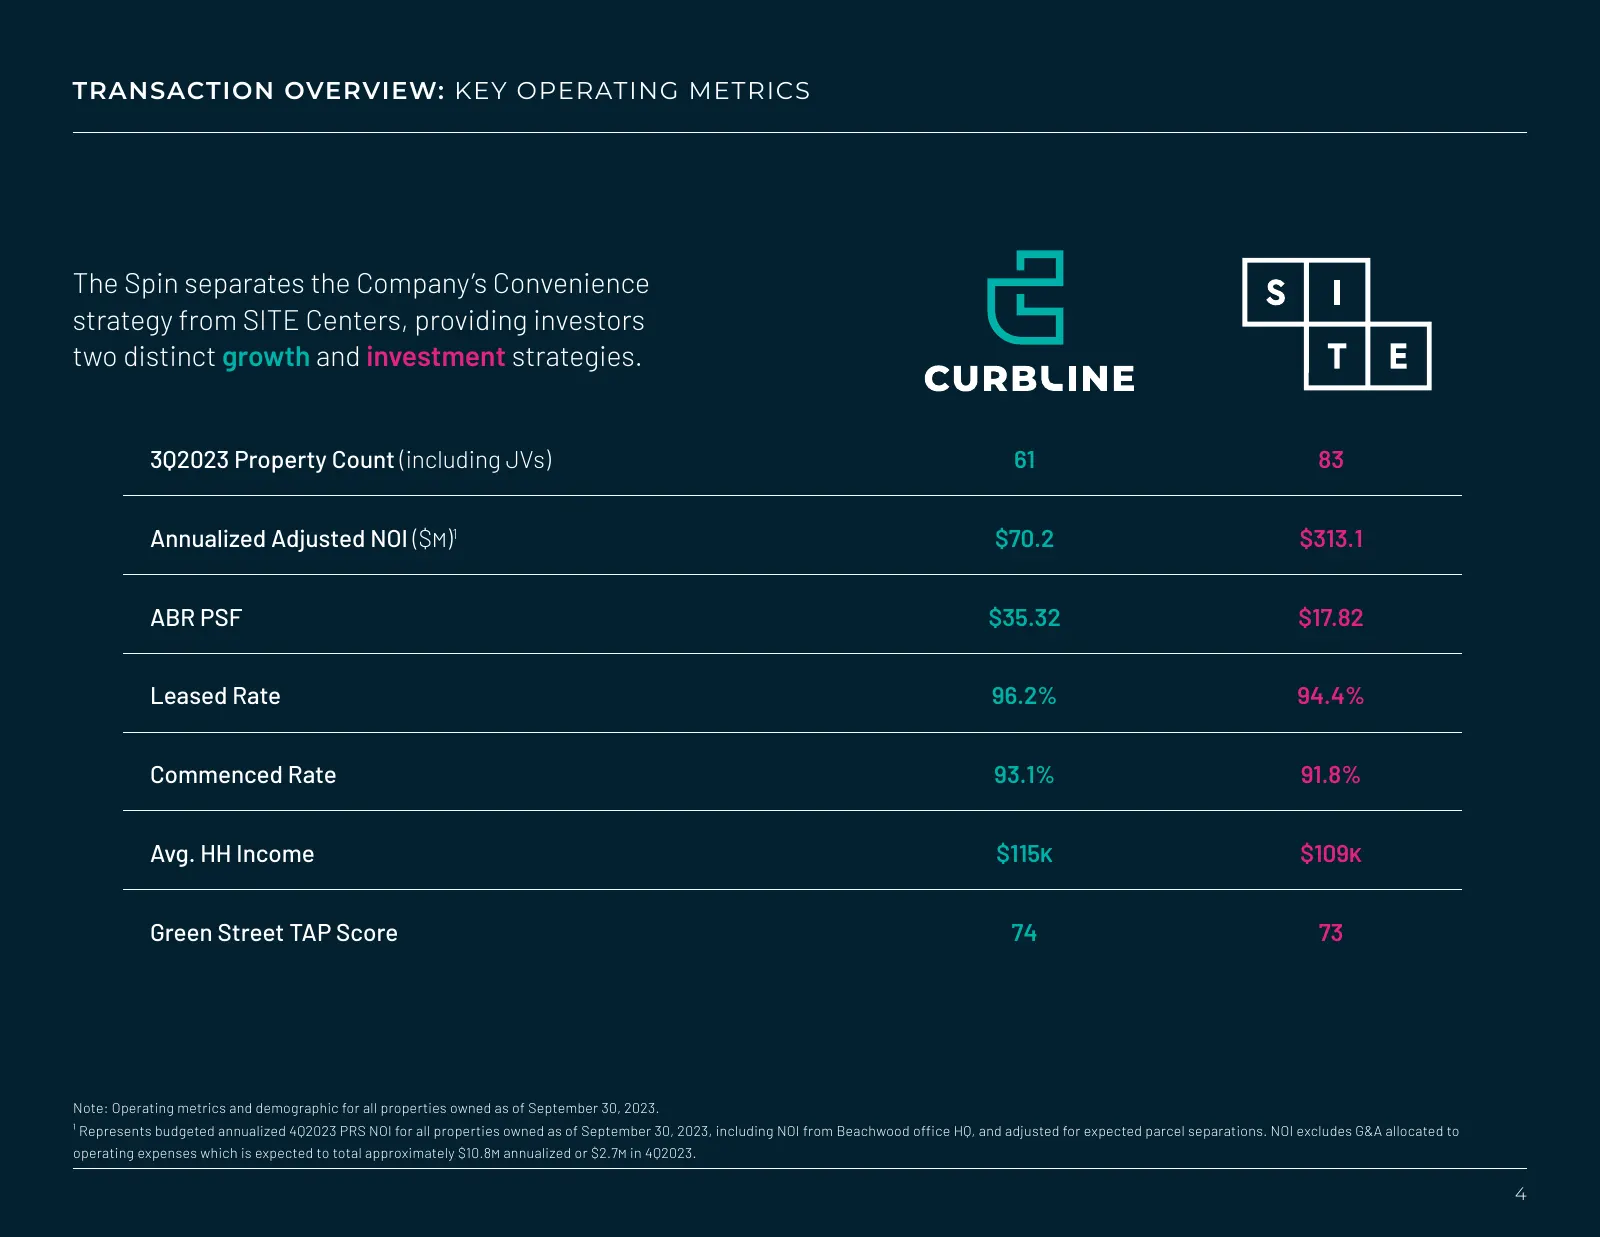
TRANSACTION OVERVIEW: KEY OPERATING METRICS The Spin separates the Company’s Convenience strategy from SITE Centers, providing investors two distinct growth and investment strategies. 3Q2023 Property Count (including JVs) 61 83 Annualized Adjusted NOI ($m)1 $70.2 $313.1 ABR PSF $35.32 $17.82 Leased
Slide 5: Transaction Overview: Estimated Timeline & Cash Flows
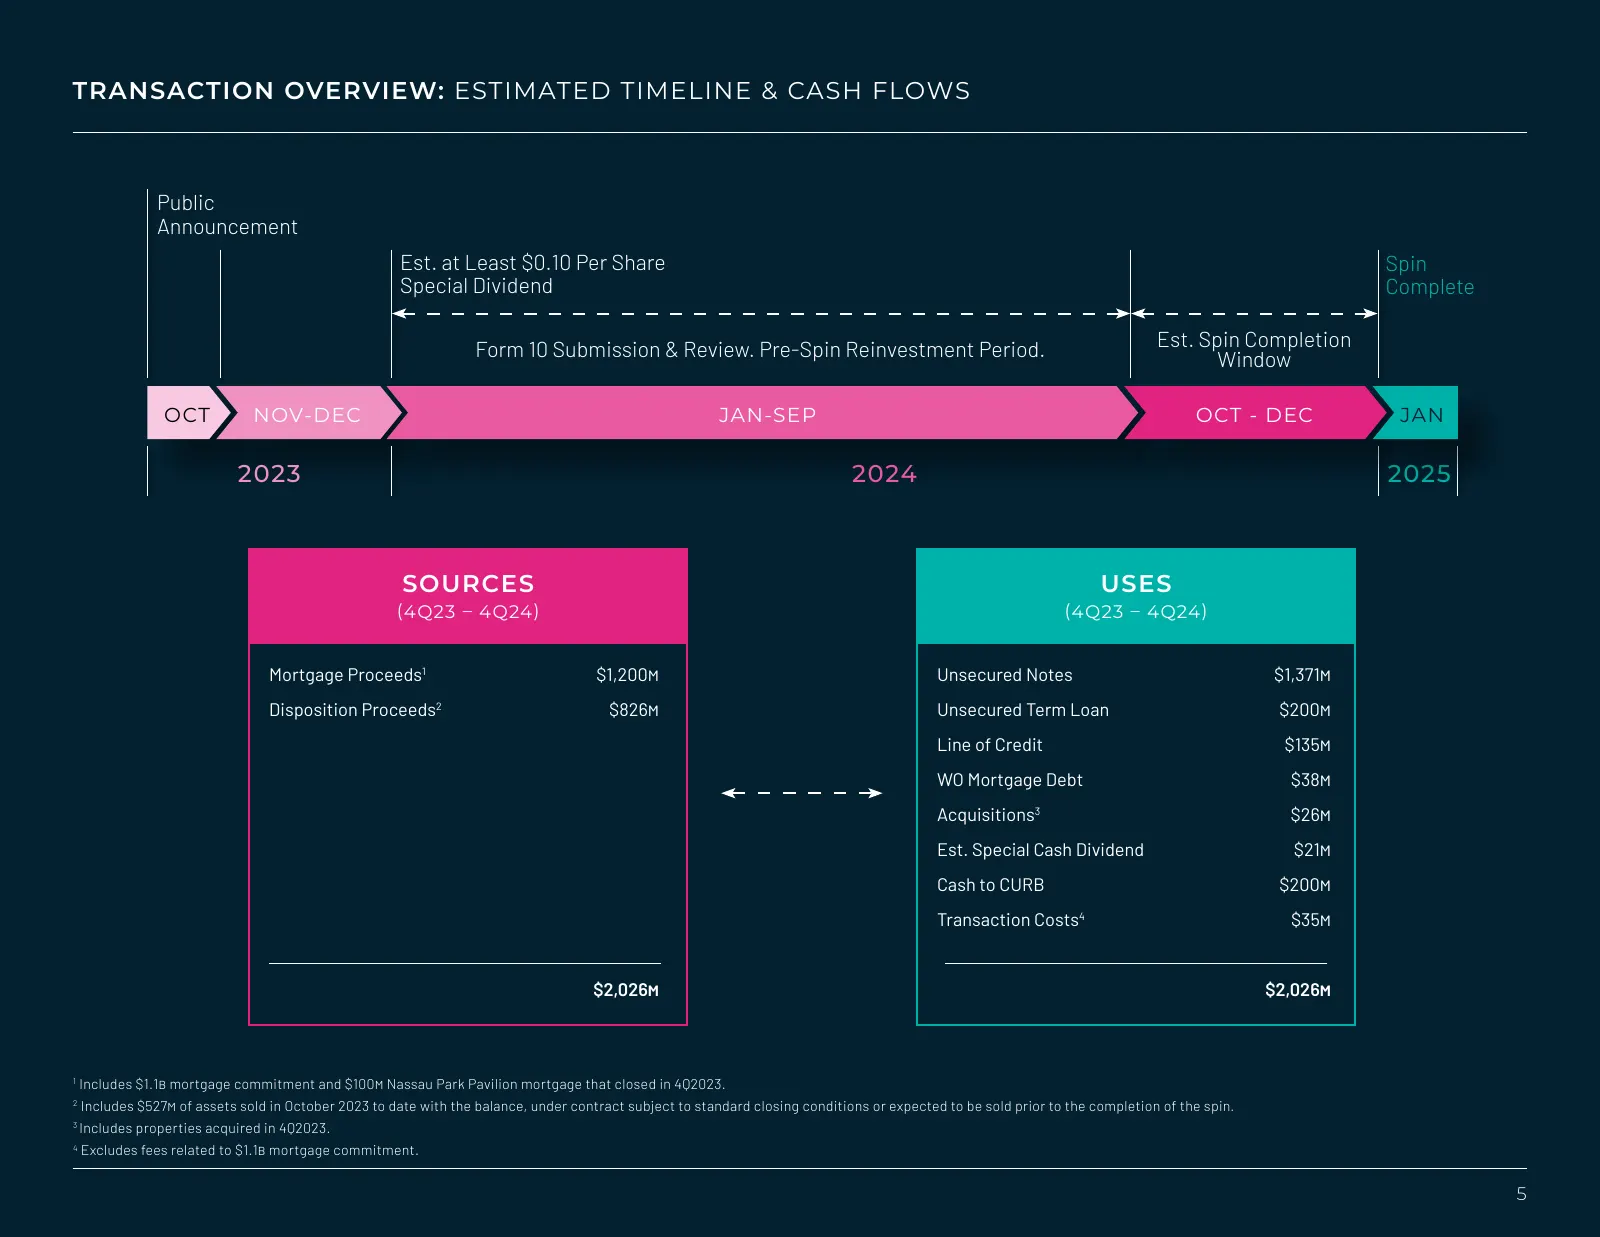
TRANSACTION OVERVIEW: ESTIMATED TIMELINE & CASH FLOWS Public Announcement Est. at Least $0.10 Per Share Spin Special Dividend Complete Form 10 Submission & Review. Pre-Spin Reinvestment Period. Est. Spin Completion Window OCT NOV-DEC JAN-SEP OCT - DEC JAN 2023 2024 2025 SOURCES USES (4Q23 – 4Q24) (4
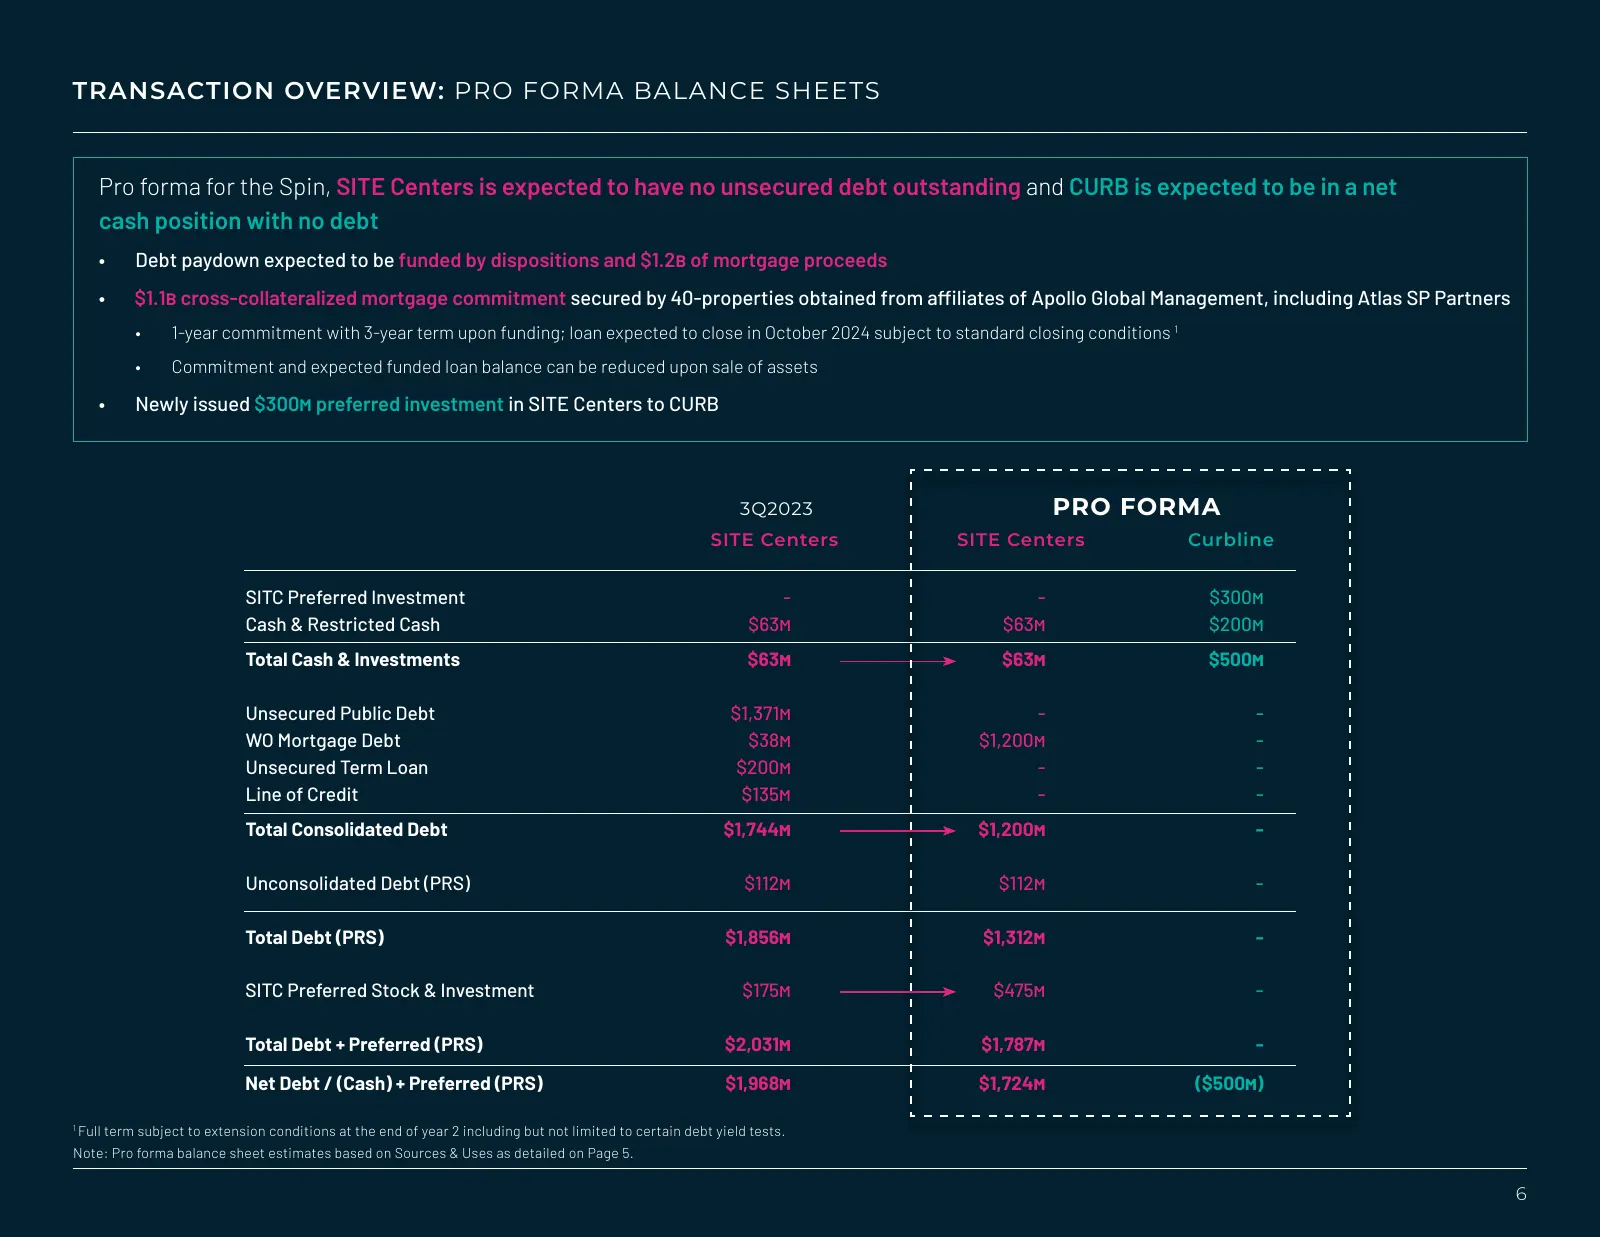
Slide 6: Transaction Overview: Pro Forma Balance Sheets
TRANSACTION OVERVIEW: PRO FORMA BALANCE SHEETS Pro forma for the Spin, SITE Centers is expected to have no unsecured debt outstanding and CURB is expected to be in a net cash position with no debt • Debt paydown expected to be funded by dispositions and $1.2b of mortgage proceeds • $1.1b cross-colla

Slide 7: Curbline Properties (CURB)
CURBLINE PROPERTIES (CURB) 7
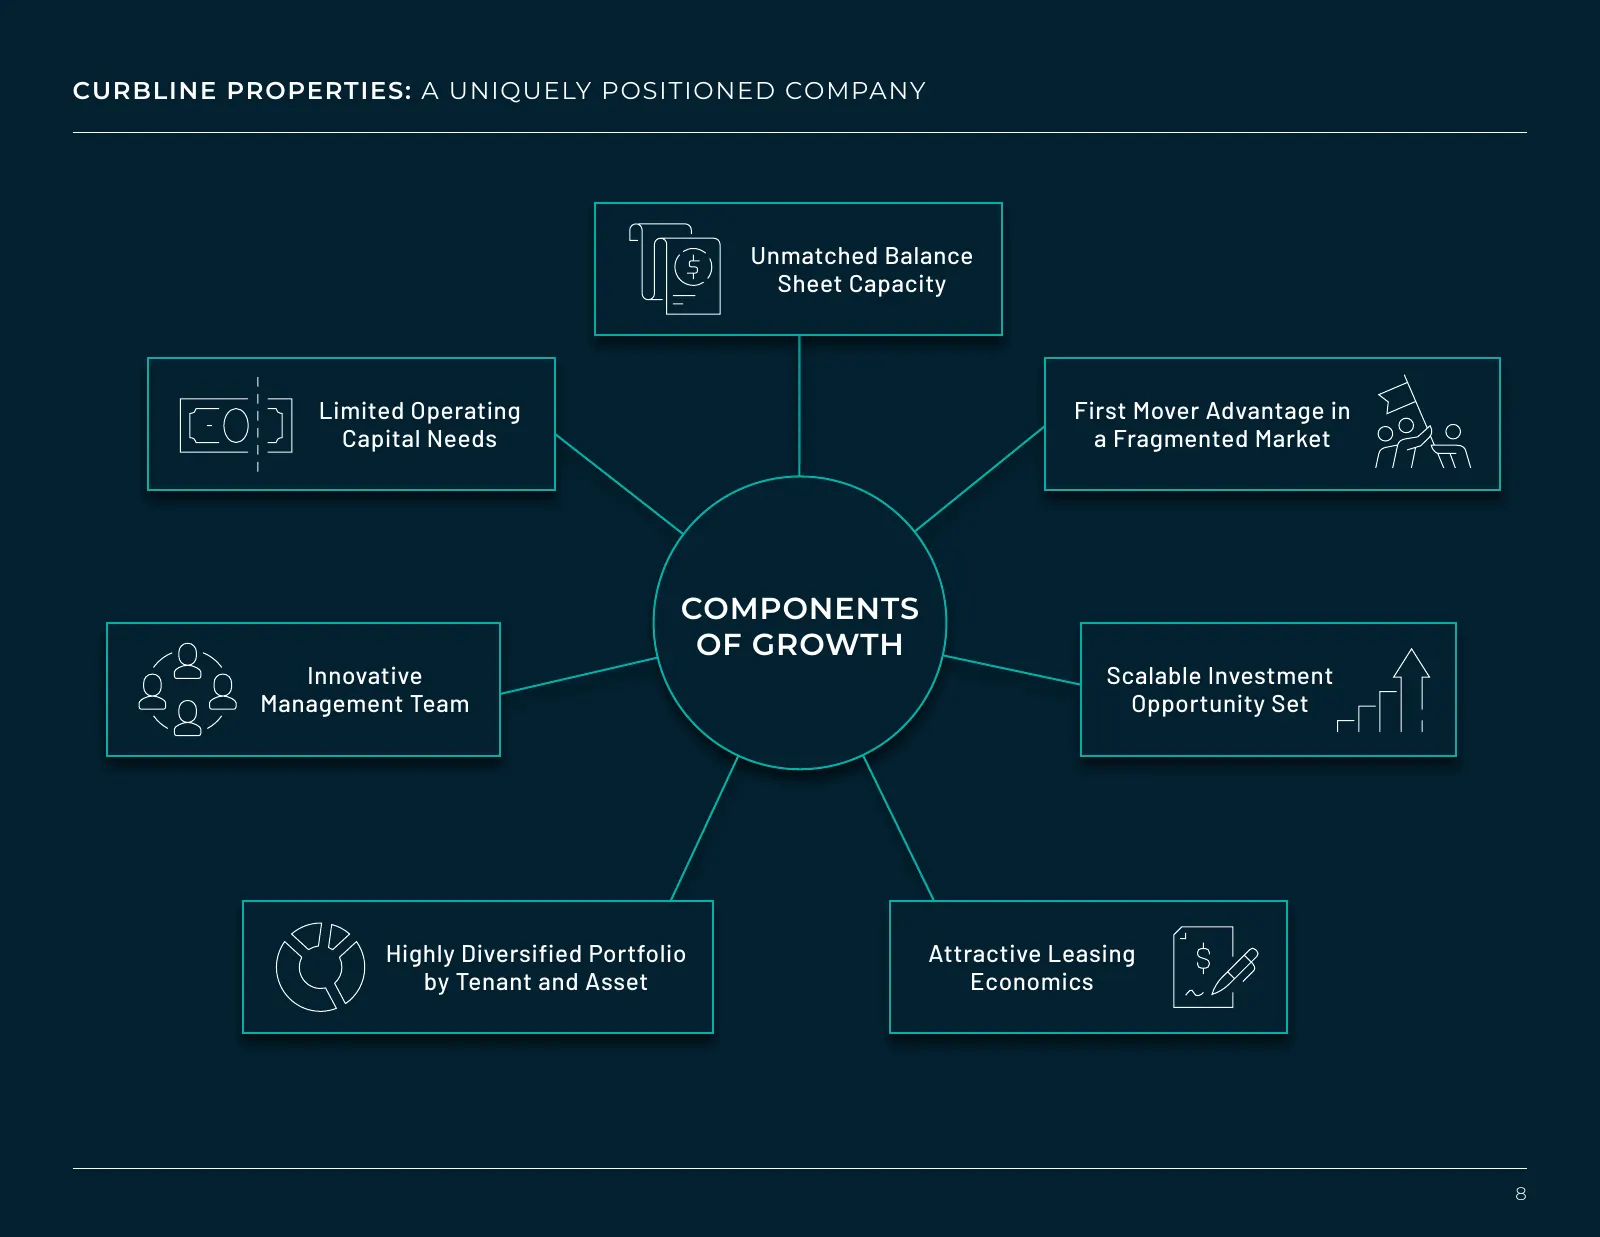
Slide 8: Components of Growth: A Uniquely Positioned Company
CURBLINE PROPERTIES: A UNIQUELY POSITIONED COMPANY Unmatched Balance Sheet Capacity Limited Operating First Mover Advantage in Capital Needs a Fragmented Market COMPONENTS OF GROWTH Innovative Scalable Investment Management Team Opportunity Set Highly Diversified Portfolio Attractive Leasing by Tena
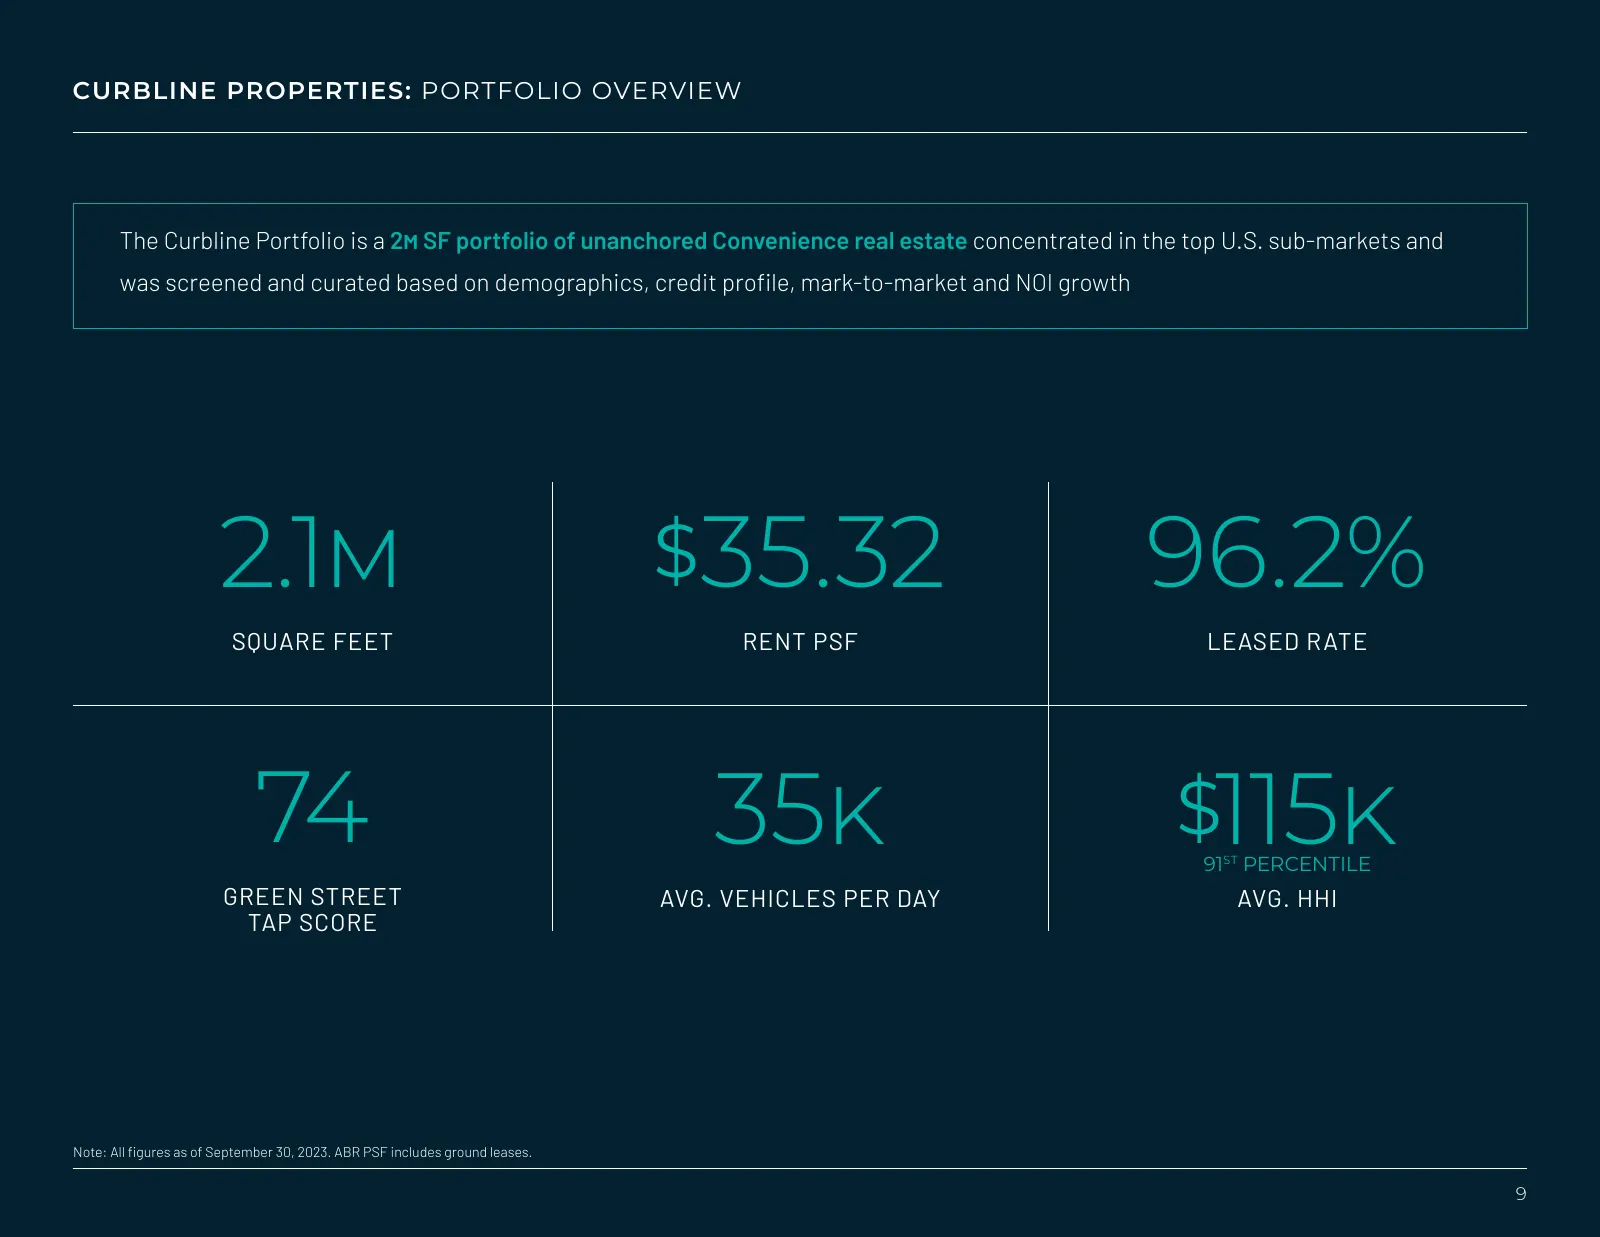
Slide 9: Curbline Properties: Portfolio Overview
CURBLINE PROPERTIES: PORTFOLIO OVERVIEW The Curbline Portfolio is a 2m SF portfolio of unanchored Convenience real estate concentrated in the top U.S. sub-markets and was screened and curated based on demographics, credit profile, mark-to-market and NOI growth 2.1m $35.32 96.2% SQUARE FEET RENT PSF
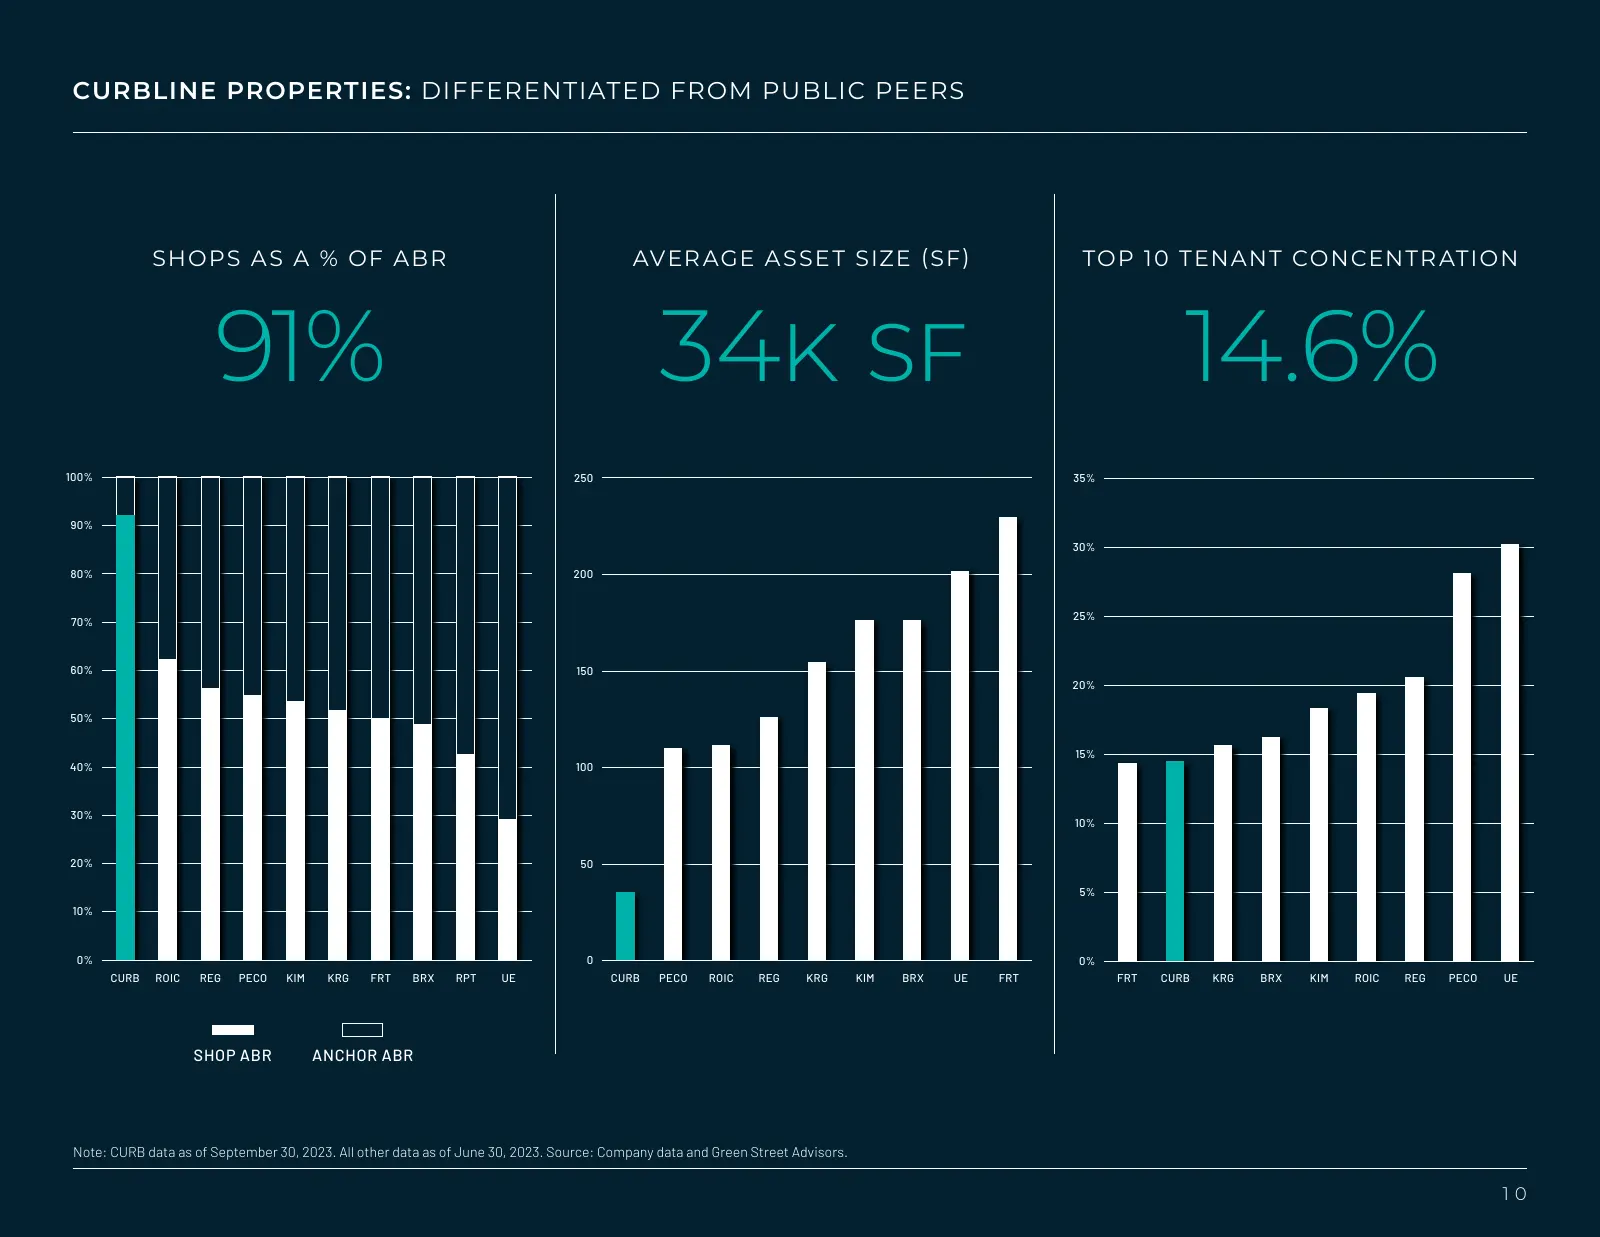
Slide 10: Differentiated from Public Peers
CURBLINE PROPERTIES: DIFFERENTIATED FROM PUBLIC PEERS SHOPS A S A % OF ABR AVER AGE A S SE T SIZE (SF) TOP 1 0 TENANT CONCENTR ATION 91% 34k sf 14.6% 100% 250 35% 90% 30% 80% 200 25% 70% 60% 150 20% 50% 15% 40% 100 30% 10% 20% 50 5% 10% 0% 0 0% CURB ROIC REG PECO KIM KRG FRT BRX RPT UE CURB PECO ROI
Slide 11: Curbline Properties: Diversified Geographic Exposure
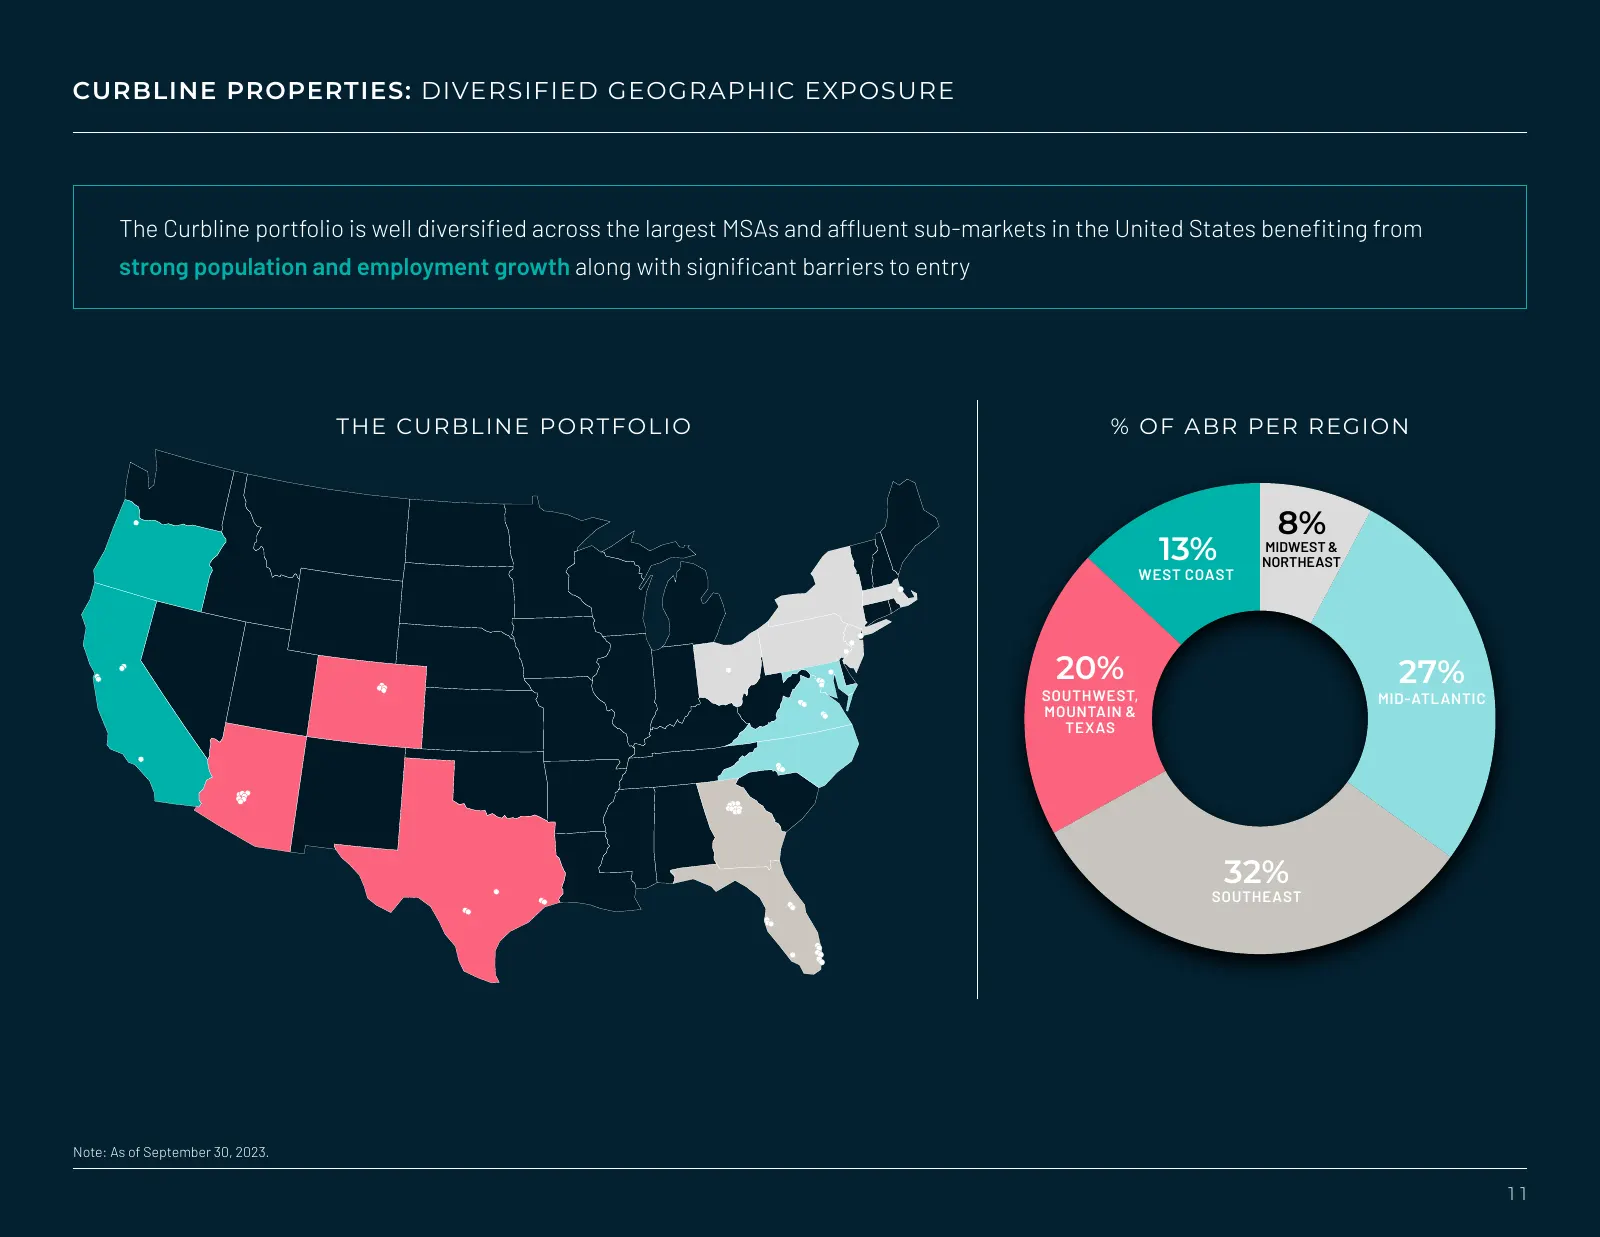
CURBLINE PROPERTIES: DIVERSIFIED GEOGRAPHIC EXPOSURE The Curbline portfolio is well diversified across the largest MSAs and affluent sub-markets in the United States benefiting from strong population and employment growth along with significant barriers to entry THE CURBLINE PORTFOLIO % OF ABR PER R
Slide 12: Key Convenience Sector Attributes
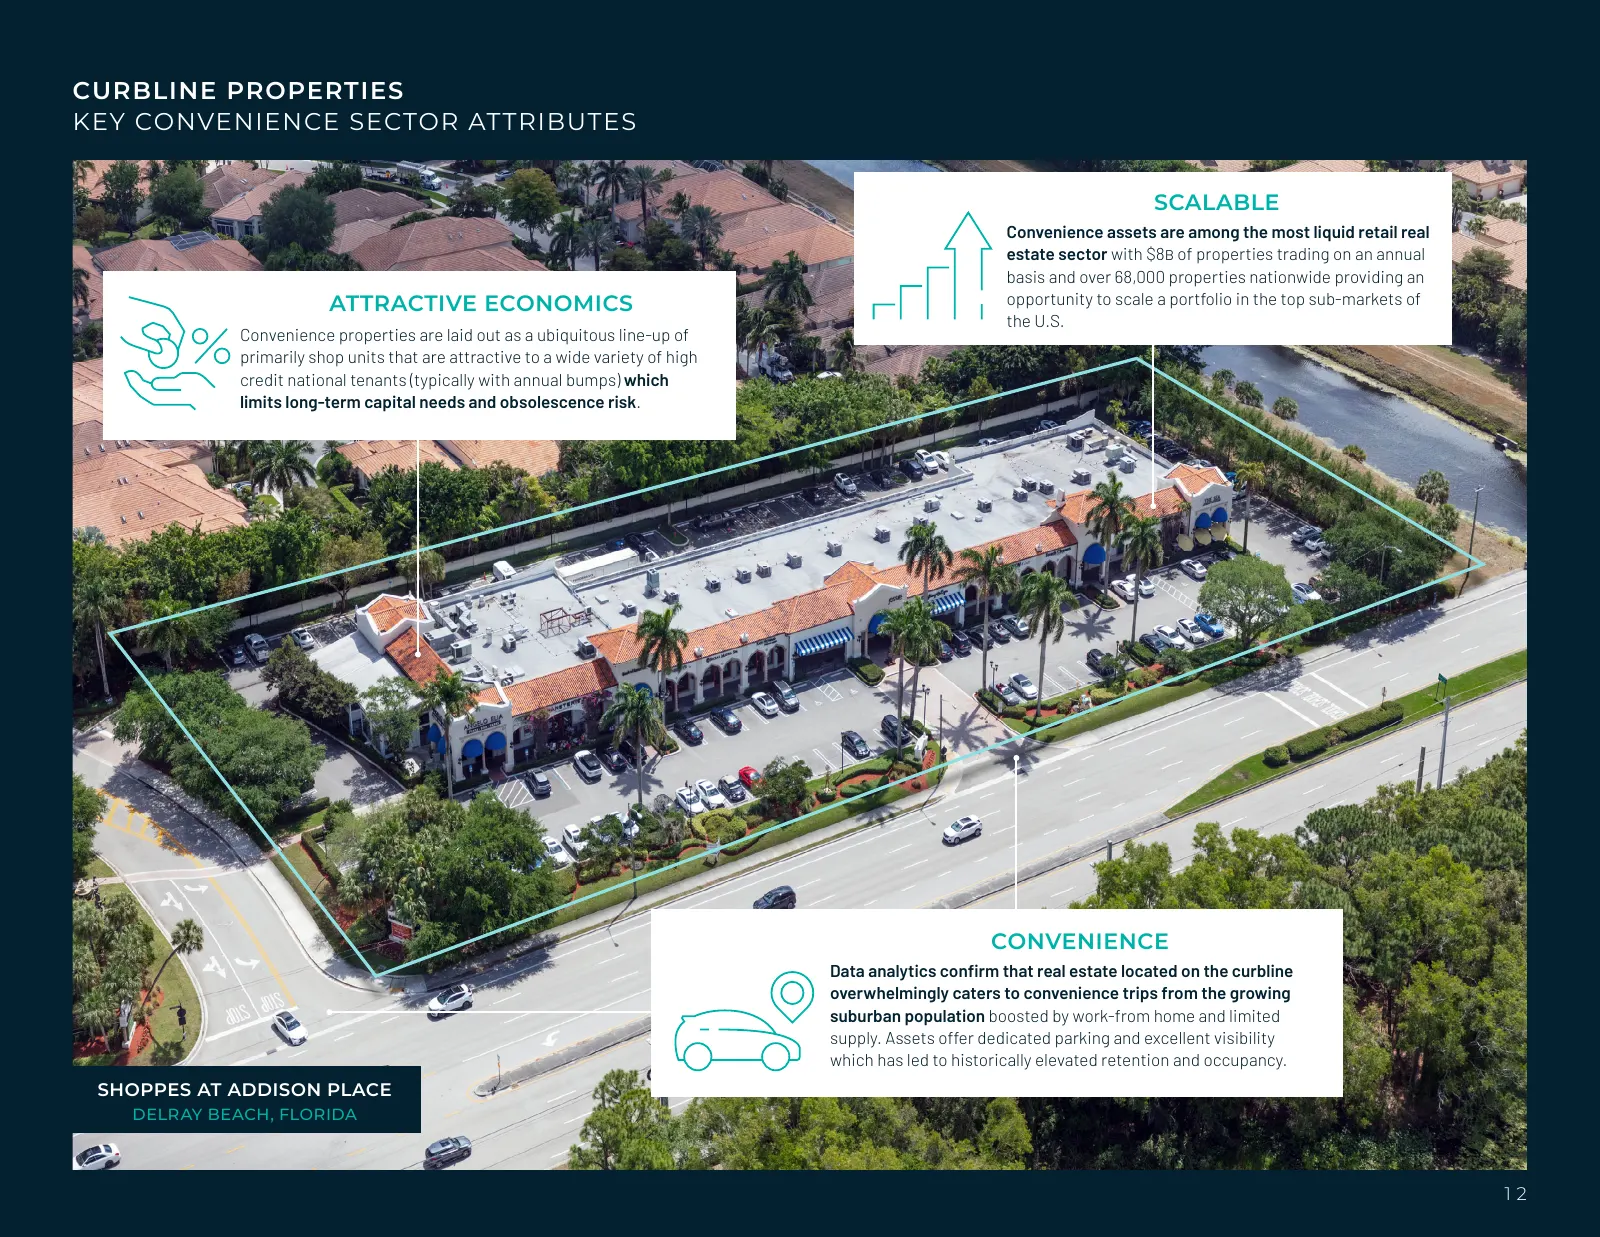
CURBLINE PROPERTIES KEY CONVENIENCE SECTOR ATTRIBUTES SCALABLE Convenience assets are among the most liquid retail real estate sector with $8b of properties trading on an annual basis and over 68,000 properties nationwide providing an ATTRACTIVE ECONOMICS opportunity to scale a portfolio in the top
Slide 13: Convenience: Excellent Access, Visibility and Dedicated Parking
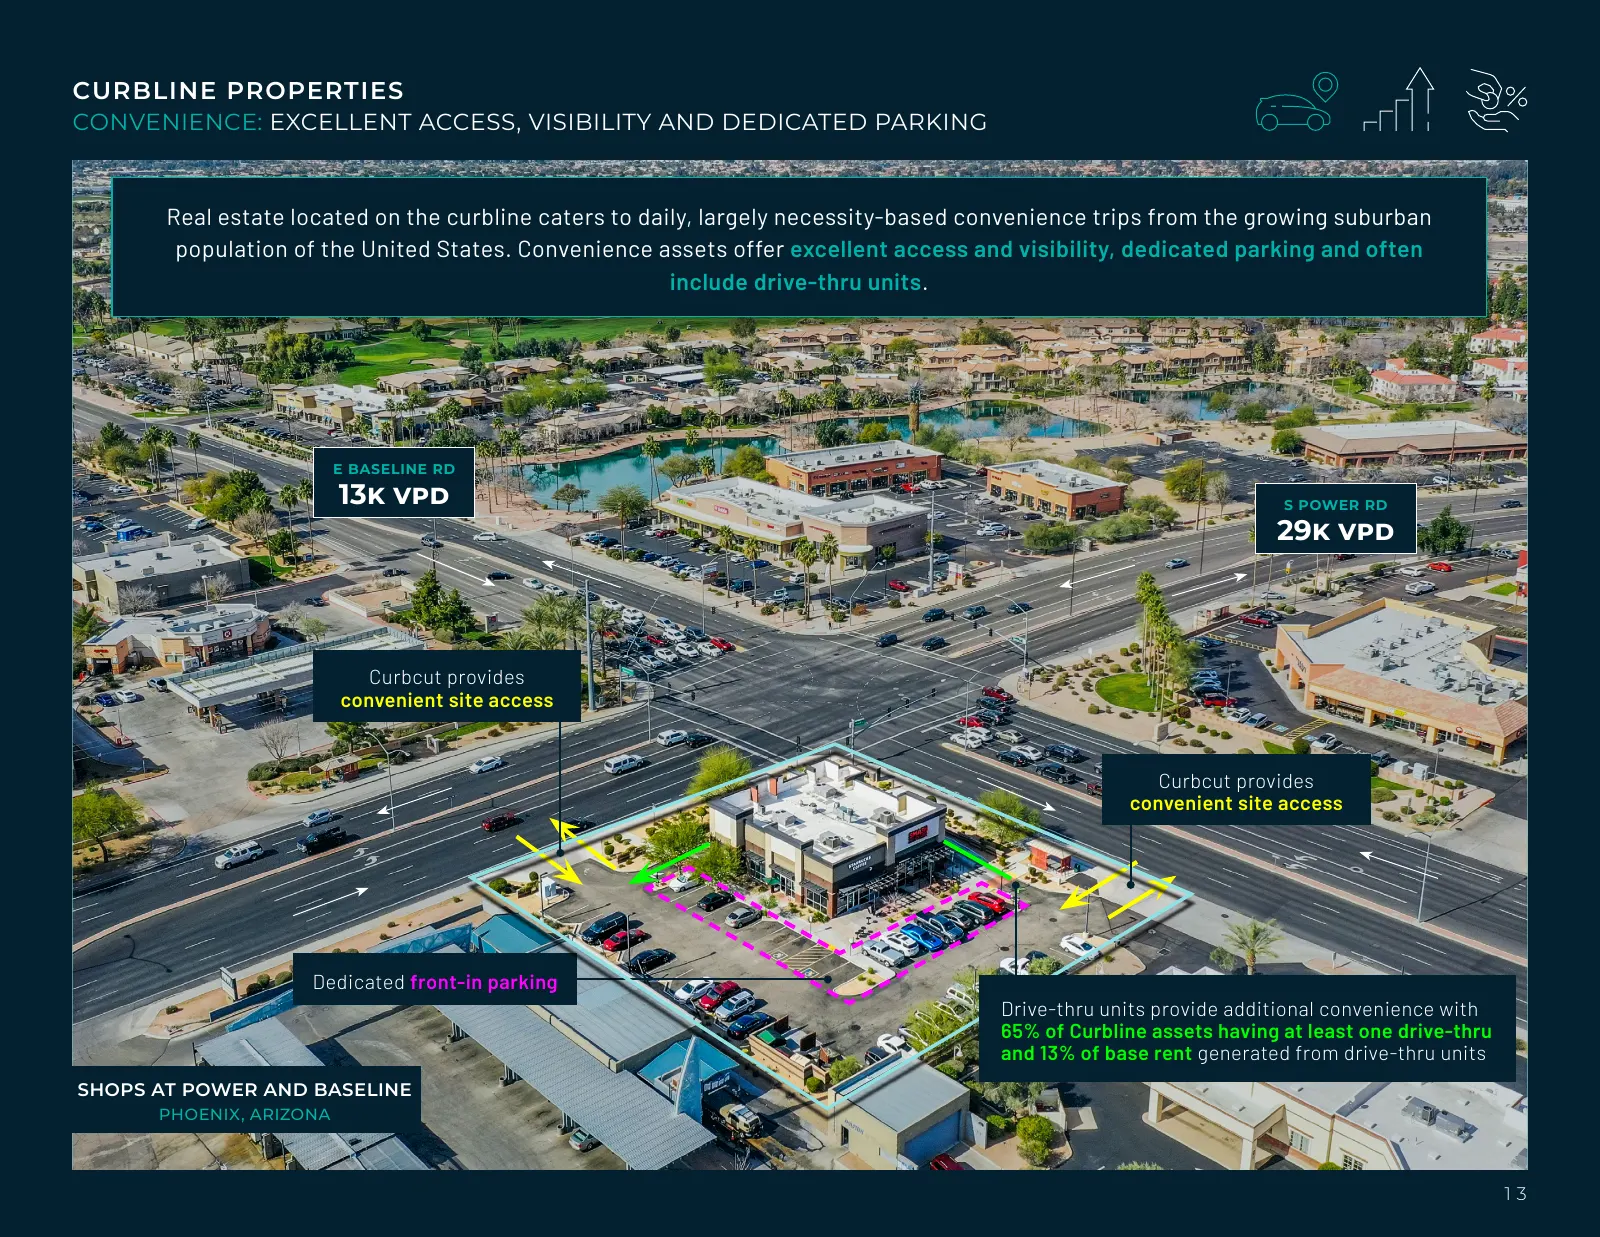
CURBLINE PROPERTIES CONVENIENCE: EXCELLENT ACCESS, VISIBILITY AND DEDICATED PARKING Real estate located on the curbline caters to daily, largely necessity-based convenience trips from the growing suburban population of the United States. Convenience assets offer excellent access and visibility, dedi
Slide 14: Convenience: Data Case Study - Shoppes of Crabapple
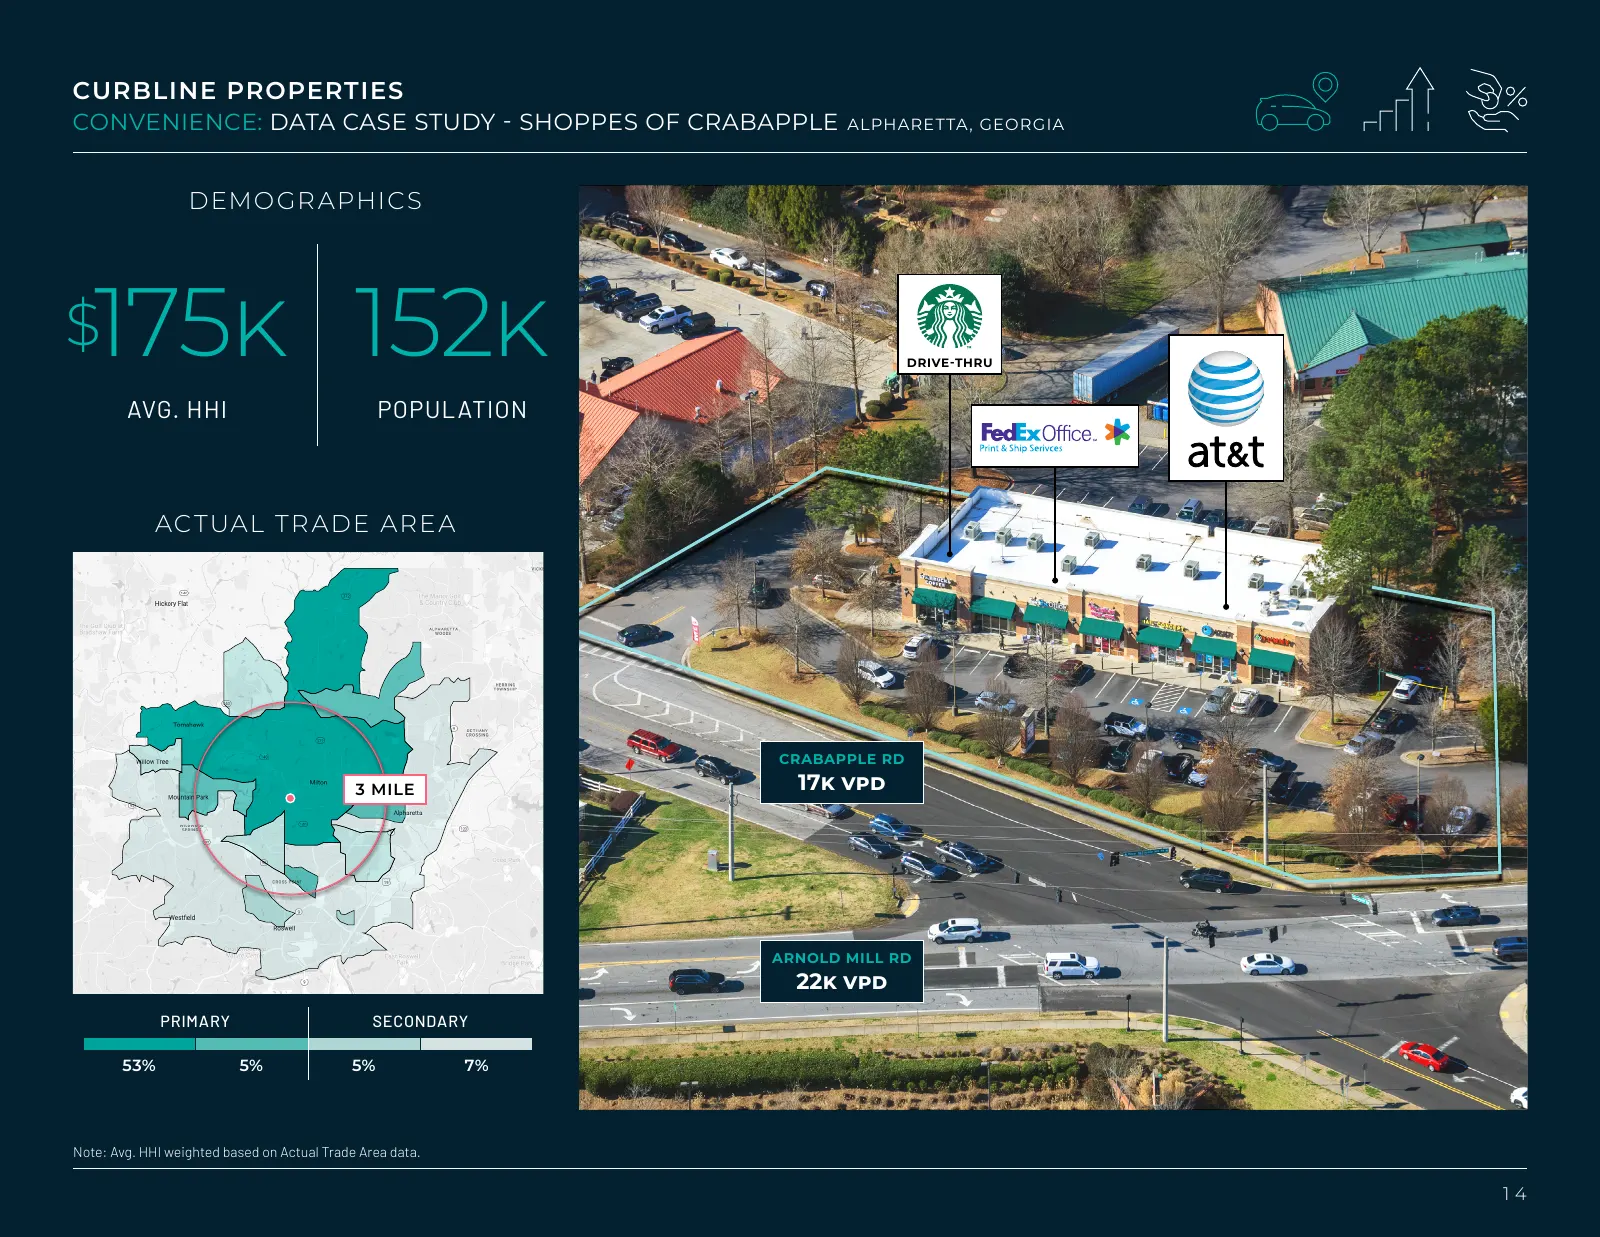
CURBLINE PROPERTIES CONVENIENCE: DATA CASE STUDY - SHOPPES OF CRABAPPLE ALPHARETTA , GEORGIA DEMO GR APHIC S $ 175k 152k DRIVE-THRU AVG. HHI POPULATION AC TUAL TR ADE ARE A CRABAPPLE RD 3 MILE 17k vpd ARNOLD MILL RD 22k vpd PRIMARY SECONDARY 53% 5% 5% 7% Note: Avg. HHI weighted based on Actual Trade
Slide 15: Convenience: Data Case Study - What Our Data Proves
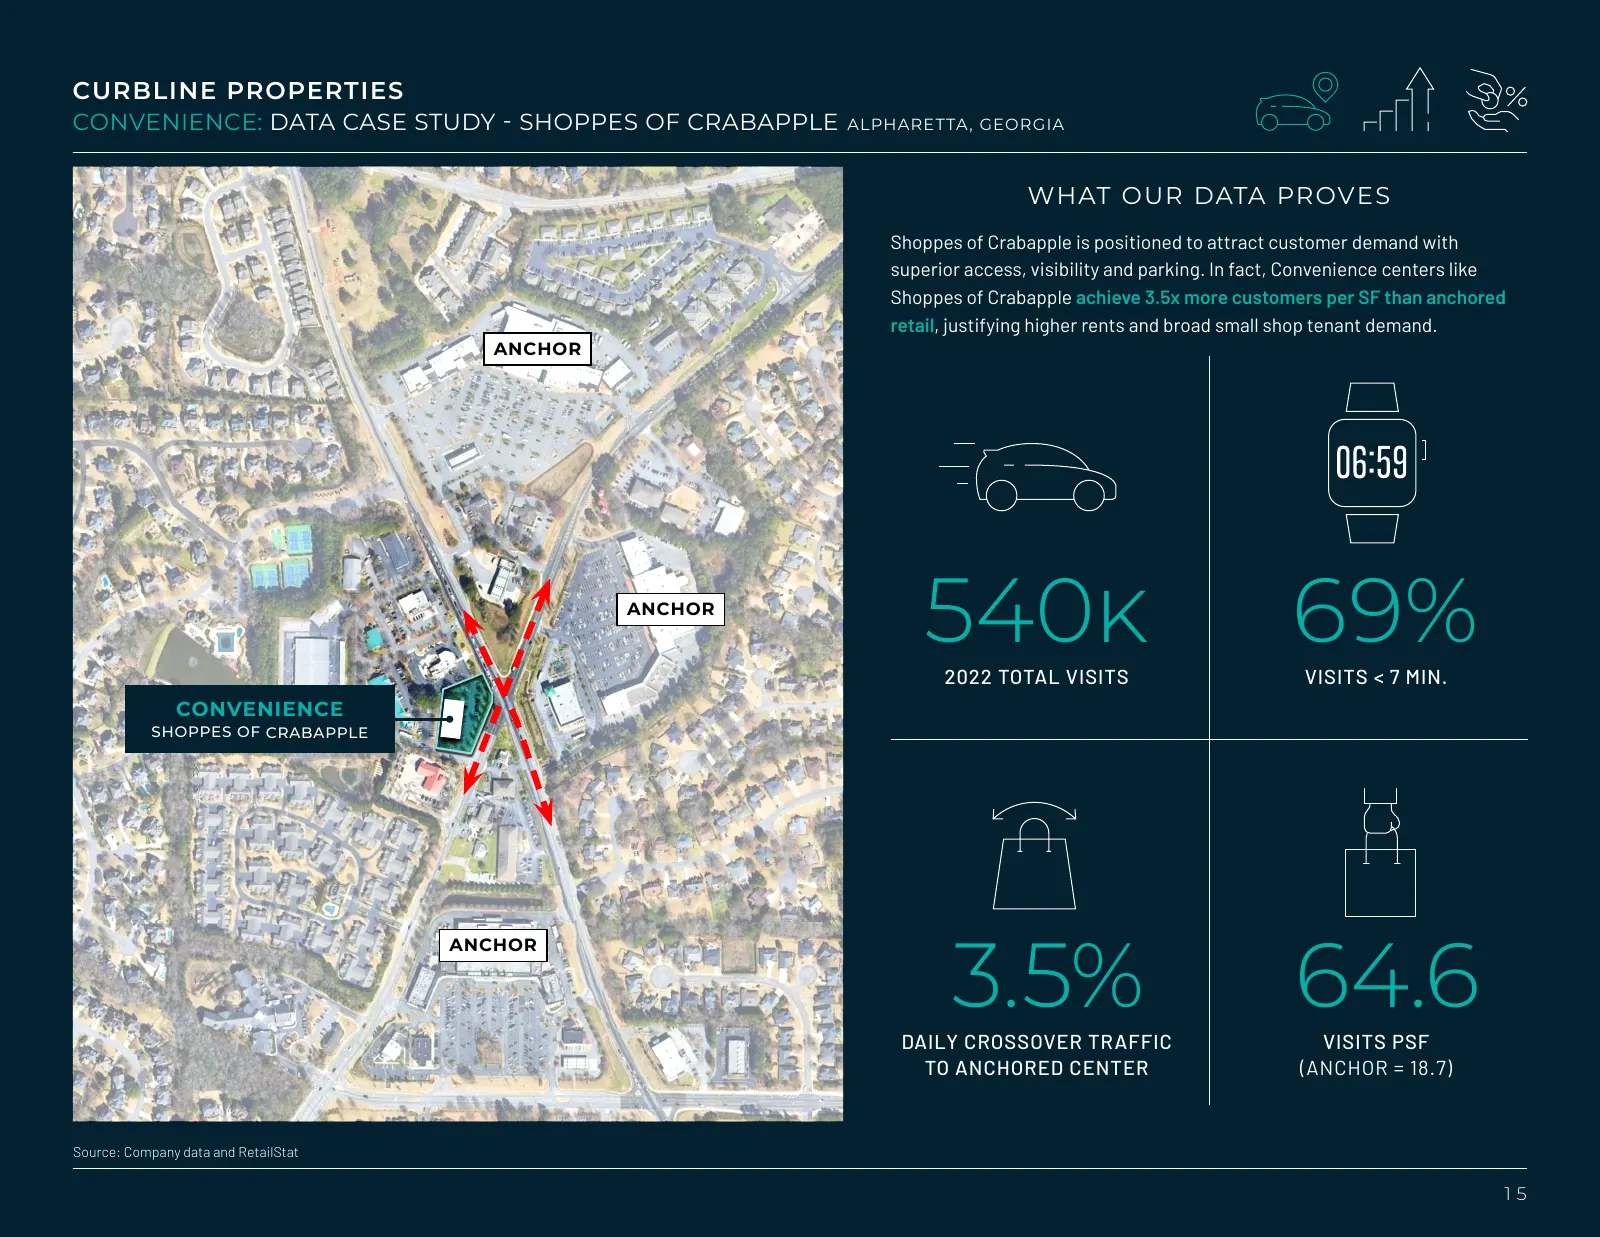
CURBLINE PROPERTIES CONVENIENCE: DATA CASE STUDY - SHOPPES OF CRABAPPLE ALPHARETTA , GEORGIA WHAT OUR DATA PROVES Shoppes of Crabapple is positioned to attract customer demand with superior access, visibility and parking. In fact, Convenience centers like Shoppes of Crabapple achieve 3.5x more custo
Slide 16: Convenience: Significant Depth and Breadth of Demand for Space
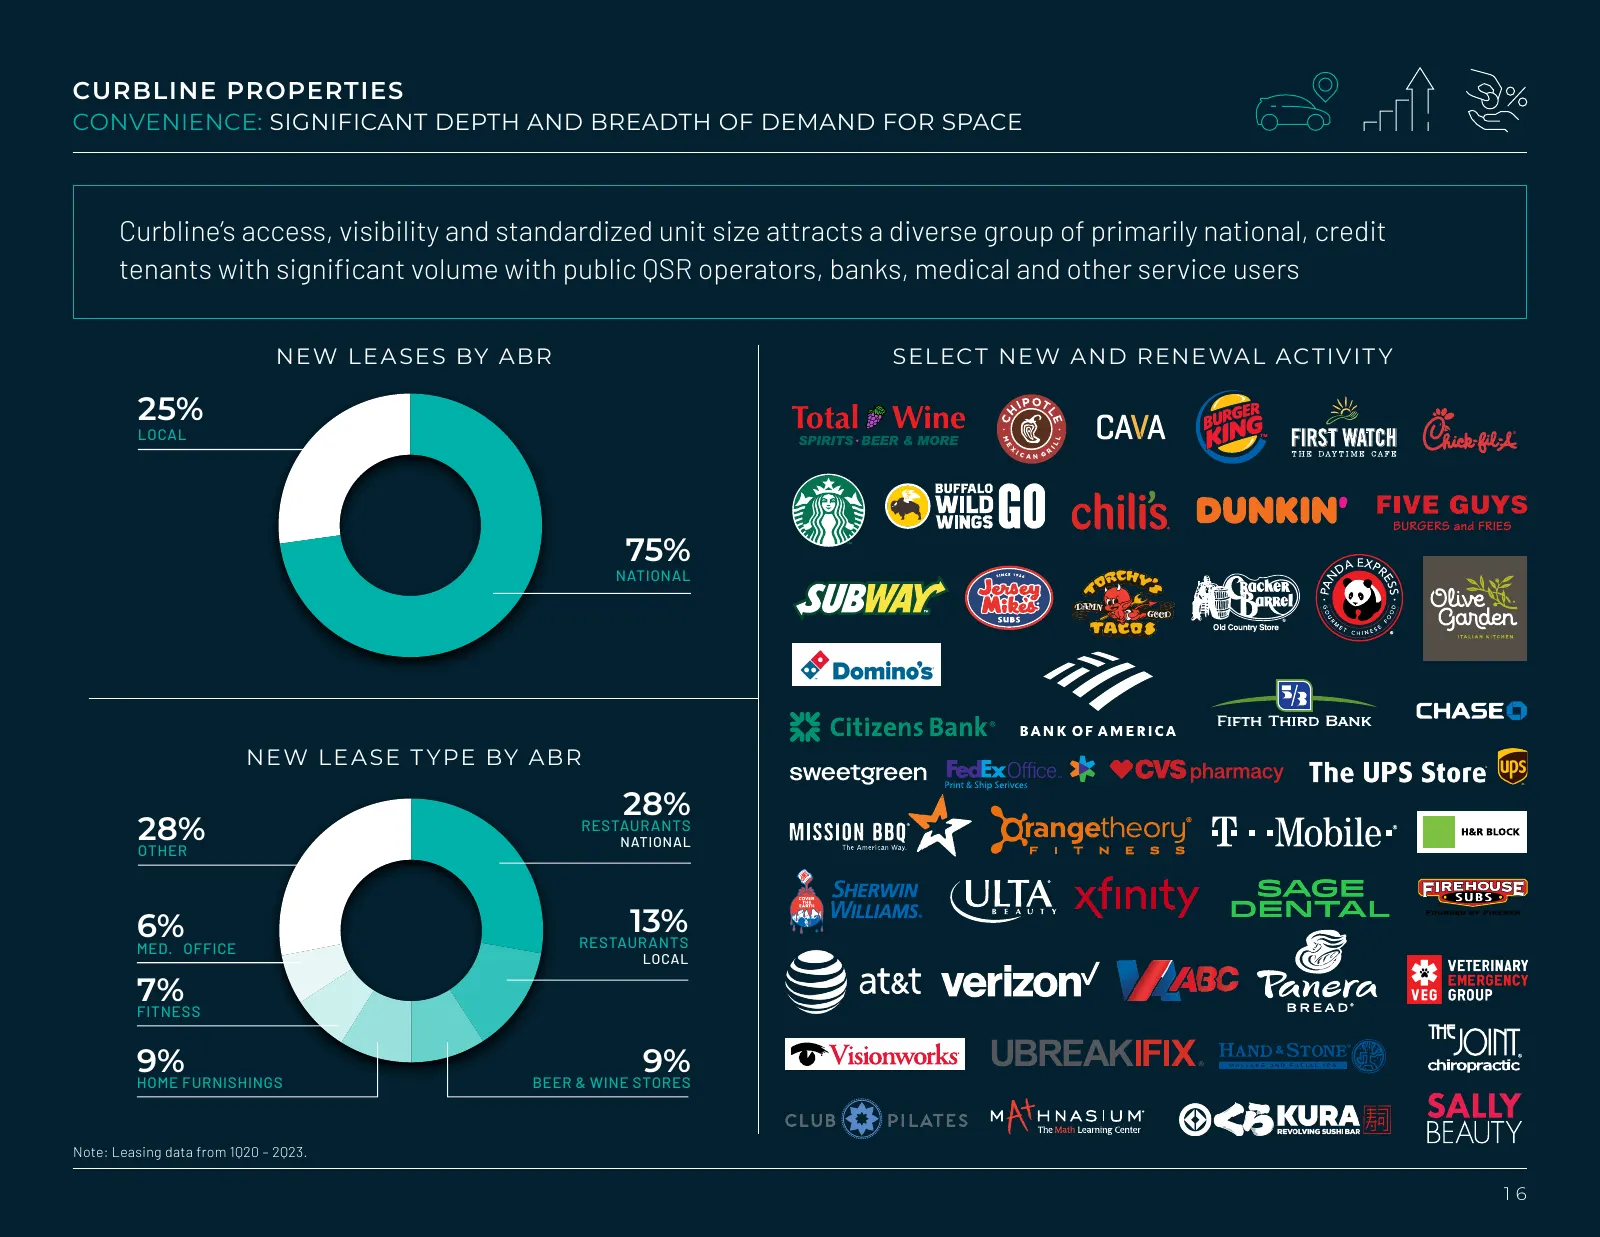
CURBLINE PROPERTIES CONVENIENCE: SIGNIFICANT DEPTH AND BREADTH OF DEMAND FOR SPACE Curbline’s access, visibility and standardized unit size attracts a diverse group of primarily national, credit tenants with significant volume with public QSR operators, banks, medical and other service users NEW LE
Slide 17: Convenience: Supply Demand Imbalance
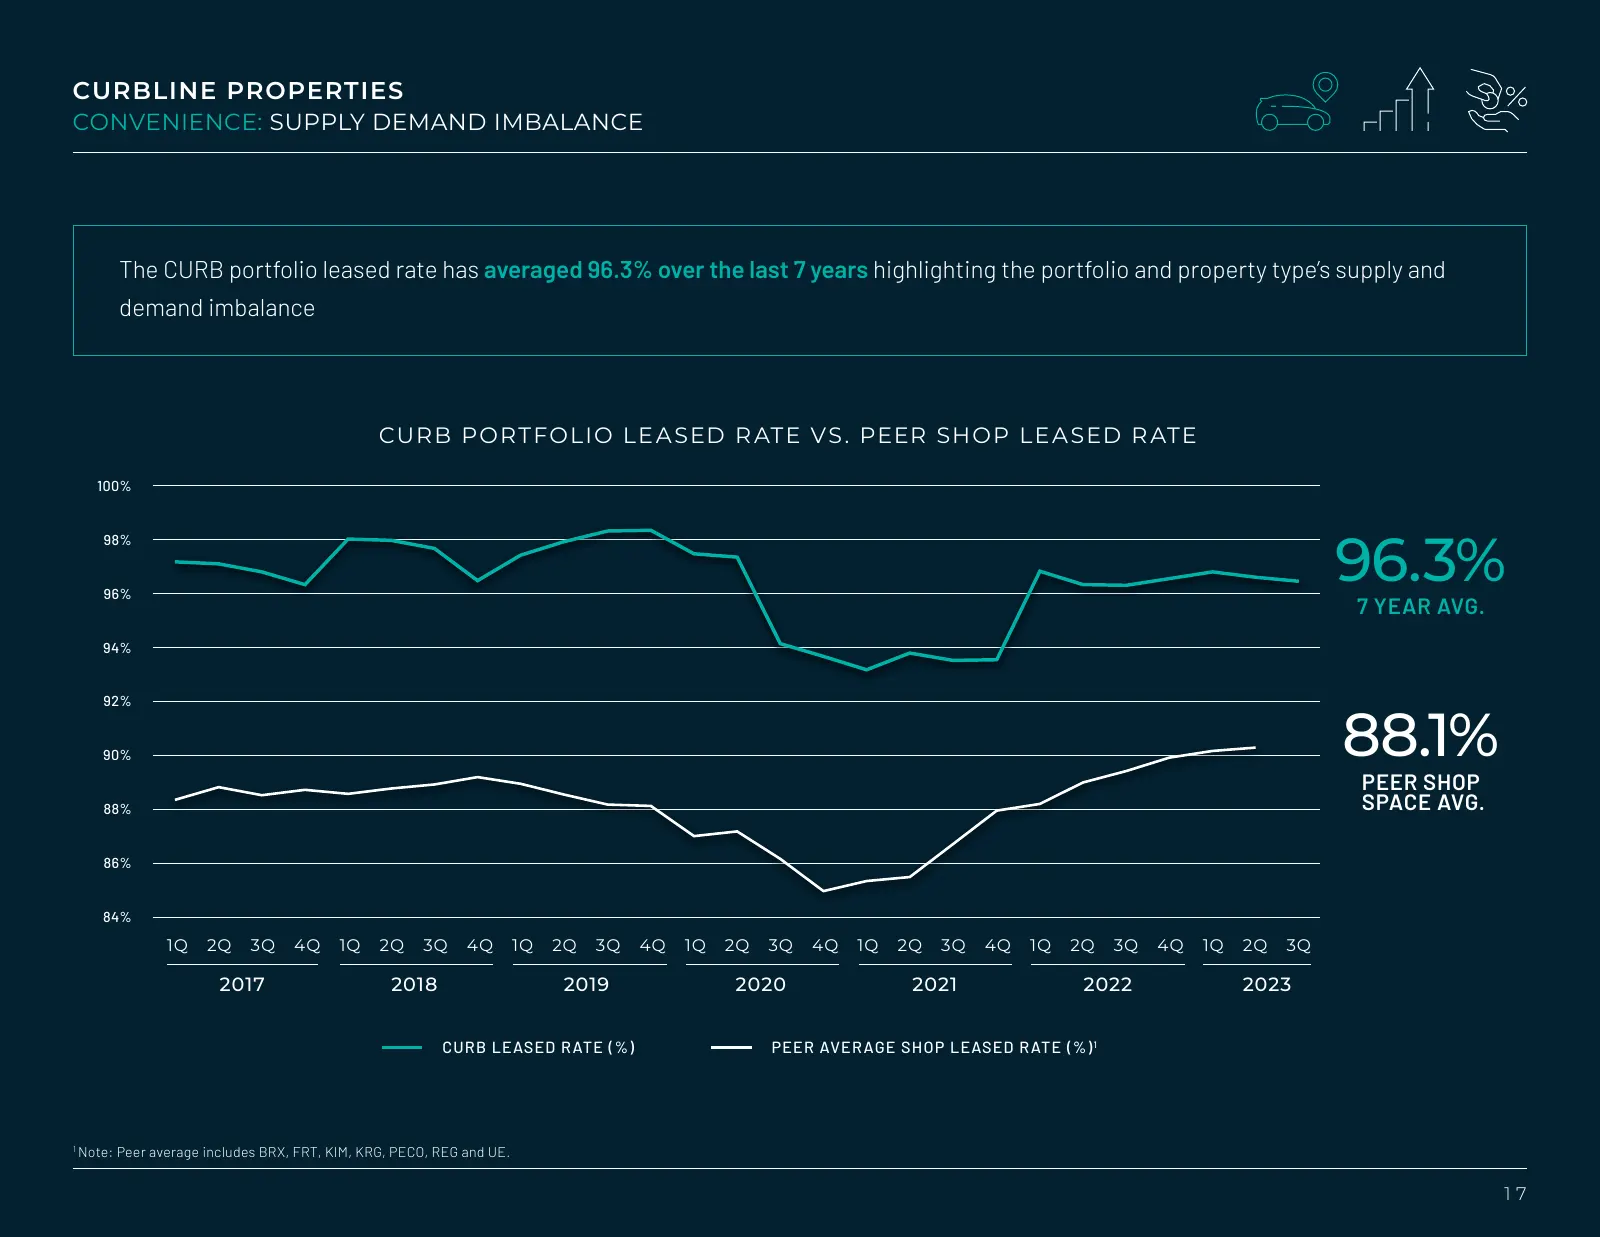
CURBLINE PROPERTIES CONVENIENCE: SUPPLY DEMAND IMBALANCE The CURB portfolio leased rate has averaged 96.3% over the last 7 years highlighting the portfolio and property type’s supply and demand imbalance CURB PORTFOLIO LE A SED R ATE VS . PEER SHOP LE A SED R ATE 100% 96.3% 98% 96% 7 YEAR AVG. 94% 9
Slide 18: Convenience: Traffic, Access & Demand Drive Compelling Lease Economics
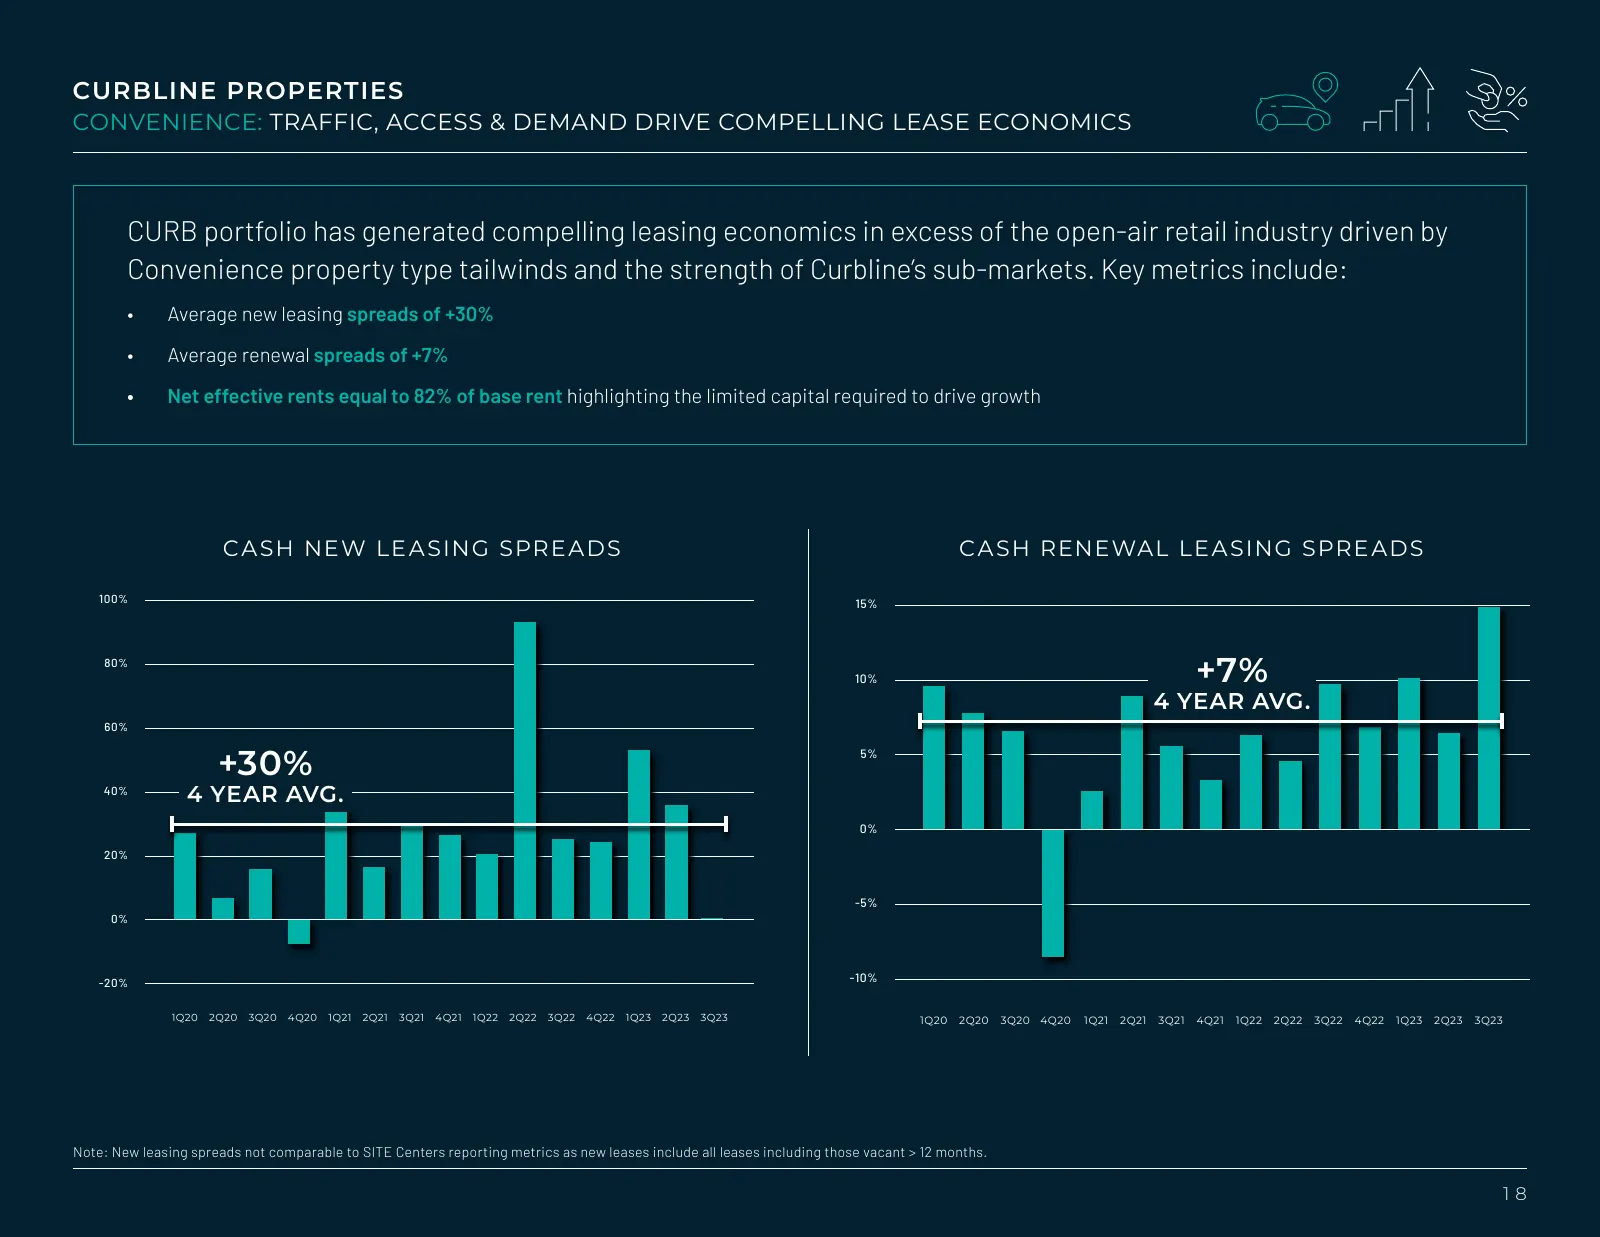
CURBLINE PROPERTIES CONVENIENCE: TRAFFIC, ACCESS & DEMAND DRIVE COMPELLING LEASE ECONOMICS CURB portfolio has generated compelling leasing economics in excess of the open-air retail industry driven by Convenience property type tailwinds and the strength of Curbline’s sub-markets. Key metrics include
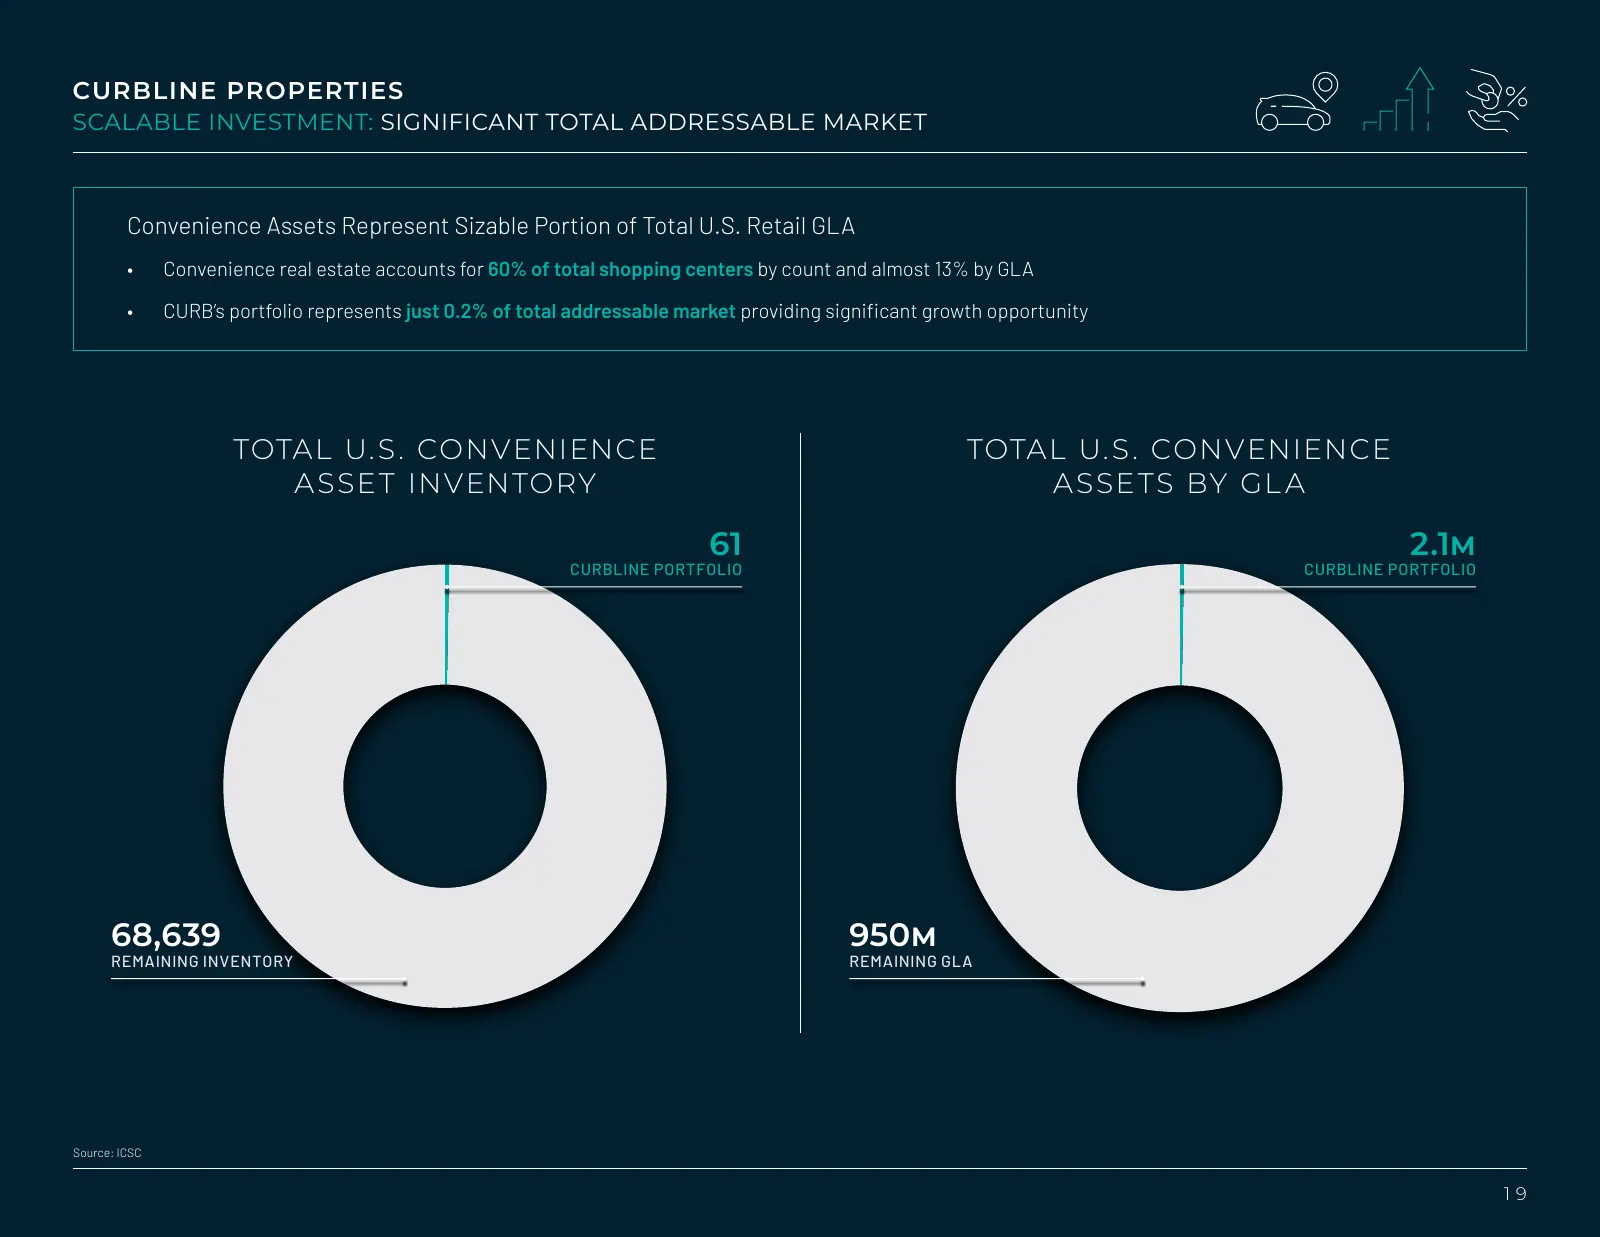
Slide 19: Scalable Investment: Significant Total Addressable Market
CURBLINE PROPERTIES SCALABLE INVESTMENT: SIGNIFICANT TOTAL ADDRESSABLE MARKET Convenience Assets Represent Sizable Portion of Total U.S. Retail GLA • Convenience real estate accounts for 60% of total shopping centers by count and almost 13% by GLA • CURB’s portfolio represents just 0.2% of total add
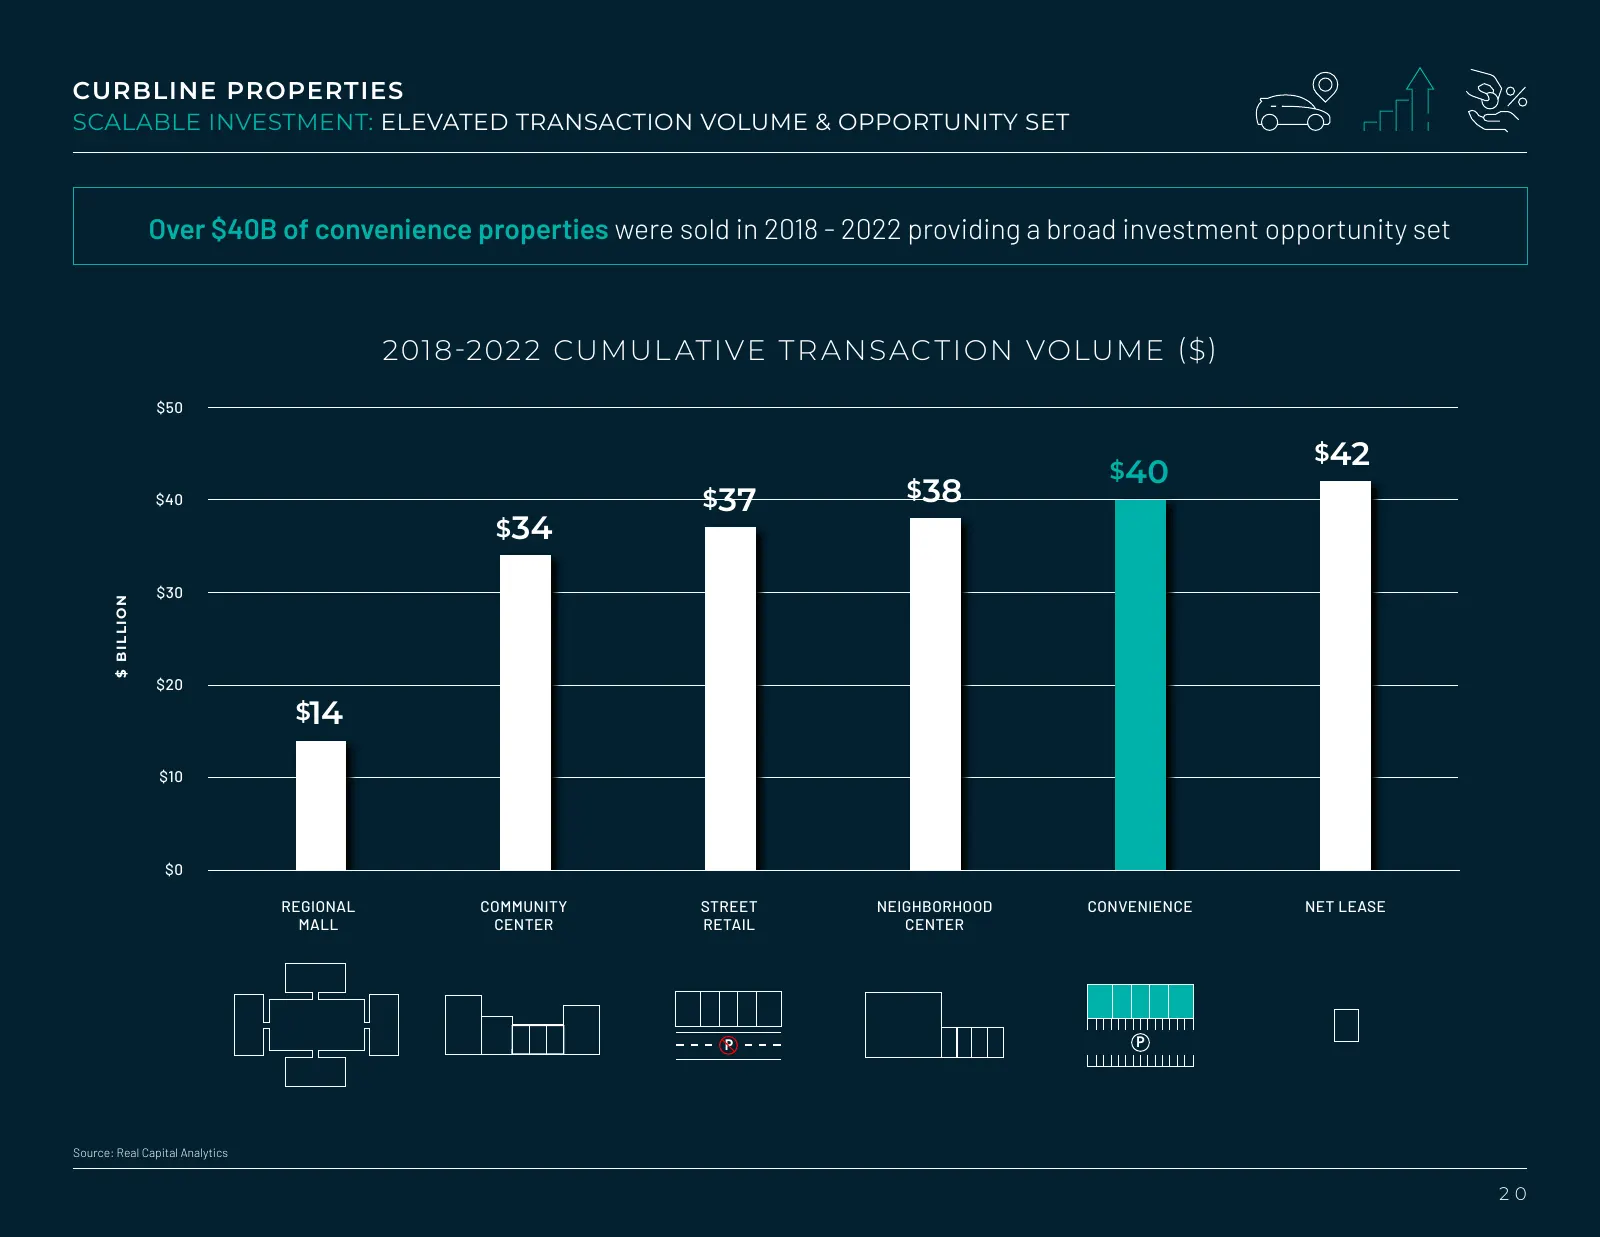
Slide 20: Scalable Investment: Elevated Transaction Volume & Opportunity Set
CURBLINE PROPERTIES SCALABLE INVESTMENT: ELEVATED TRANSACTION VOLUME & OPPORTUNITY SET Over $40B of convenience properties were sold in 2018 - 2022 providing a broad investment opportunity set 2018-202 2 CUMUL ATIVE TR ANSAC TION VOLUME ($) $50 $42 $40 $40 $37 $38 $34 $30 $ BILLION $20 $14 $10 $0 RE
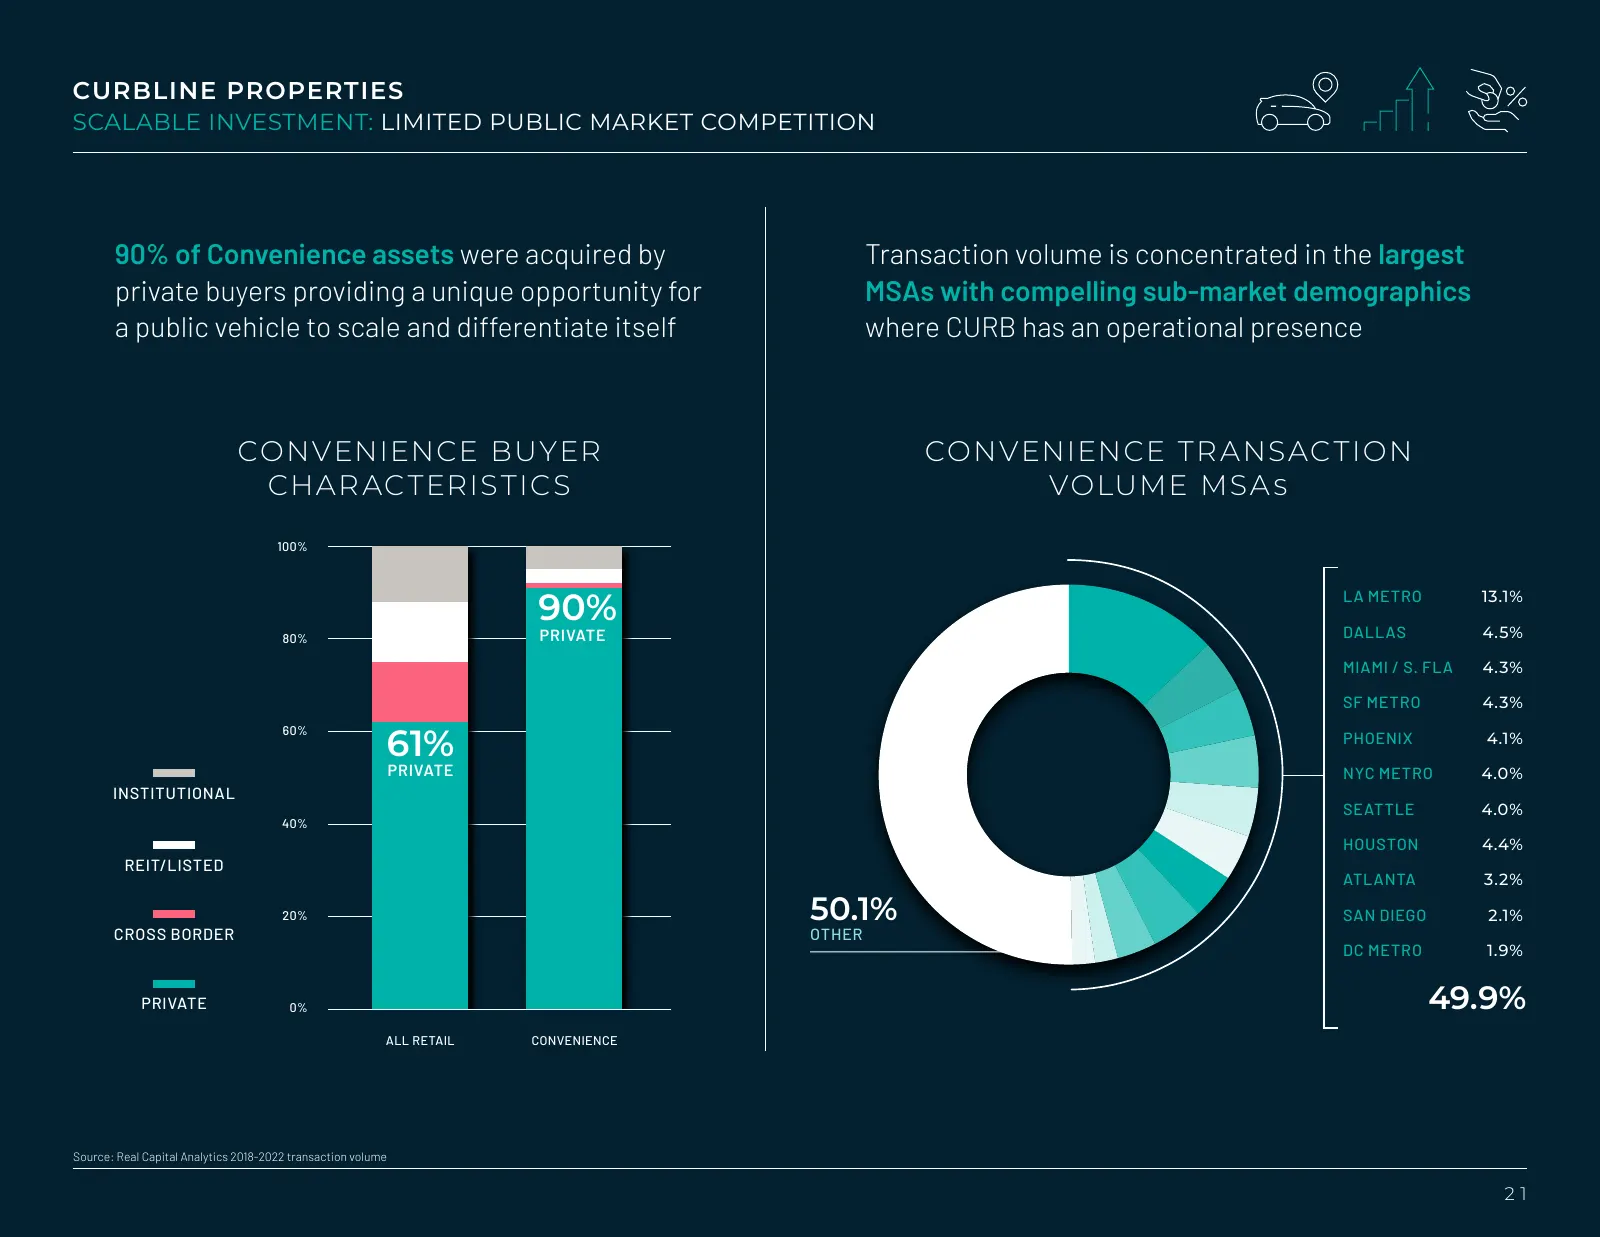
Slide 21: Scalable Investment: Limited Public Market Competition
CURBLINE PROPERTIES SCALABLE INVESTMENT: LIMITED PUBLIC MARKET COMPETITION 90% of Convenience assets were acquired by Transaction volume is concentrated in the largest private buyers providing a unique opportunity for MSAs with compelling sub-market demographics a public vehicle to scale and differe
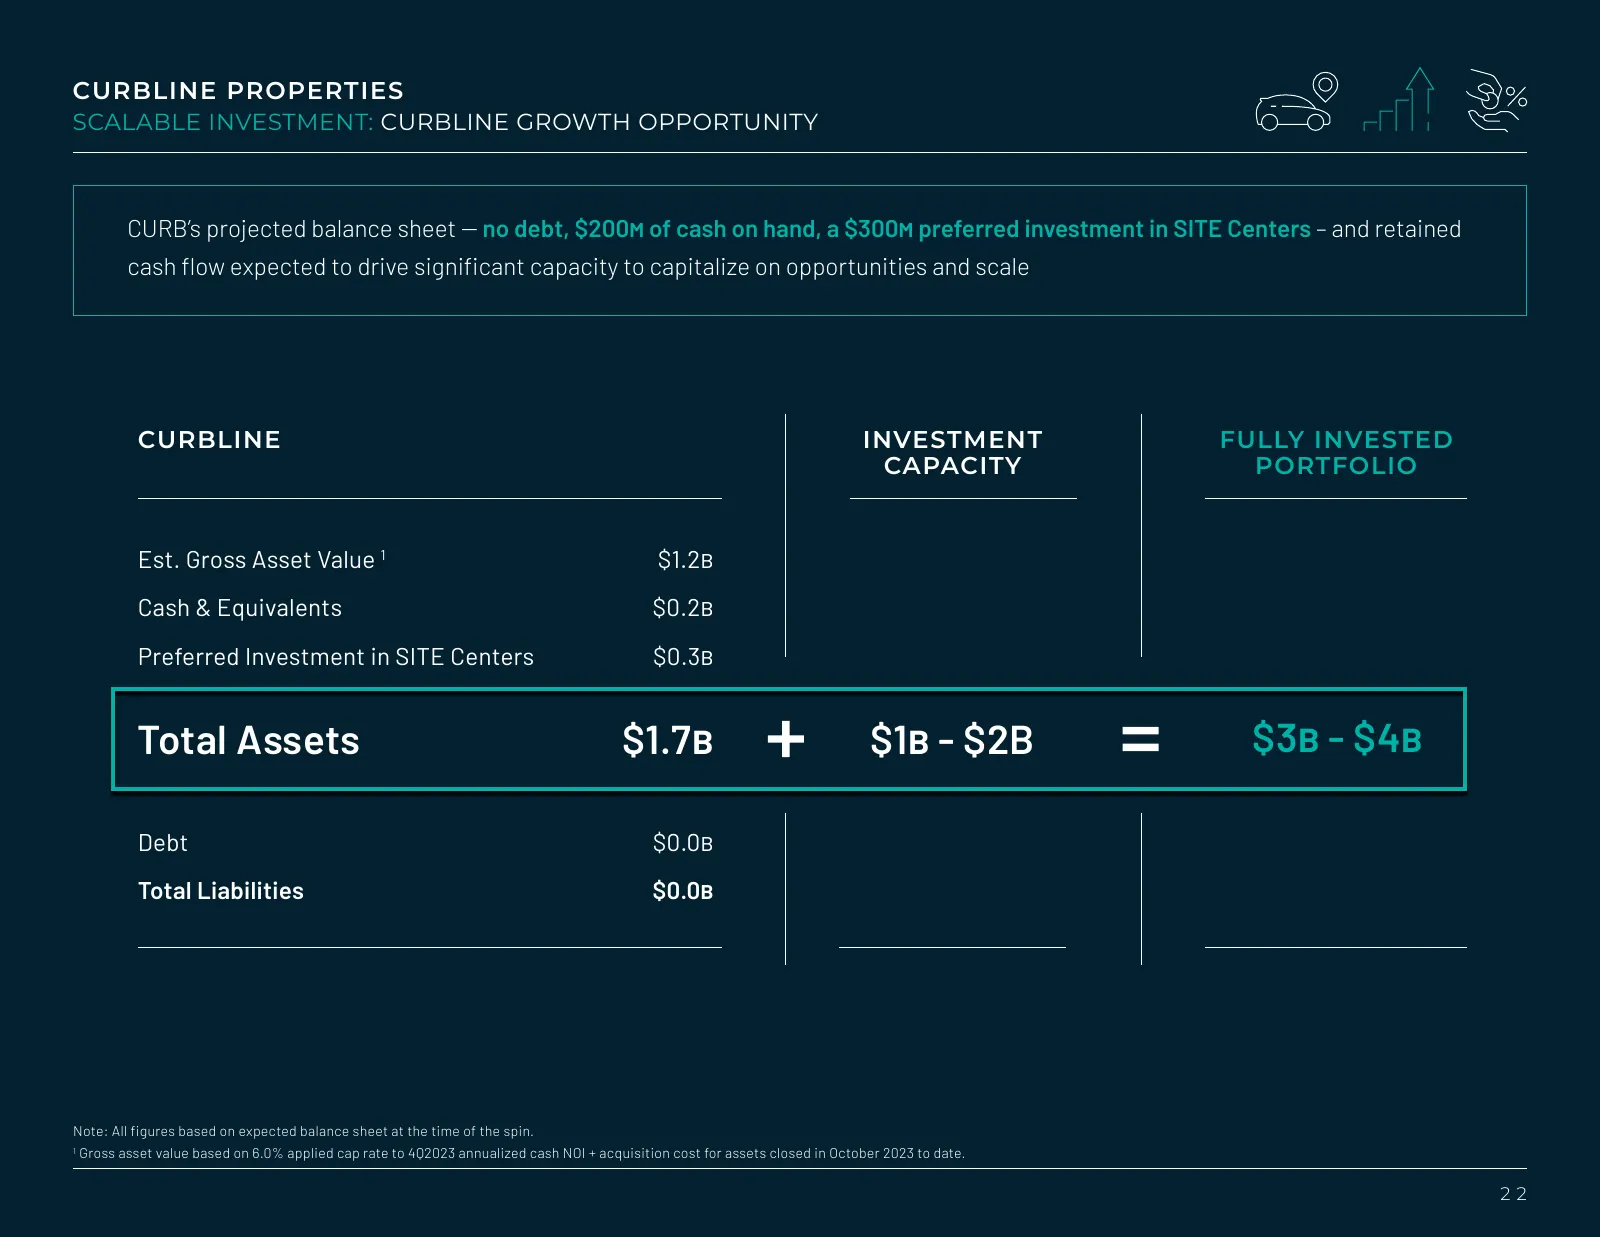
Slide 22: Scalable Investment: Curbline Growth Opportunity
CURBLINE PROPERTIES SCALABLE INVESTMENT: CURBLINE GROWTH OPPORTUNITY CURB’s projected balance sheet -- no debt, $200m of cash on hand, a $300m preferred investment in SITE Centers – and retained cash flow expected to drive significant capacity to capitalize on opportunities and scale CURBLINE INVEST
Slide 23: Attractive Economics: Renewals Focus Reduces Downtime While Capturing MTM
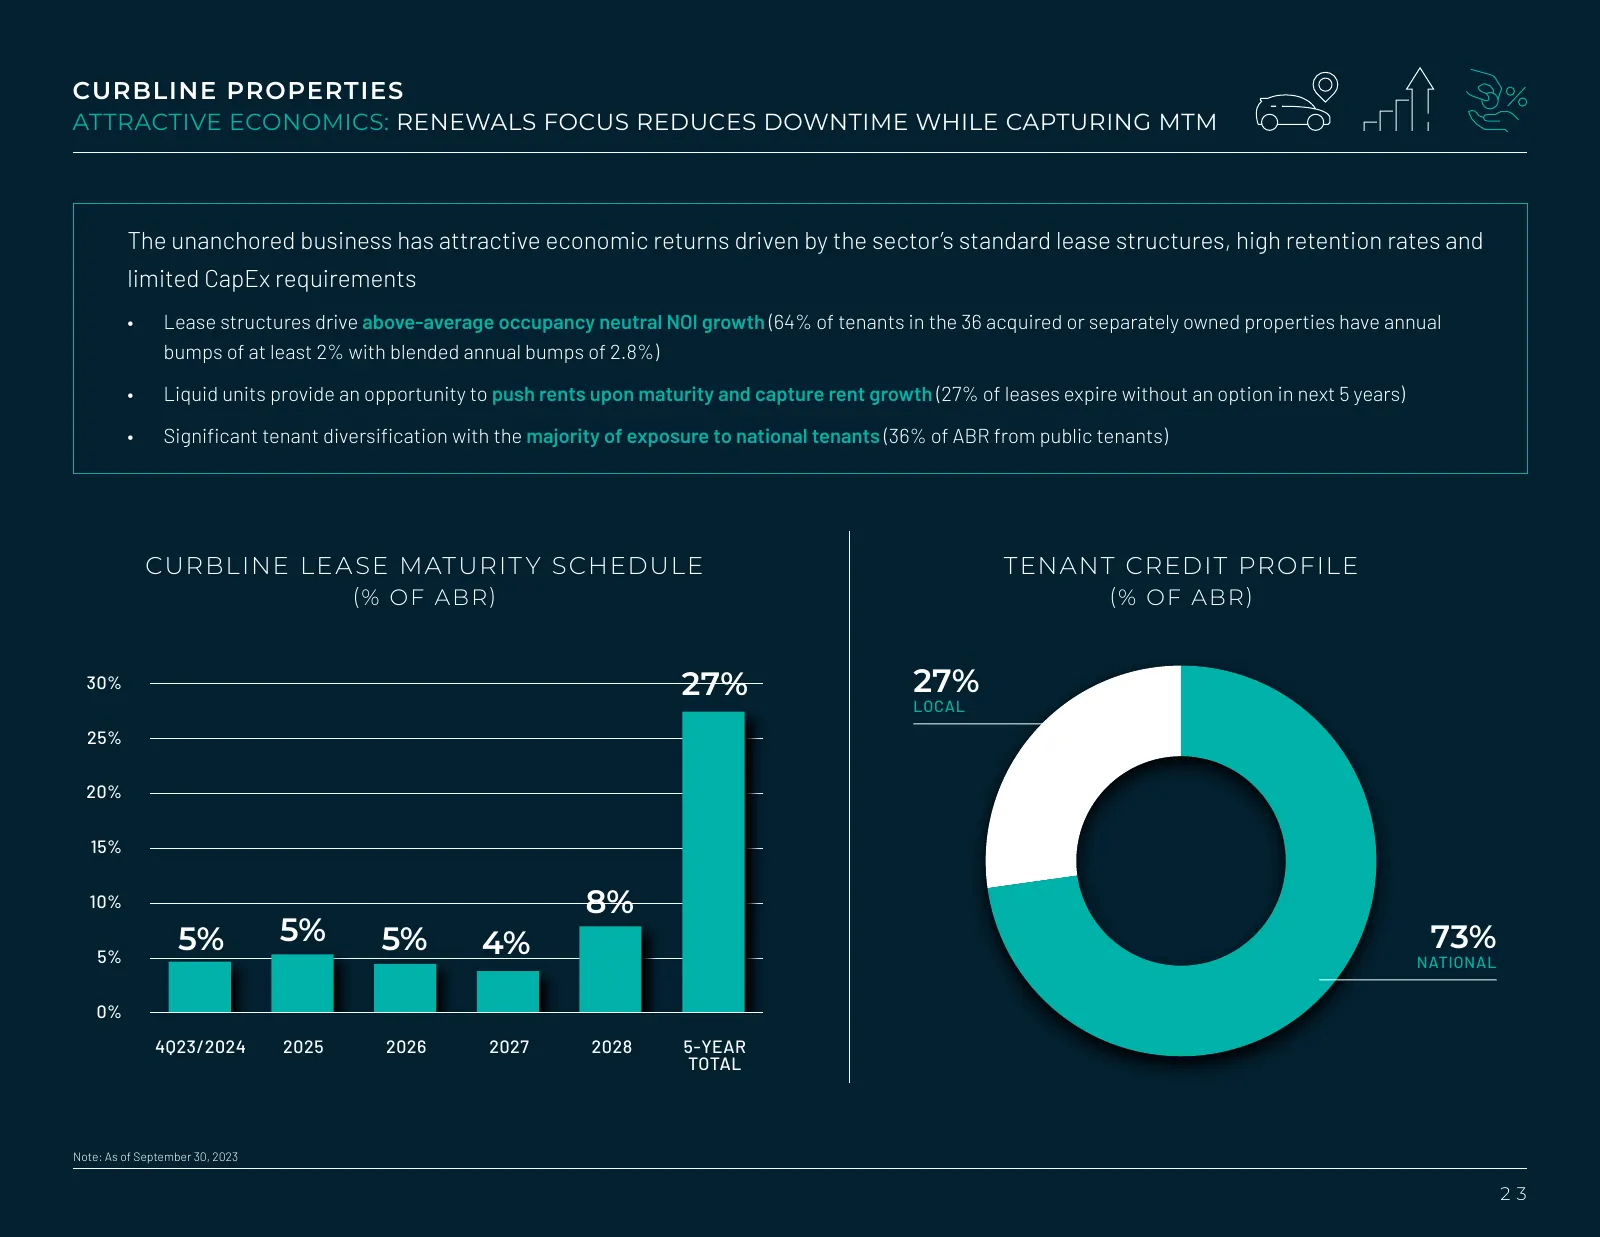
CURBLINE PROPERTIES ATTRACTIVE ECONOMICS: RENEWALS FOCUS REDUCES DOWNTIME WHILE CAPTURING MTM The unanchored business has attractive economic returns driven by the sector’s standard lease structures, high retention rates and limited CapEx requirements • Lease structures drive above-average occupancy
Slide 24: Attractive Economics: Standardized Site Plan and Unit Sizes
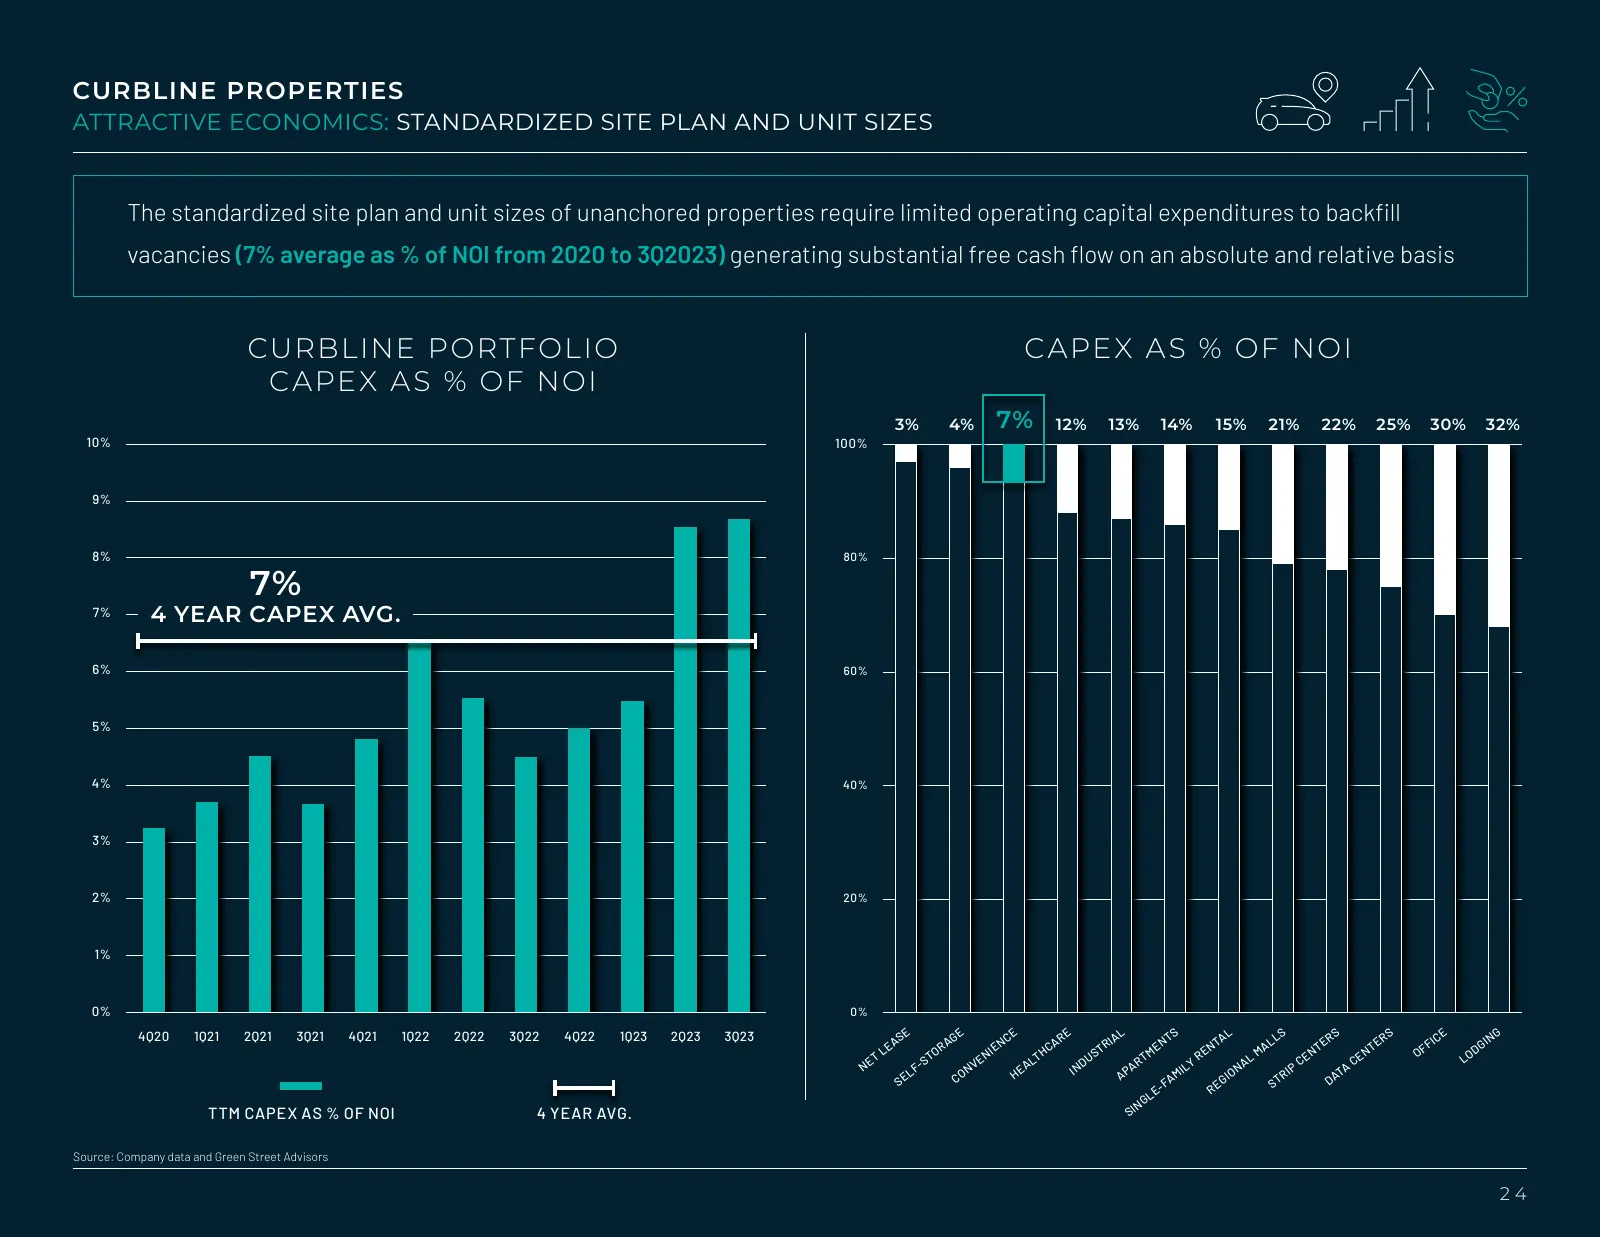
CURBLINE PROPERTIES ATTRACTIVE ECONOMICS: STANDARDIZED SITE PLAN AND UNIT SIZES The standardized site plan and unit sizes of unanchored properties require limited operating capital expenditures to backfill vacancies (7% average as % of NOI from 2020 to 3Q2023) generating substantial free cash flow o
Slide 25: Attractive Economics: Diversified National Tenant Exposure Reduces Turnover
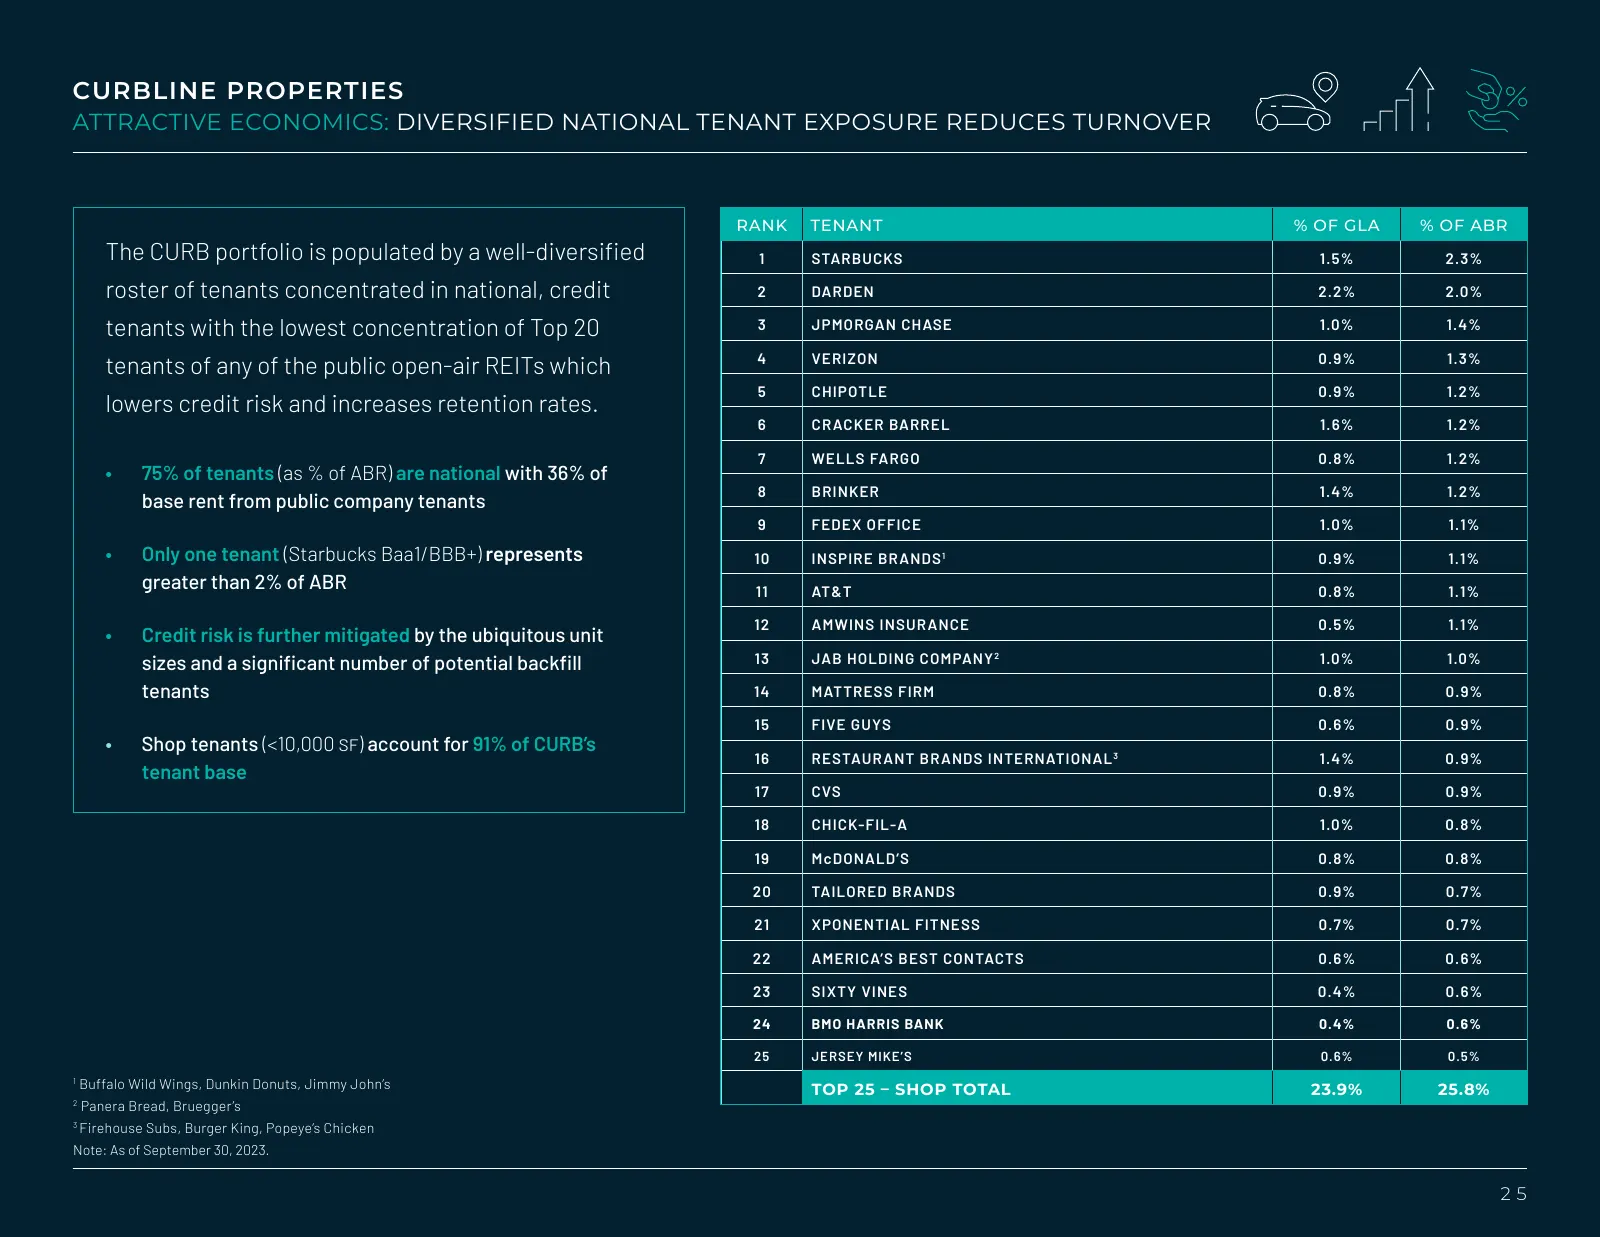
CURBLINE PROPERTIES ATTRACTIVE ECONOMICS: DIVERSIFIED NATIONAL TENANT EXPOSURE REDUCES TURNOVER RANK TENANT % OF GLA % OF ABR The CURB portfolio is populated by a well-diversified 1 STARBUCKS 1.5% 2.3% roster of tenants concentrated in national, credit 2 DARDEN 2.2% 2.0% tenants with the lowest conc
Slide 26: SITE Centers (SITC)
SITE CENTERS (SITC) 26
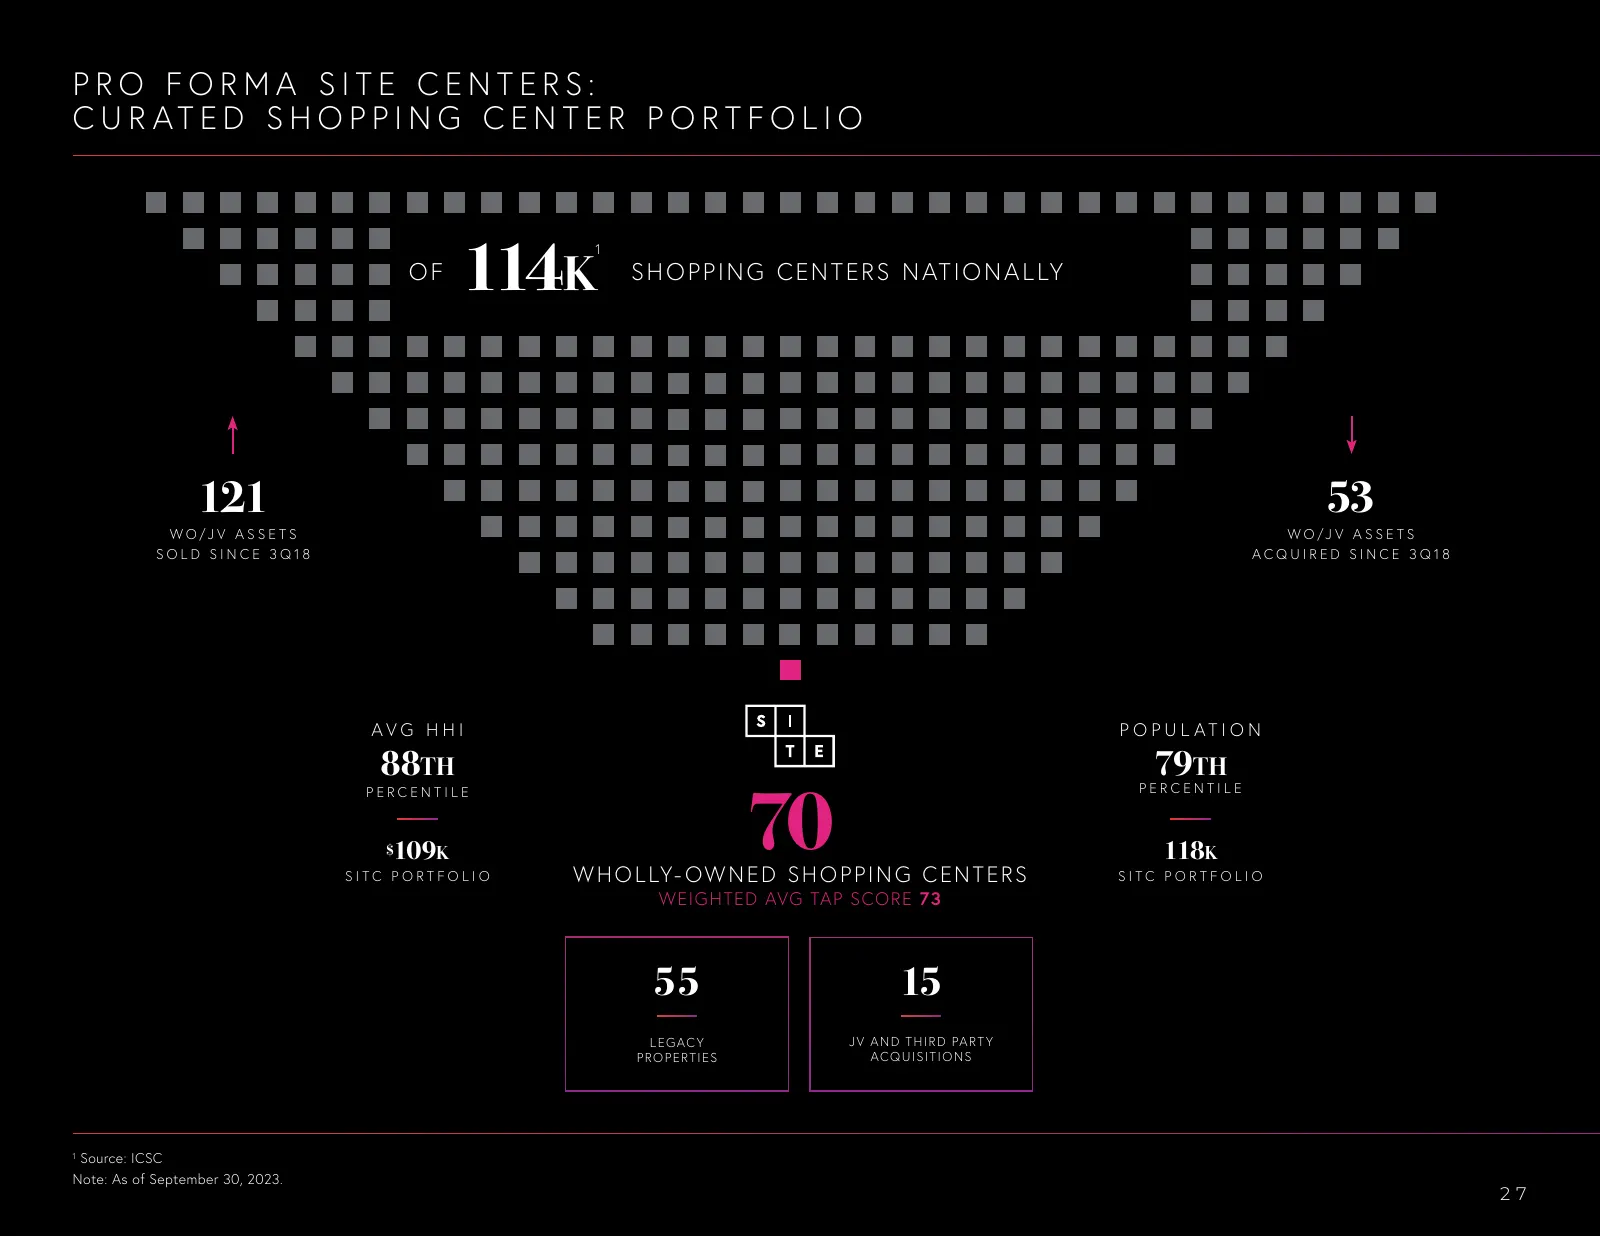
Slide 27: Pro Forma SITE Centers: Curated Shopping Center Portfolio
PRO FORMA SITE CENTERS: C U R AT E D S H O P P I N G C E N T E R P O R T F O L I O 114k 1 OF S H O P P I N G C EN T ER S N AT I O N A L LY 121 53 W O /J V A S S E T S W O /J V A S S E T S SOLD SINCE 3Q18 ACQUIRED SINCE 3Q18 AVG H HI P O P U L AT I O N 88th 79th 70 PERCENTILE PERCENTILE $109k 118k SI
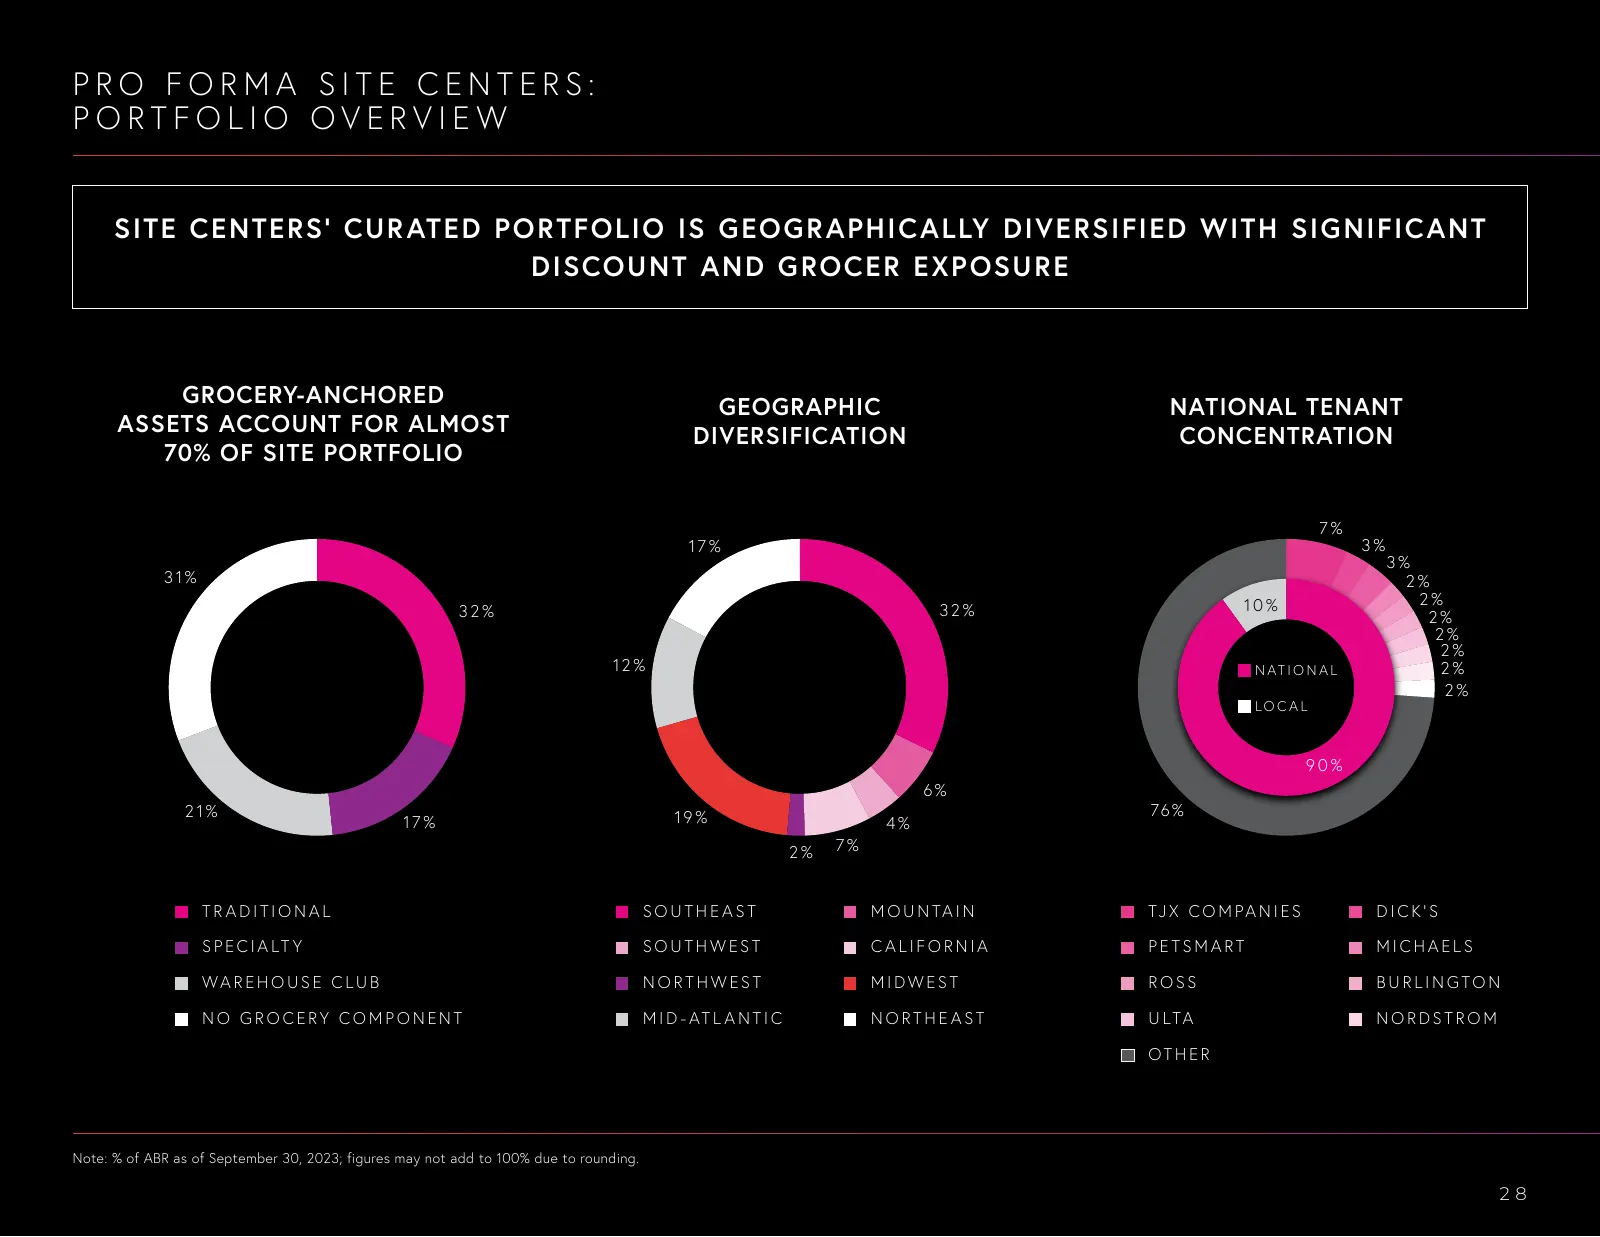
Slide 28: Pro Forma SITE Centers: Portfolio Overview
PRO FORMA SITE CENTERS: PORTFOLIO OVERVIEW SITE CENTERS’ CUR ATED PORTFOLIO IS G EOG R APHIC ALLY DIVERSIFIED WITH SIG NIFIC ANT DISCOUNT AND G ROCER E XPOSURE GROCERY-ANCHORED GEOGRAPHIC NATIONAL TENANT ASSETS ACCOUNT FOR ALMOST DIVERSIFICATION CONCENTRATION 70% OF SITE PORTFOLIO 7% 17 % 3% 3% 31%
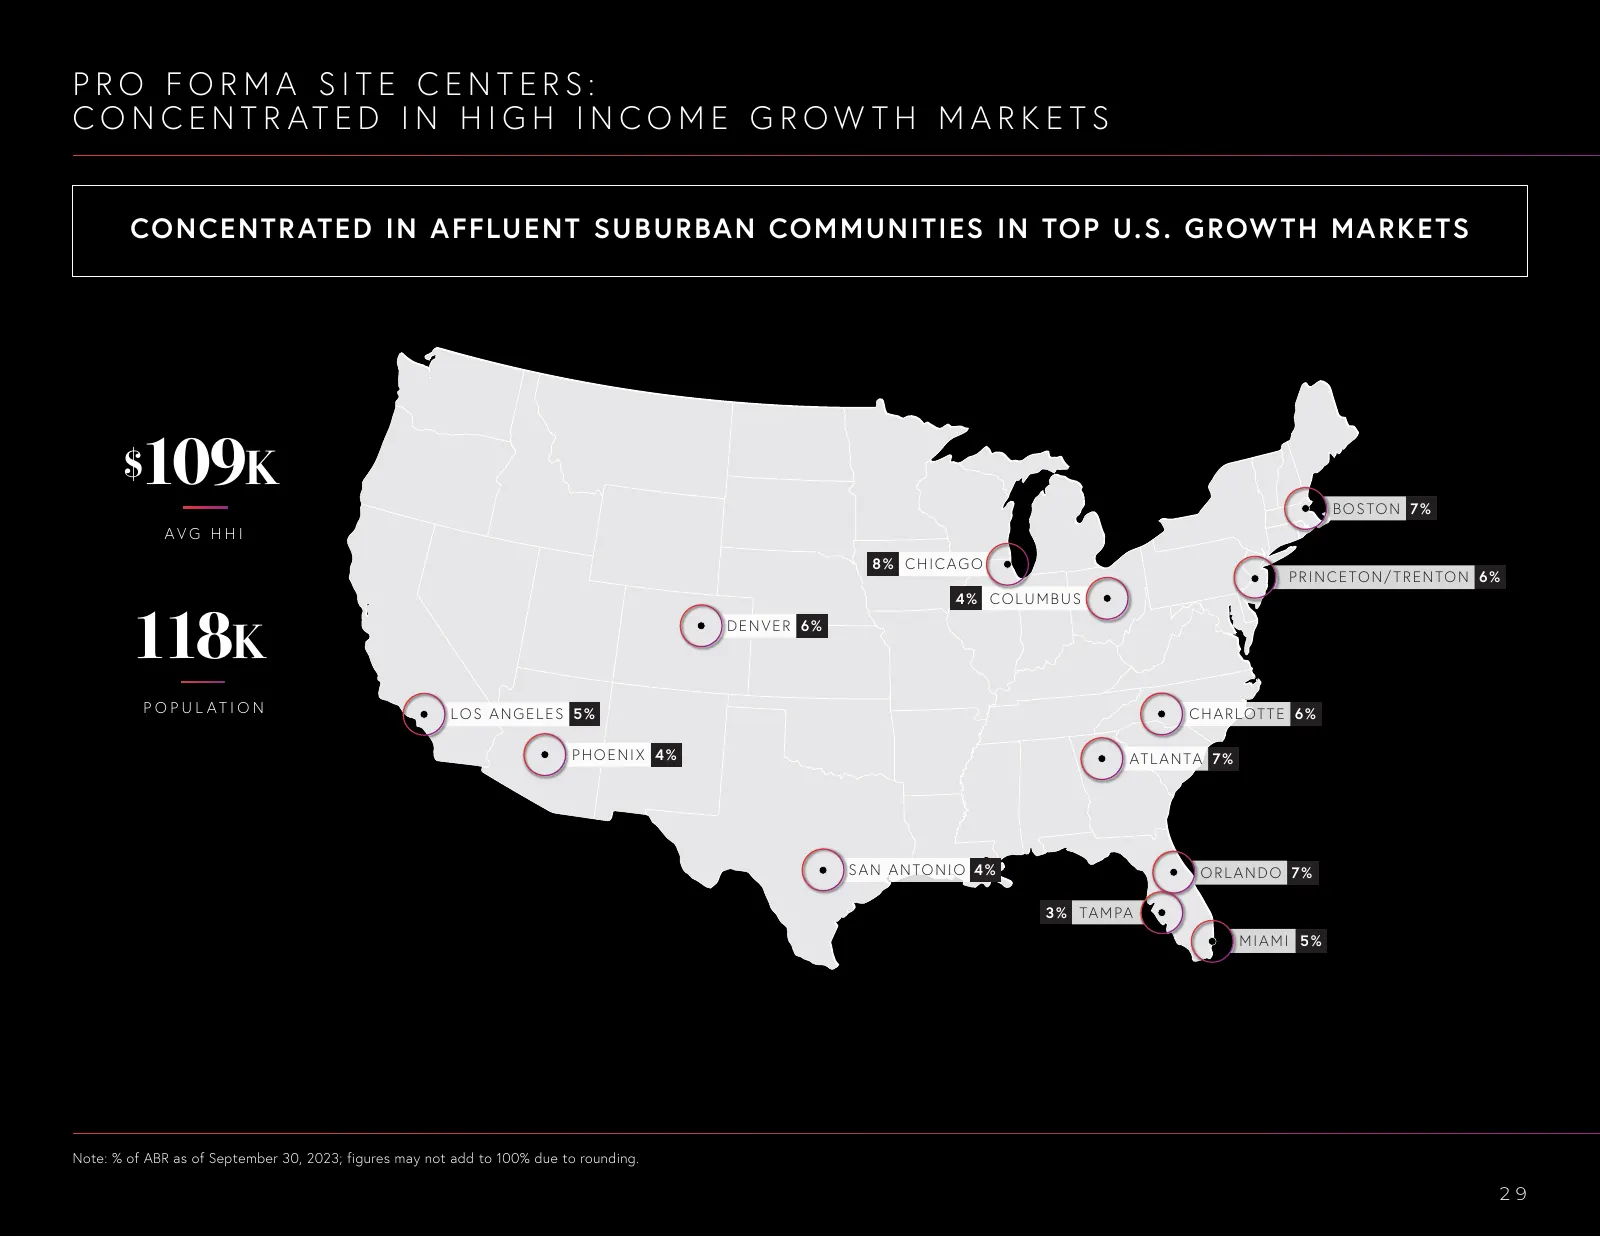
Slide 29: Pro Forma SITE Centers: Concentrated in High Income Growth Markets
PRO FORMA SITE CENTERS: C O N C E N T R AT E D I N H I G H I N C O M E G R O W T H M A R K E T S CONCENTR ATED IN AFFLUENT SUBURBAN COMMUNITIES IN TOP U.S. G ROW TH MARKE TS $ 109k B O S TO N 7 % AVG H HI 8% CHICAGO P R I N C E TO N / T R E N TO N 6 % 4% COLUMBUS 118k DENVER 6% P O P U L AT I O N LO
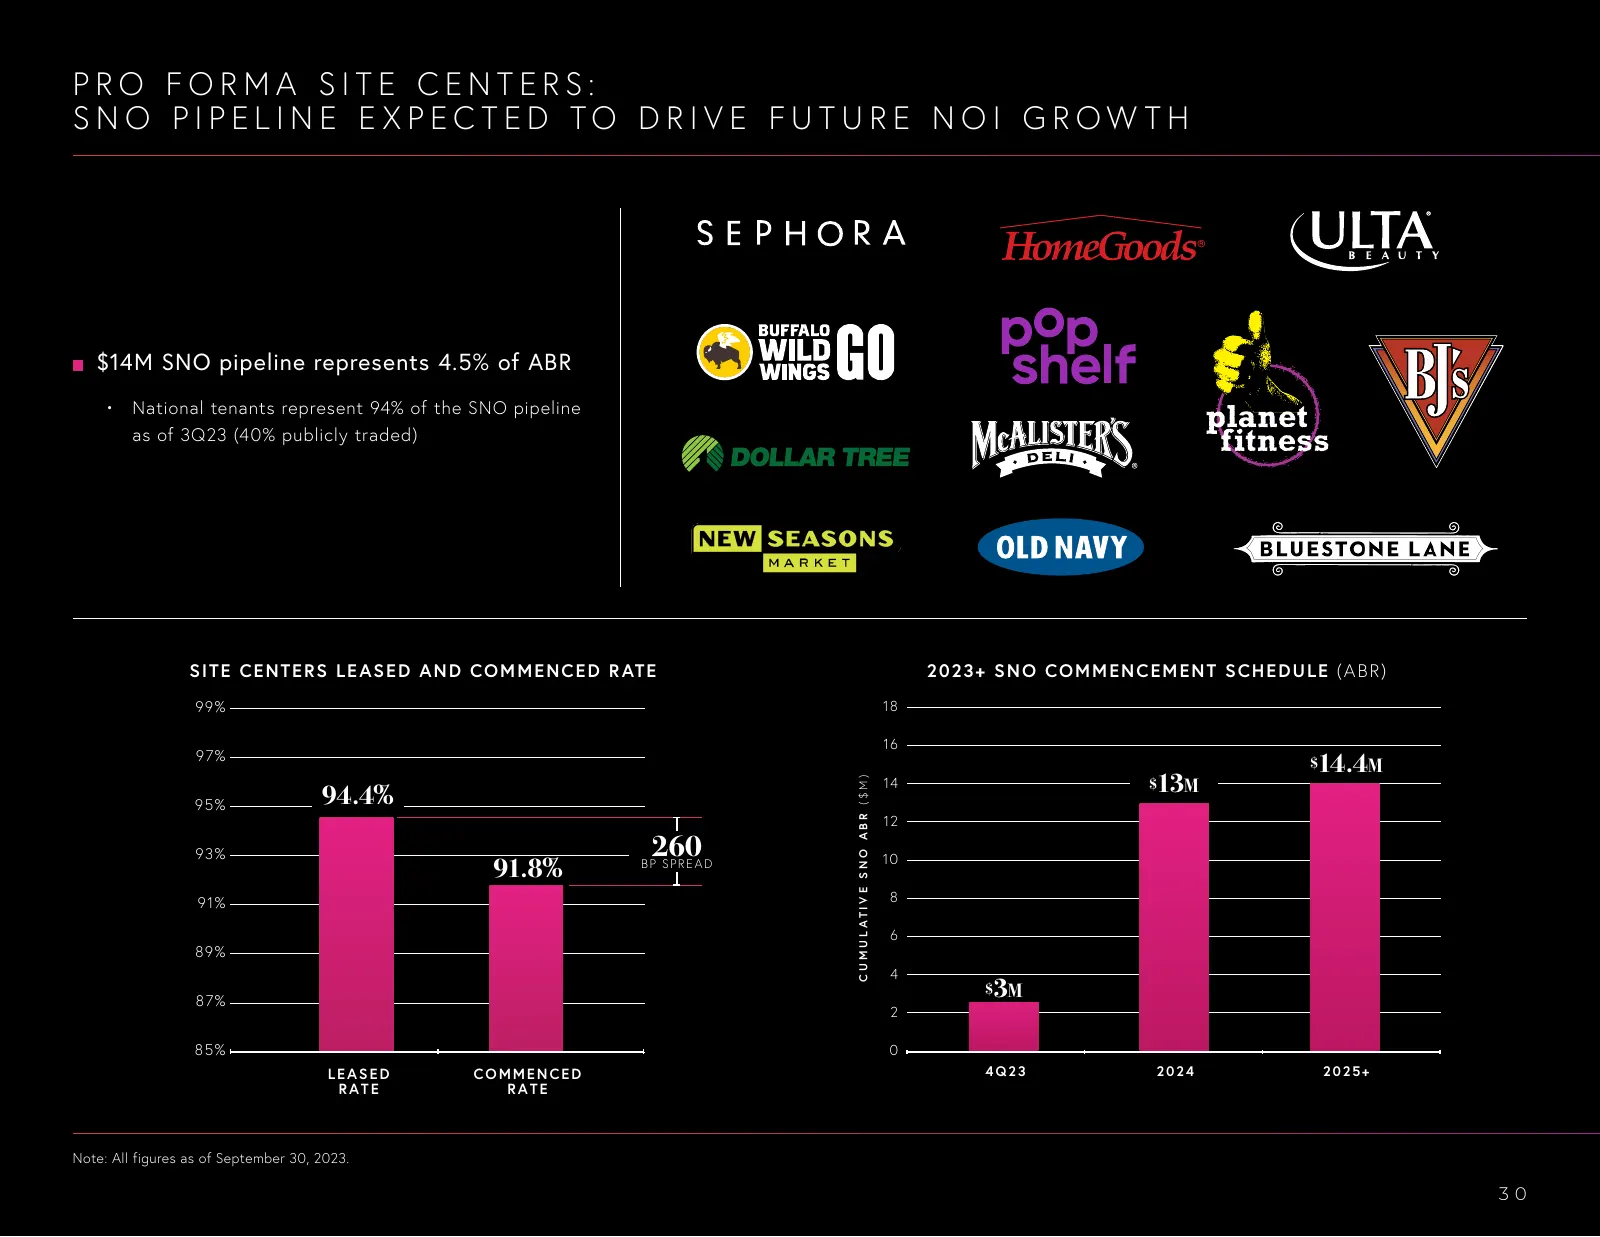
Slide 30: Pro Forma SITE Centers: SNO Pipeline Expected to Drive Future NOI Growth
PRO FORMA SITE CENTERS: SN O PIPELINE E XPEC TED TO D RIV E FUTURE N OI G ROW TH $14M SNO pipeline represents 4.5% of ABR • National tenants represent 94% of the SNO pipeline as of 3Q23 (40% publicly traded) ® SIT E CE N T E RS L E AS E D A N D CO M M E N CE D R AT E 2 023 + S N O CO M M E N CE M E
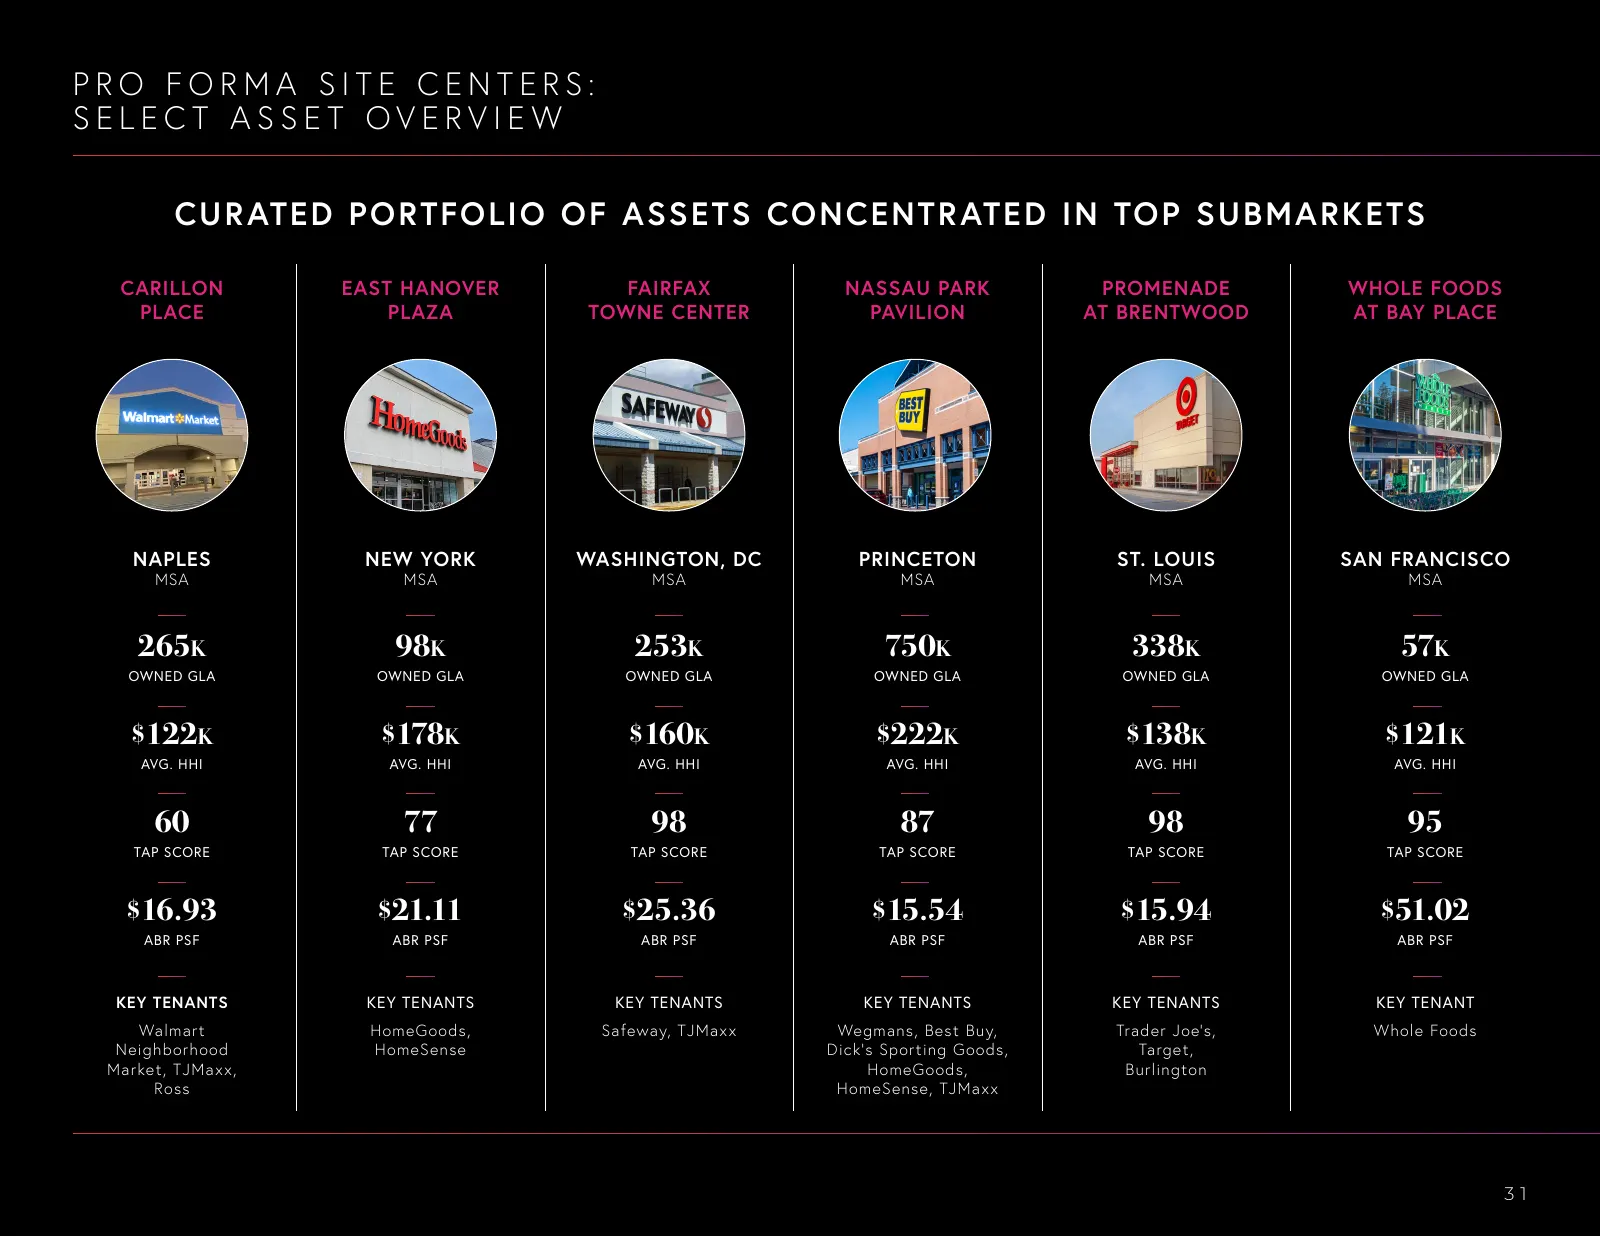
Slide 31: Pro Forma SITE Centers: Select Asset Overview
PRO FORMA SITE CENTERS: SELECT ASSET OVERVIEW CUR ATED PORTFOLIO OF ASSE TS CONCENTR ATED IN TOP SUB MARKE TS CARILLON EAST HANOVER FAIRFAX NASSAU PARK PROMENADE WHOLE FOODS PLACE PLAZA TOWNE CENTER PAVILION AT BRENTWOOD AT BAY PLACE NAPLES NEW YORK WASHINGTON, DC PRINCETON ST. LOUIS SAN FRANCISCO M
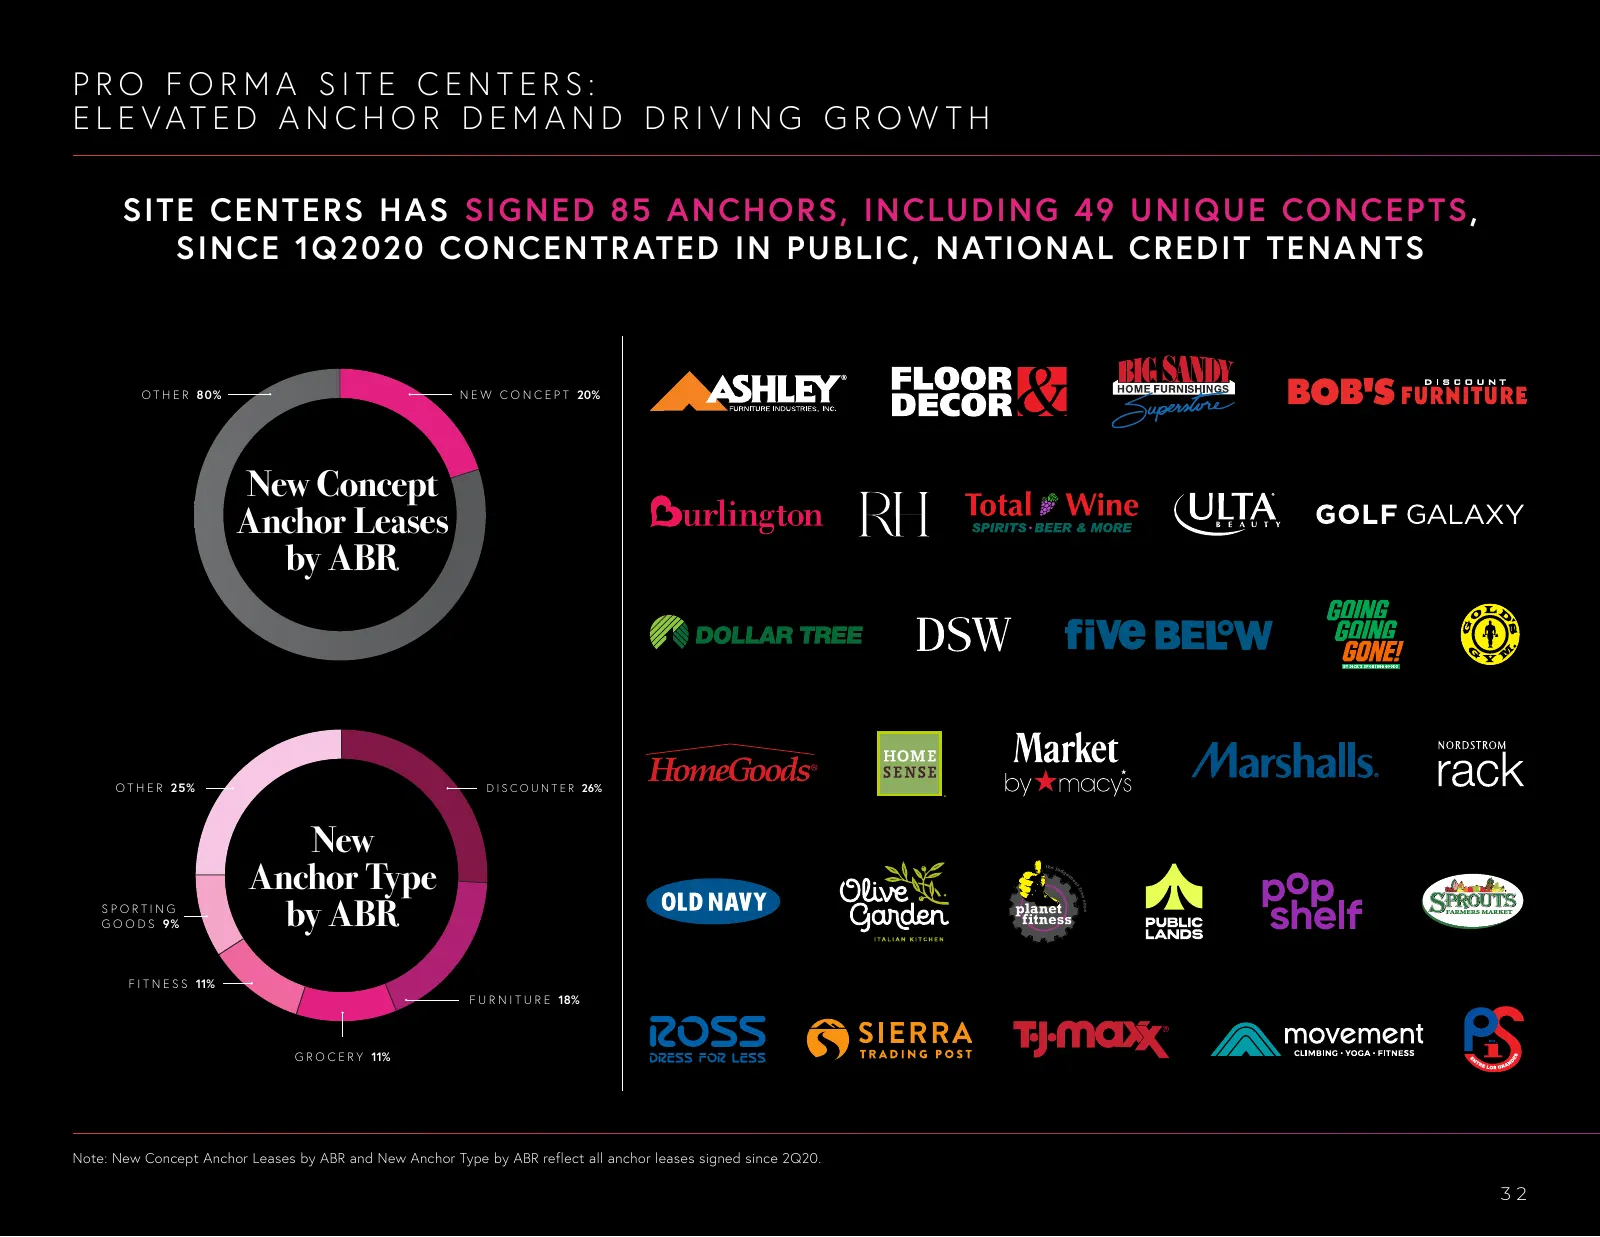
Slide 32: Pro Forma SITE Centers: Elevated Anchor Demand Driving Growth
PRO FORMA SITE CENTERS: E L E VAT E D A N C H O R D E M A N D D R I V I N G G R O W T H SITE CENTERS HAS SIG NED 85 ANCHORS, INCLUDING 49 UNIQUE CONCEP TS, SINCE 1Q2020 CONCENTR ATED IN PUB LIC , NATIONAL CREDIT TENANTS O T H E R 80% N E W C O N C E P T 20% New Concept Anchor Leases by ABR O T H E R
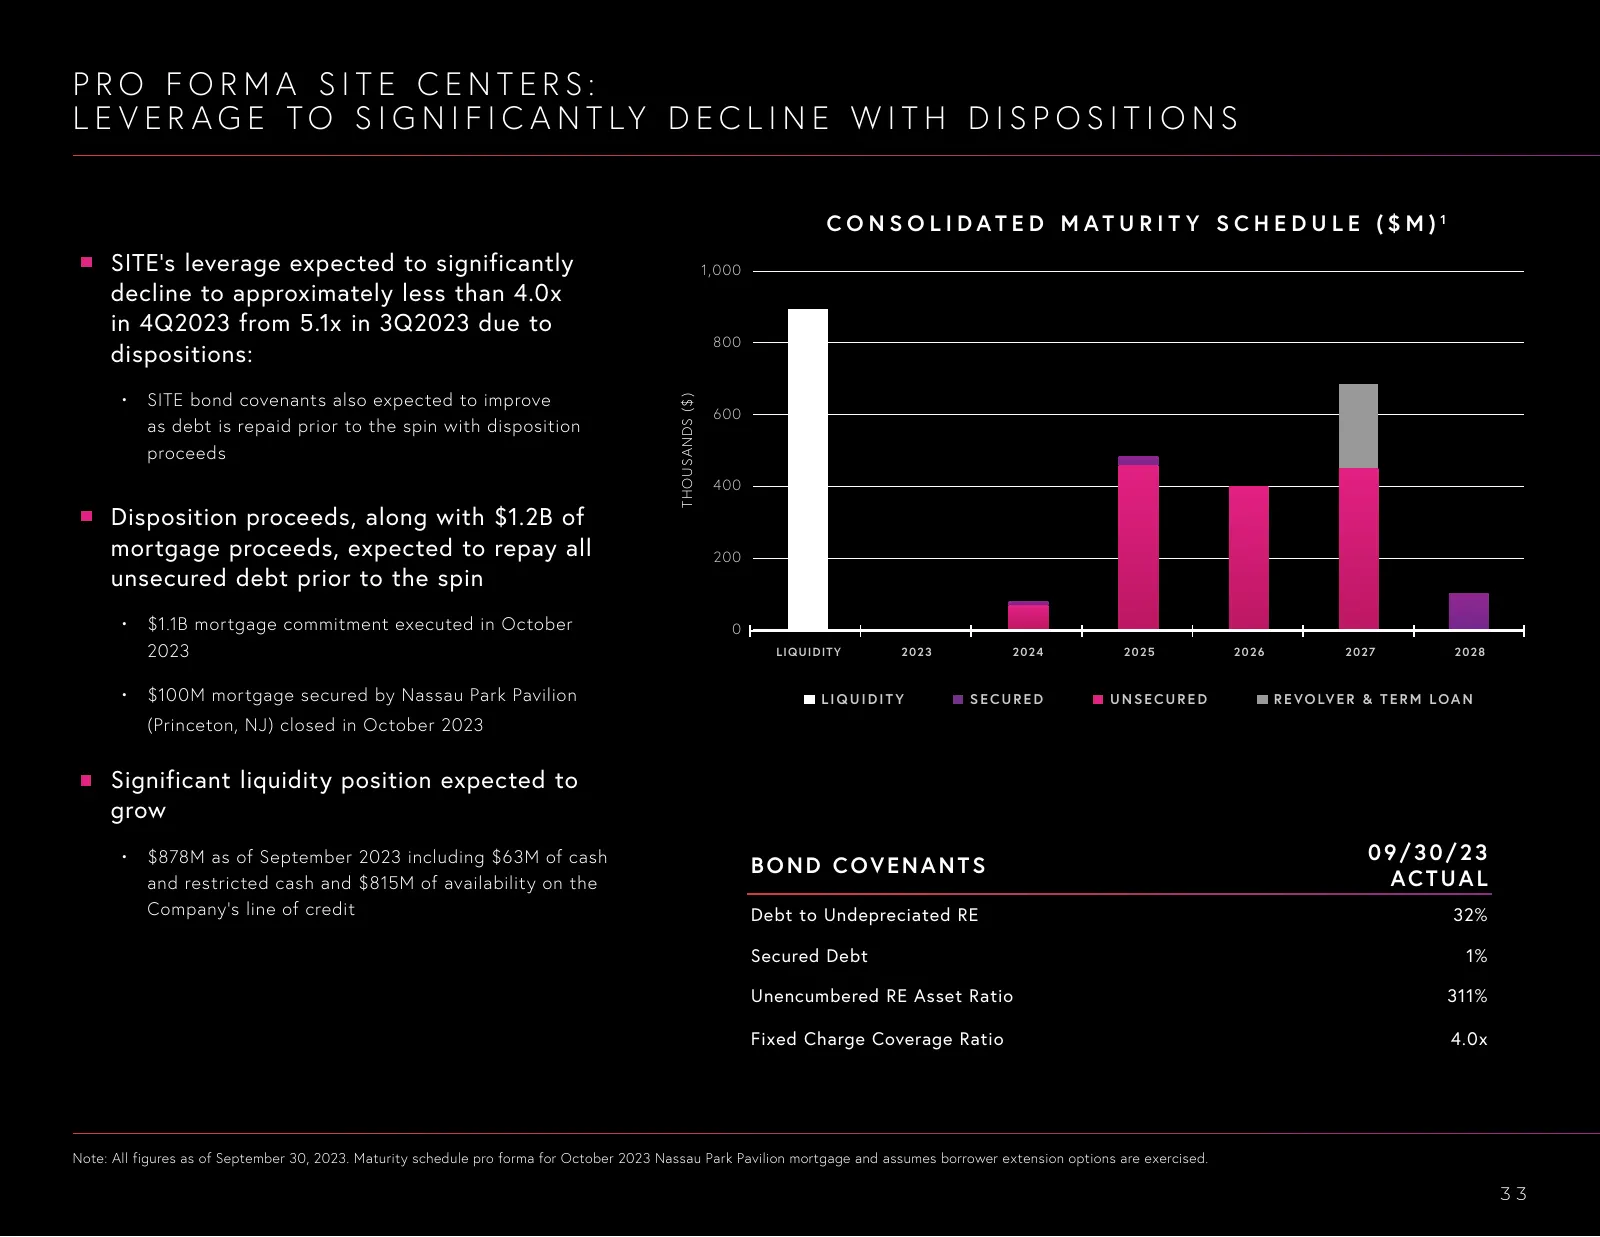
Slide 33: Pro Forma SITE Centers: Leverage to Significantly Decline with Dispositions
PRO FORMA SITE CENTERS: L E V E R A G E T O S I G N I F I C A N T LY D E C L I N E W I T H D I S P O S I T I O N S C O N S O L I DAT E D M AT U R I T Y S C H E D U L E ($ M ) 1 SITE’s leverage expected to significantly 1,000 decline to approximately less than 4.0x in 4Q2023 from 5.1x in 3Q2023 due t
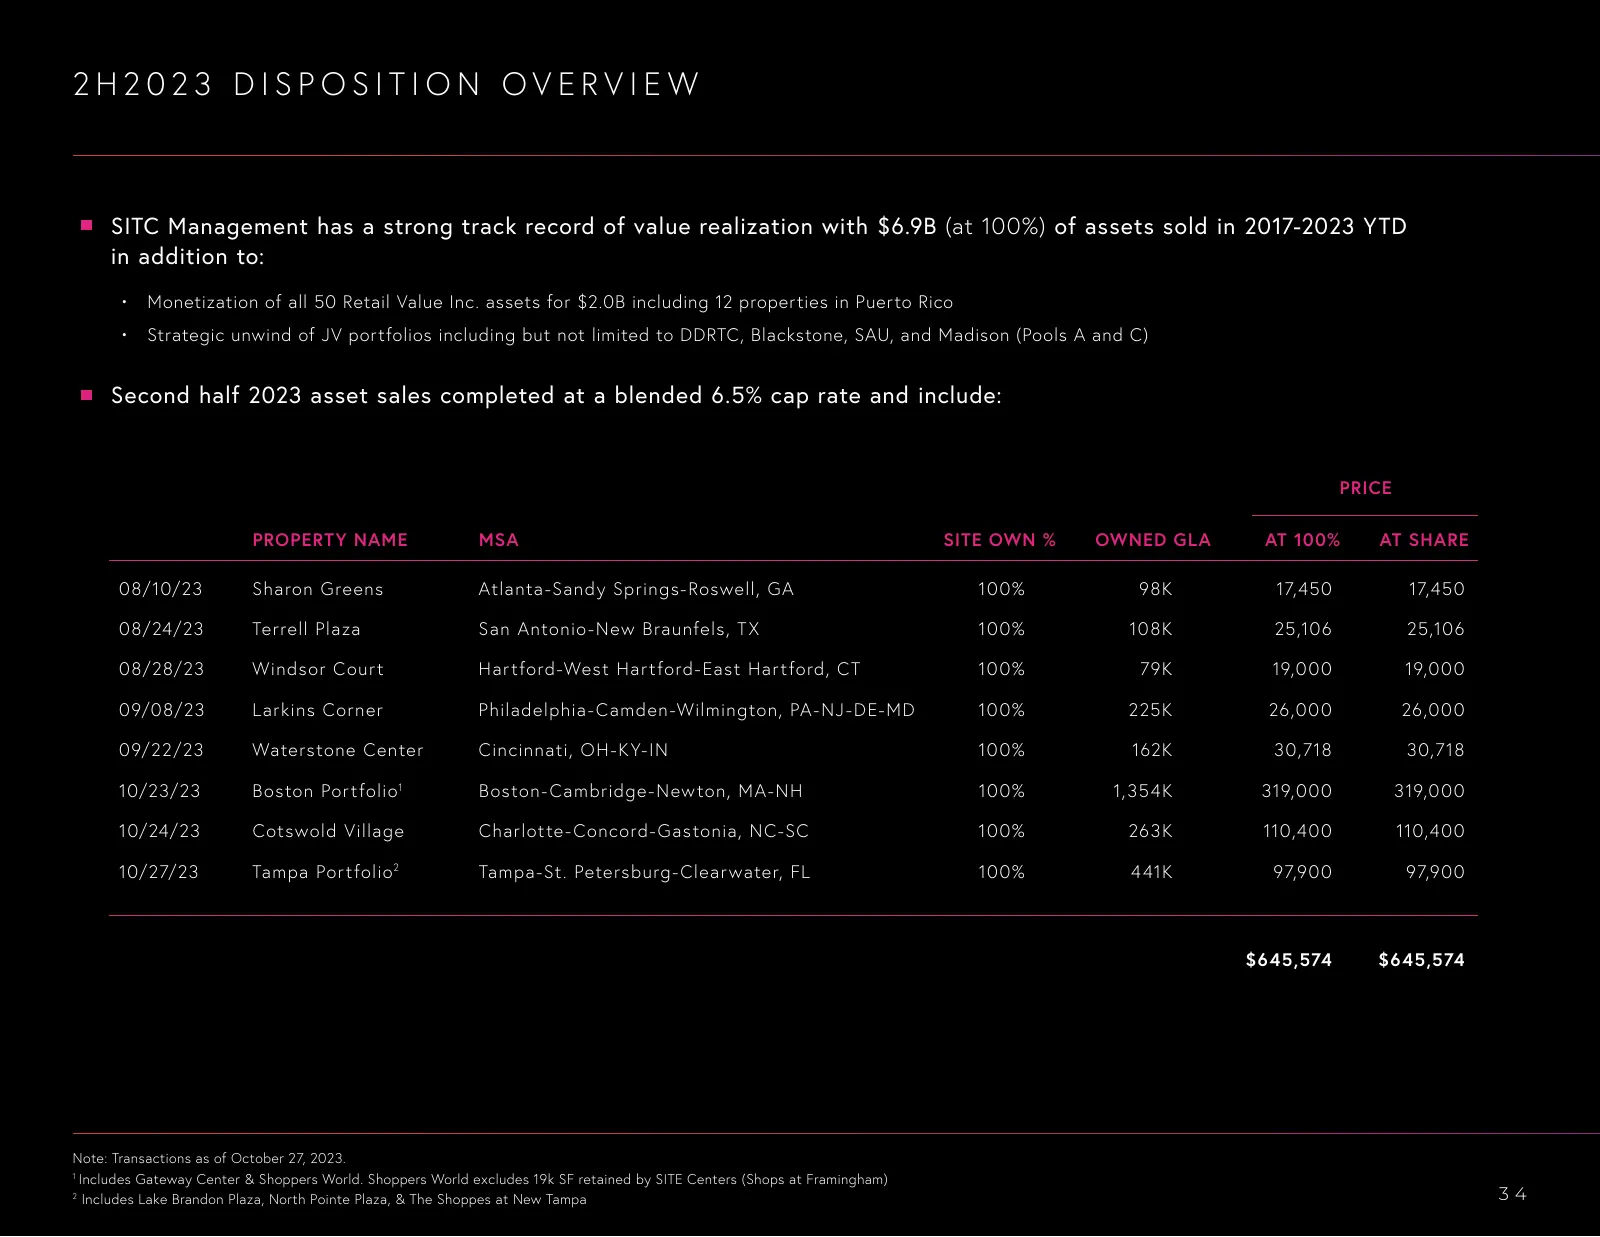
Slide 34: 2H2023 Disposition Overview
2H2023 DISPOSITION OVERVIEW SITC Management has a strong track record of value realization with $6.9B (at 100%) of assets sold in 2017-2023 YTD in addition to: • Monetization of all 50 Retail Value Inc. assets for $2.0B including 12 properties in Puerto Rico • Strategic unwind of JV portfolios inclu

Slide 35: Appendix
APPENDIX 35
Slide 36: Convenience Parcel Separation Project
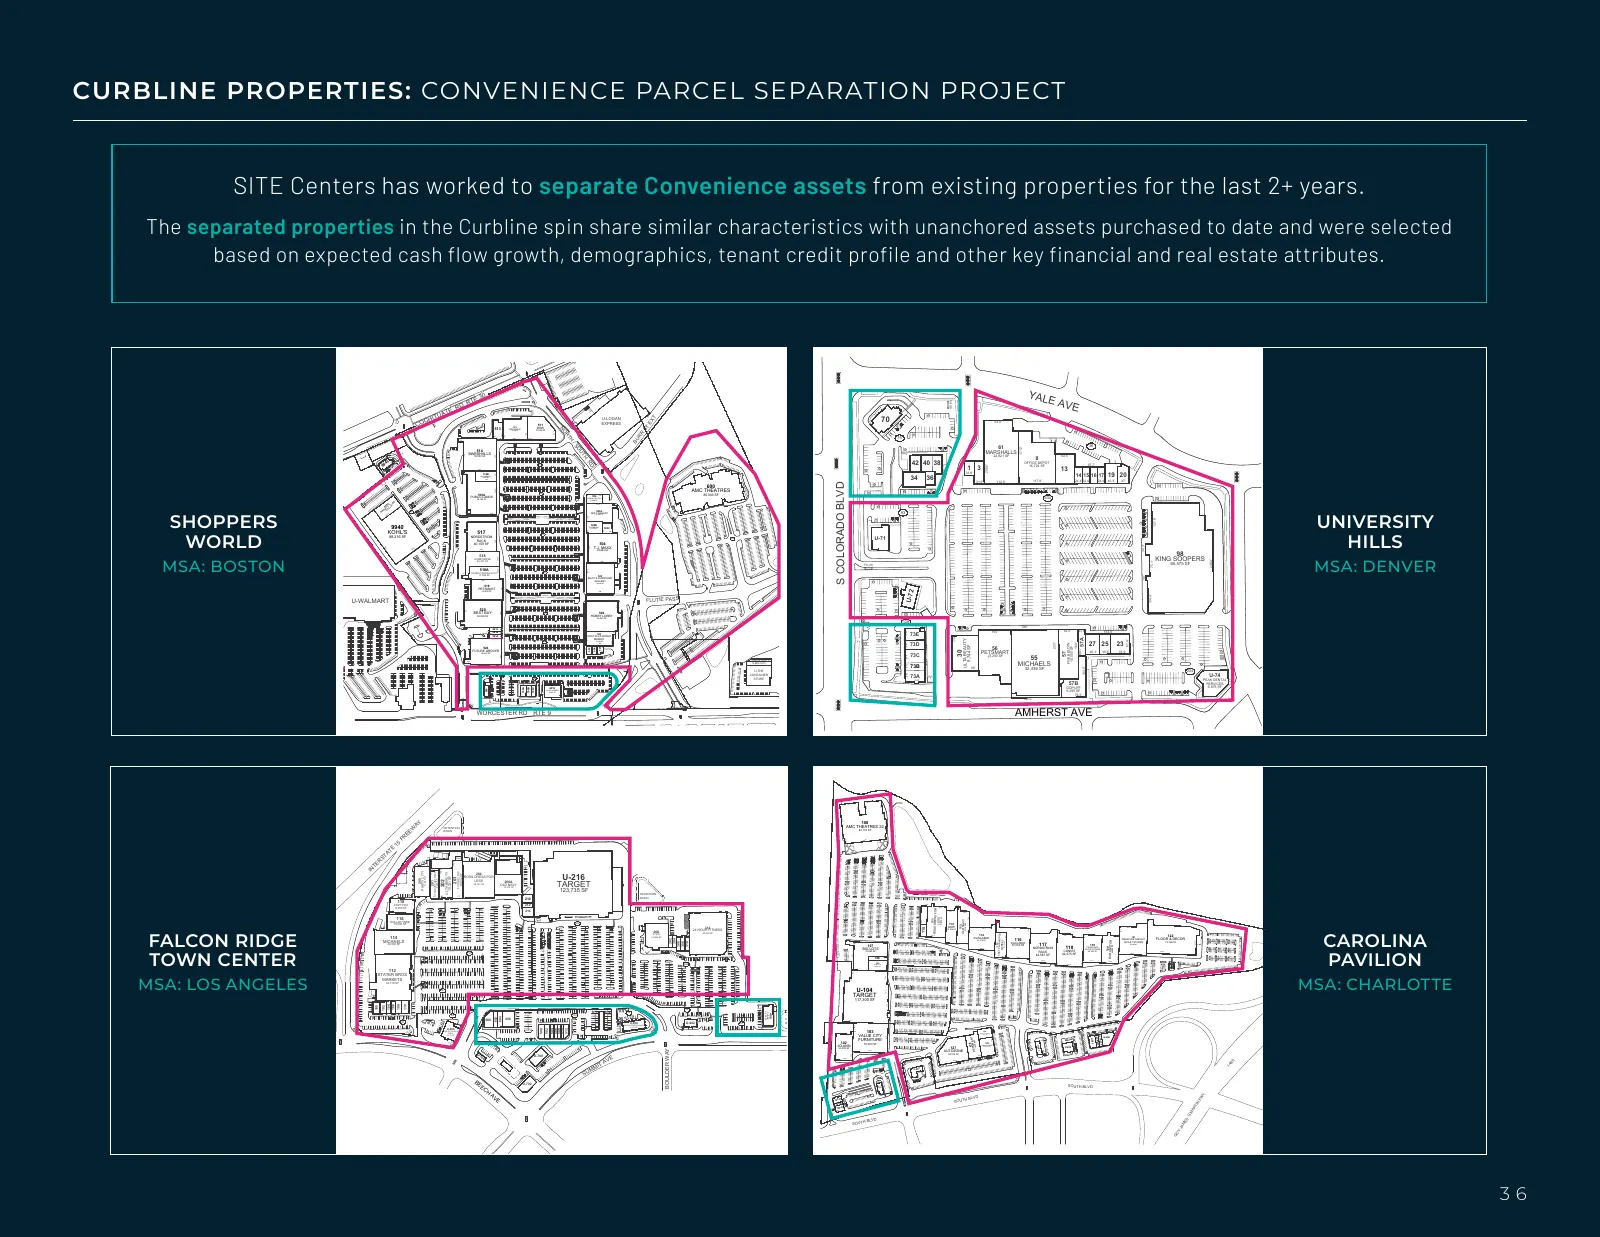
CURBLINE PROPERTIES: CONVENIENCE PARCEL SEPARATION PROJECT SITE Centers has worked to separate Convenience assets from existing properties for the last 2+ years. The separated properties in the Curbline spin share similar characteristics with unanchored assets purchased to date and were selected bas
Slide 37: Curbline Property List
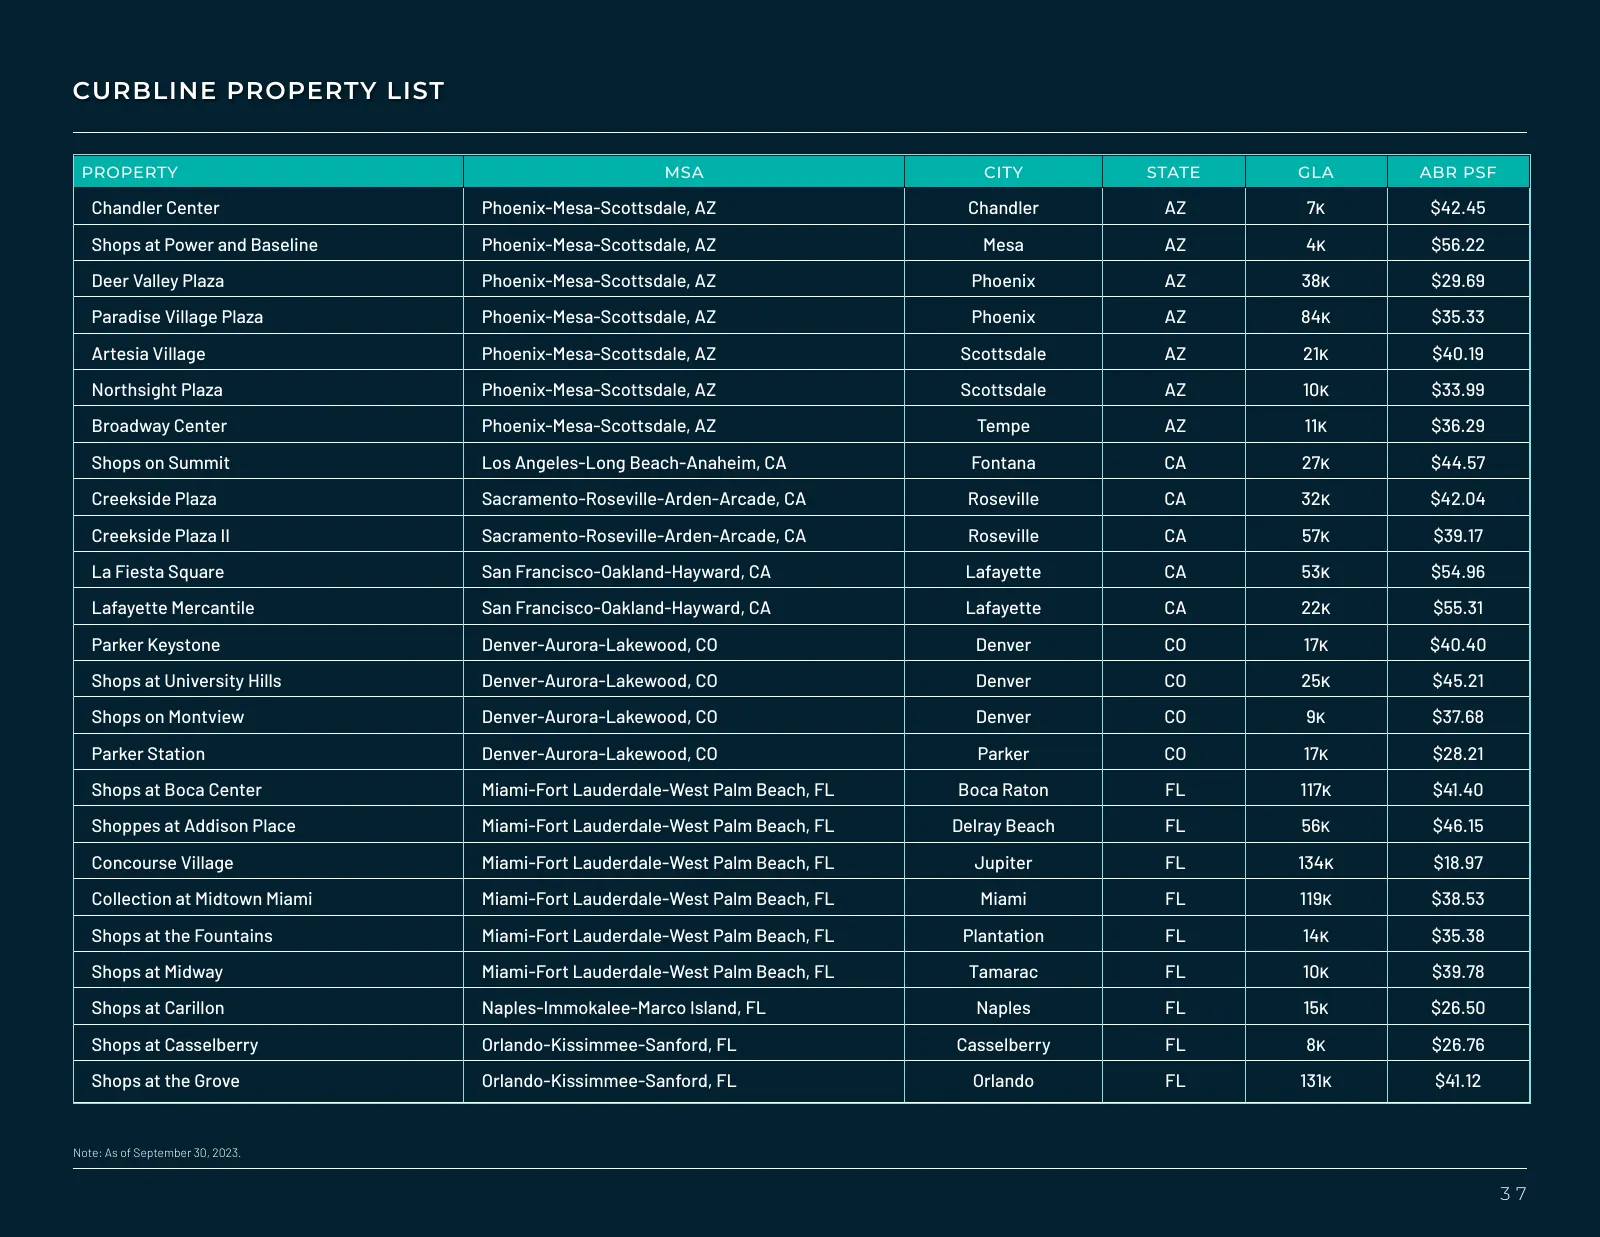
CURBLINE PROPERTY LIST PROPERTY MSA CITY STATE GLA ABR PSF Chandler Center Phoenix-Mesa-Scottsdale, AZ Chandler AZ 7k $42.45 Shops at Power and Baseline Phoenix-Mesa-Scottsdale, AZ Mesa AZ 4k $56.22 Deer Valley Plaza Phoenix-Mesa-Scottsdale, AZ Phoenix AZ 38k $29.69 Paradise Village Plaza Phoenix-Me
Slide 38: Curbline Property List (continued)
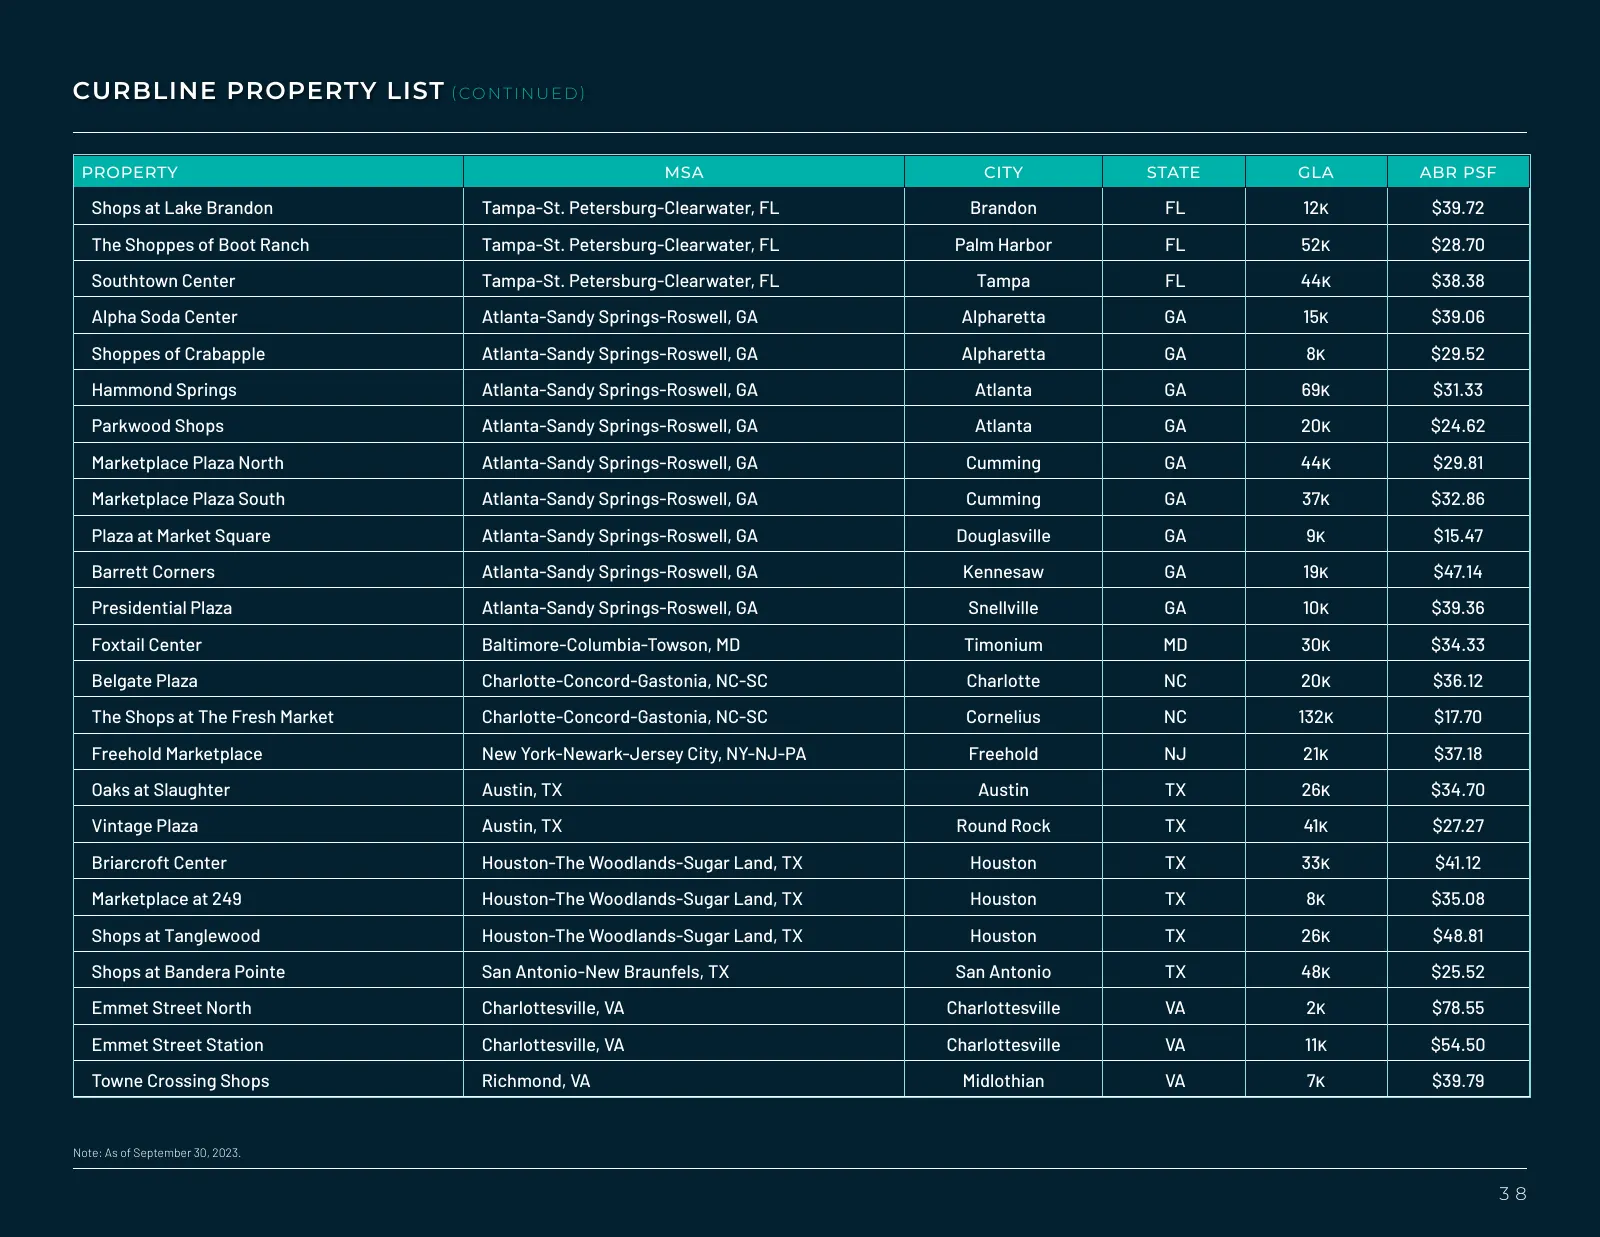
CURBLINE PROPERTY LIST ( C O N T I N U E D ) PROPERTY MSA CITY STATE GLA ABR PSF Shops at Lake Brandon Tampa-St. Petersburg-Clearwater, FL Brandon FL 12k $39.72 The Shoppes of Boot Ranch Tampa-St. Petersburg-Clearwater, FL Palm Harbor FL 52k $28.70 Southtown Center Tampa-St. Petersburg-Clearwater, F
Slide 39: Curbline Property List (continued)
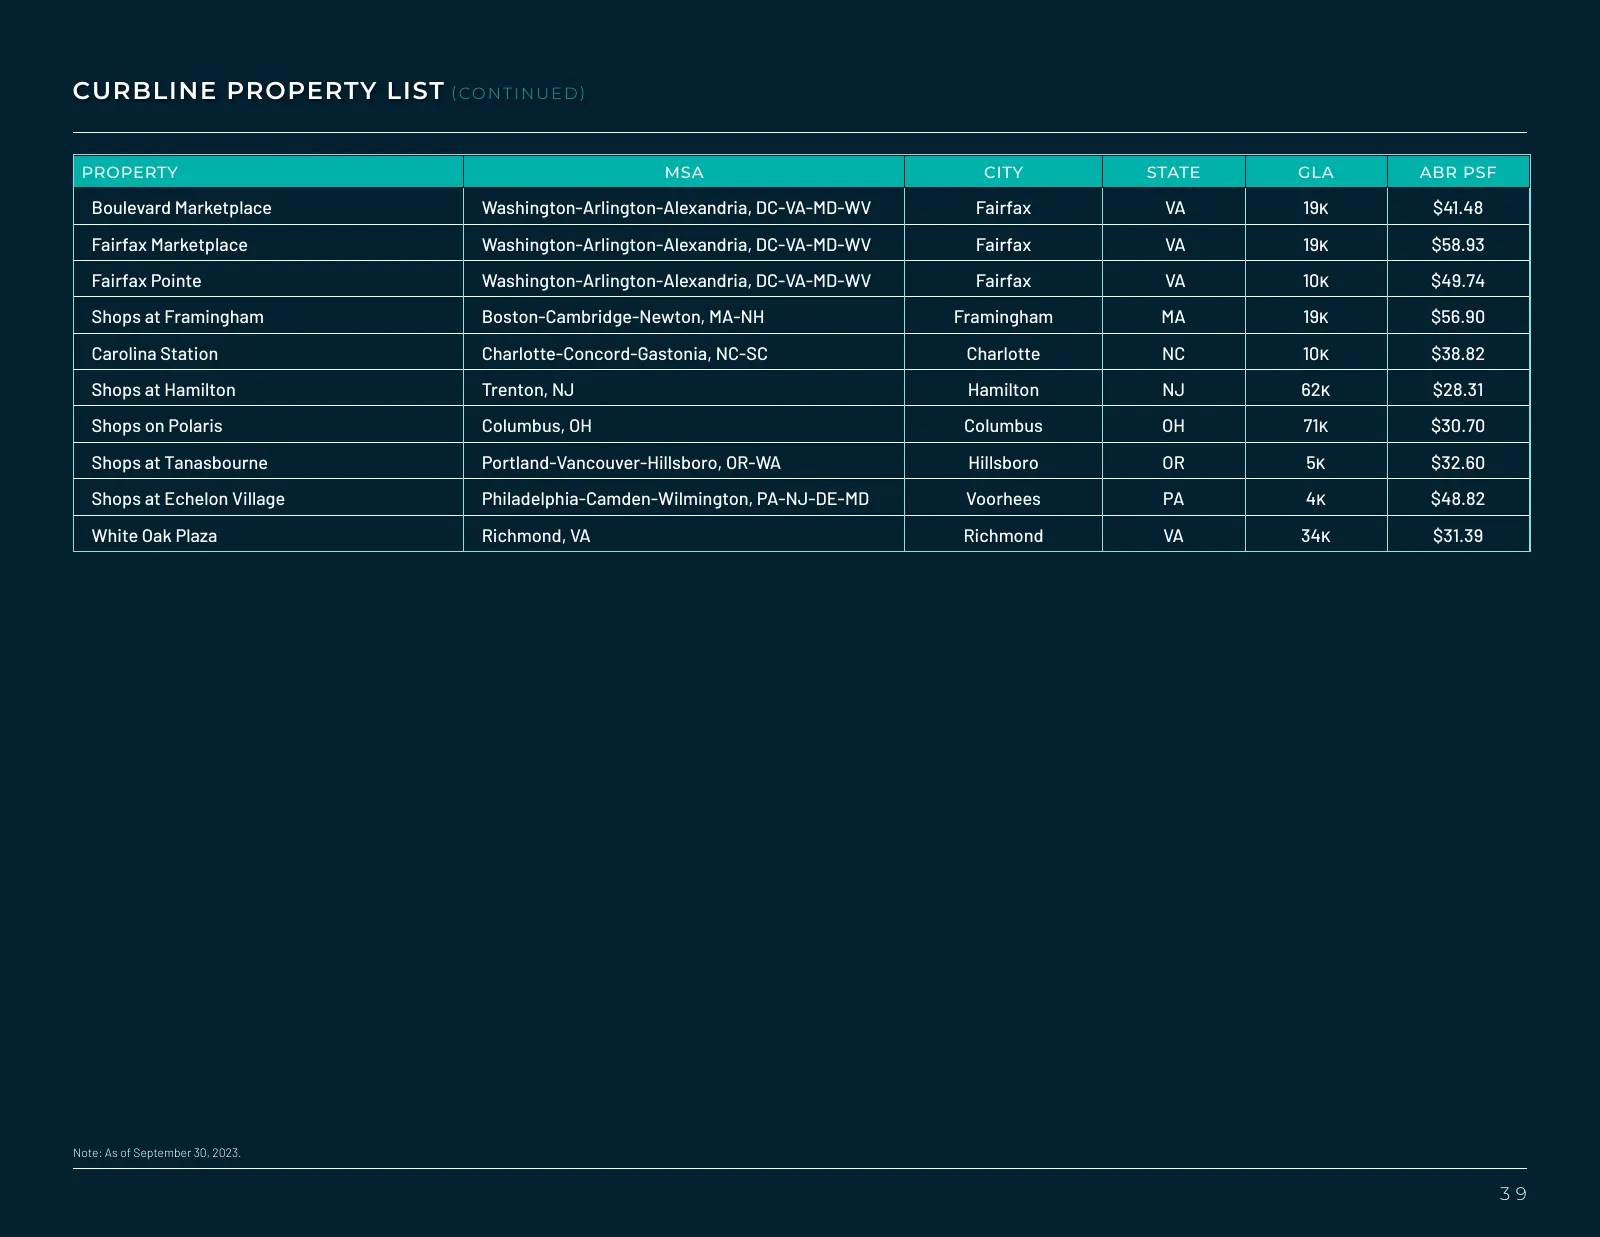
CURBLINE PROPERTY LIST ( C O N T I N U E D ) PROPERTY MSA CITY STATE GLA ABR PSF Boulevard Marketplace Washington-Arlington-Alexandria, DC-VA-MD-WV Fairfax VA 19k $41.48 Fairfax Marketplace Washington-Arlington-Alexandria, DC-VA-MD-WV Fairfax VA 19k $58.93 Fairfax Pointe Washington-Arlington-Alexand
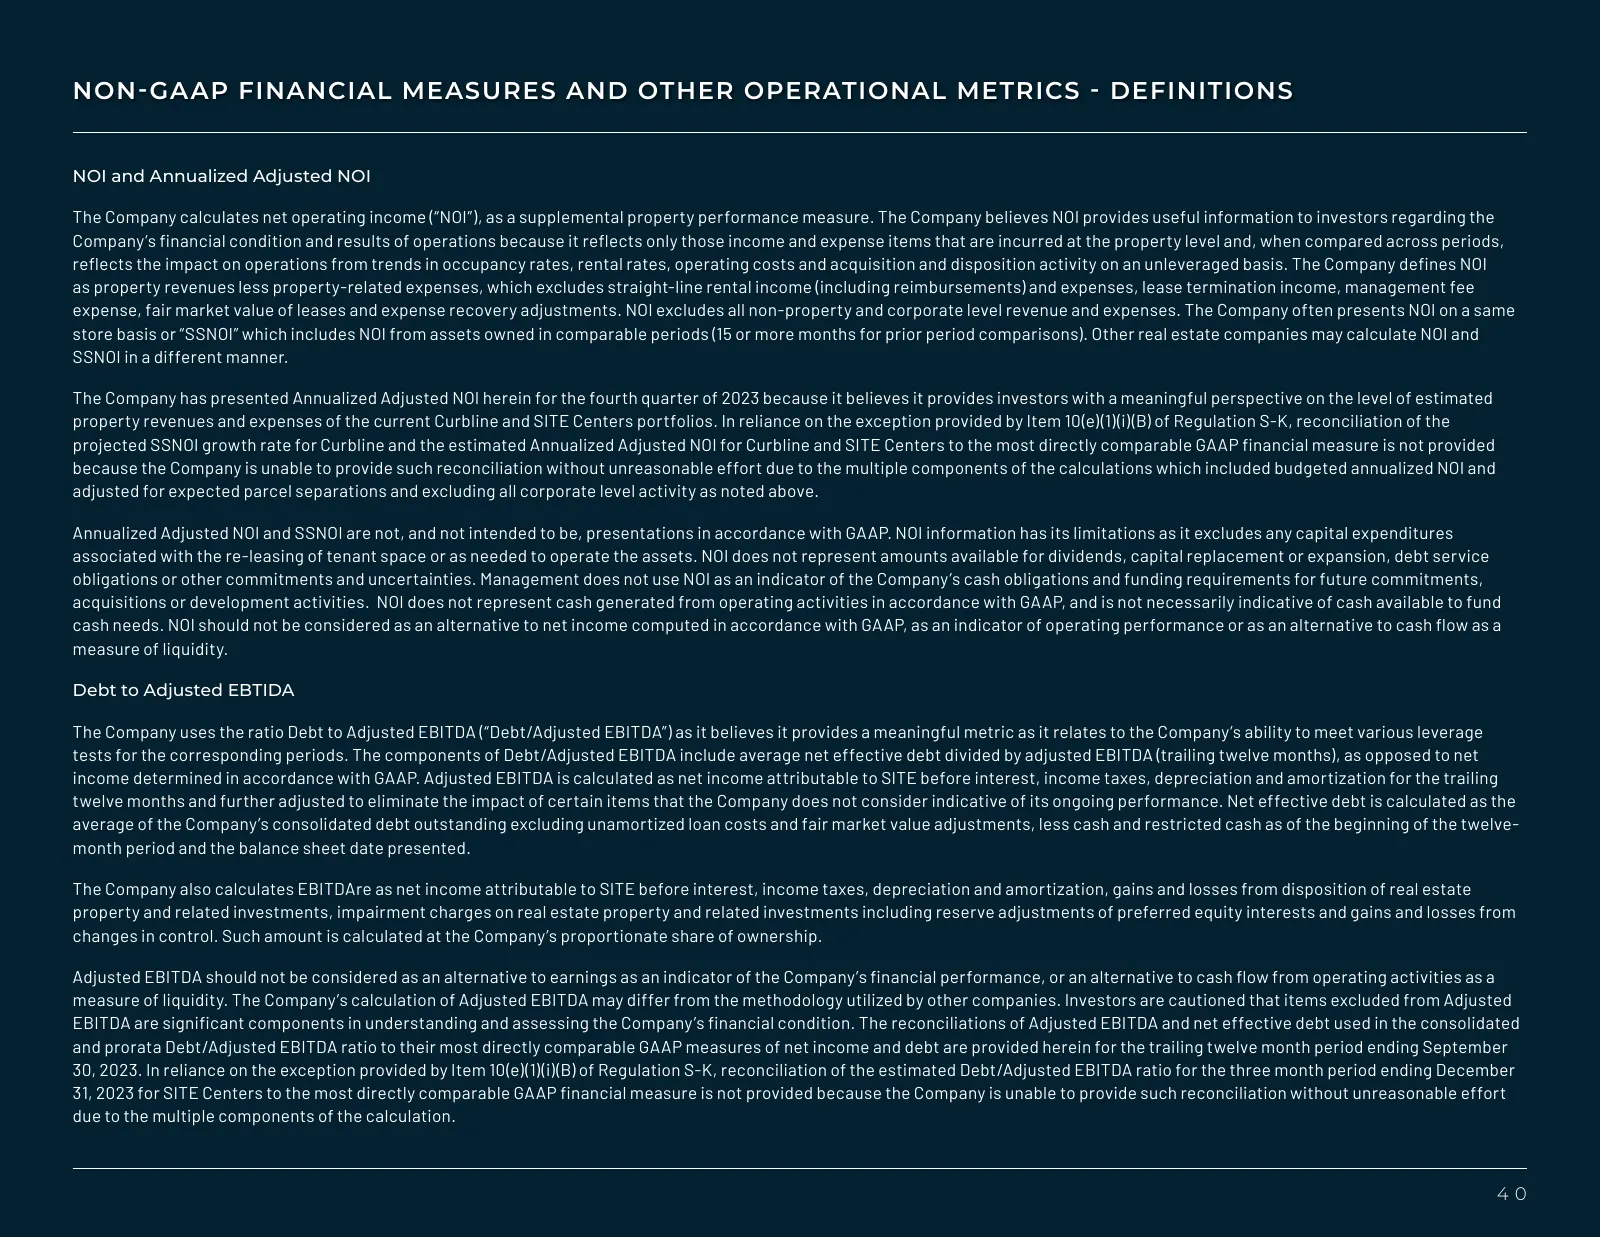
Slide 40: Non-GAAP Financial Measures and Other Operational Metrics - Definitions
NON-GAAP FINANCIAL MEASURES AND OTHER OPERATIONAL METRICS - DEFINITIONS NOI and Annualized Adjusted NOI The Company calculates net operating income (“NOI”), as a supplemental property performance measure. The Company believes NOI provides useful information to investors regarding the Company’s finan
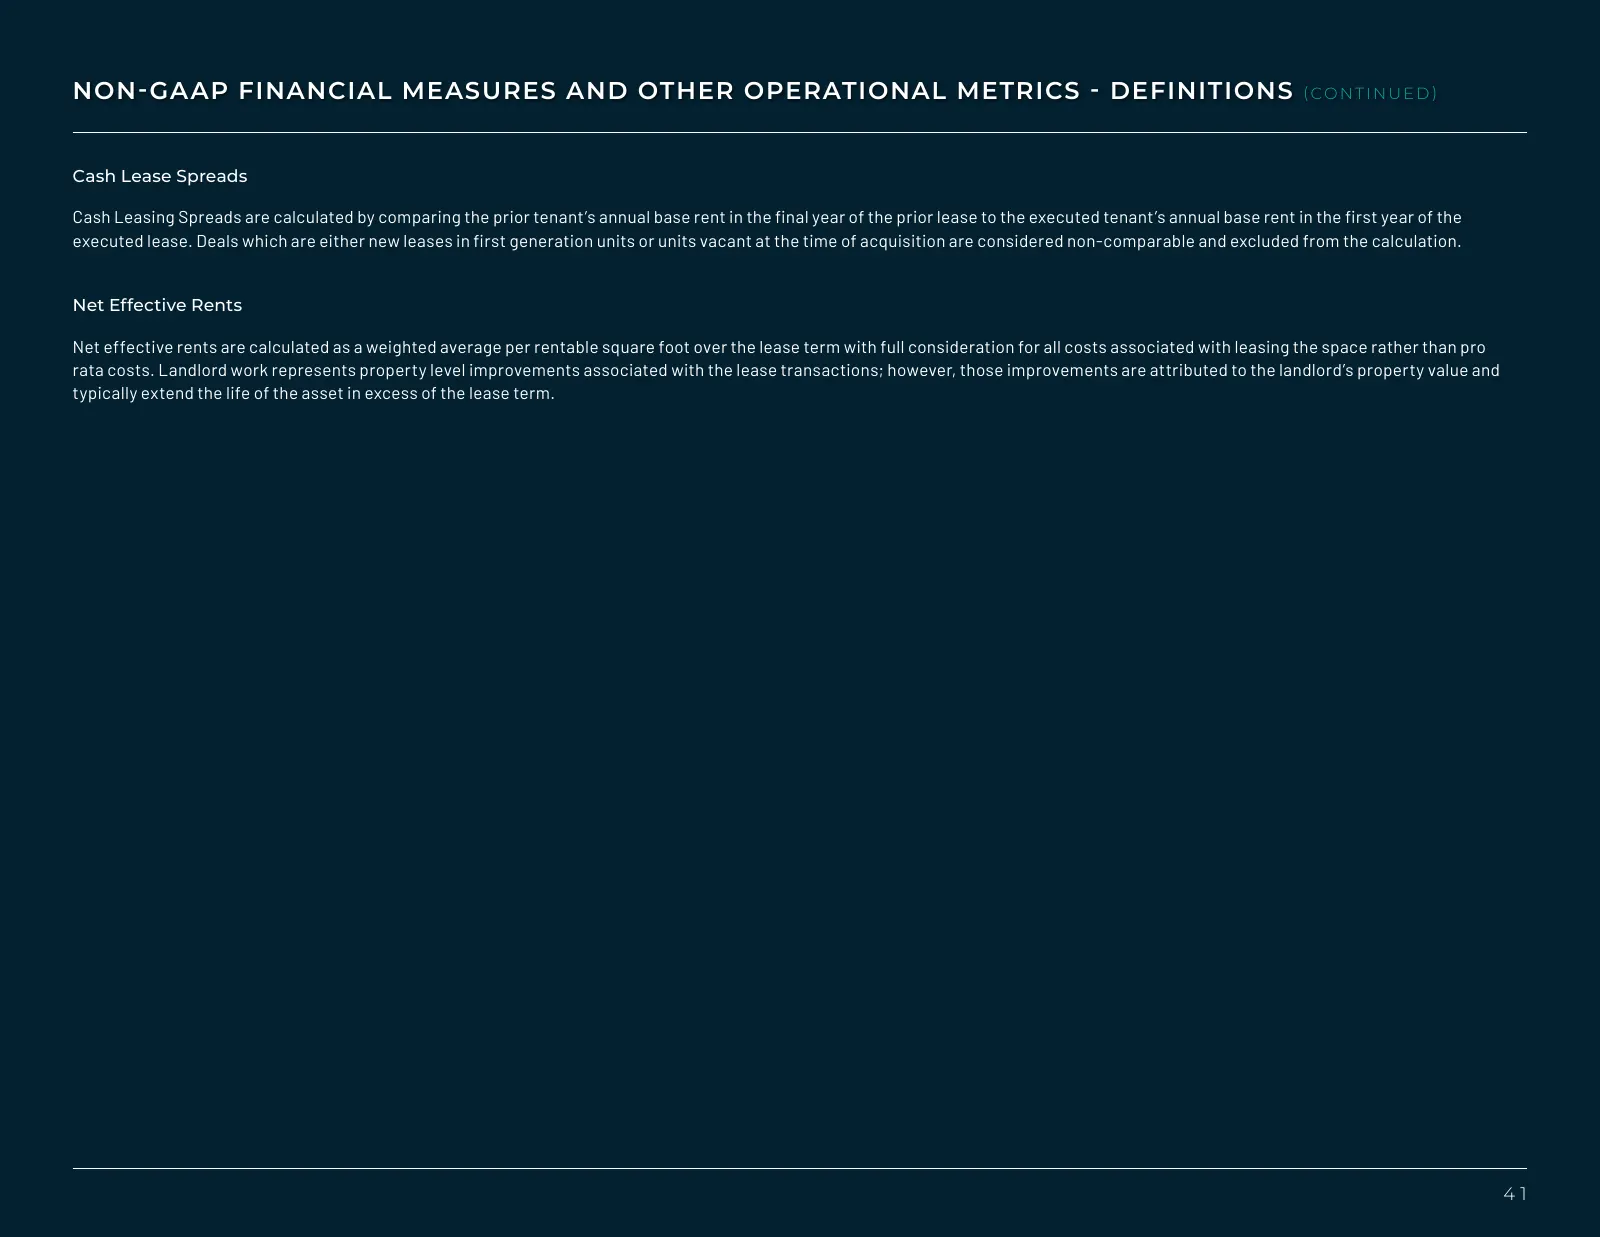
Slide 41: Non-GAAP Financial Measures and Other Operational Metrics - Definitions (continued)
NON-GAAP FINANCIAL MEASURES AND OTHER OPERATIONAL METRICS - DEFINITIONS ( C O N T I N U E D ) Cash Lease Spreads Cash Leasing Spreads are calculated by comparing the prior tenant’s annual base rent in the final year of the prior lease to the executed tenant’s annual base rent in the first year of th
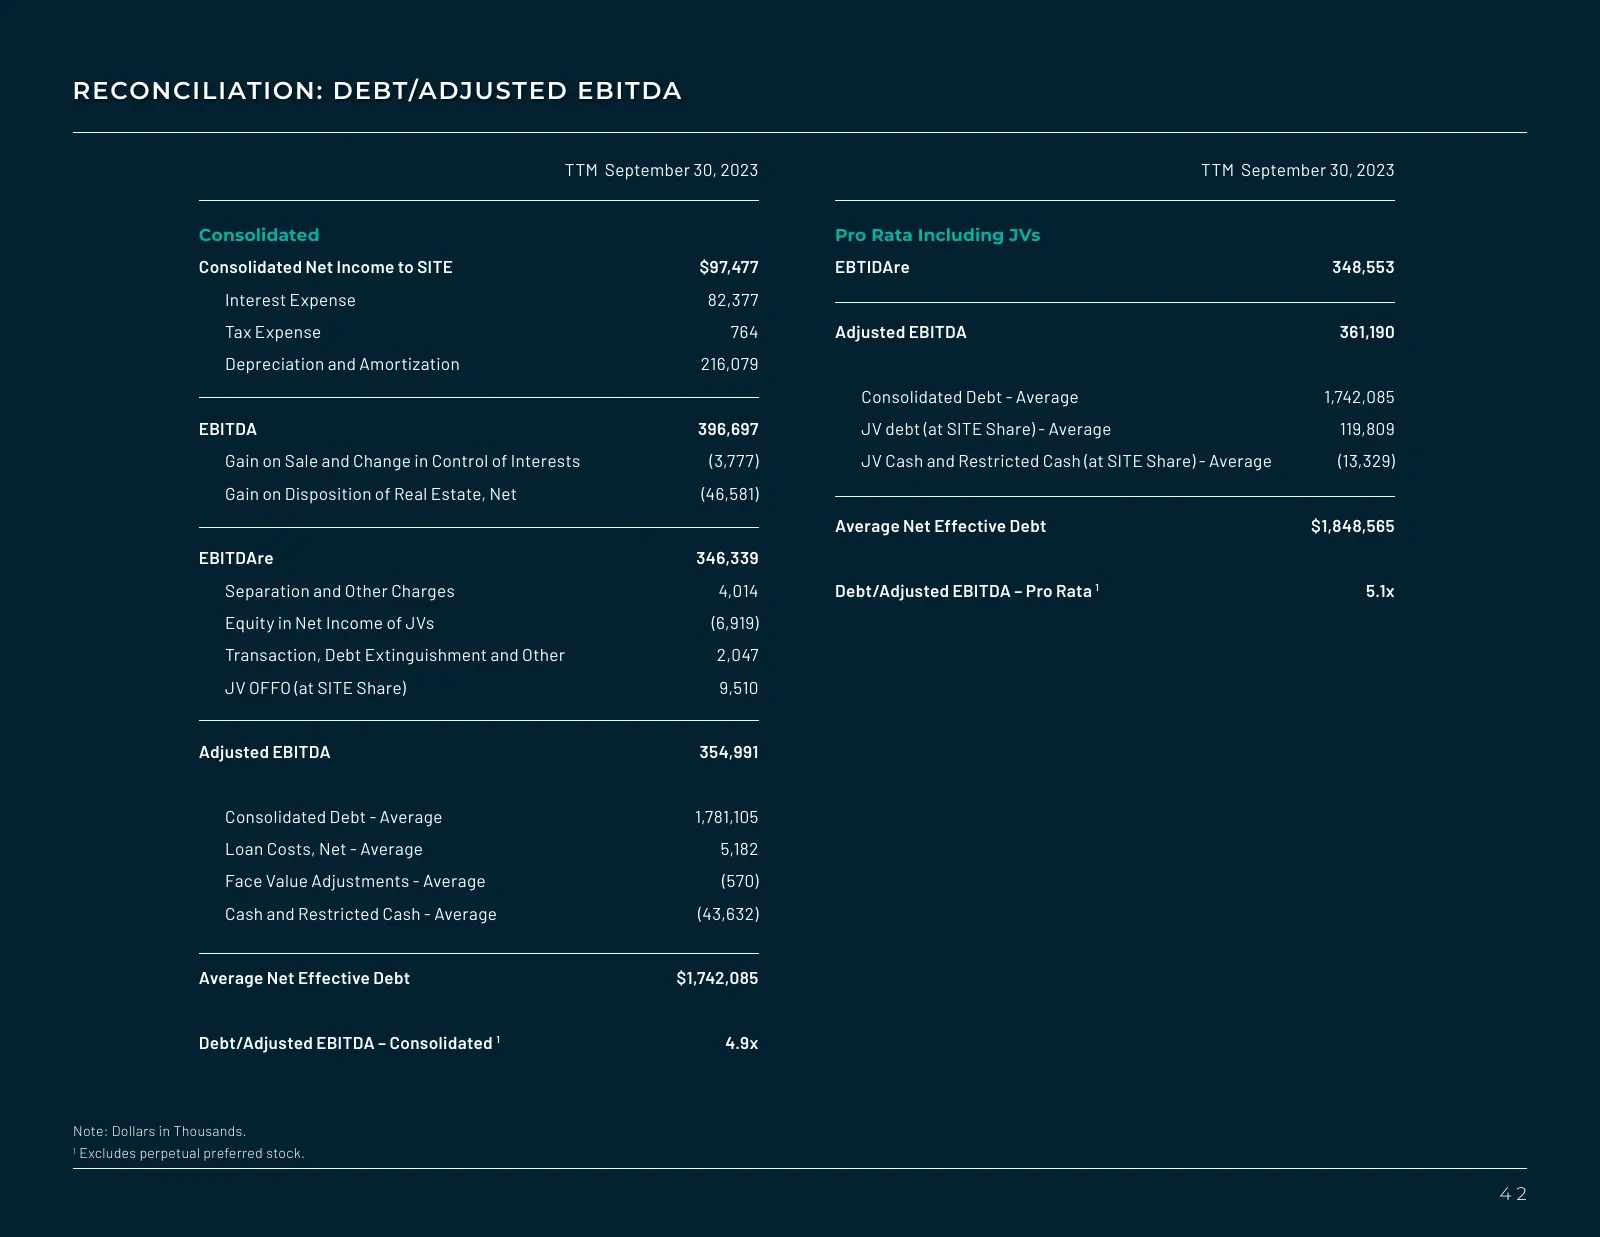
Slide 42: Reconciliation: Debt/Adjusted EBITDA
RECONCILIATION: DEBT/ADJUSTED EBITDA TTM September 30, 2023 TTM September 30, 2023 Consolidated Pro Rata Including JVs Consolidated Net Income to SITE $97,477 EBTIDAre 348,553 Interest Expense 82,377 Tax Expense 764 Adjusted EBITDA 361,190 Depreciation and Amortization 216,079 Consolidated Debt - Av
Source: Internet Archive copy of images.sitecenters.com
More decks from SITE Centers Corp.
 Merger or Acquisition (September 2024)32 slides · Sep 17, 2024
 Q2 2024 Earnings Presentation39 slides · Jul 30, 2024
 Q1 2024 Earnings Presentation28 slides · Apr 30, 2024
 Citi Global Property CEO Conference 202442 slides · March 2024
 Q4 2023 Earnings Presentation29 slides · Feb 13, 2024
 Merger or Acquisition (November 2023)42 slides · Nov 1, 2023