SITE Centers Corp. · NYSE:SITC
SITE Centers — Q4 2023 Earnings Presentation
29 slides from SITE Centers's earnings presentation, Feb 13, 2024

Slide 1: 4Q23 Earnings Conference Call
4Q23 EARNINGS CONFERENCE CALL SITE CENTERS | FEBRUARY 13, 2024
Slide 2: Safe Harbor Statement
S A F E H A R B O R S TAT E M E N T SITE Centers Corp. considers portions of the information in this press release to be forward-looking statements within the meaning of Section 27A of the Securities Act of 1933 and Section 21E of the Securities Exchange Act of 1934, both as amended, with respect to
Slide 3: Table of Contents
4 Q 2 3 K E Y TA K E AWAY S 4 4 Q 2 3 R E S U LT S S U M M A R Y 5 Table of O P E R AT I O N S O V E R V I E W 6 Contents G U I D A N C E & E A R N I N G S C O N S I D E R AT I O N S 10 CURBLINE PROPERTIES PORTFOLIO 11 APPENDIX 22 SITE CENTERS 4Q23 CONFERENCE CALL 3
Slide 4: 4Q23 Key Takeaways
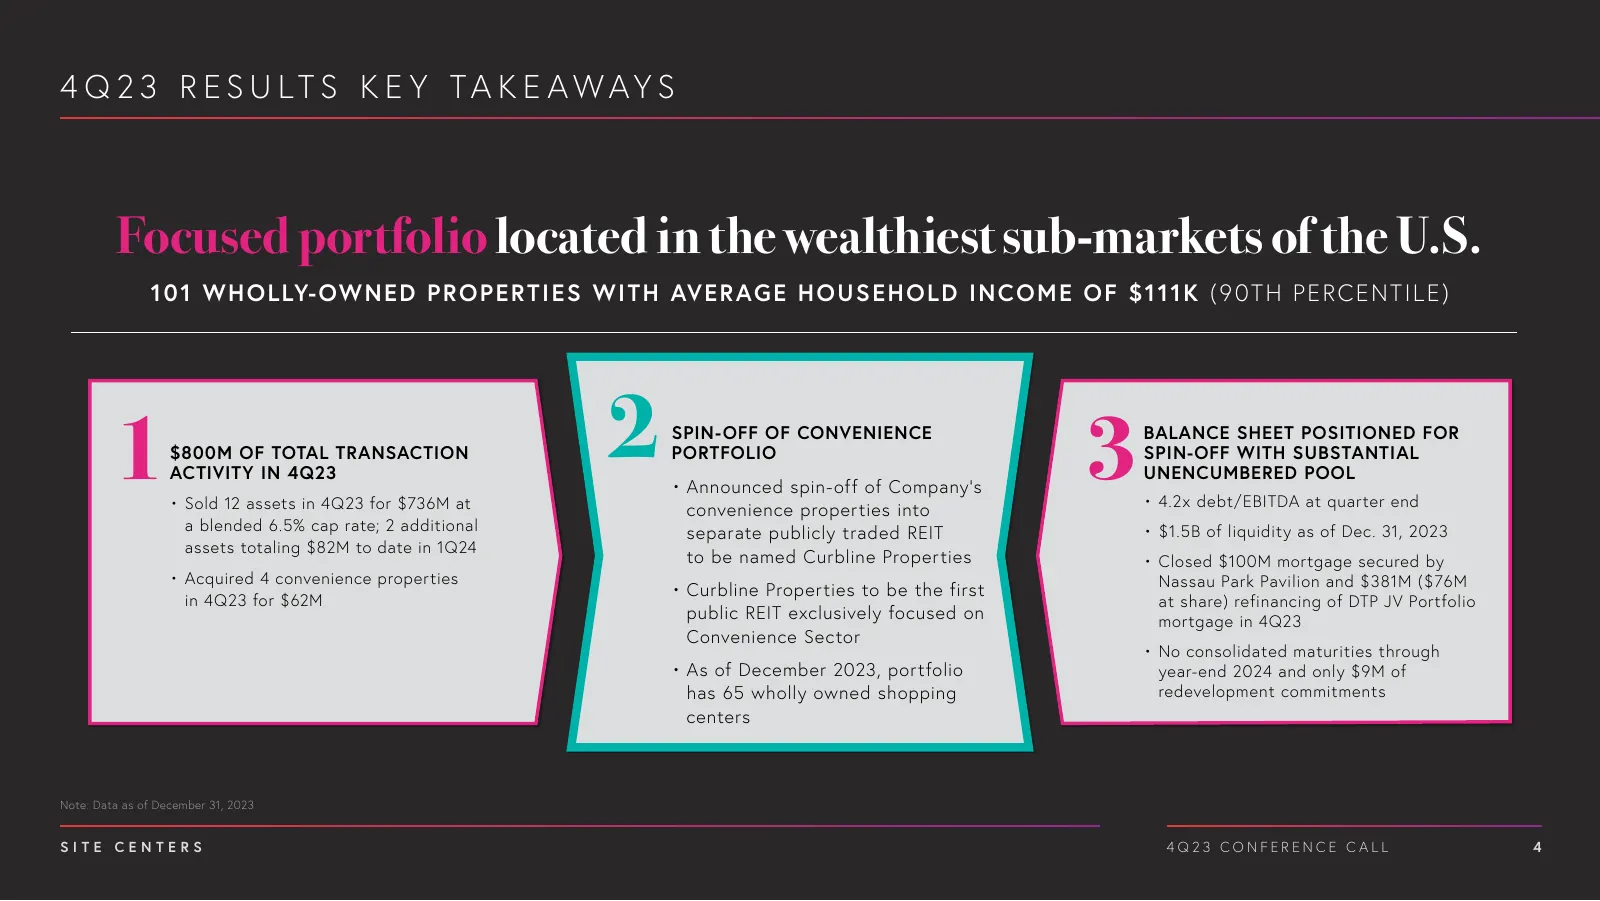
4 Q 2 3 R E S U LT S K E Y TA K E AWAY S Focused portfolio located in the wealthiest sub-markets of the U.S. 1 0 1 W HOL LY-OW NE D P R O P E R TI E S W I TH AVE R AG E H O U S EHO LD INCO ME O F $111K (90 TH PE RCE NTILE ) 1 $800M OF TOTAL TRANSACTION ACTIVITY IN 4Q23 2 SPIN-OFF OF CONVENIENCE PORT
Slide 5: 4Q23 Results Summary
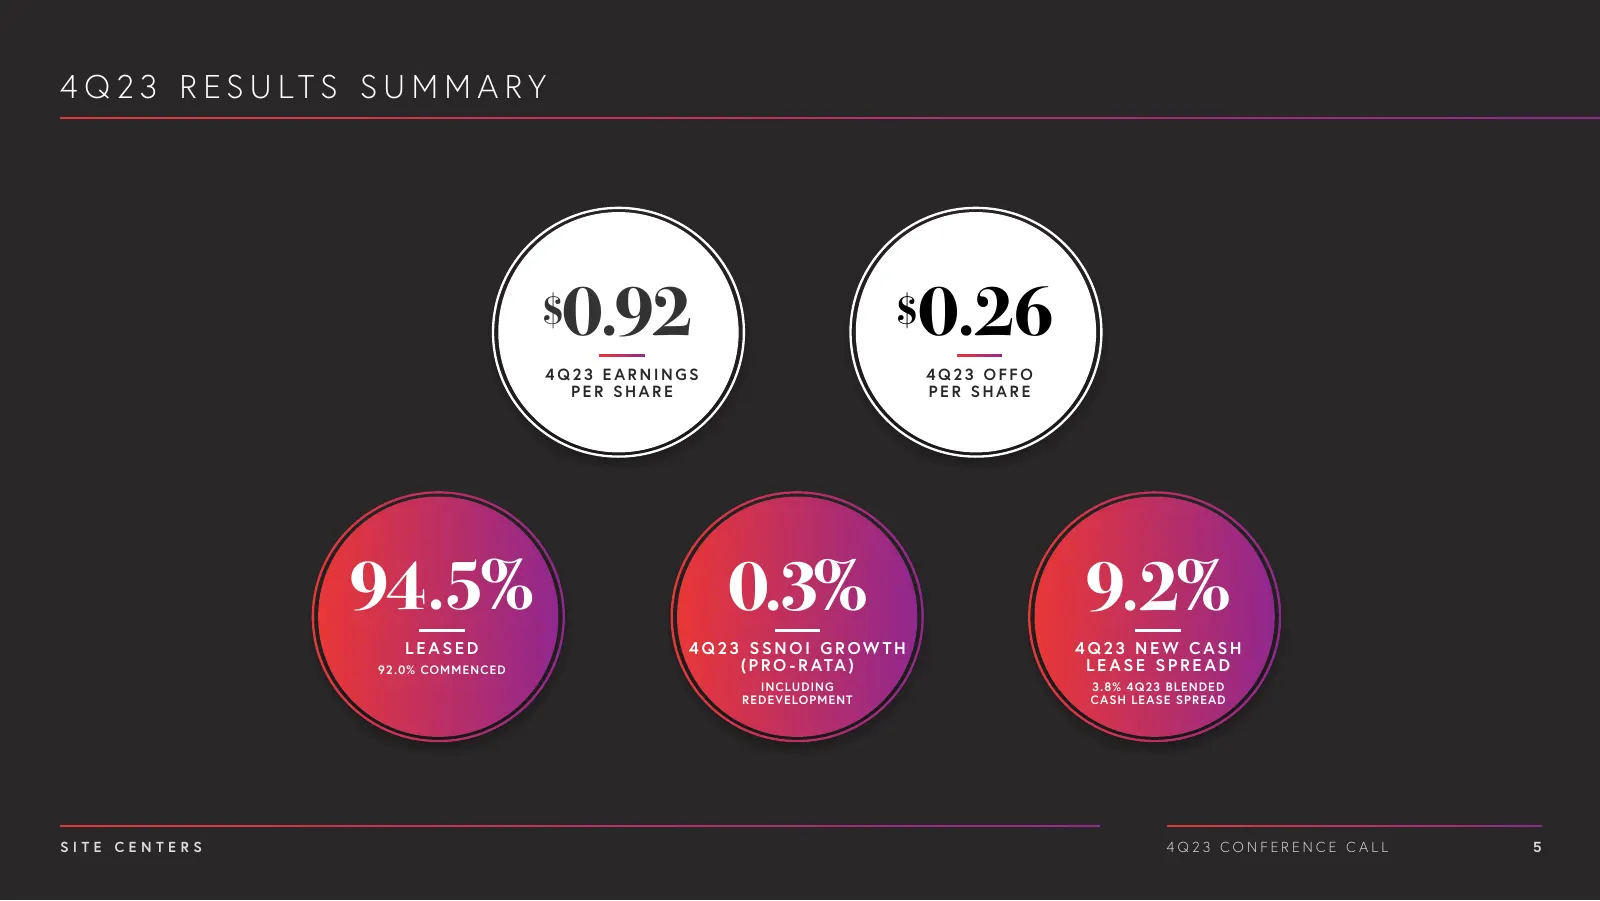
4 Q 2 3 R E S U LT S S U M M A R Y $0.92 $ 0.26 4Q23 EARNINGS 4Q23 OFFO PER SHARE PER SHARE 94.5% 0.3% 9.2% LEASED 4Q23 SSNOI G ROW TH 4Q23 NEW CASH 92 .0% COMMENCED ( P R O - R ATA ) LEASE SPREAD INCLUDING 3.8% 4Q23 BLENDED REDE VELOPMENT CASH LE ASE SPRE AD SITE CENTERS 4Q23 CONFERENCE CALL 5
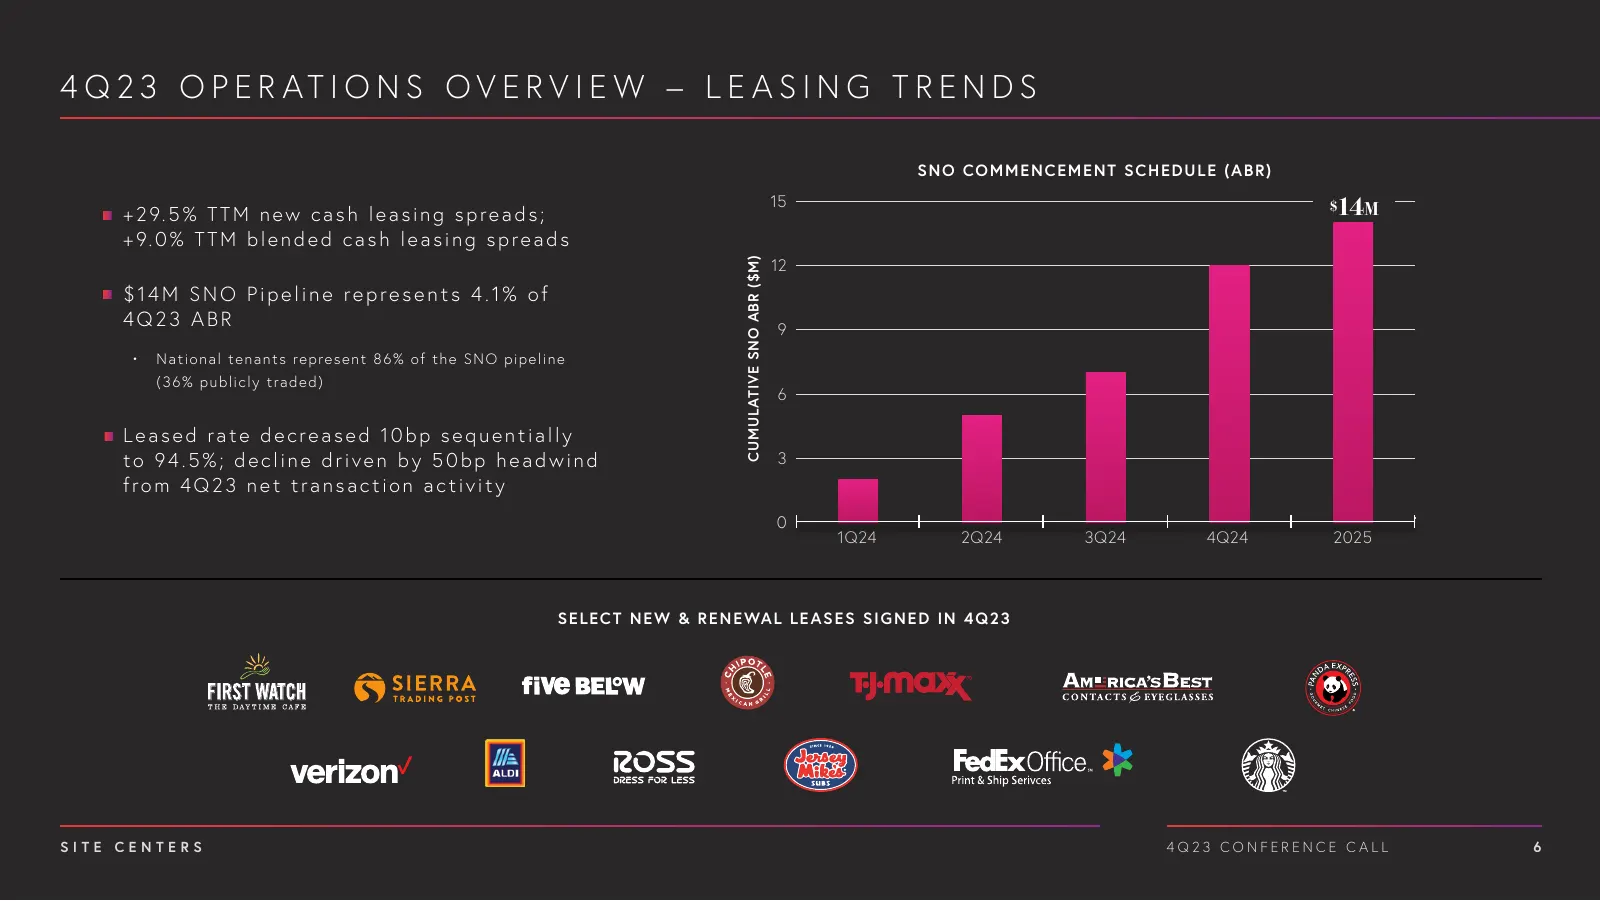
Slide 6: Operations Overview – Leasing Trends
4 Q 2 3 O P E R AT I O N S O V E R V I E W – L E A S I N G T R E N D S SN O CO M M E N CE M E NT SCH E D U L E ( A B R) + 2 9. 5 % T T M n e w c a s h l e a s i n g s p r e a d s ; 15 14m $ + 9. 0 % T T M b l e n d e d c a s h l e a s i n g s p r e a d s 12 CUMULATIVE SNO ABR ($M) $14M SNO Pipeline
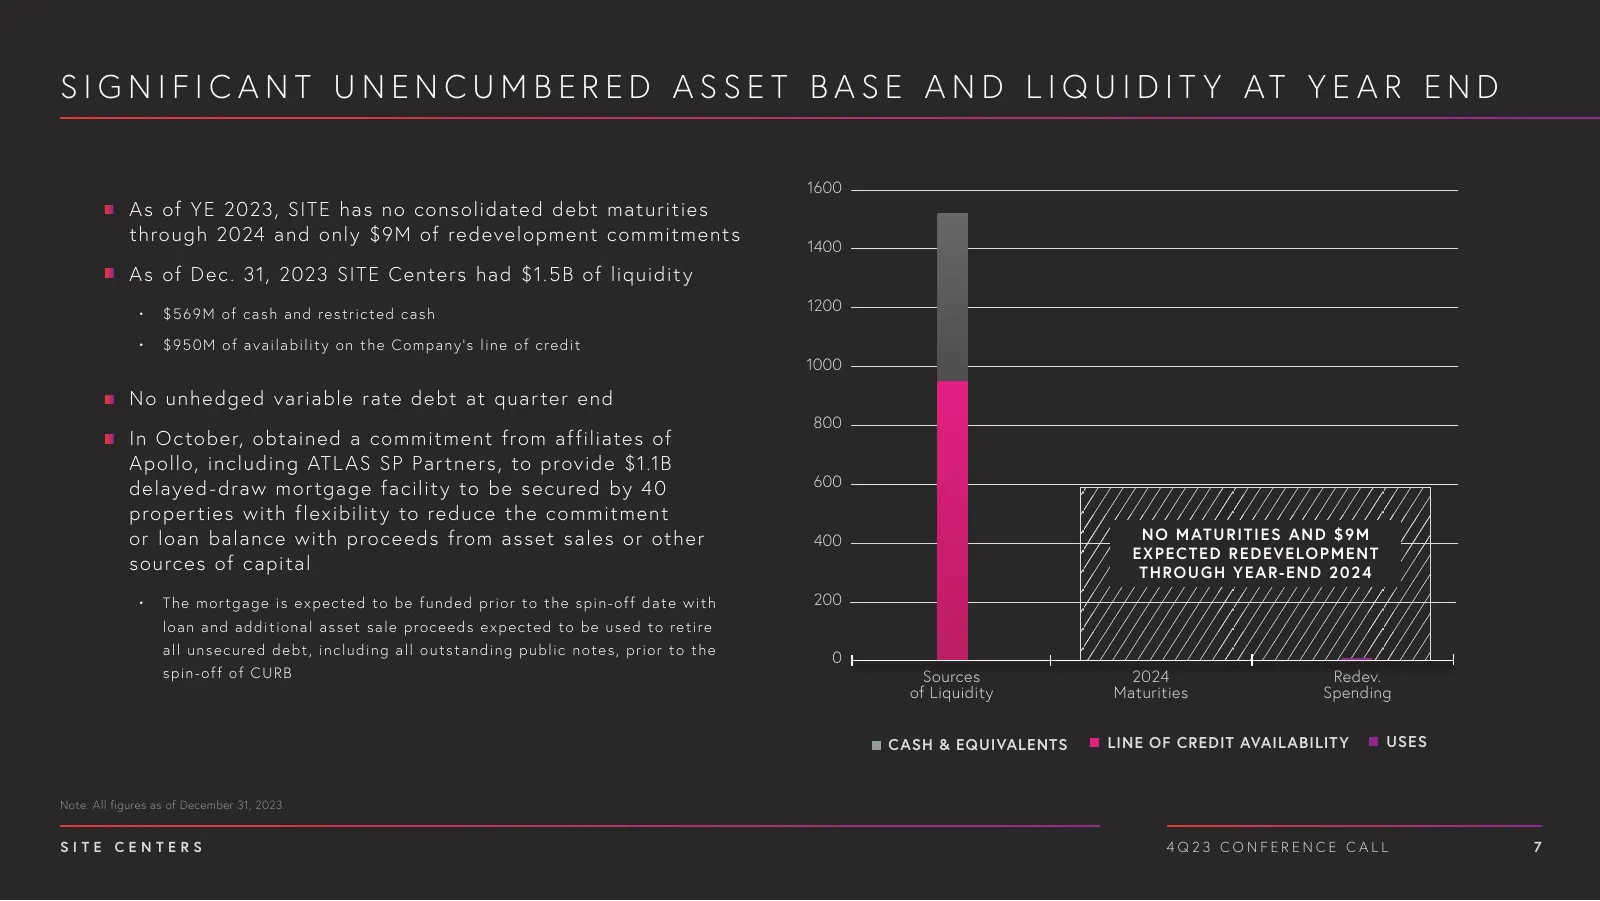
Slide 7: Significant Unencumbered Asset Base and Liquidity at Year End
S I G N I F I C A N T U N E N C U M B E R E D A S S E T B A S E A N D L I Q U I D I T Y AT Y E A R E N D 1600 A s of YE 2023, SITE has no consolidated debt maturities through 2024 and only $9M of redevelopment commitments 1400 A s of Dec . 31, 2023 SITE Centers had $1.5B of liquidit y 1200 • $ 5 69M
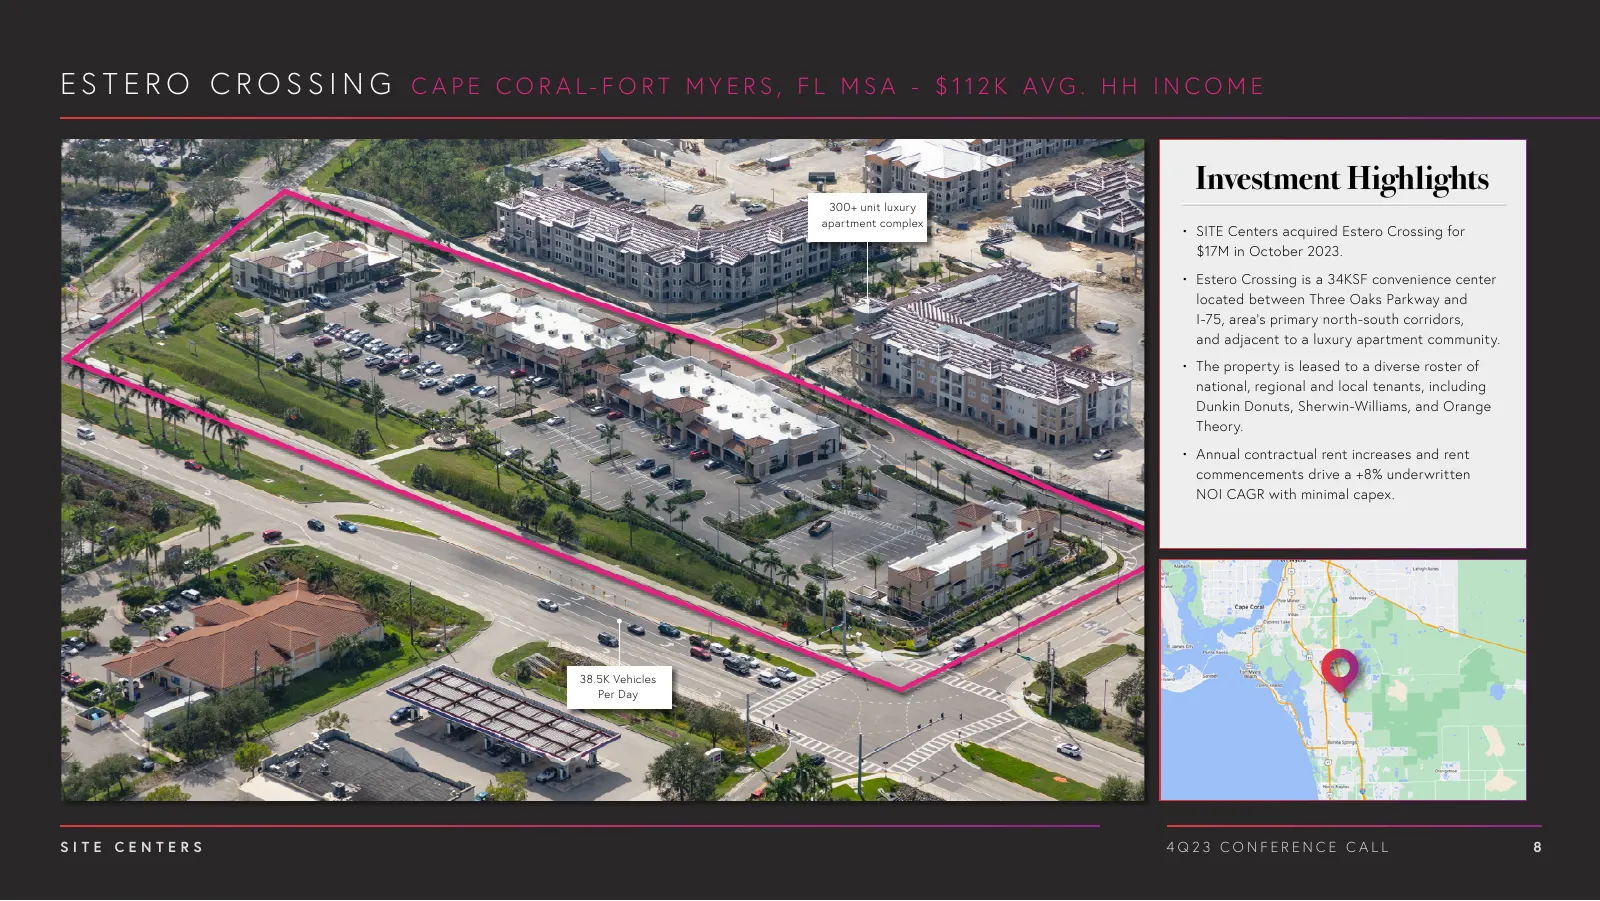
Slide 8: Investment Highlights: Estero Crossing
E S T E R O C R O S S I N G C A P E C O R A L- F O R T M Y E R S , F L M S A - $ 1 1 2 K A V G . H H I N C O M E Investment Highlights 300+ unit luxury apartment complex • SITE Centers acquired Estero Crossing for $17M in October 2023. • Estero Crossing is a 34KSF convenience center located between
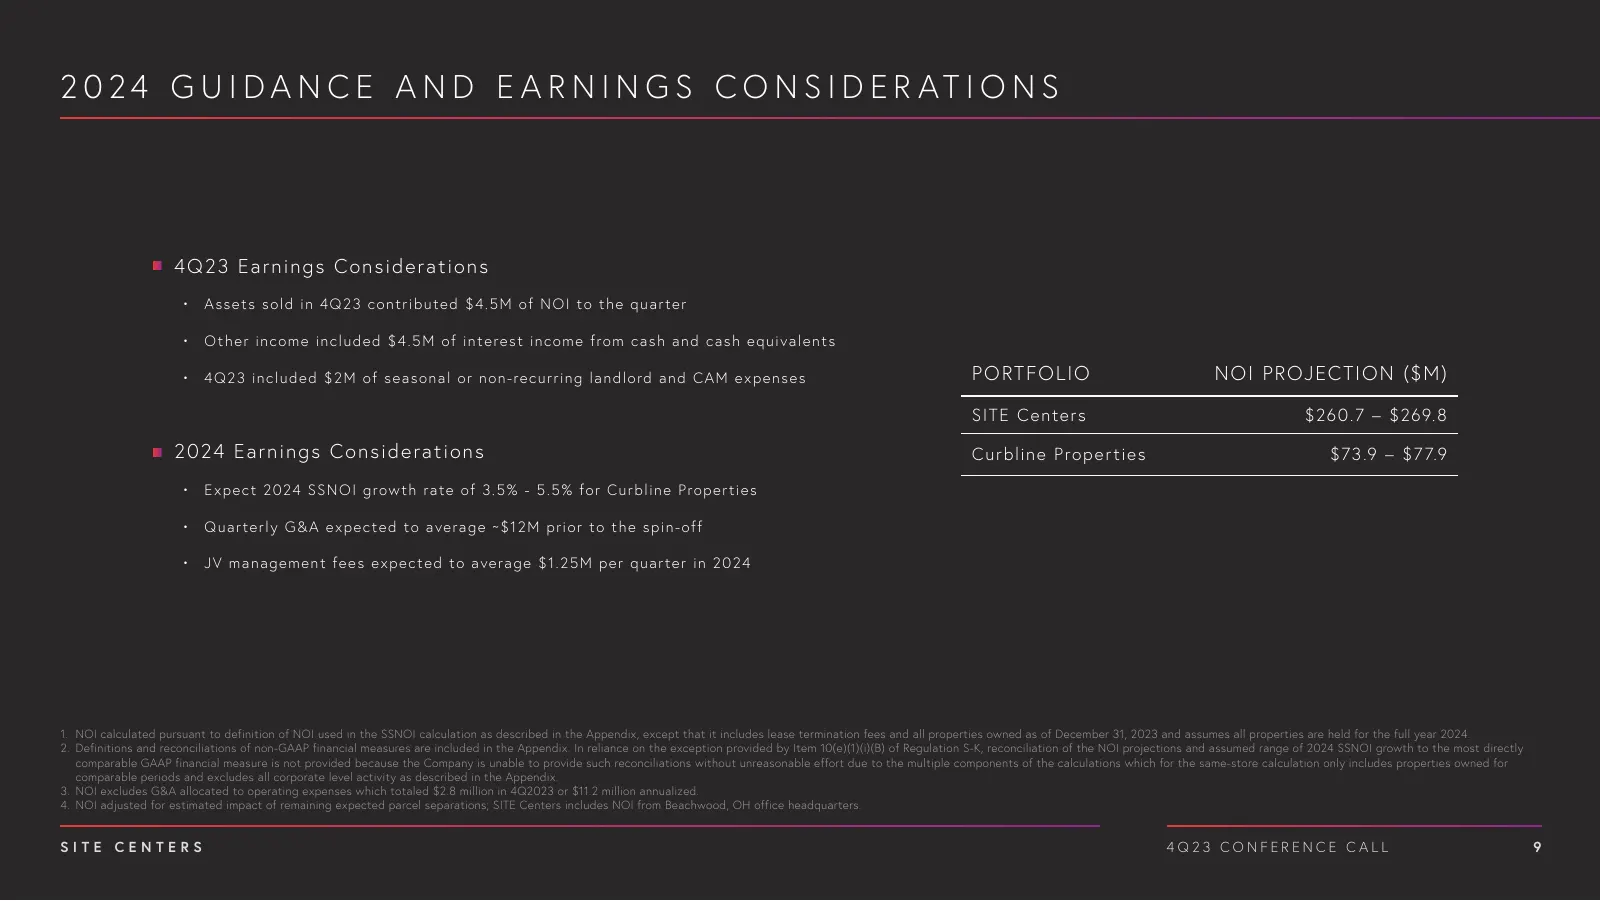
Slide 9: 2024 Guidance and Earnings Considerations
2 0 24 G U I D A N C E A N D E A R N I N G S C O N S I D E R AT I O N S 4 Q 2 3 E arni ng s C o nsi dera tions • A s s e t s s ol d i n 4Q 23 c on t ri bu t e d $4.5M of N O I t o t h e qu art e r • Ot he r i n c om e i n c l u de d $ 4. 5M of in t e re st in c om e f rom c ash an d c ash e qu iv al

Slide 10: Curbline Properties (CURB)
CURBLINE CURBLINE PROPERTIES (CURB)
Slide 11: Transaction Overview: Key Operating Metrics
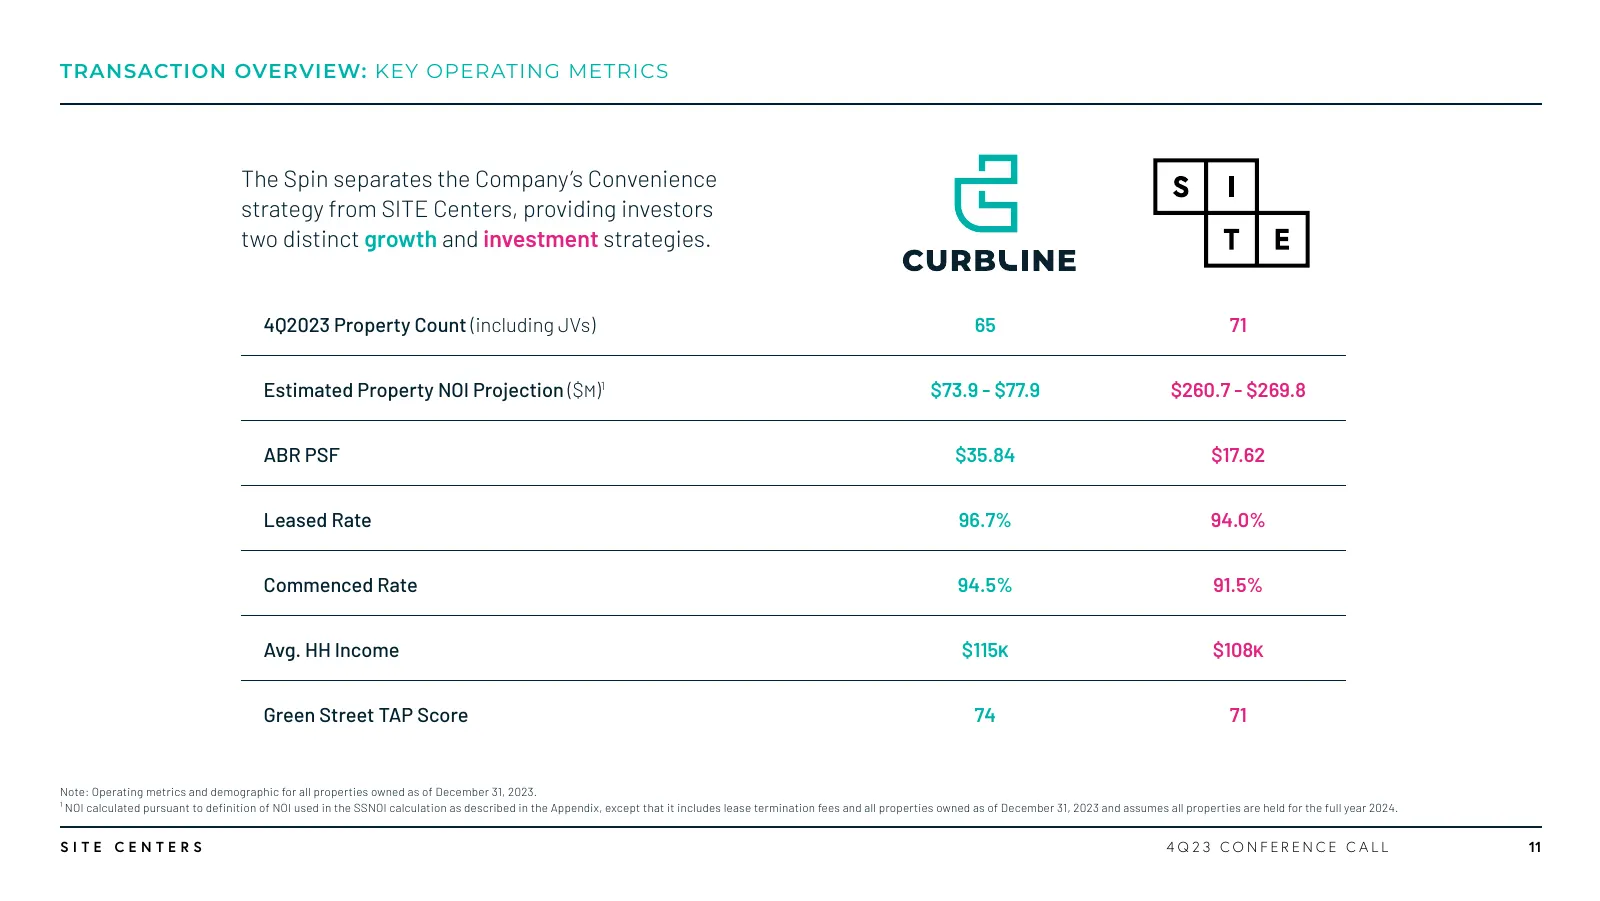
TRANSACTION OVERVIEW: KEY OPERATING METRICS The Spin separates the Company’s Convenience strategy from SITE Centers, providing investors two distinct growth and investment strategies. 4Q2023 Property Count (including JVs) 65 71 Estimated Property NOI Projection ($m)1 $73.9 - $77.9 $260.7 - $269.8 AB
Slide 12: Transaction Overview: Estimated Timeline & Cash Flows
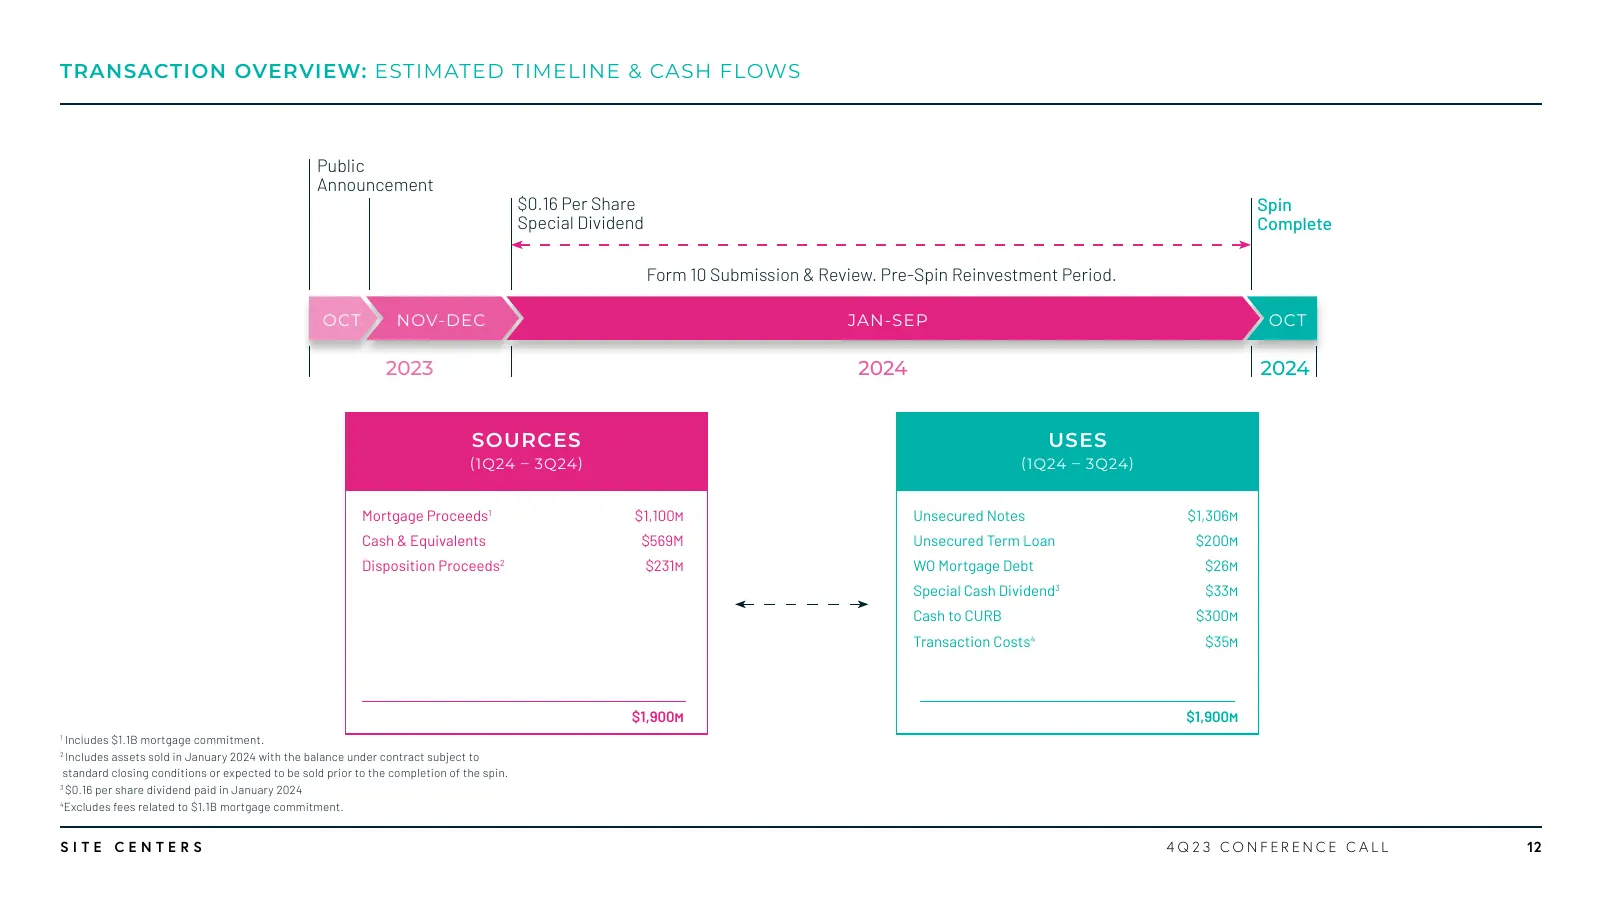
TRANSACTION OVERVIEW: ESTIMATED TIMELINE & CASH FLOWS Public Announcement $0.16 Per Share Spin Special Dividend Complete Form 10 Submission & Review. Pre-Spin Reinvestment Period. OCT NOV-DEC JAN-SEP OCT 2023 2024 2024 SOURCES USES (1Q24 – 3Q24) (1Q24 – 3Q24) Mortgage Proceeds1 $1,100m Unsecured Not
Slide 13: Transaction Overview: Pro Forma Balance Sheets
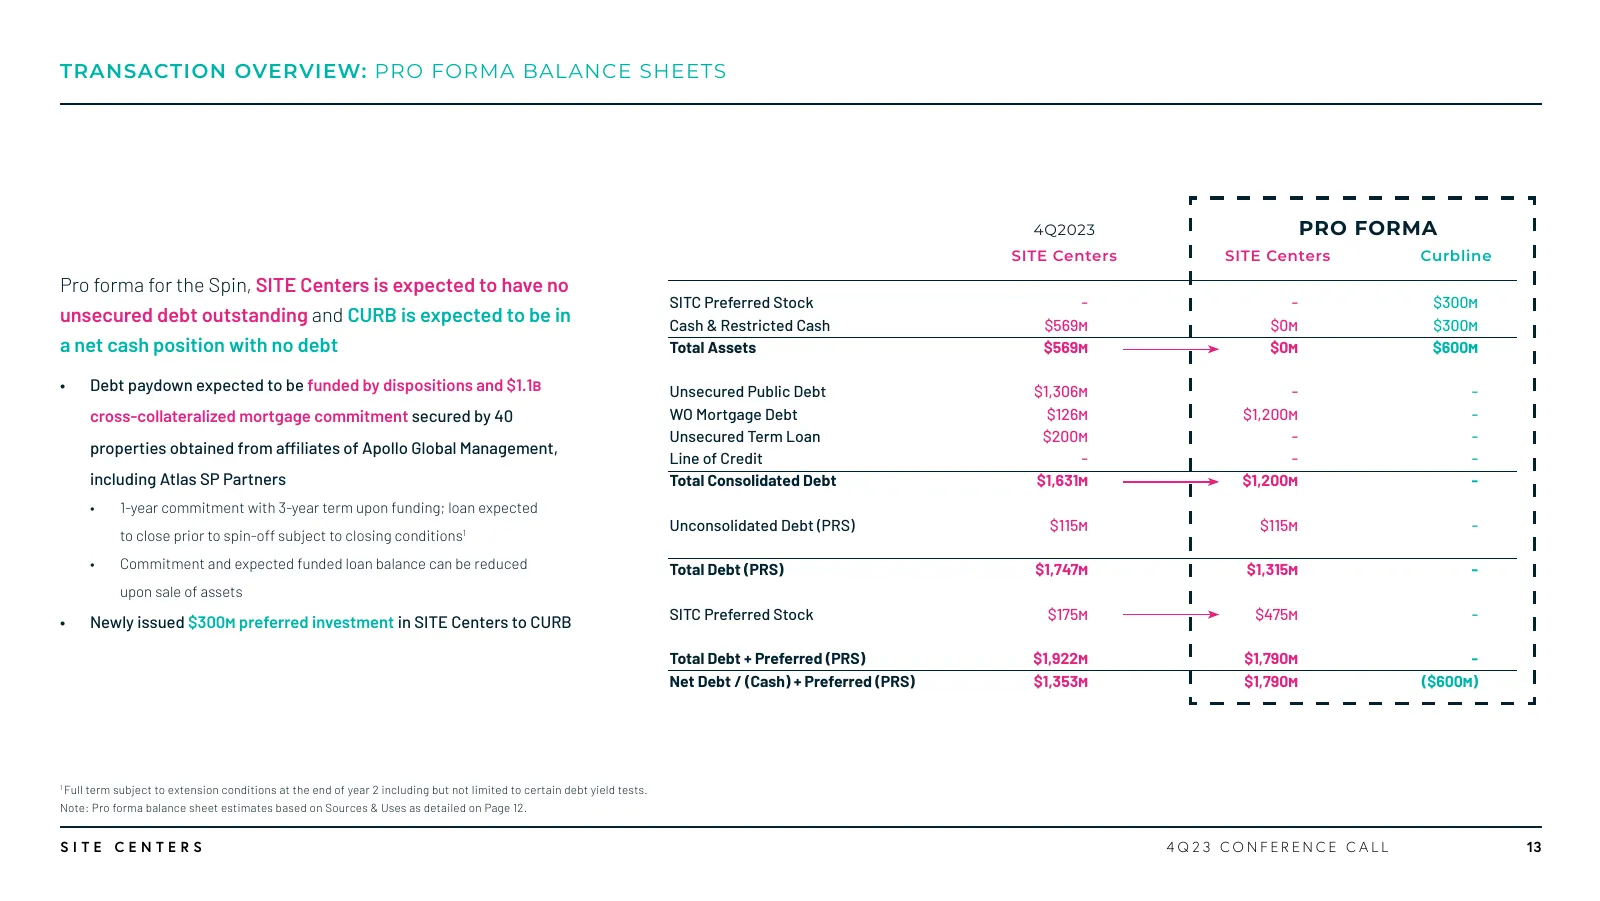
TRANSACTION OVERVIEW: PRO FORMA BALANCE SHEETS 4Q2023 PRO FORMA SITE Centers SITE Centers Curbline Pro forma for the Spin, SITE Centers is expected to have no SITC Preferred Stock - - $300m unsecured debt outstanding and CURB is expected to be in Cash & Restricted Cash $569m $0m $300m a net cash pos
Slide 14: Curbline Properties: A Uniquely Positioned Company
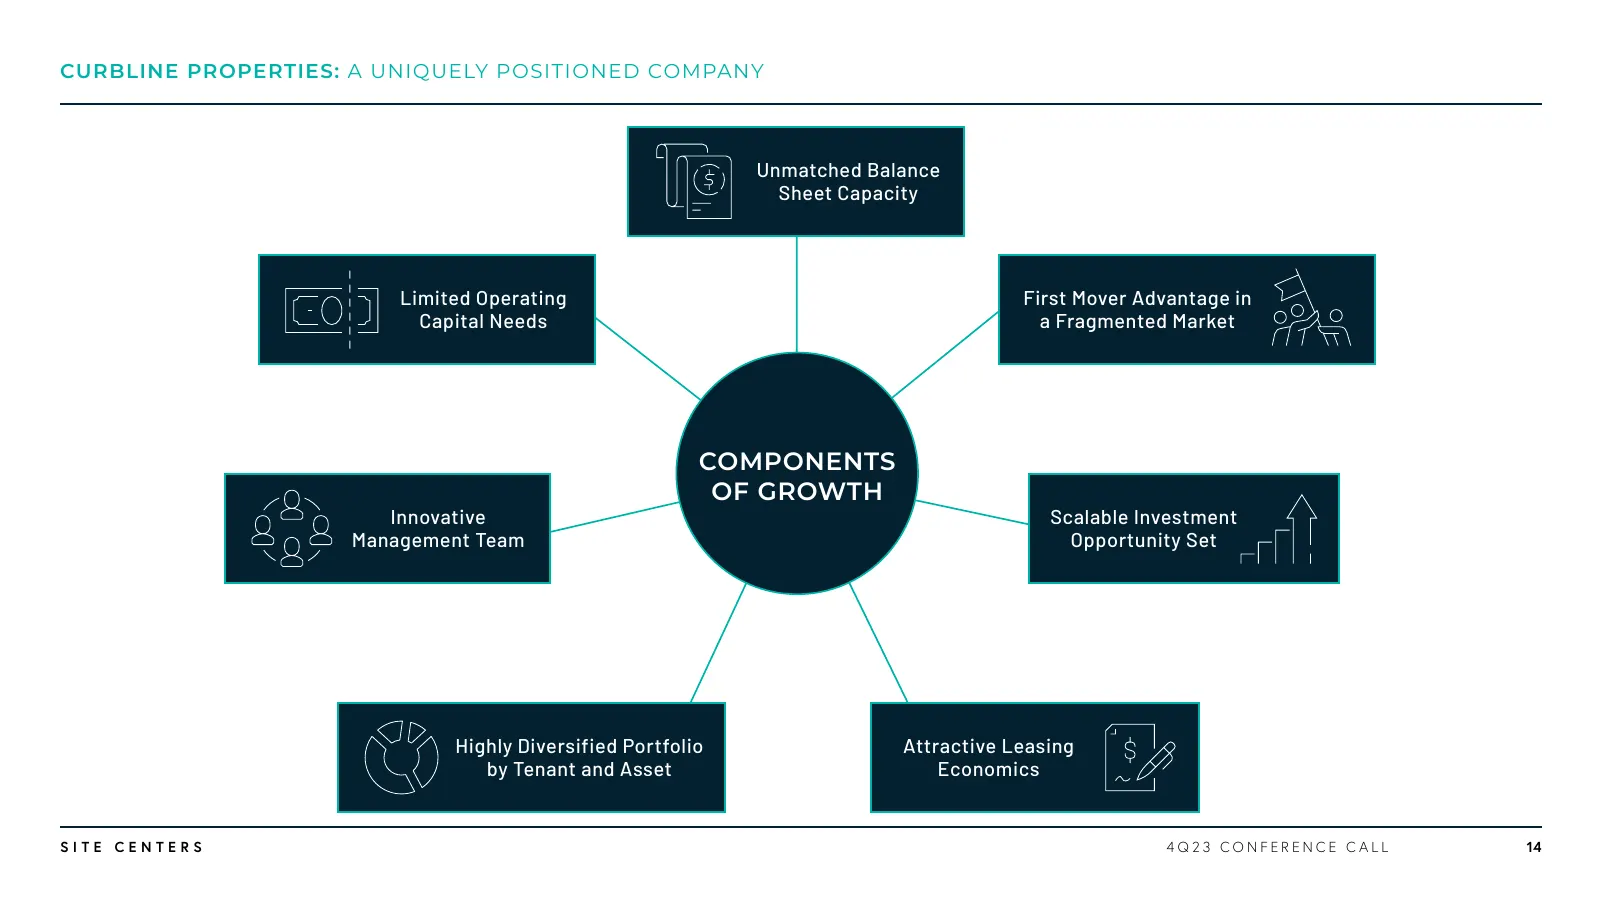
CURBLINE PROPERTIES: A UNIQUELY POSITIONED COMPANY Unmatched Balance Sheet Capacity Limited Operating First Mover Advantage in Capital Needs a Fragmented Market COMPONENTS OF GROWTH Innovative Scalable Investment Management Team Opportunity Set Highly Diversified Portfolio Attractive Leasing by Tena
Slide 15: Curbline Properties: Portfolio Overview
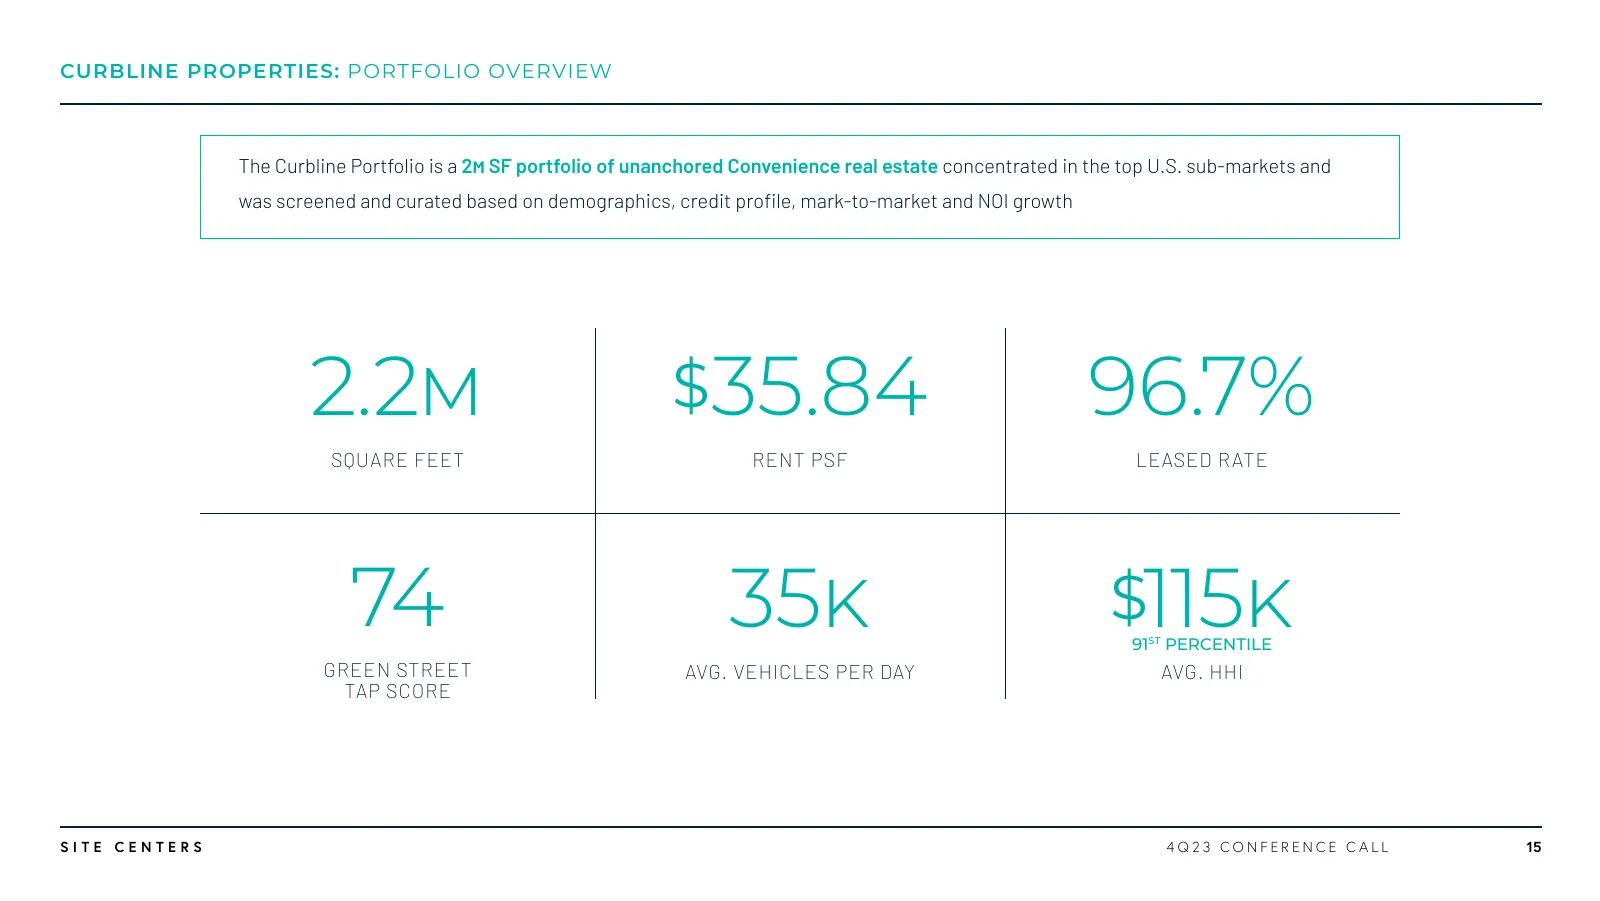
CURBLINE PROPERTIES: PORTFOLIO OVERVIEW The Curbline Portfolio is a 2m SF portfolio of unanchored Convenience real estate concentrated in the top U.S. sub-markets and was screened and curated based on demographics, credit profile, mark-to-market and NOI growth 2.2m $35.84 96.7% SQUARE FEET RENT PSF
Slide 16: Curbline Properties: Differentiated from Public Peers
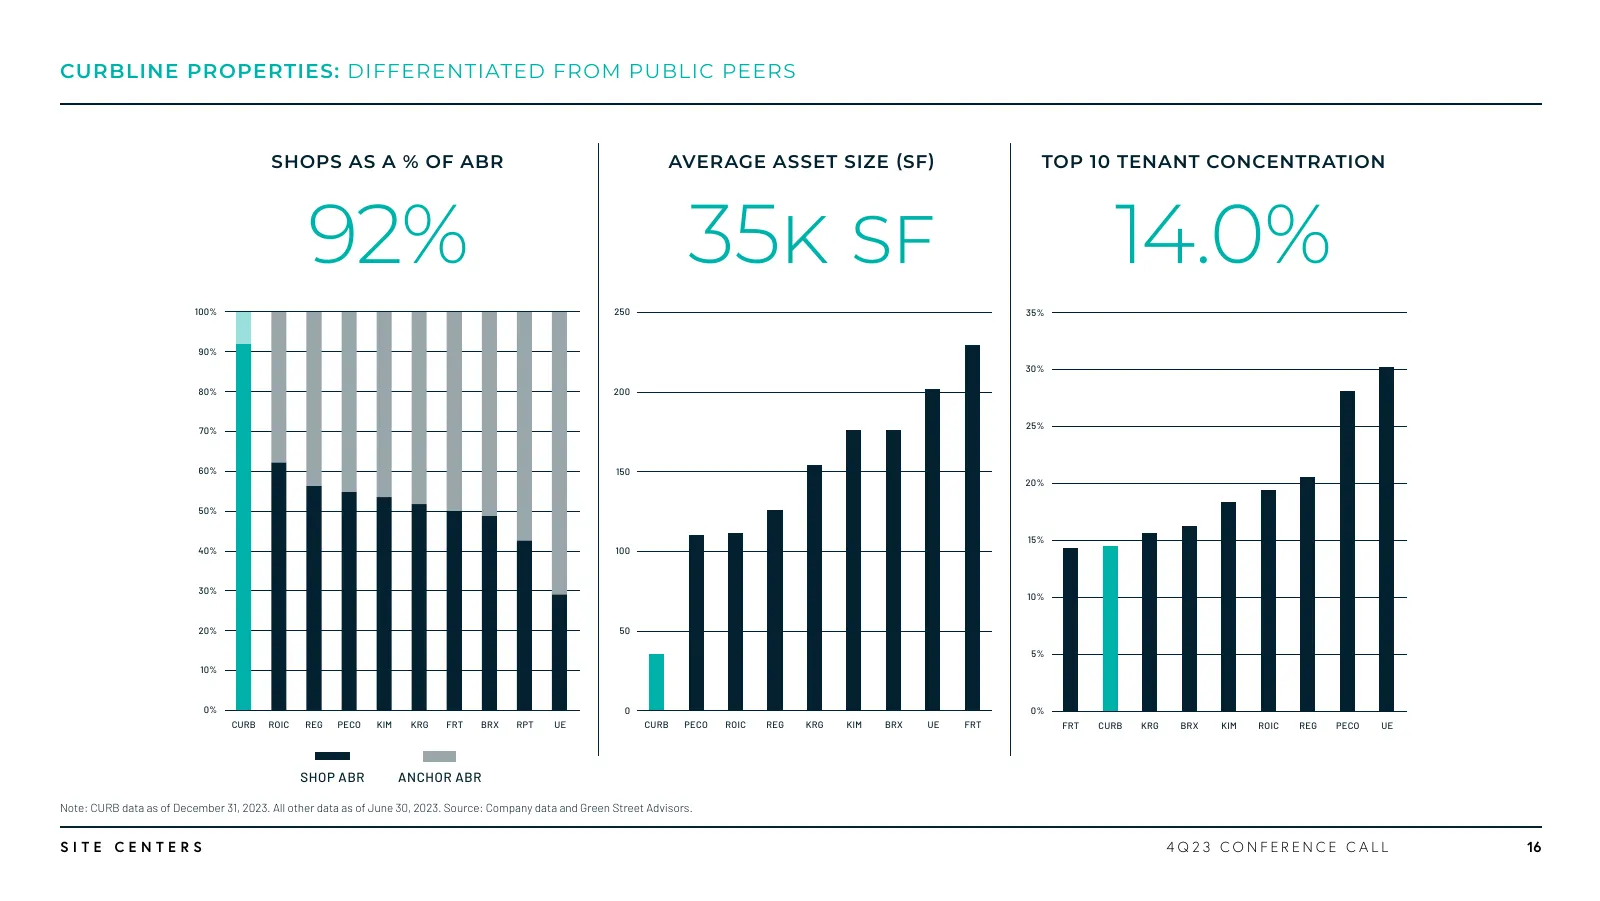
CURBLINE PROPERTIES: DIFFERENTIATED FROM PUBLIC PEERS SHOPS AS A % OF ABR AVERAGE ASSET SIZE (SF) TOP 10 TENANT CONCENTRATION 92% 35k sf 14.0% 100% 250 35% 90% 30% 80% 200 25% 70% 60% 150 20% 50% 15% 40% 100 30% 10% 20% 50 5% 10% 0% 0 0% CURB ROIC REG PECO KIM KRG FRT BRX RPT UE CURB PECO ROIC REG K
Slide 17: Curbline Properties: Diversified Geographic Exposure
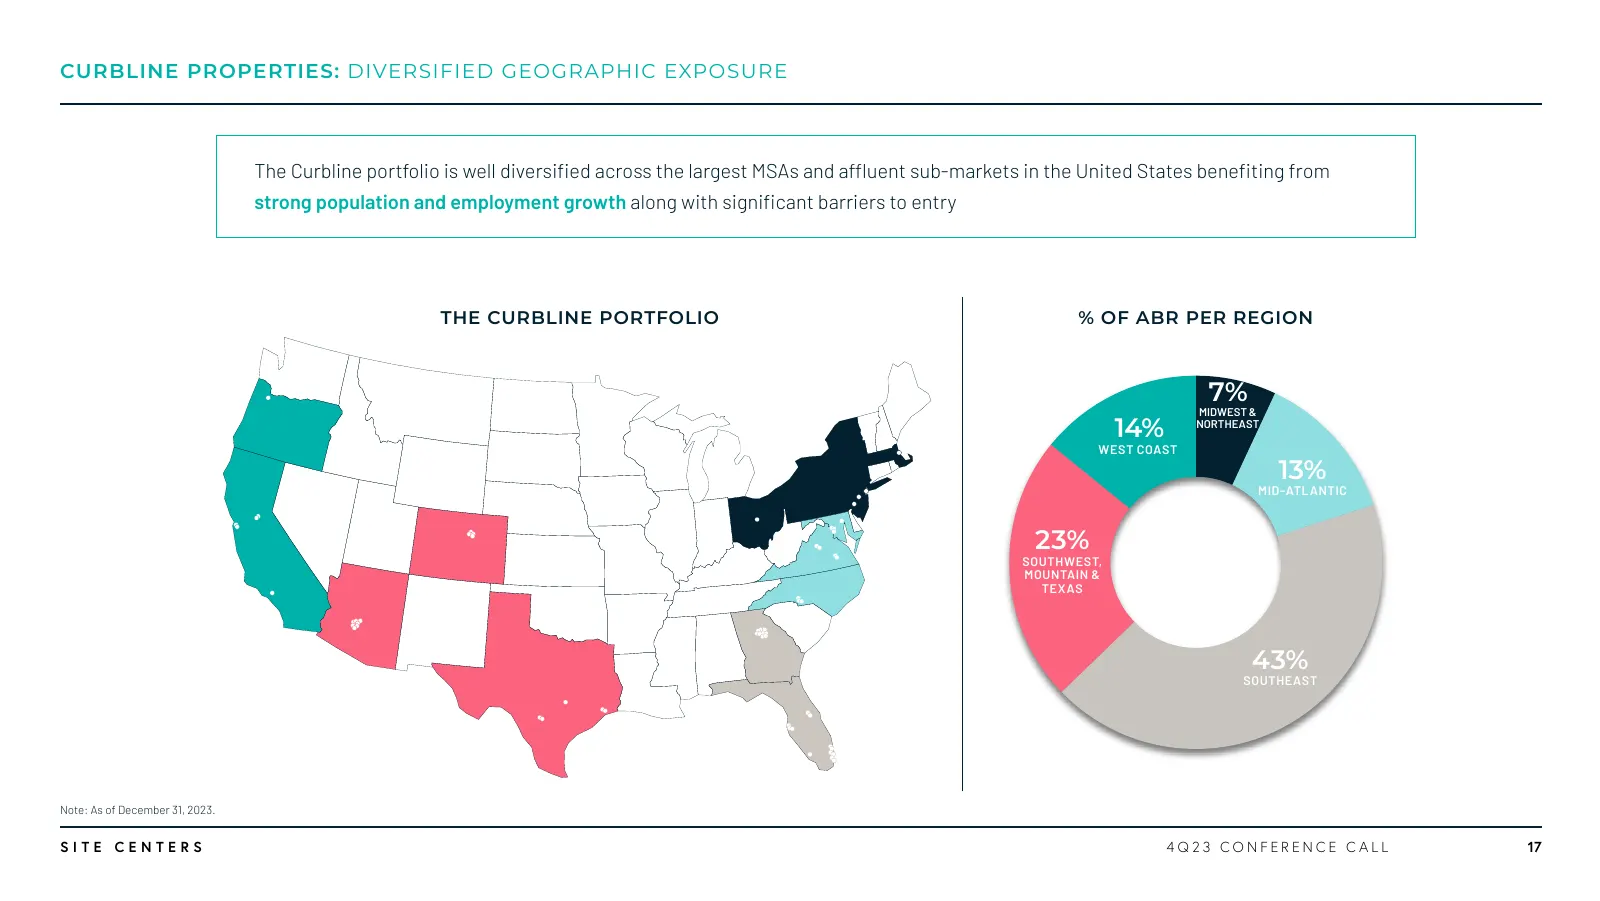
CURBLINE PROPERTIES: DIVERSIFIED GEOGRAPHIC EXPOSURE The Curbline portfolio is well diversified across the largest MSAs and affluent sub-markets in the United States benefiting from strong population and employment growth along with significant barriers to entry THE CURBLINE PORTFOLIO % OF ABR PER R
Slide 18: Curbline Properties: Key Convenience Sector Attributes
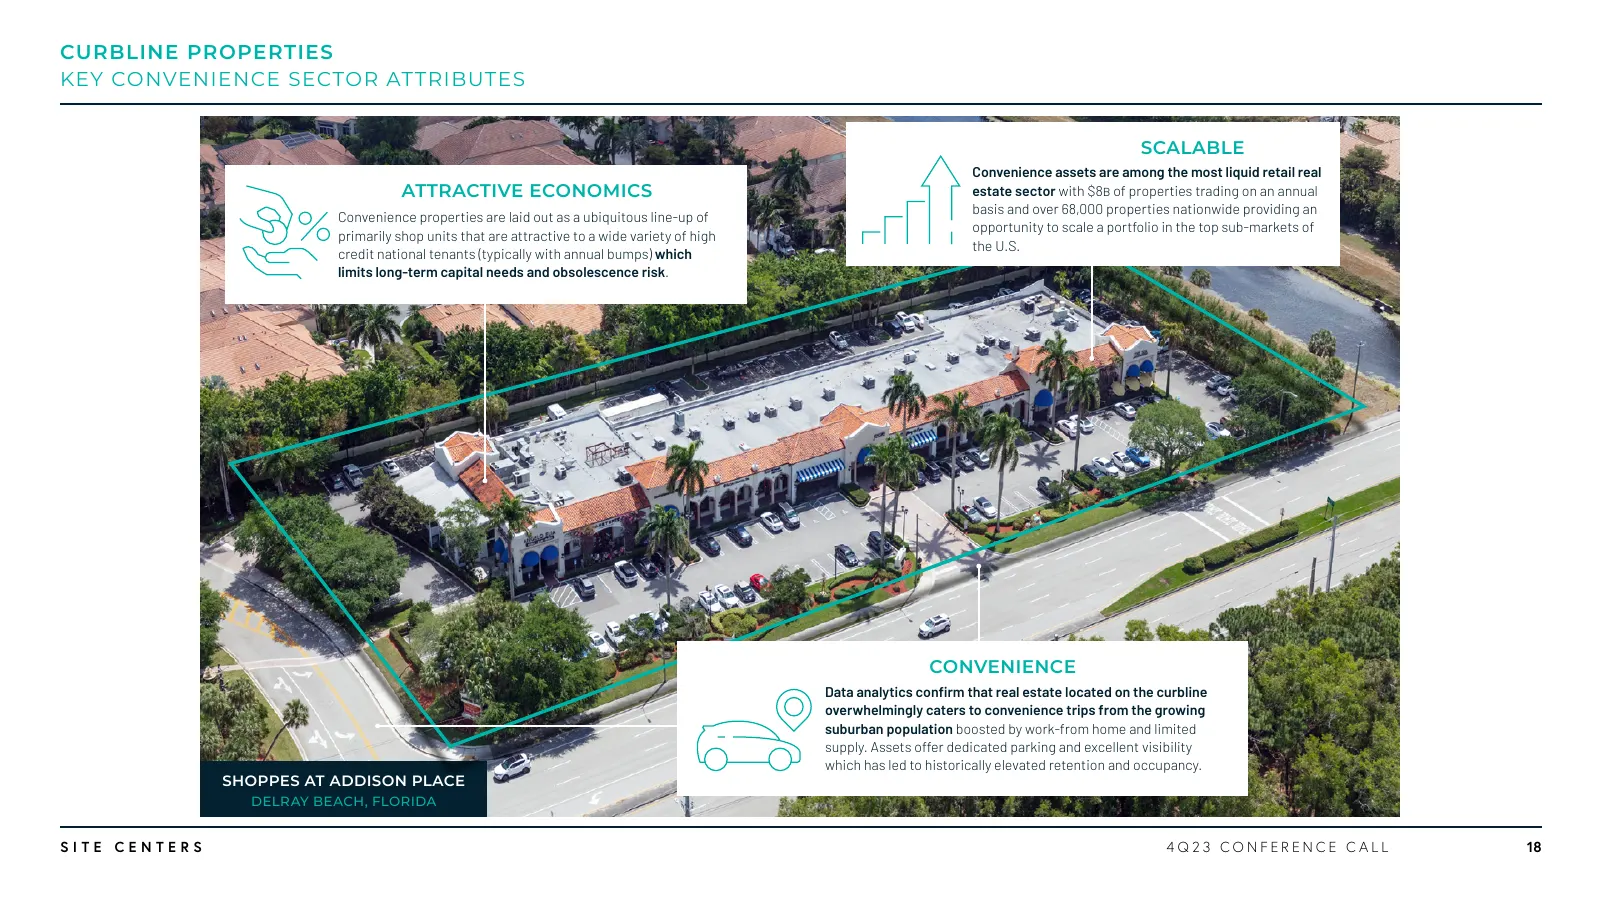
CURBLINE PROPERTIES KEY CONVENIENCE SECTOR ATTRIBUTES SCALABLE Convenience assets are among the most liquid retail real ATTRACTIVE ECONOMICS estate sector with $8b of properties trading on an annual basis and over 68,000 properties nationwide providing an Convenience properties are laid out as a ubi
Slide 19: Convenience: Excellent Access, Visibility and Dedicated Parking
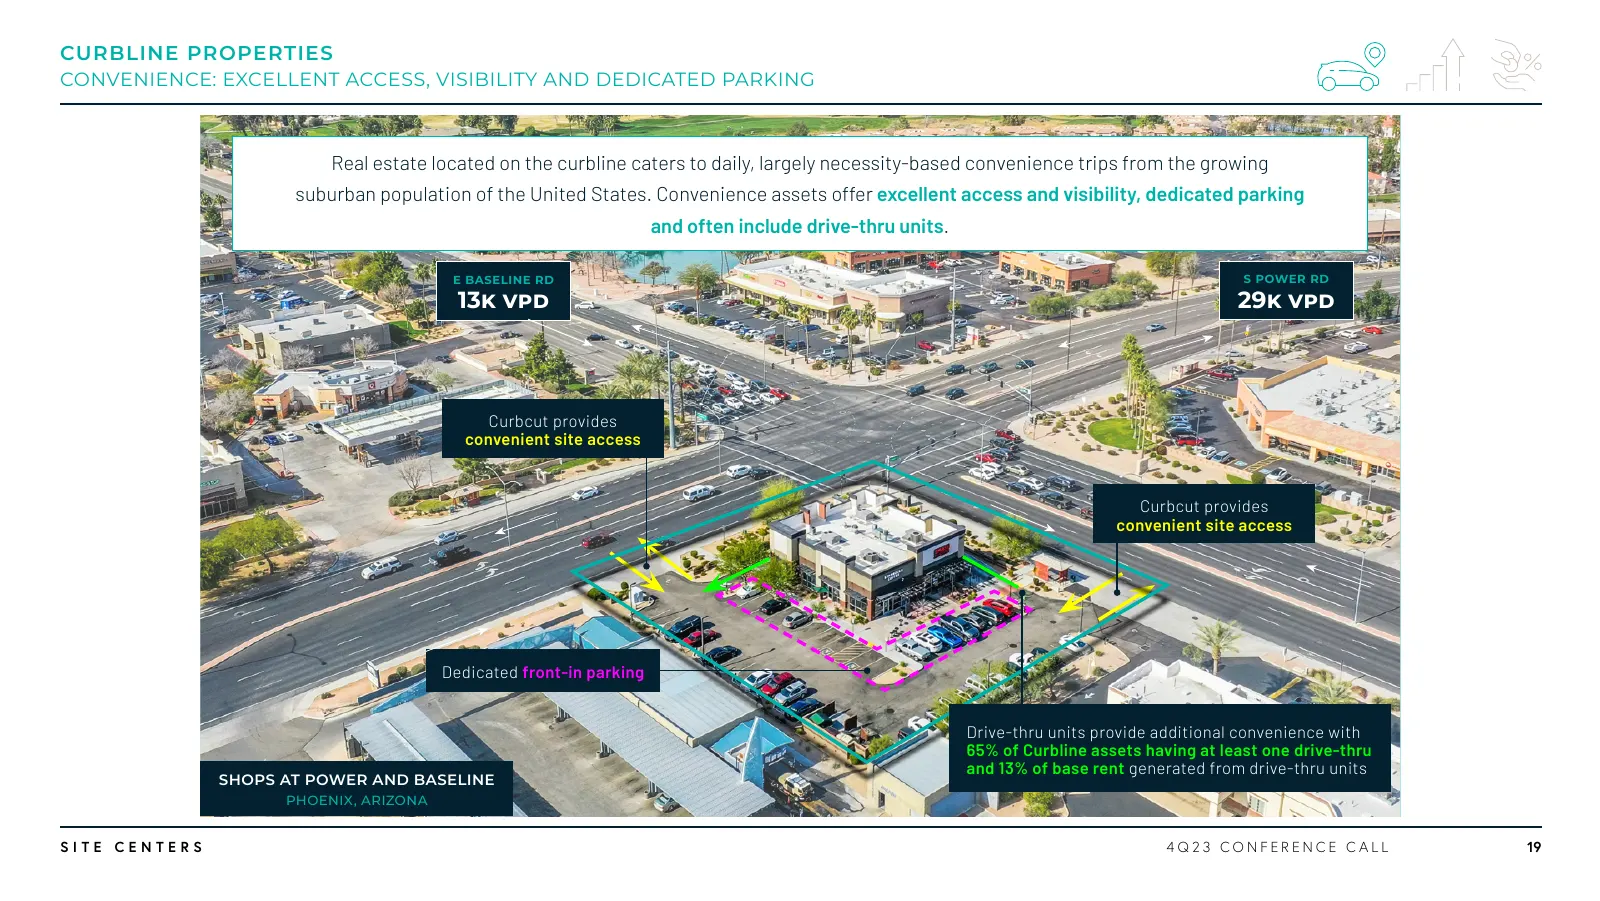
CURBLINE PROPERTIES CONVENIENCE: EXCELLENT ACCESS, VISIBILITY AND DEDICATED PARKING Real estate located on the curbline caters to daily, largely necessity-based convenience trips from the growing suburban population of the United States. Convenience assets offer excellent access and visibility, dedi
Slide 20: Scalable Investment: Curbline Growth Opportunity
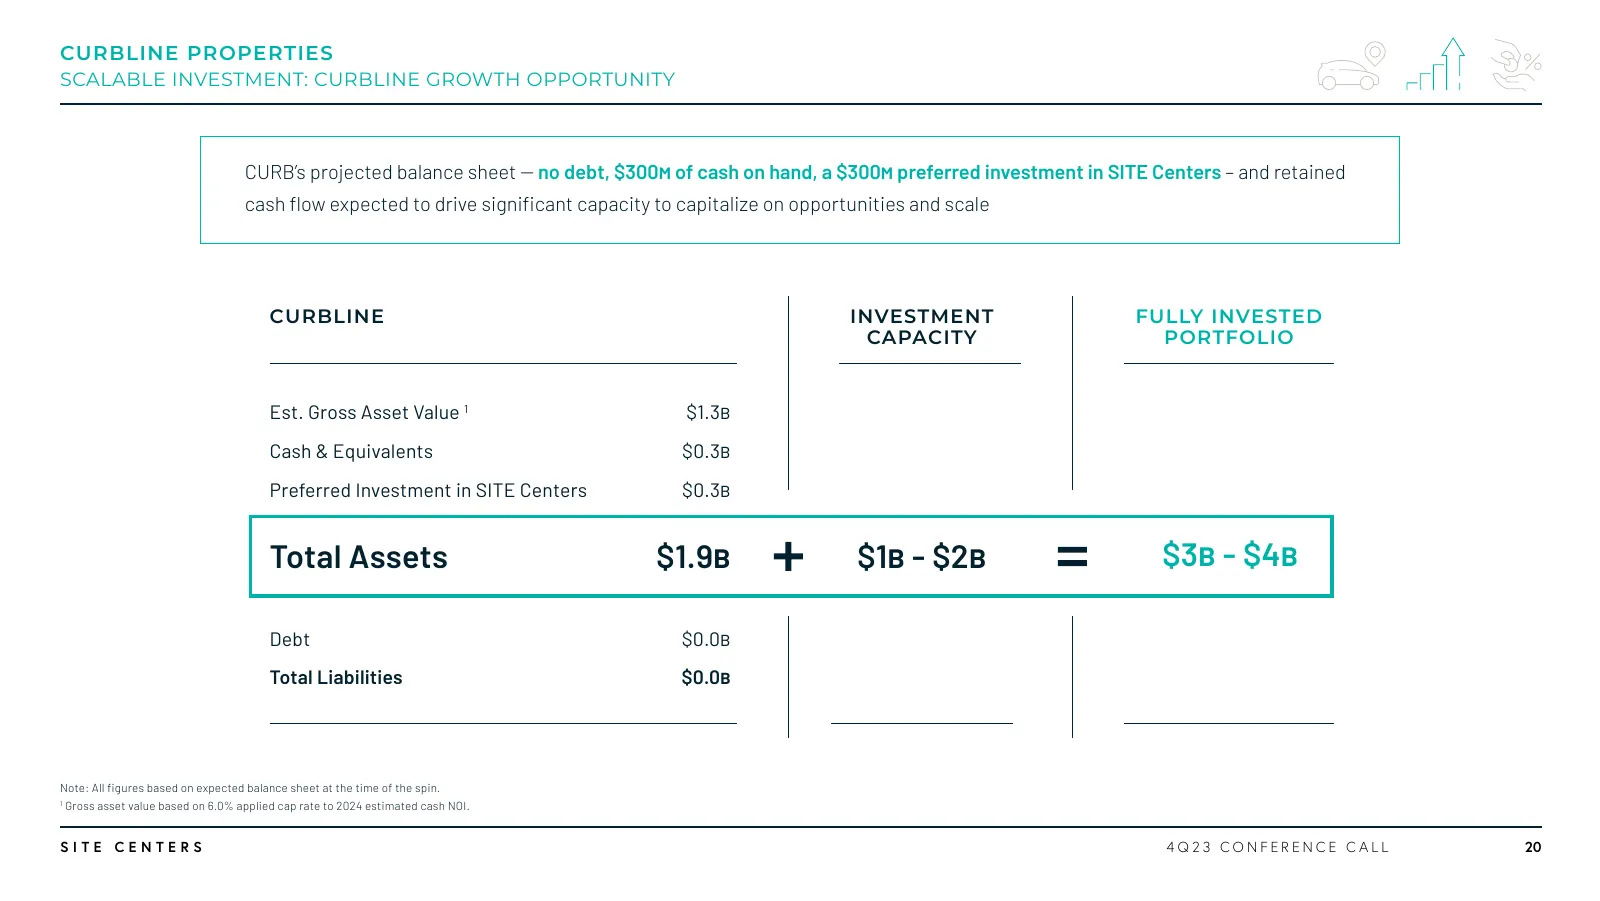
CURBLINE PROPERTIES SCALABLE INVESTMENT: CURBLINE GROWTH OPPORTUNITY CURB’s projected balance sheet -- no debt, $300m of cash on hand, a $300m preferred investment in SITE Centers – and retained cash flow expected to drive significant capacity to capitalize on opportunities and scale CURBLINE INVEST
Slide 21: Attractive Economics: Diversified National Tenant Exposure
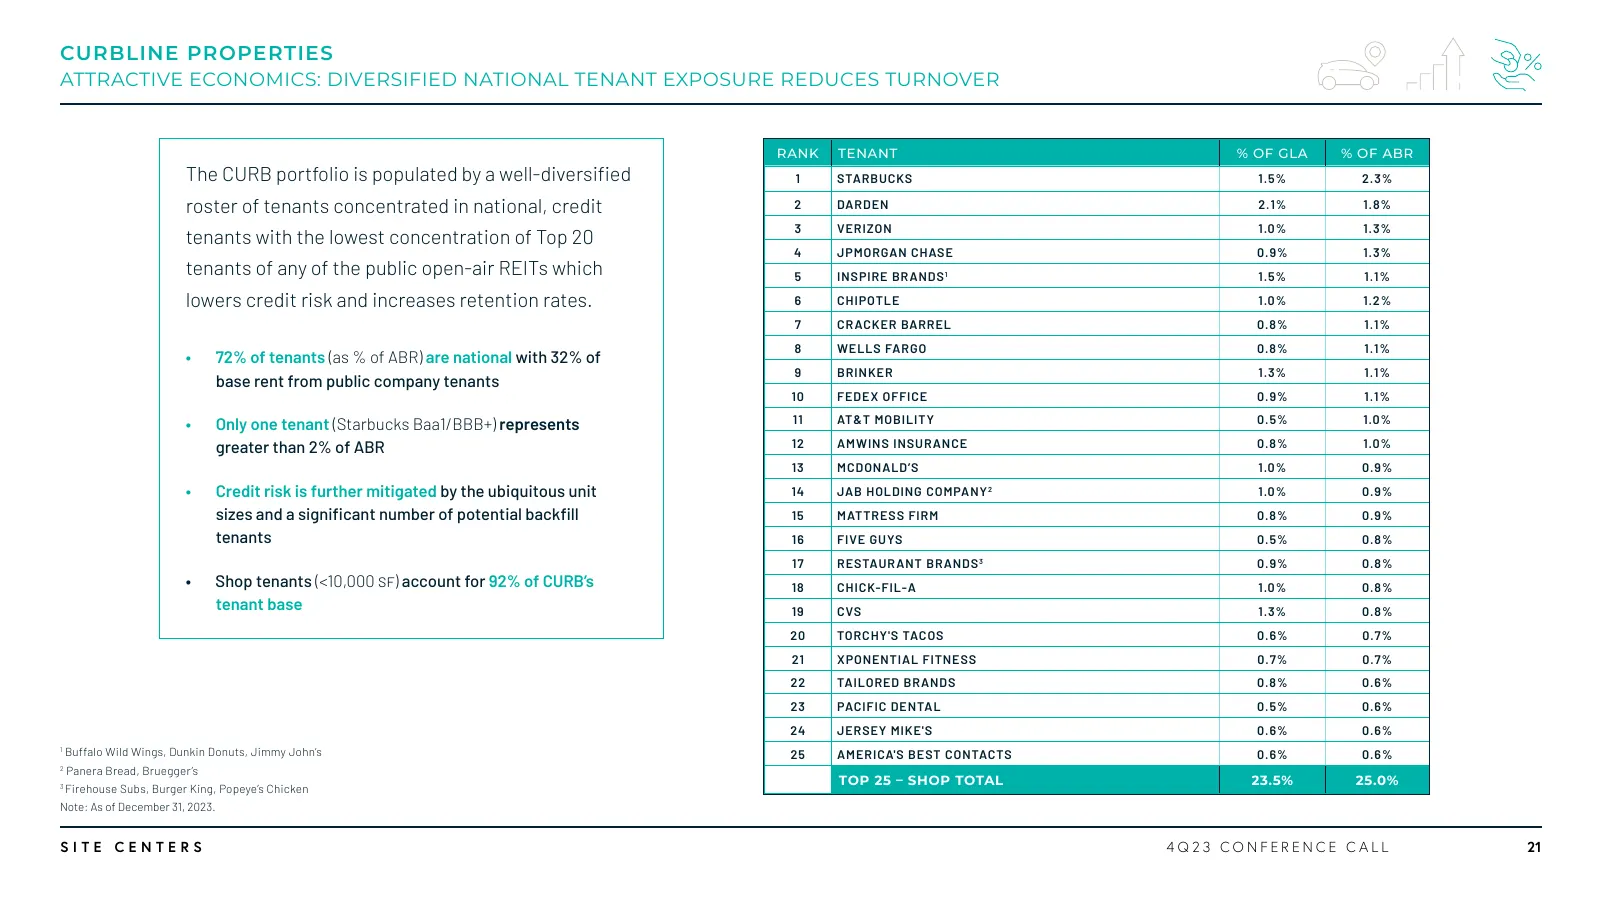
CURBLINE PROPERTIES ATTRACTIVE ECONOMICS: DIVERSIFIED NATIONAL TENANT EXPOSURE REDUCES TURNOVER RANK TENANT % OF GLA % OF ABR The CURB portfolio is populated by a well-diversified 1 STARBUCKS 1.5% 2.3% roster of tenants concentrated in national, credit 2 DARDEN 2.1% 1.8% 3 VERIZON 1.0% 1.3% tenants

Slide 22: Appendix
Appendix SITE CENTERS 4Q23 CONFERENCE CALL 22
Slide 23: Non-GAAP Financial Measures and Other Operational Metrics – Definitions
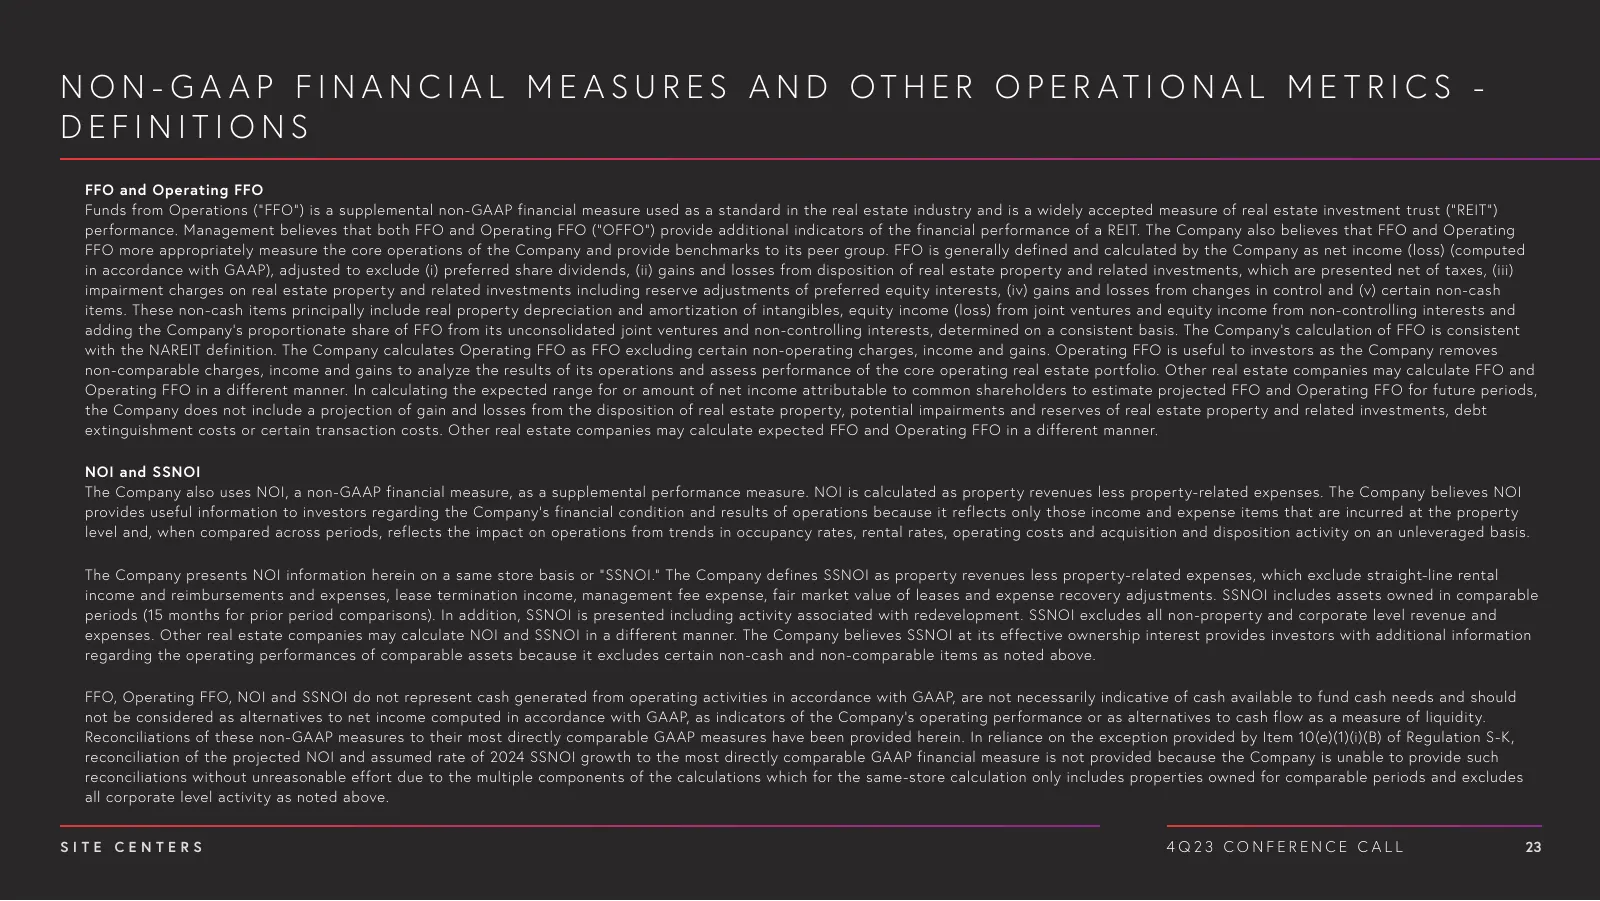
N O N - G A A P F I N A N C I A L M E A S U R E S A N D OT H E R O P E R AT I O N A L M E T R I C S - DEFINITIONS FFO and Operating FFO Funds from Operations (“FFO”) is a supplemental non-GAAP financial measure used as a standard in the real estate industry and is a widely accepted measure of real e
Slide 24: Non-GAAP Financial Measures – Definitions Continued
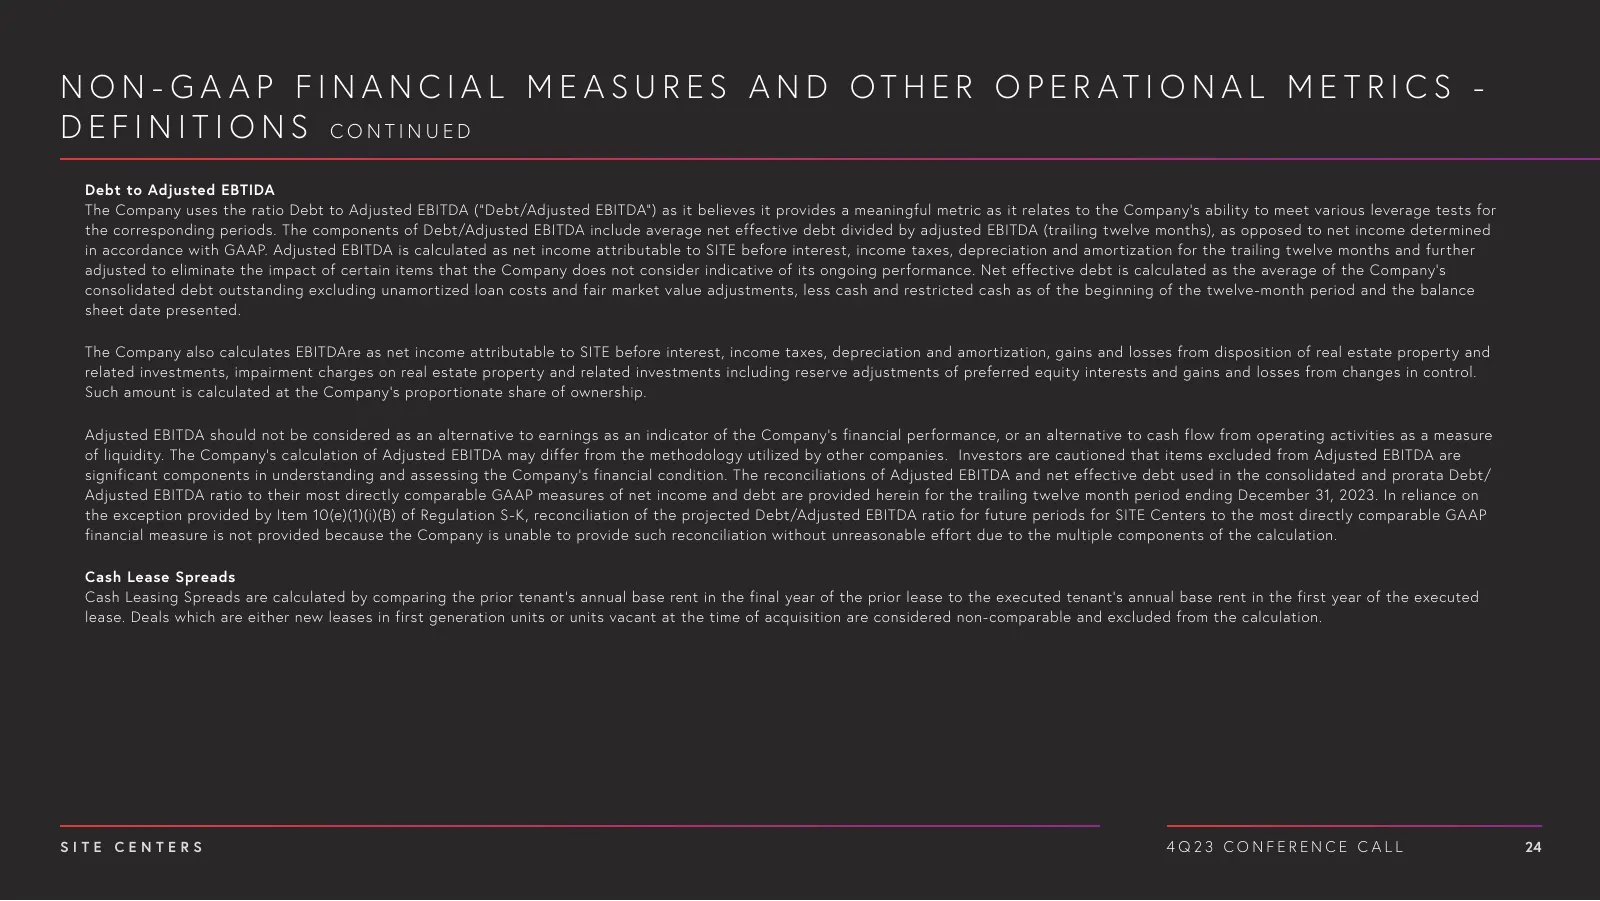
N O N - G A A P F I N A N C I A L M E A S U R E S A N D OT H E R O P E R AT I O N A L M E T R I C S - D E F I N I T I O N S CONTINUED Debt to Adjusted EBTIDA The Company uses the ratio Debt to Adjusted EBITDA (“Debt/Adjusted EBITDA”) as it believes it provides a meaningful metric as it relates to th
Slide 25: Reconciliation: Net Income to FFO and Operating FFO
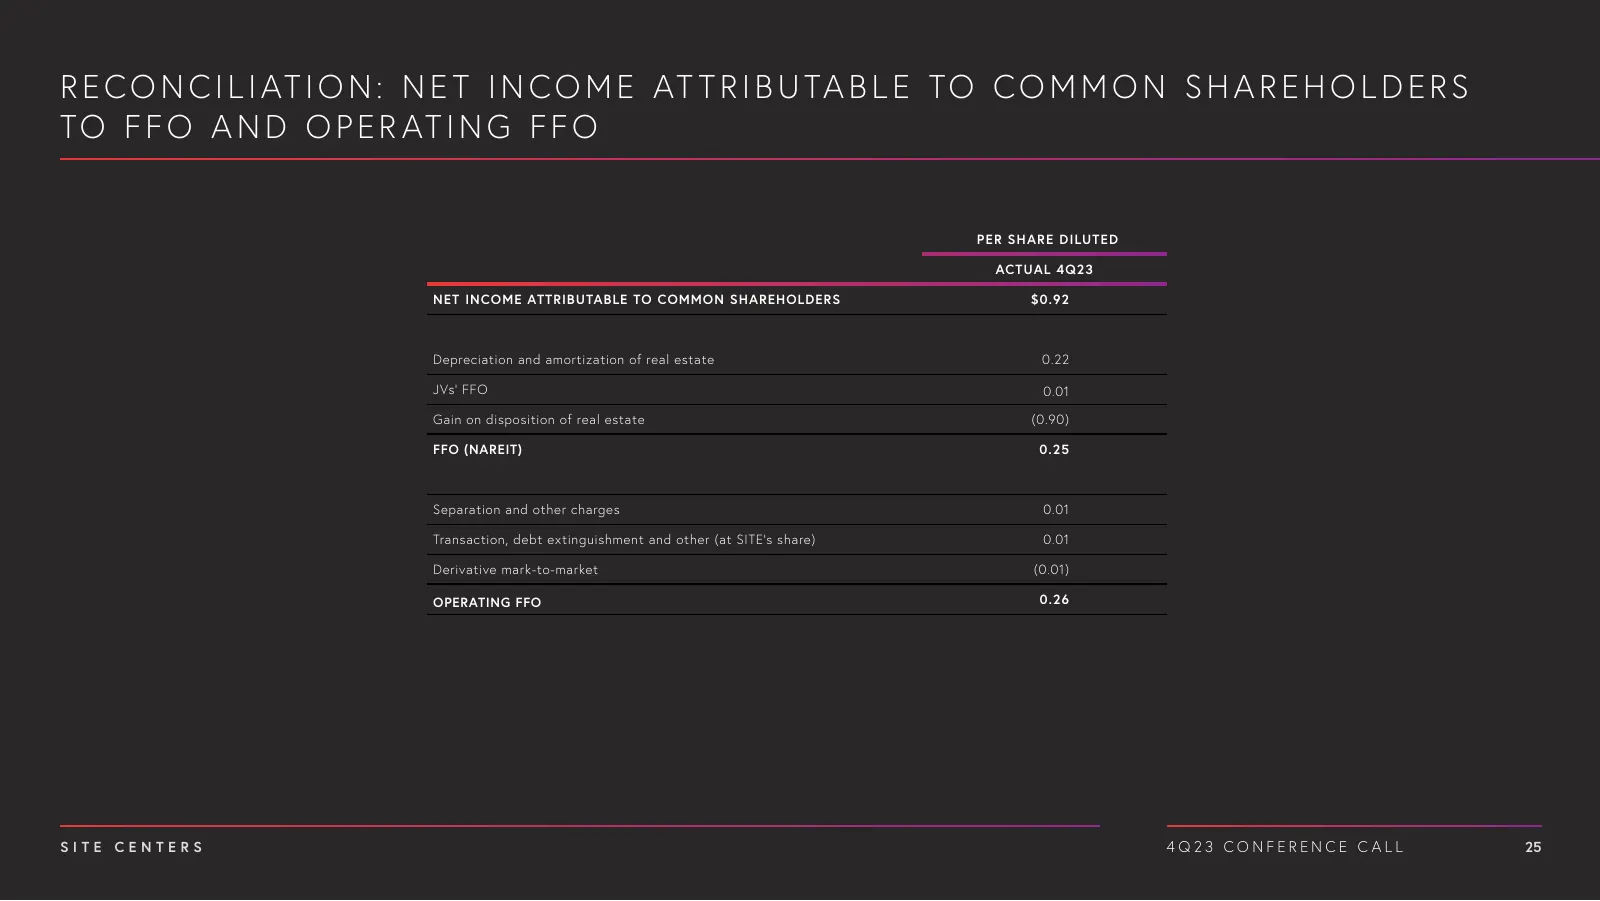
R E C O N C I L I AT I O N : N E T I N C O M E AT T R I B U TA B L E TO C O M M O N S H A R E H O L D E R S TO F F O A N D O P E R AT I N G F F O PER SHARE DILUTED ACTUAL 4Q23 NET INCOME ATTRIBUTABLE TO COMMON SHAREHOLDERS $0.92 Depreciation and amortization of real estate 0.22 JVs' FFO 0.01 Gain on
Slide 26: Reconciliation: Net Income to Same Store NOI
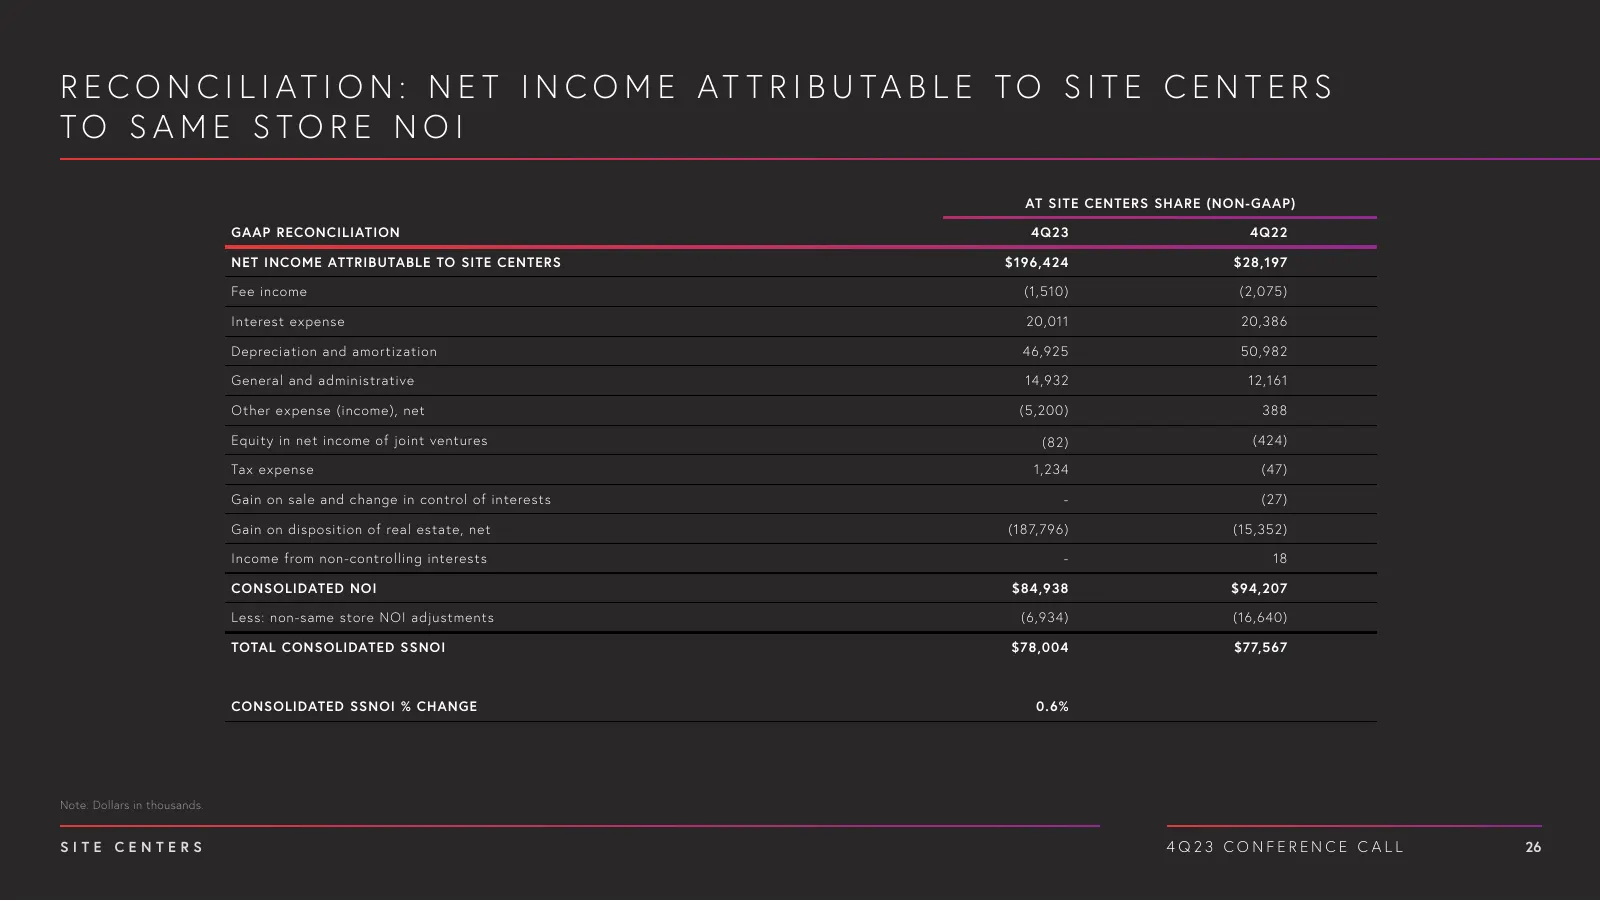
R E C O N C I L I AT I O N : N E T I N C O M E AT T R I B U TA B L E TO S I T E C E N T E R S TO SAM E STO RE N OI AT SITE CENTERS SHARE (NON-GAAP) GAAP RECONCILIATION 4Q23 4Q22 NET INCOME ATTRIBUTABLE TO SITE CENTERS $196,424 $28,197 Fee income (1,510) (2,075) Interest expense 20,011 20,386 Depreci
Slide 27: Reconciliation: Net Income to Same Store NOI Continued
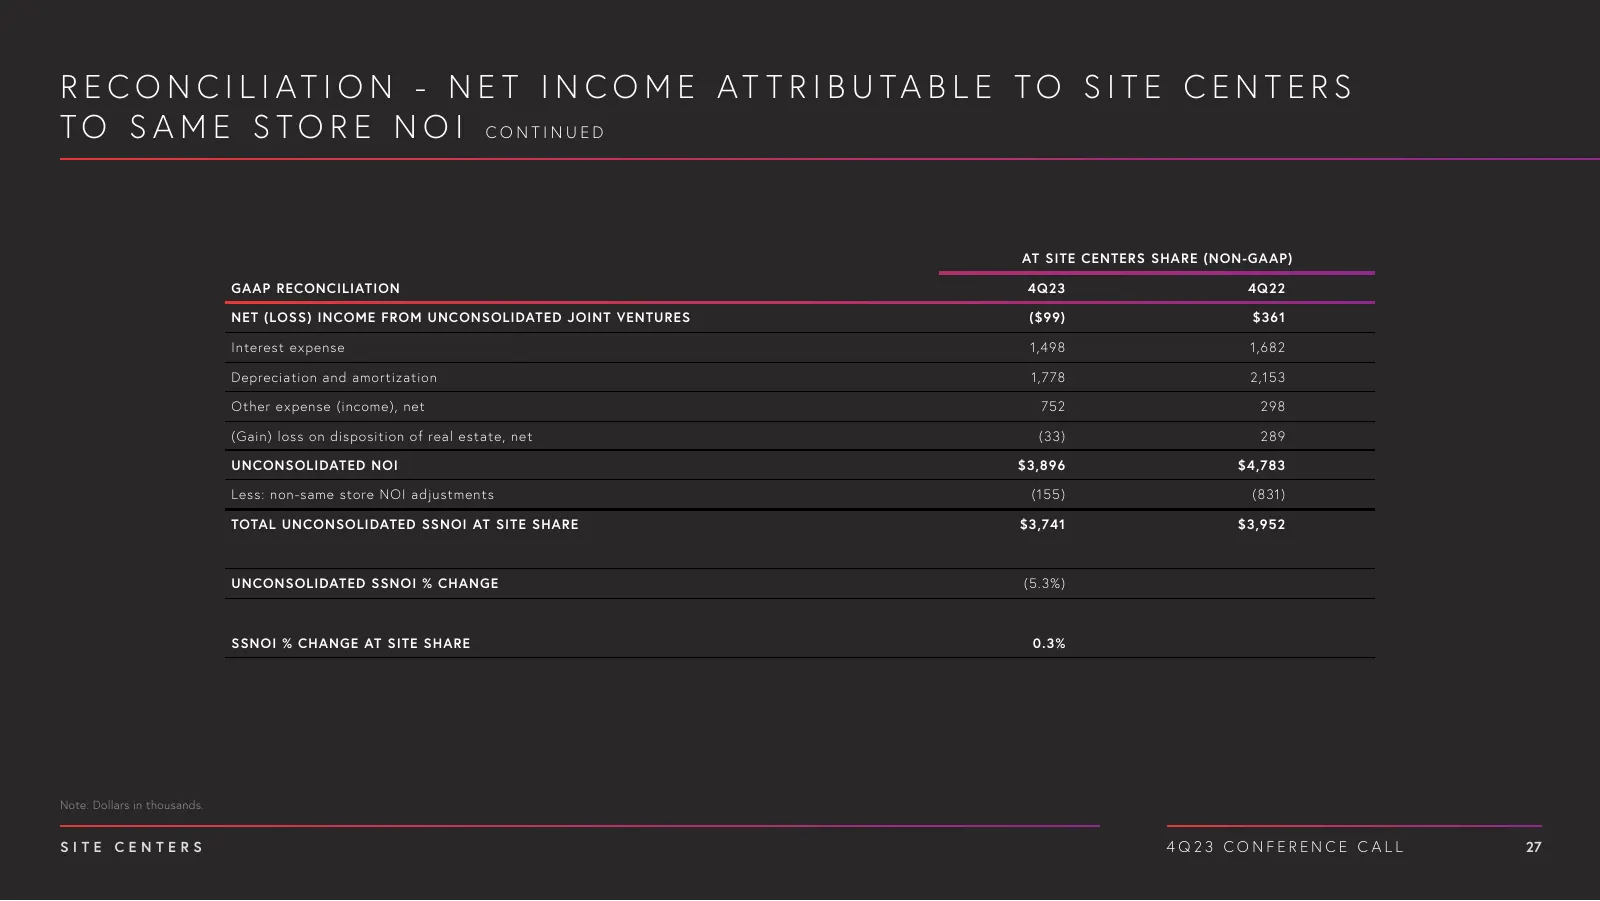
R E C O N C I L I AT I O N - N E T I N C O M E AT T R I B U TA B L E TO S I T E C E N T E R S T O S A M E S T O R E N O I CONTINUED AT SITE CENTERS SHARE (NON-GAAP) GAAP RECONCILIATION 4Q23 4Q22 NET (LOSS) INCOME FROM UNCONSOLIDATED JOINT VENTURES ($99) $361 Interest expense 1,498 1,682 Depreciation
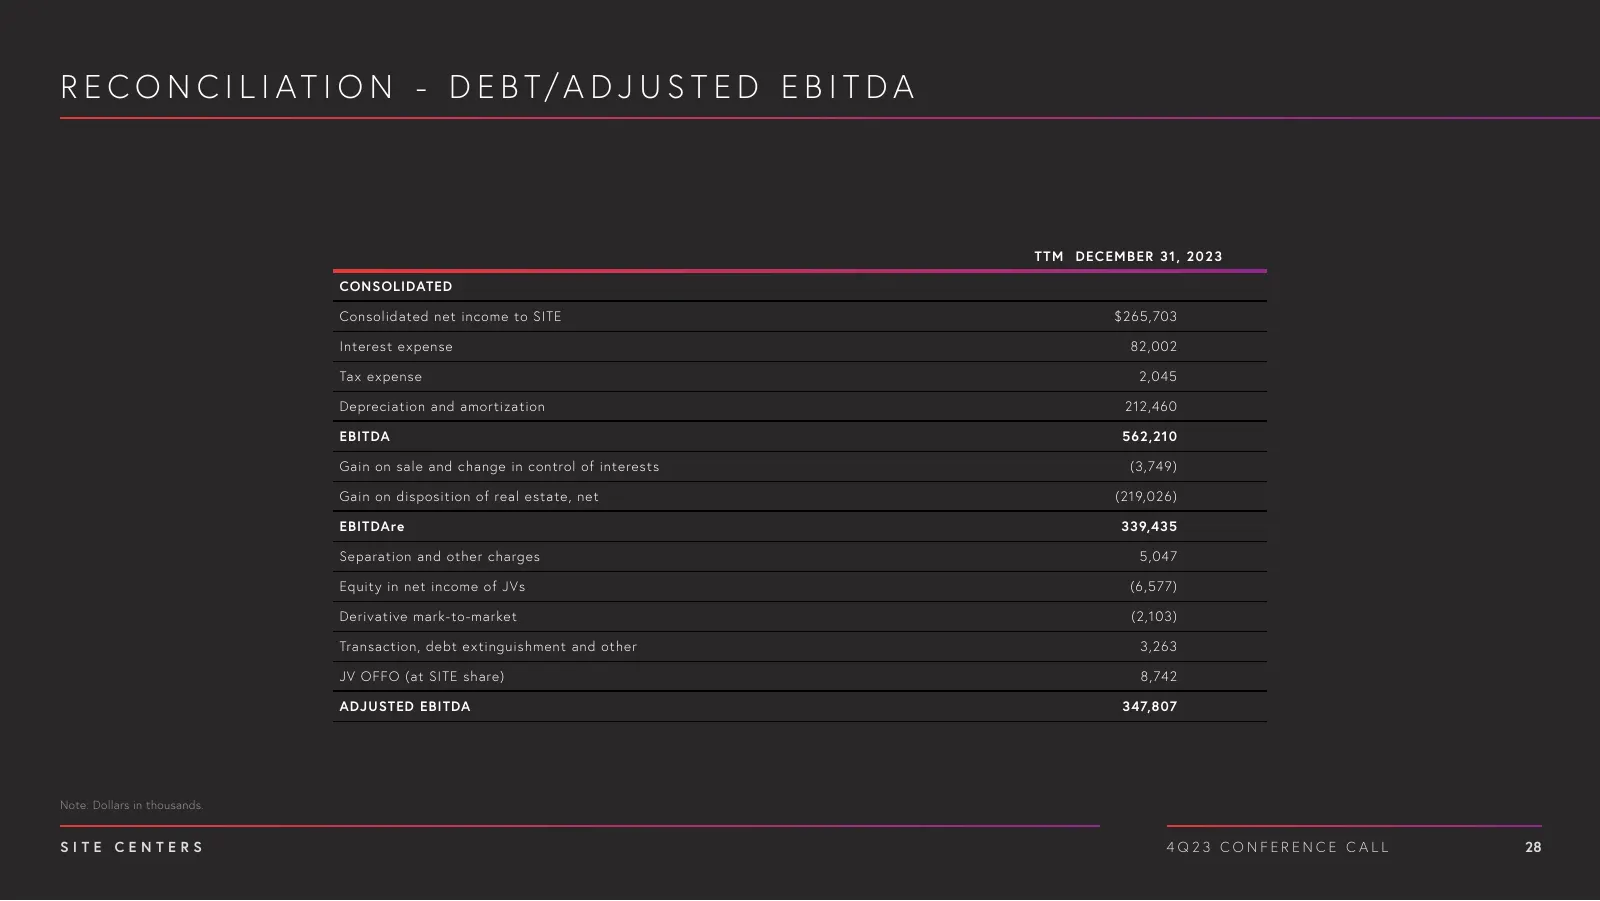
Slide 28: Reconciliation: Debt/Adjusted EBITDA
R E C O N C I L I A T I O N - D E B T/ A D J U S T E D E B I T D A T T M DEC EM B ER 3 1, 20 23 CONSOLIDATED Consolidated net income to SITE $265,703 Interest expense 82,002 Tax expense 2,045 Depreciation and amortization 212,460 EBITDA 562,210 Gain on sale and change in control of interests (3,749)
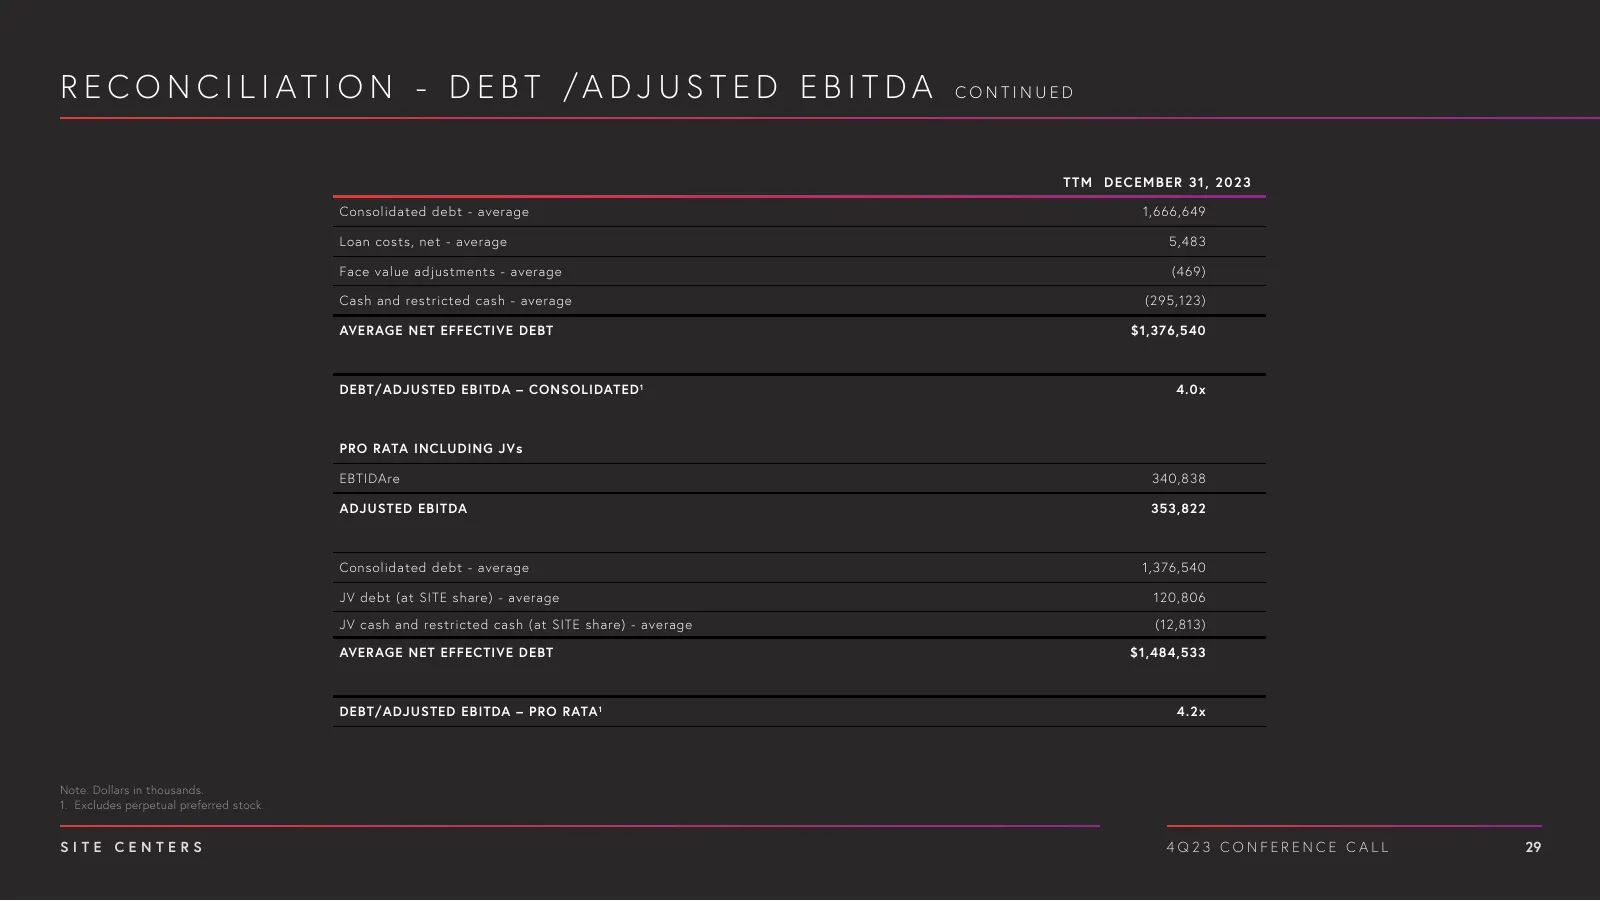
Slide 29: Reconciliation: Debt/Adjusted EBITDA Continued
R E C O N C I L I A T I O N - D E B T /A D J U S T E D E B I T D A CONTINUED T T M DEC EM B ER 3 1, 20 23 Consolidated debt - average 1,666,649 Loan costs, net - average 5,483 Face value adjustments - average (469) Cash and restricted cash - average (295,123) AVERAGE NET EFFECTIVE DEBT $1,376,540 DE
Source: Internet Archive copy of images.sitecenters.com
More decks from SITE Centers Corp.
 Merger or Acquisition (September 2024)32 slides · Sep 17, 2024
 Q2 2024 Earnings Presentation39 slides · Jul 30, 2024
 Q1 2024 Earnings Presentation28 slides · Apr 30, 2024
 Citi Global Property CEO Conference 202442 slides · March 2024
 Merger or Acquisition (November 2023)42 slides · Nov 1, 2023
 Merger or Acquisition (October 2023)42 slides · October 2023