INX — Q3 2009 Earnings Presentation
20 slides from INX's earnings presentation, Nov 10, 2009
Slide 1: Financial Results for 3rd Quarter Ended September 30, 2009
Financial Results for 3'4 Quarter Ended September 30, 2009 Jim Long, Chairman & CEO Mark Hilz, President & COO Brian Fontana, Vice President & CFO November 10, 2009
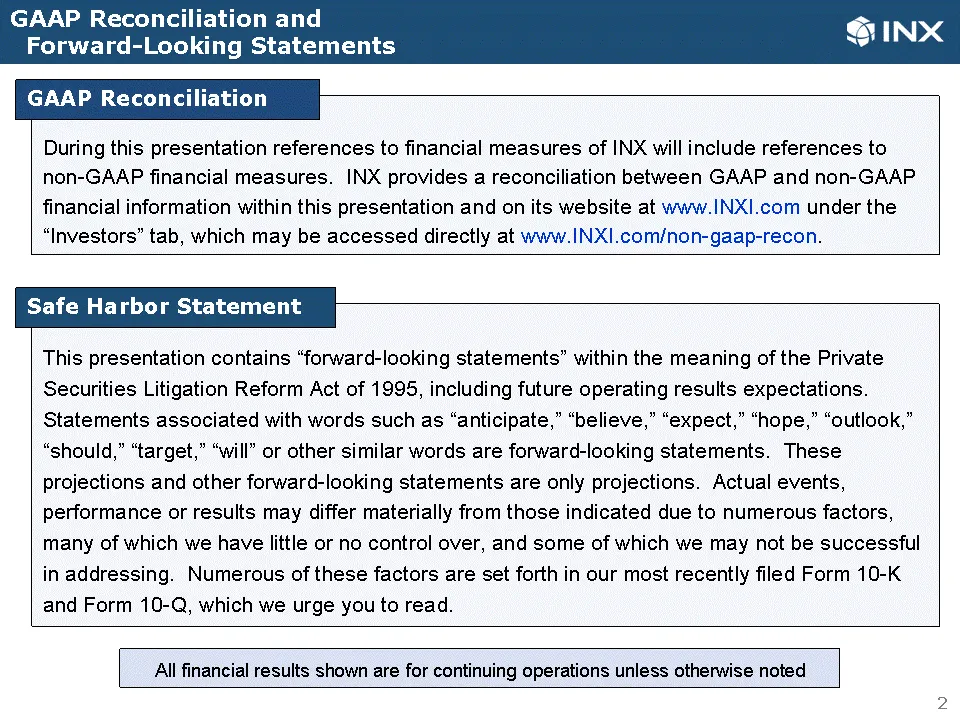
Slide 2: GAAP Reconciliation and Safe Harbor Statement
g Statements GS INX GAAP Reconciliation During this presentation references to financial measures of INX will include references to non-GAAP financial measures. INX provides a reconciliation between GAAP and non-GAAP financial information within this presentation and on its website at www.INXI.com u
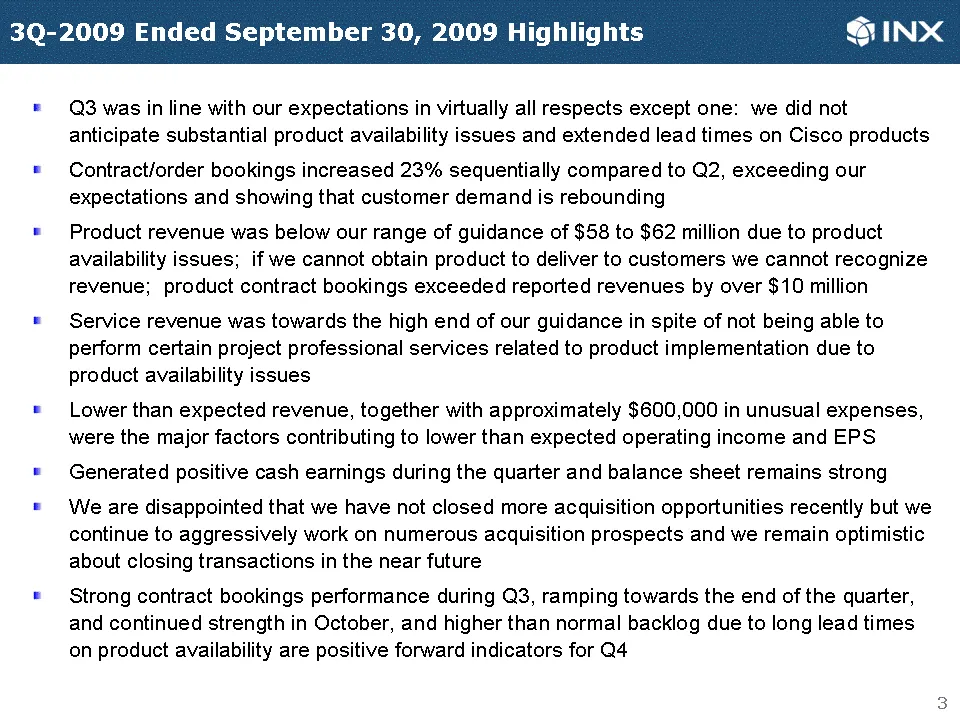
Slide 3: 3Q-2009 Highlights
3Q-2009 Ended September 30, 2009 hlights SINX = 3 was in line with our expectations in virtually all respects except one: we did not anticipate substantial product availability issues and extended lead times on Cisco products = Contract/order bookings increased 23% sequentially compared to Q2, excee
Slide 4: Third Quarter Financial Results
Third Quarter Financial Results Brian Fontana Vice President & CFO
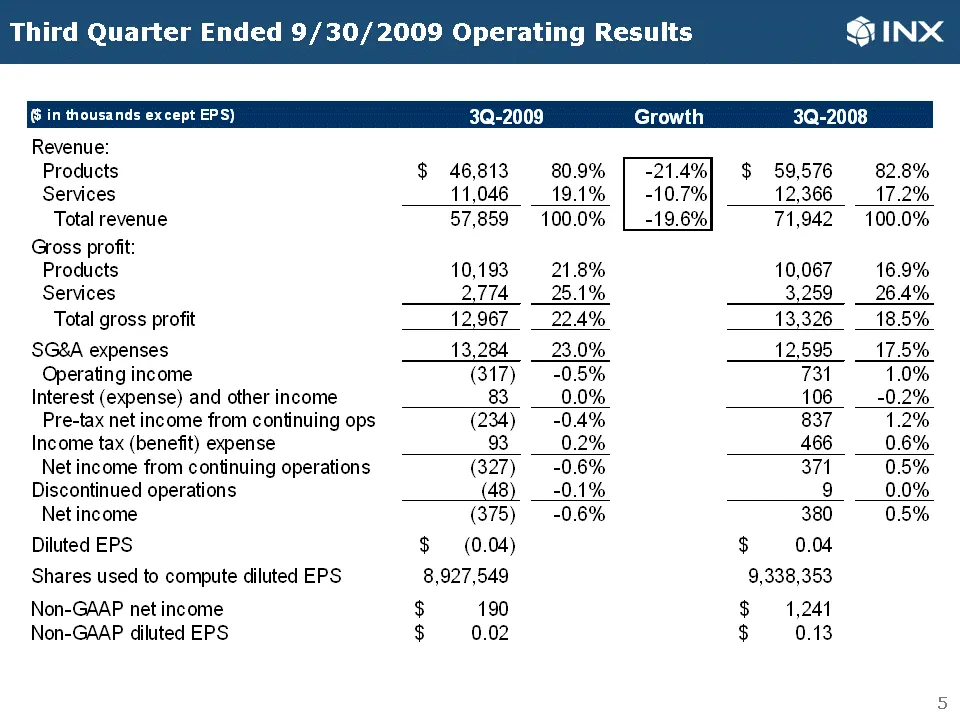
Slide 5: Third Quarter Ended 9/30/2009 Operating Results
Third Quarter Ended 9/30/2009 Opera ig Results SINX @ in thousands except EPS) 3Q-2009 Growth 3Q-2008 Revenue: Products $ 46,813 80.9% $ 59,576 82.8% Services 11,046 19.1% 12,366 17.2% Total revenue 57,859 100.0% 71,942 100.0% Goss profit: Products 10,193 21.8% 10,067 16.9% Services 2,774 25.1% 3,25
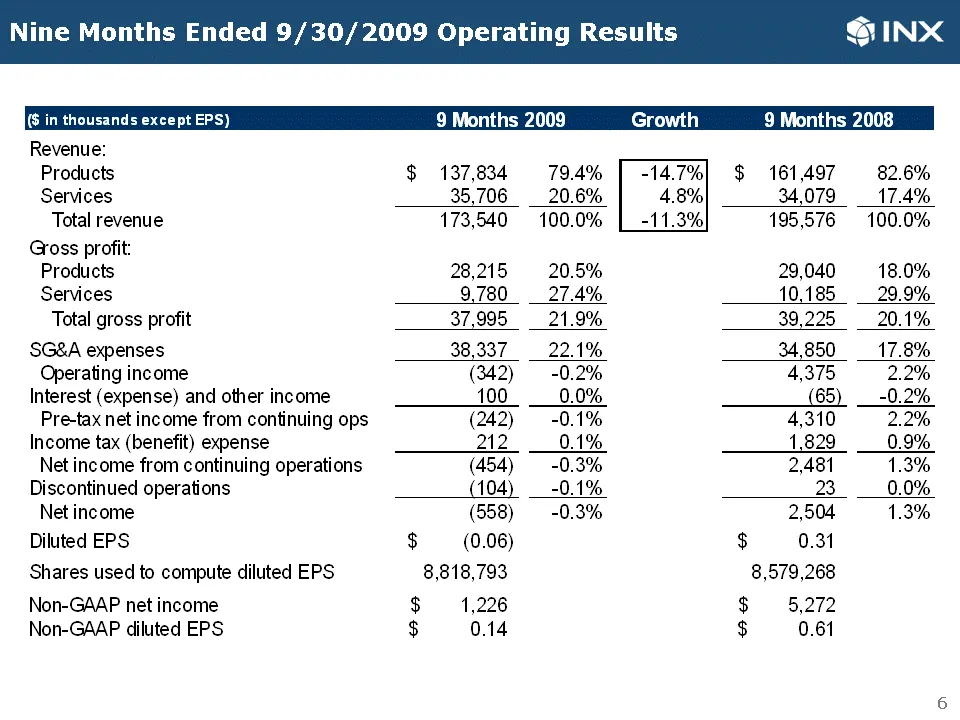
Slide 6: Nine Months Ended 9/30/2009 Operating Results
ig Results SINX Nine Months Ended 9/30/2009 Opera ($ in thousands except EPS) 9 Months 2009 9 Months 2008 Revenue: Products $ 137,834 79.4% $ 161,497 82.6% Services 35,706 20.6% 34,079 17.4% Total revenue 173,540 100.0% 195,576 100.0% Goss profit: Products 28,215 20.5% 29,040 18.0% Services 9.780 27
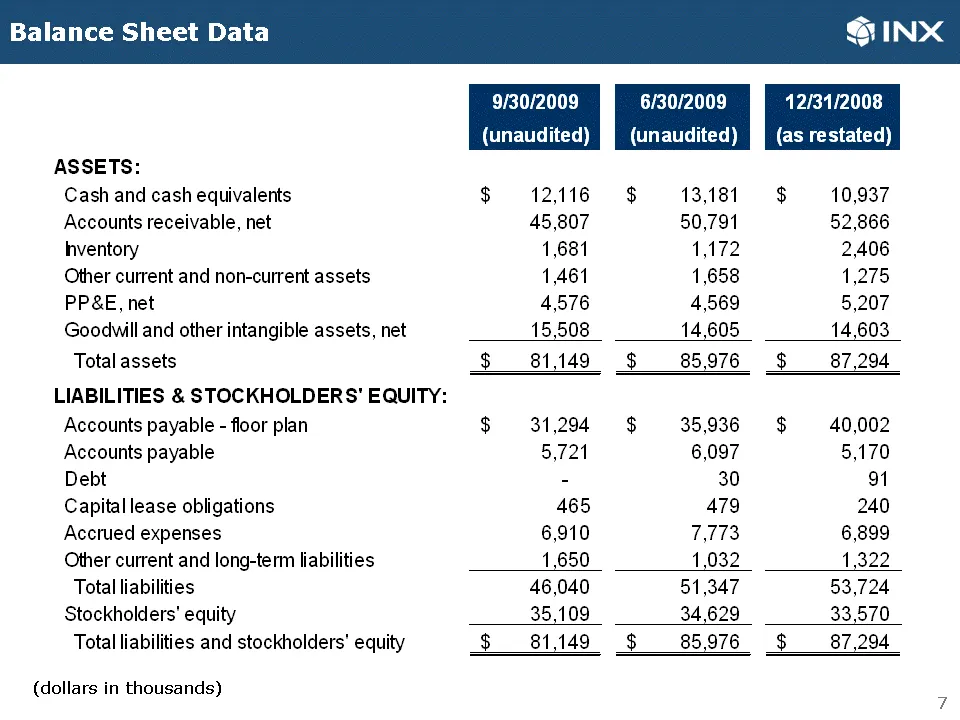
Slide 7: Balance Sheet Data
Balance Sheet Data ASSETS: Cash and cash equivalents Accounts receivable, net hnventory Other current and non-current assets PP&E, net Goodwill and other intangible assets, net Total assets LIABILITIES & STOCKHOLDERS’ EQUITY: Accounts payable - floor plan Accounts payable Debt Capital lease obligati
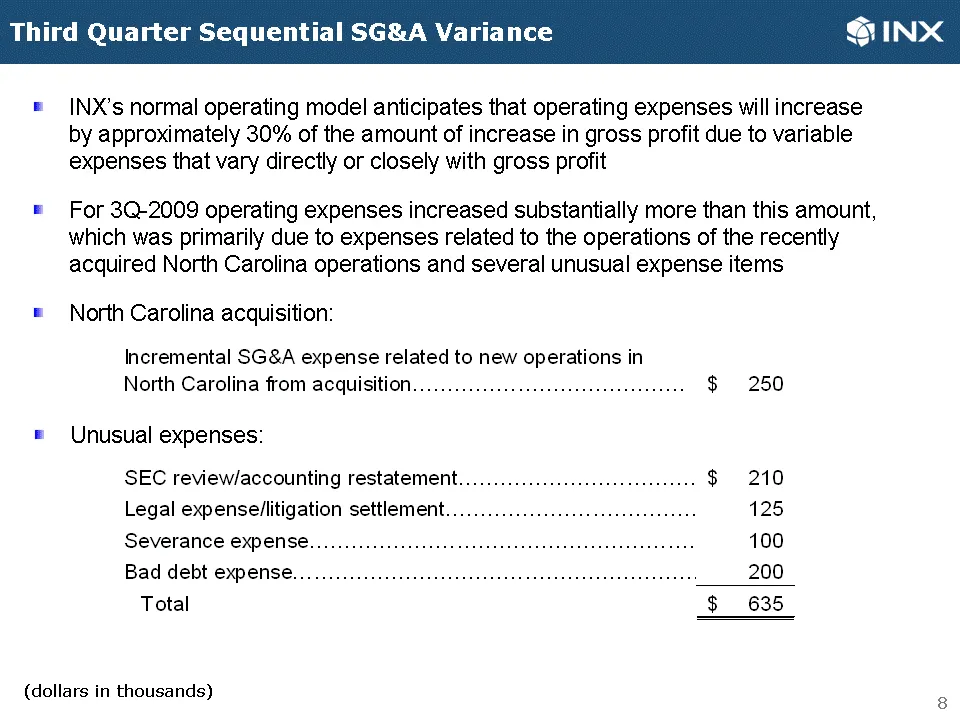
Slide 8: Third Quarter Sequential SG&A Variance
Third Quarter Sequential SG&A Variance @INX = |INX’s normal operating model anticipates that operating expenses will increase by approximately 30% of the amount of increase in gross profit due to variable expenses that vary directly or closely with gross profit = For 3Q-2009 operating expenses incre
Slide 9: Cash Generated From Income Statement
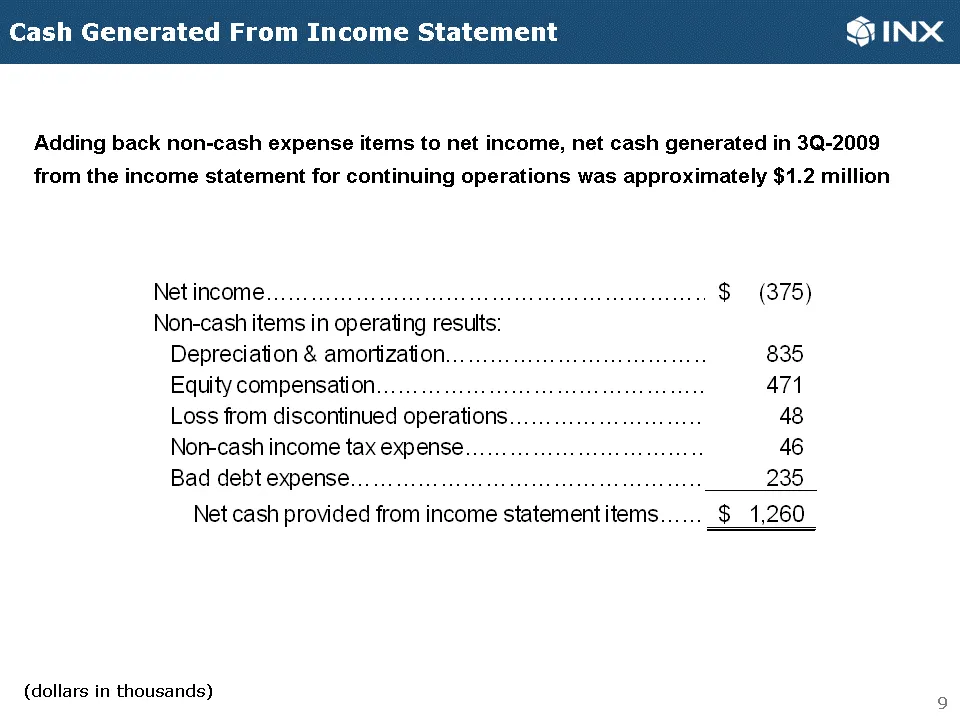
Cash Generated From Income Statement GINX Adding back non-cash expense items to net income, net cash generated in 3Q-2009 from the income statement for continuing operations was approximately $1.2 million Net income... eee cee cece cece cee ceeeeeceeee tee seetee sents $ (375) Non-cash items in oper
Slide 10: Accounts Receivable
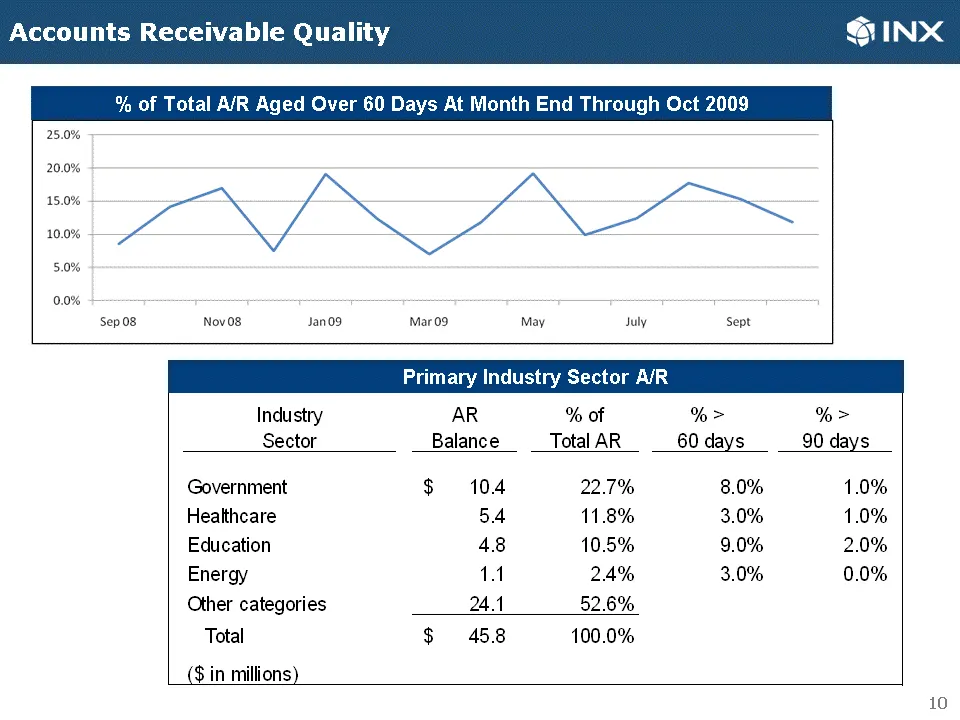
Accounts Rec GINX % of Total A/R Aged Over 60 Days At Month End Through Oct 2009 Sep 08 Novos Jan09 ‘Mar 09 May July Sept Primary Industry Sector A/R Industry AR % of % > %> Sector Balance Total AR 60 days 90 days Government $ 104 22.7% 8.0% 1.0% Healthcare 5.4 11.8% 3.0% 1.0% Education 48 10.5% 9.0
Slide 11: Update On Industry Trends & INX Operations
Update On Industry Trends & INX Operations Mark Hilz President & COO
Slide 12: INX is focused in three interrelated and synergistic areas of technology
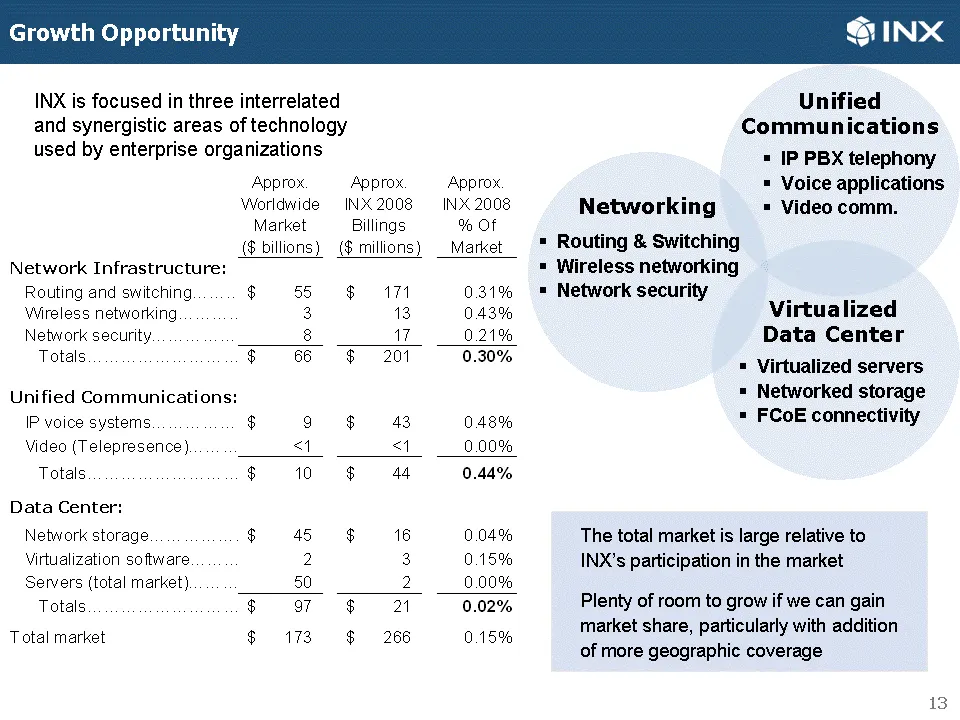
INX is focused in three interrelated and synergistic areas of technology used by enterprise organizations Approx. Approx. Approx. Worldwide INX2008 — INX 2008 Market Billings % OF ($ billions) ($ millions) _ Market, Network Infrastructure: Routing and switching $ 55 $ 4171 0.31% Wireless networking
Slide 13: Product availability, opportunities and acquisitions
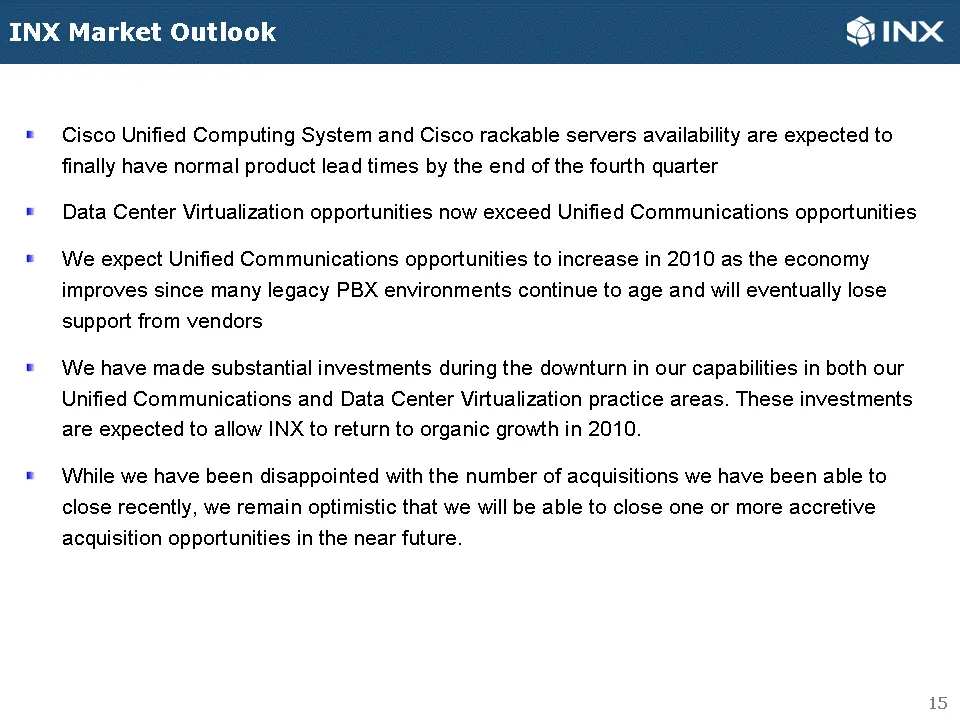
GINX Cisco Unified Computing System and Cisco rackable servers availability are expected to finally have normal product lead times by the end of the fourth quarter Data Center Virtualization opportunities now exceed Unified Communications opportunities We expect Unified Communications opportunities
Slide 14: Outlook & Q&A
G INX Outlook & Q&A Jim Long Chairman & CEO
Slide 15: Outlook - Product Contract Order Bookings Show Demand Troughed in 1H-2009
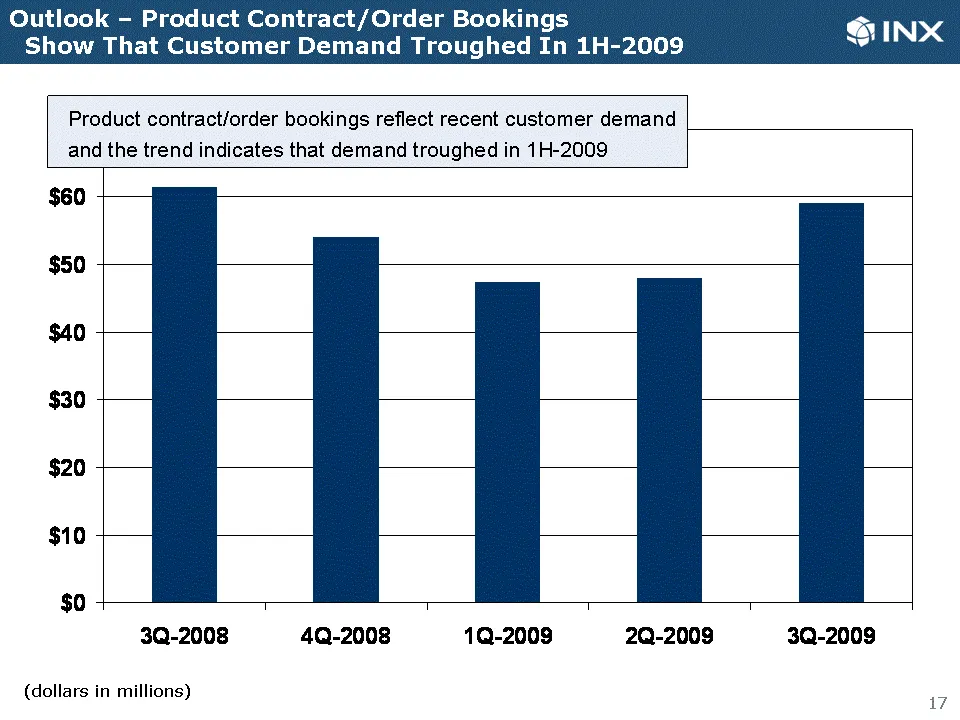
Outlook - Product Contract ‘der Bookings Show That Customer Demand Troughed In 1H-2009 Product contract/order bookings reflect recent customer demand and the trend indicates that demand troughed in 1H-2009 $60 $50 $40 $30 $20 $10 $0 T T T T 3Q-2008 4Q-2008 1Q-2008 2Q-2009 3Q-2009 (dollars in million
Slide 16: Product bookings down only 3.9% versus prior year period
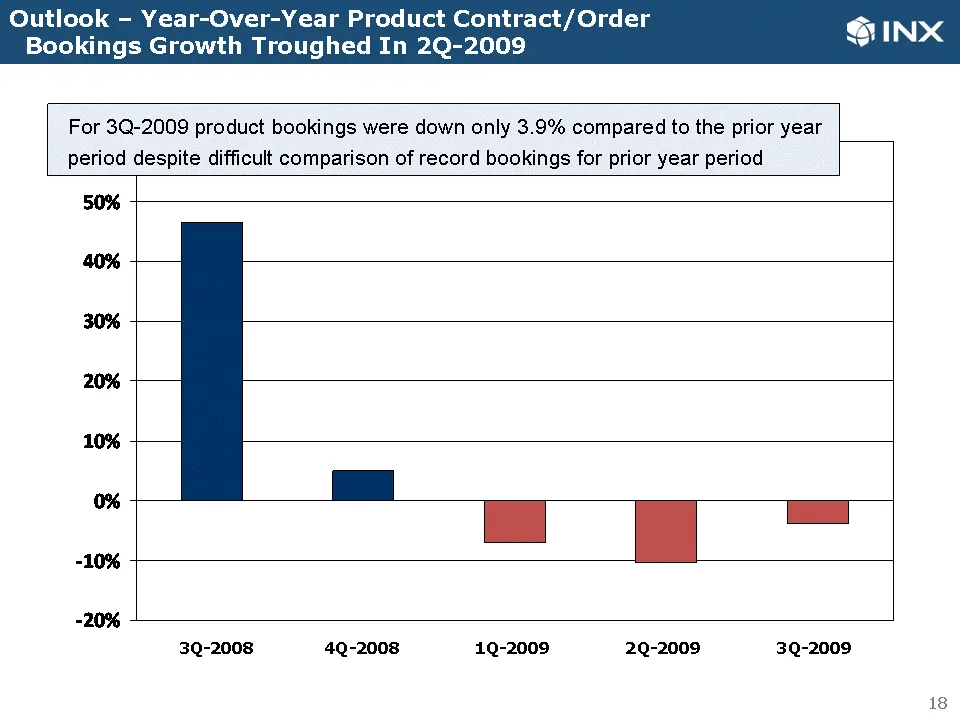
@INX For 3Q-2009 product bookings were down only 3.9% compared to the prior year period despite difficult comparison of record bookings for prior year period 50% 40% 30% 20% 10% ox = 3Q-2008 4Q-2008 19-2009 29-2009 3Q-2009 18
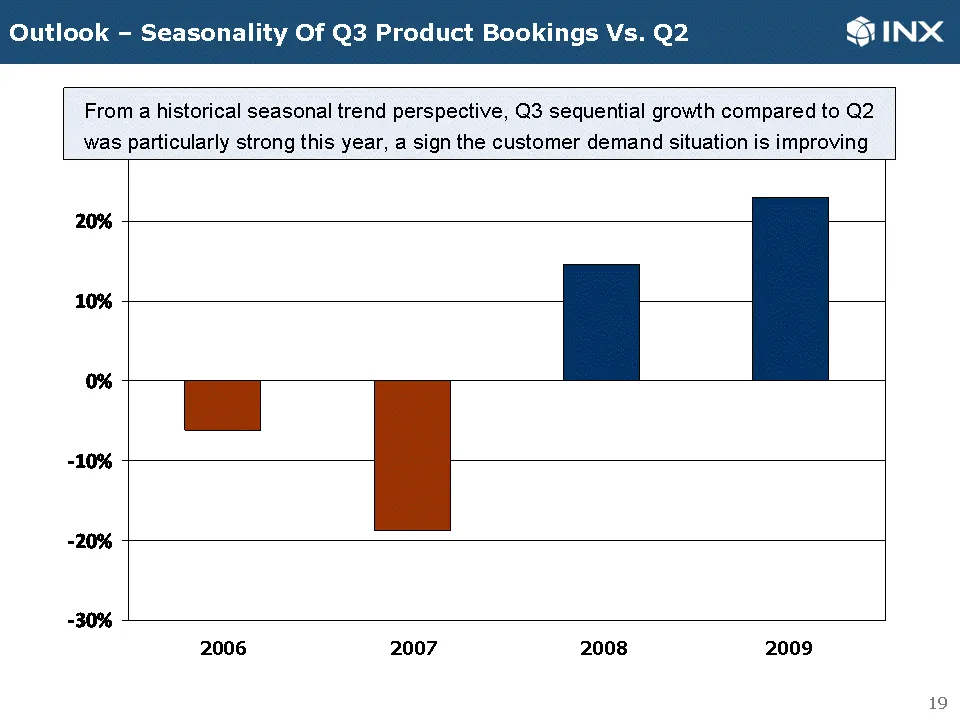
Slide 17: Outlook - Seasonality of Q3 Product Bookings vs. Q2
itlook - Seaso gs Vs. Q2 SINX ity Of Q3 Product Boo From a historical seasonal trend perspective, Q3 sequential growth compared to Q2 was particularly strong this year, a sign the customer demand situation is improving 20% 10% 2006 2007 2008 2009 19
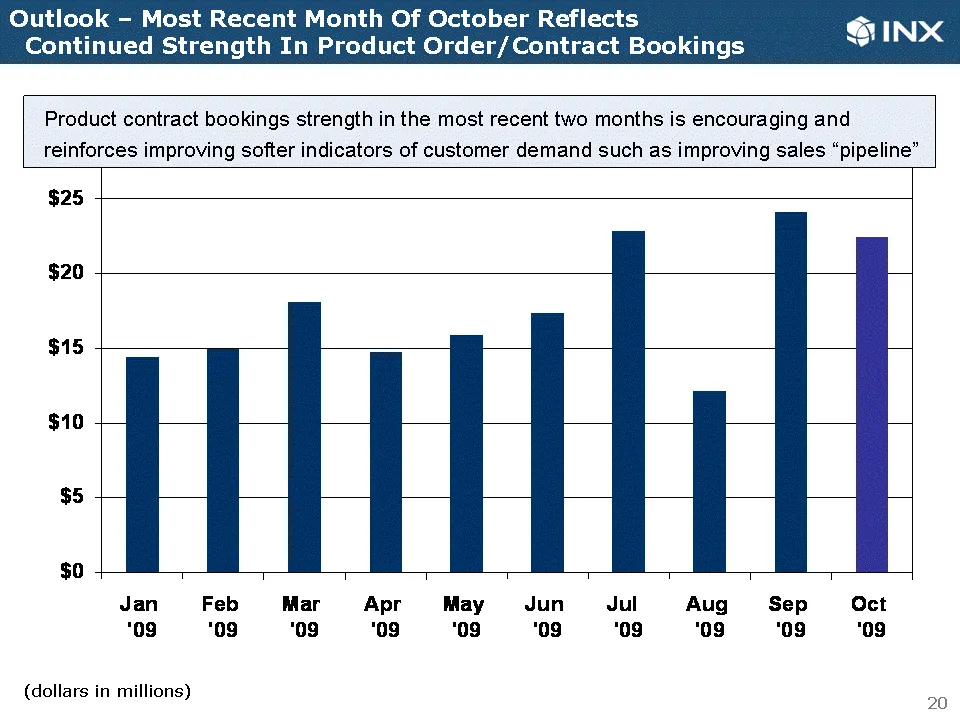
Slide 18: Outlook - Most Recent Month of October Reflects Continued Strength
tlook - Most Recent Month Of October Reflects Continued Strength In Product Order/ Contract Bookings @INX Product contract bookings strength in the most recent two months is encouraging and reinforces improving softer indicators of customer demand such as improving sales “pipeline” $25 $20 $15 $10 $
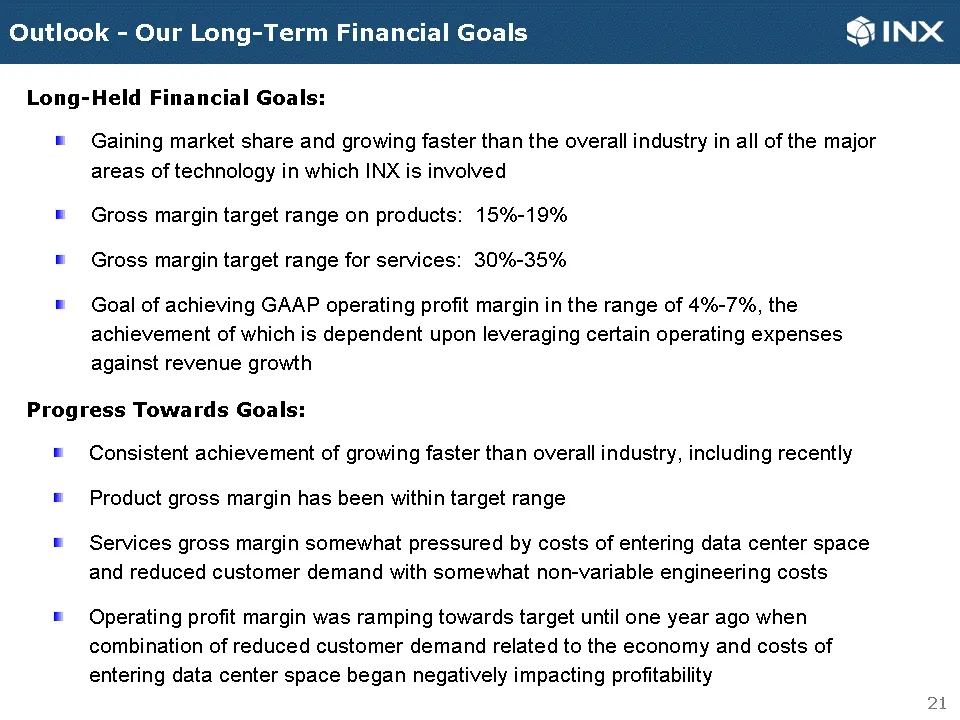
Slide 19: Outlook - Our Long-Held Financial Goals
tlook - Our SINX Long-Held Financial Goals: Gaining market share and growing faster than the overall industry in all of the major areas of technology in which INX is involved Gross margin target range on products: 15%-19% Gross margin target range for services: 30%-35% Goal of achieving GAAP operati
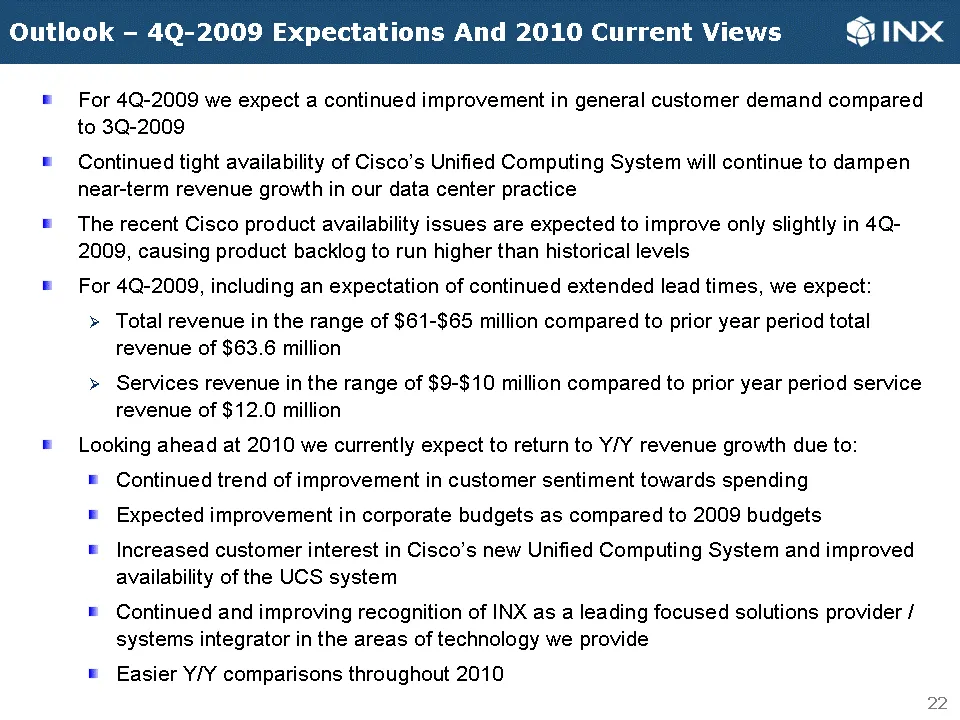
Slide 20: Outlook - 4Q-2009 Expectations And 2010 Current Views
Outlook - 4Q-2009 Expectations And 2010 Current Views SINX For 4Q-2009 we expect a continued improvement in general customer demand compared to 3Q-2009 Continued tight availability of Cisco’s Unified Computing System will continue to dampen near-term revenue growth in our data center practice The re
Source: SEC EDGAR · 8-K filed Nov 10, 2009
More decks from INX Inc
 Merger or Acquisition (November 2011)10 slides · Nov 1, 2011
 Rodman & Renshaw Global Investment Conference 201120 slides · Sep 13, 2011
 Shareholder Meeting (July 2011)15 slides · Jul 19, 2011
 Q1 2011 Earnings Presentation15 slides · Jul 13, 2011
 FY2010 Earnings Presentation28 slides · Jun 6, 2011
 Corporate Update (November 2010)24 slides · Nov 10, 2010