Naspers Limited Class N · JSE:NPN
Naspers Limited Class N — FY2017 Earnings Presentation
49 slides from Naspers Limited Class N's earnings presentation, June 2017

Slide 1: Financial results presentation
Financial results presentation For the year ended 31 March 2017
Slide 2: Important information
Important information This presentation contains forward-looking statements as defined in the United States Private Securities Litigation Reform Act of 1995. Words such as “believe”, “anticipate”, “intend”, “seek”, “will”, “plan”, “could”, “may”, “endeavour” and similar expressions are intended to i
Slide 3: Agenda
1. Strategy 2. Operations Agenda 3. Financials 4. Outlook

Slide 4: Strategy
STRATEGY
Slide 5: Strategy: building blocks in place
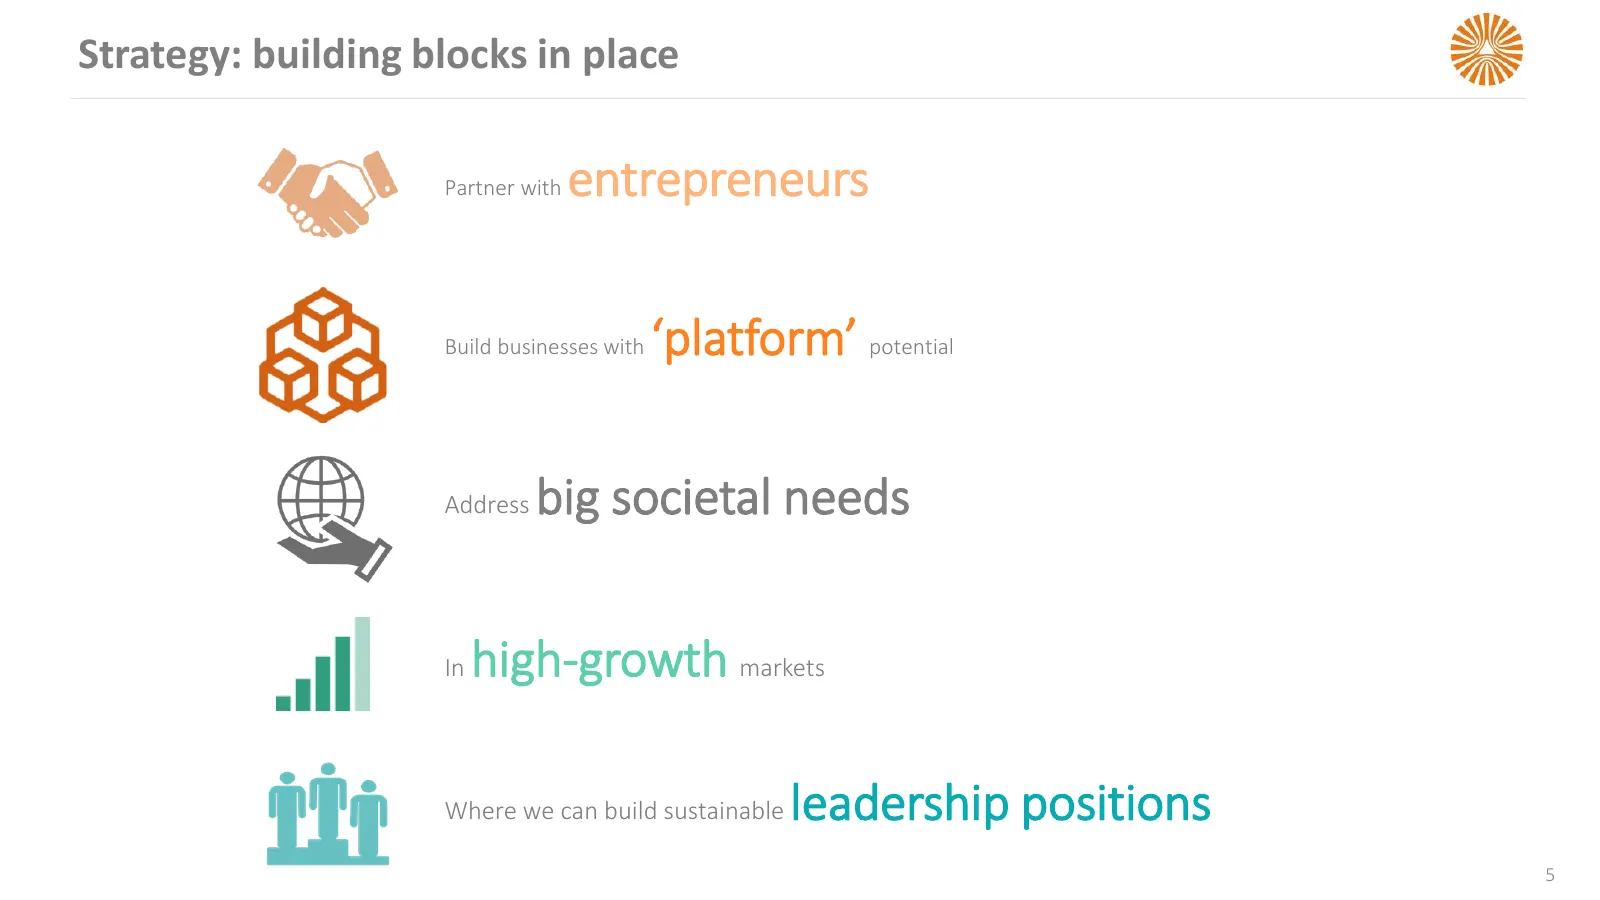
Strategy: building blocks in place Partner with entrepreneurs Build businesses with ‘platform’ potential Address big societal needs In high-growth markets Where we can build sustainable leadership positions 5
Slide 6: Naspers creates value
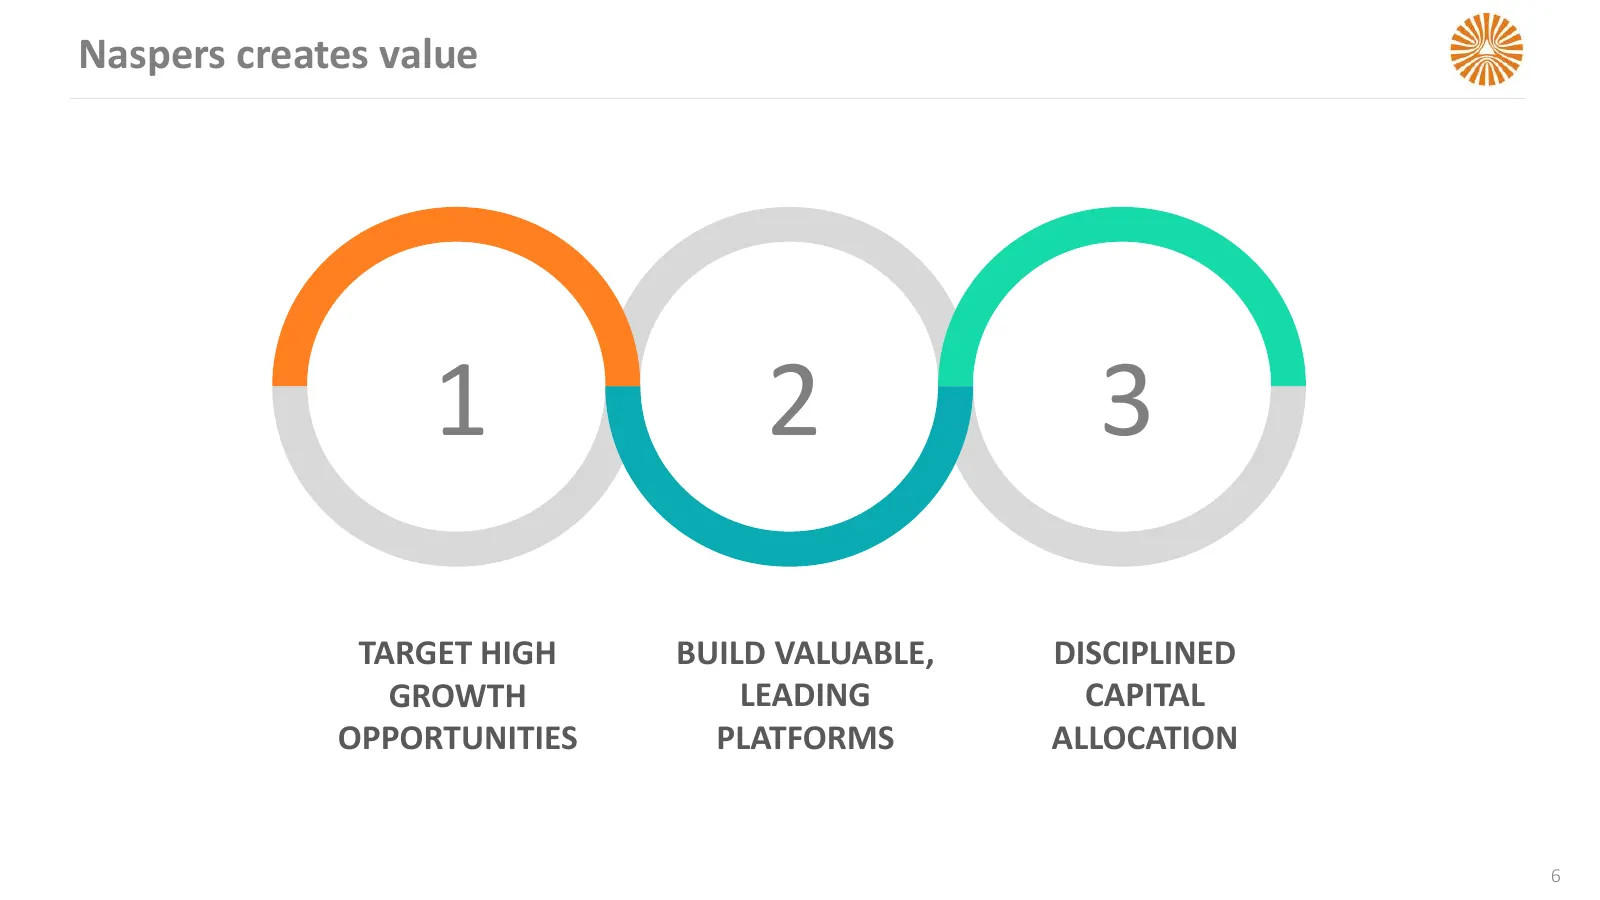
Naspers creates value 1 2 3 TARGET HIGH BUILD VALUABLE, DISCIPLINED GROWTH LEADING CAPITAL OPPORTUNITIES PLATFORMS ALLOCATION 6
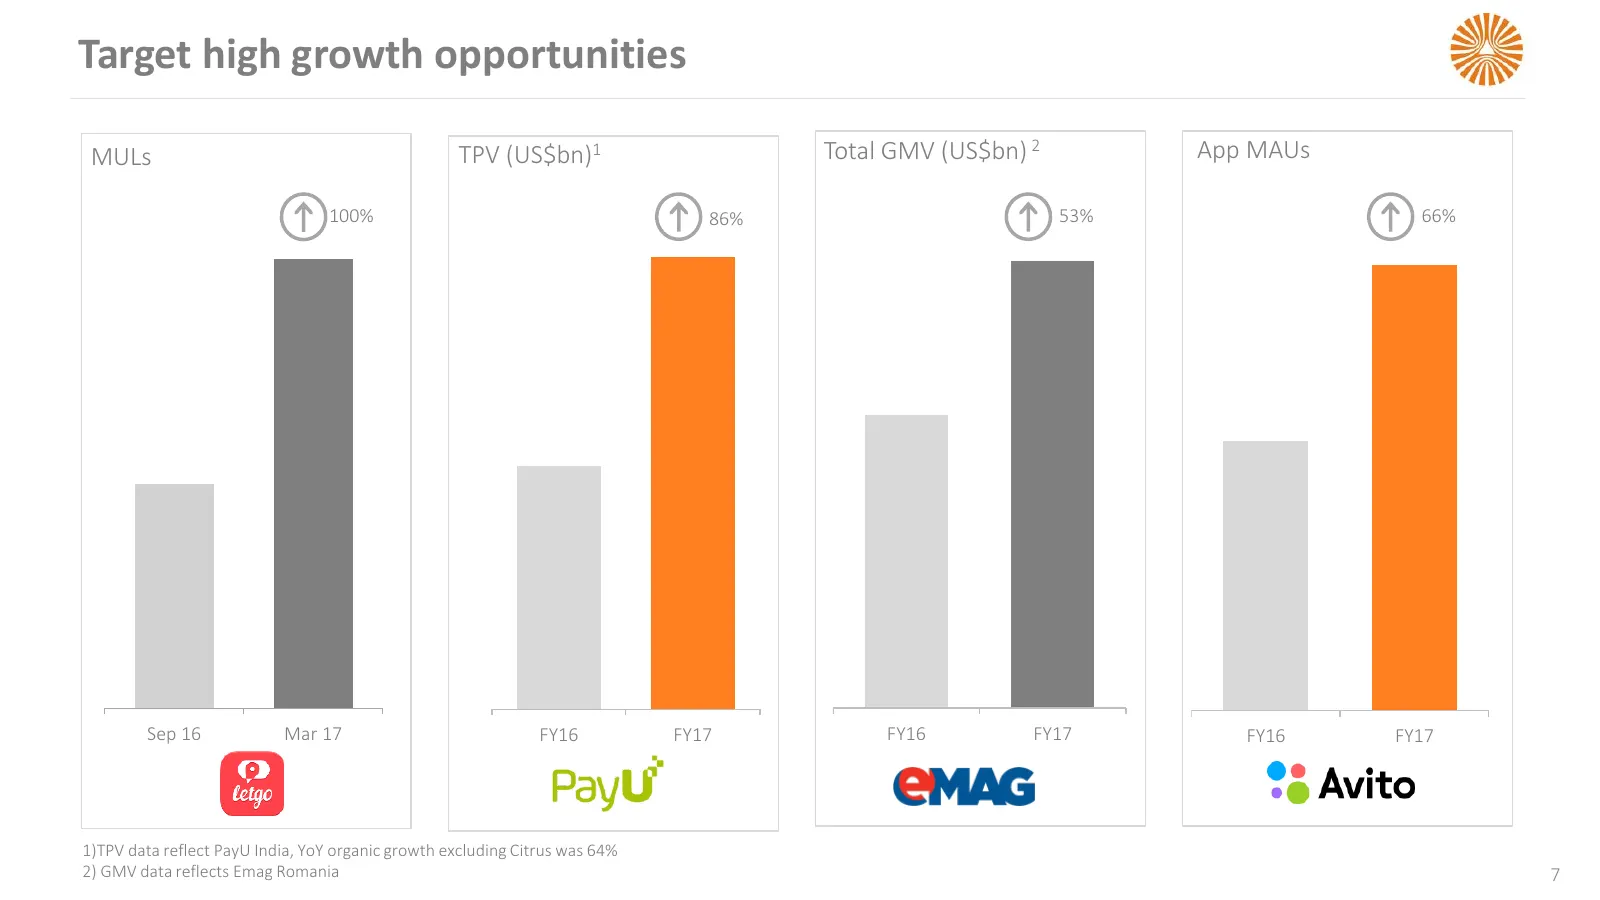
Slide 7: Target high growth opportunities
Target high growth opportunities MULs TPV (US$bn)1 Total GMV (US$bn) 2 App MAUs 100% 86% 53% 66% Sep 16 Mar 17 FY16 FY17 FY16 FY17 FY16 FY17 1)TPV data reflect PayU India, YoY organic growth excluding Citrus was 64% 2) GMV data reflects Emag Romania 7
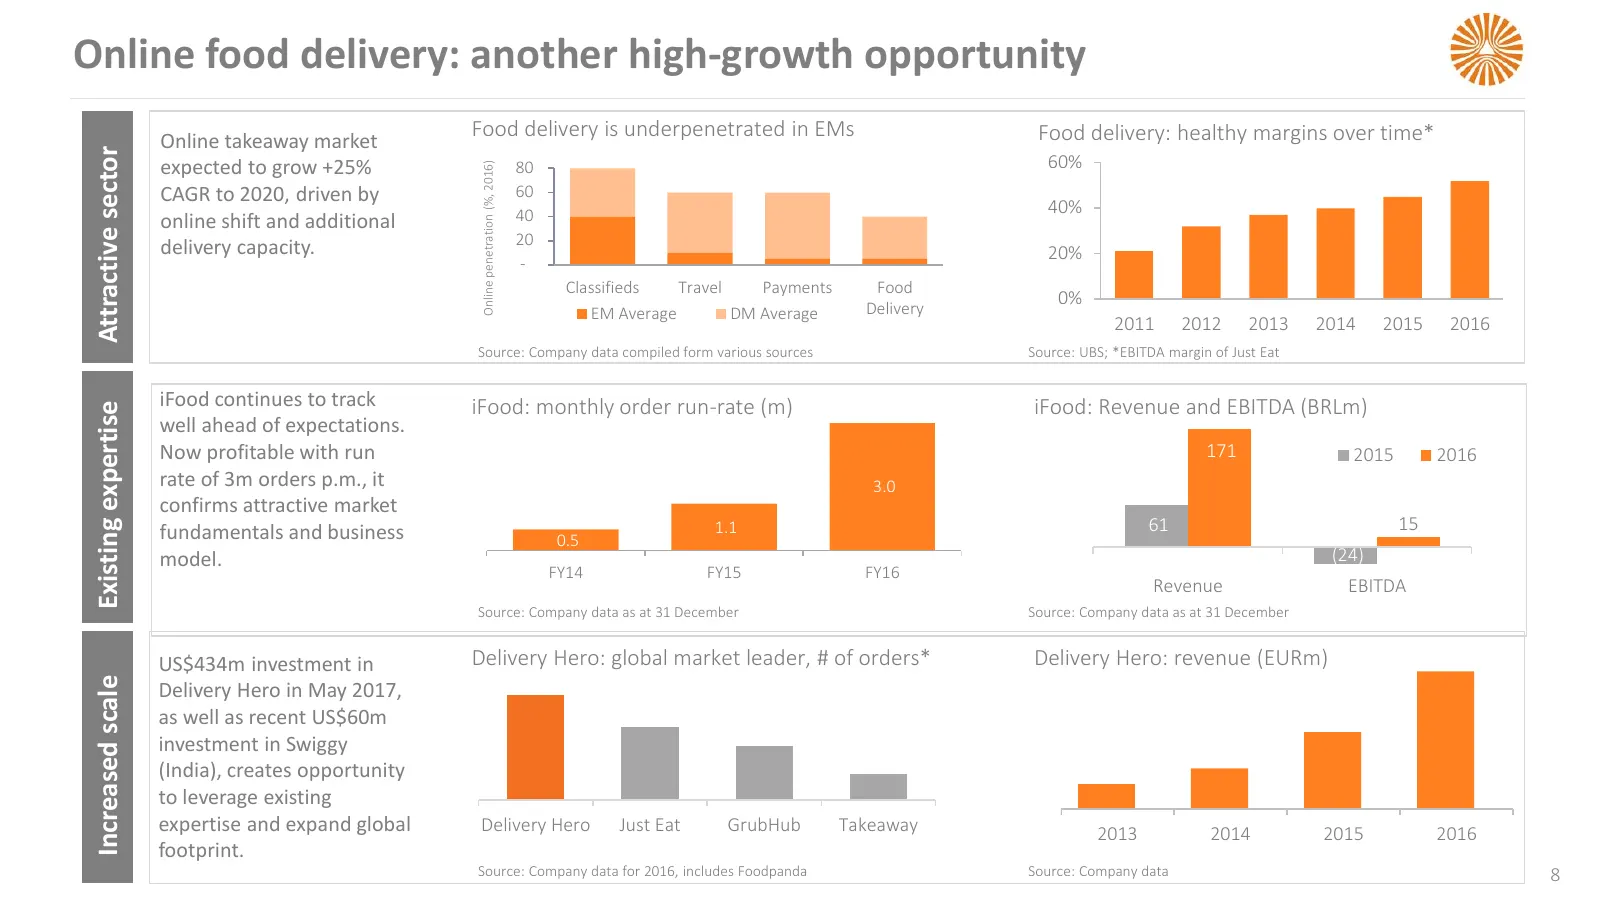
Slide 8: Online food delivery: another high-growth opportunity
Online food delivery: another high-growth opportunity Online takeaway market Food delivery is underpenetrated in EMs Food delivery: healthy margins over time* Attractive sector expected to grow +25% 80 60% Online penetration (%, 2016) CAGR to 2020, driven by 60 40 40% online shift and additional 20
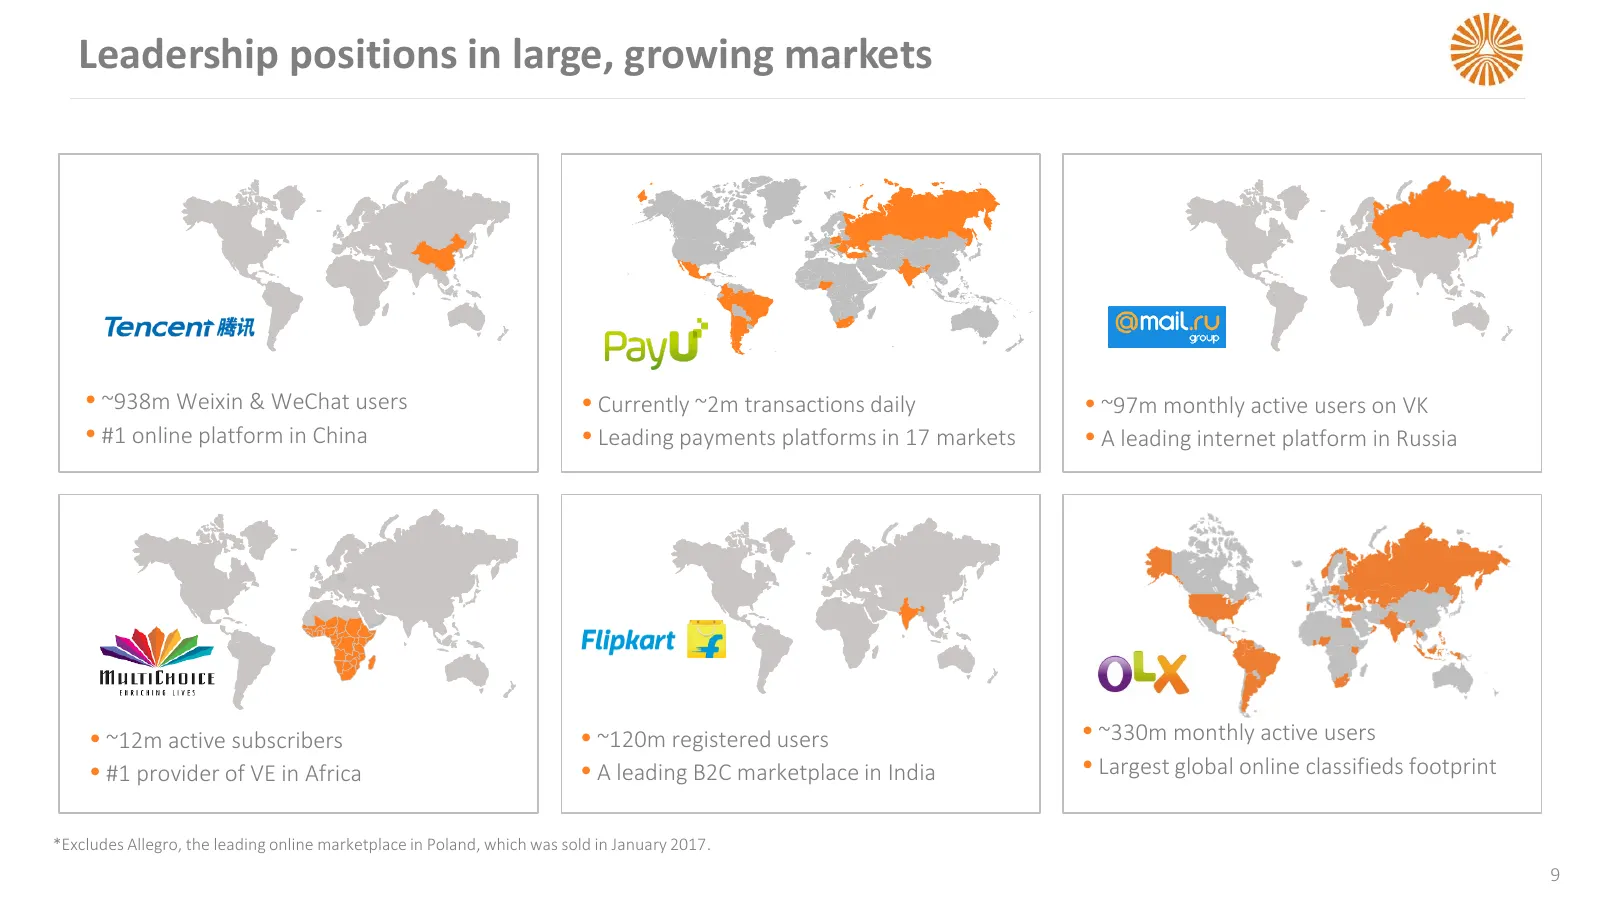
Slide 9: Leadership positions in large, growing markets
Leadership positions in large, growing markets ~938m Weixin & WeChat users Currently ~2m transactions daily ~97m monthly active users on VK #1 online platform in China Leading payments platforms in 17 markets A leading internet platform in Russia ~12m active subscribers ~120m registe
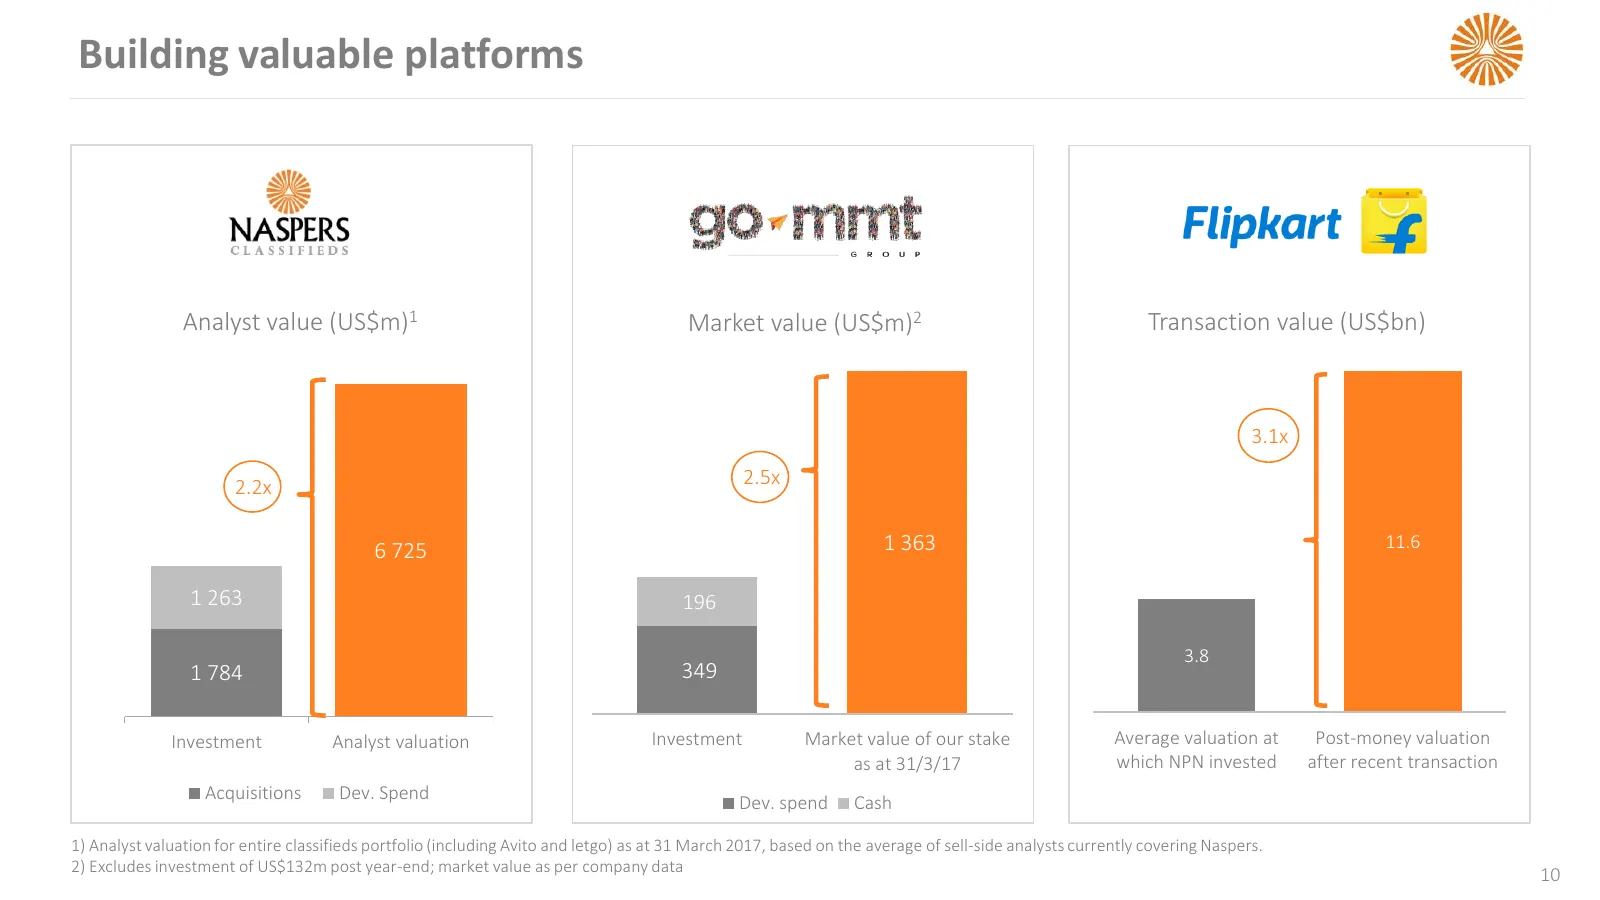
Slide 10: Building valuable platforms
Building valuable platforms Analyst value (US$m)1 Market value (US$m)2 Transaction value (US$bn) 3.1x 2.2x 2.5x 6 725 1 363 11.6 1 263 196 3.8 1 784 349 Investment Analyst valuation Investment Market value of our stake Average valuation at Post-money valuation as at 31/3/17 which NPN invested after
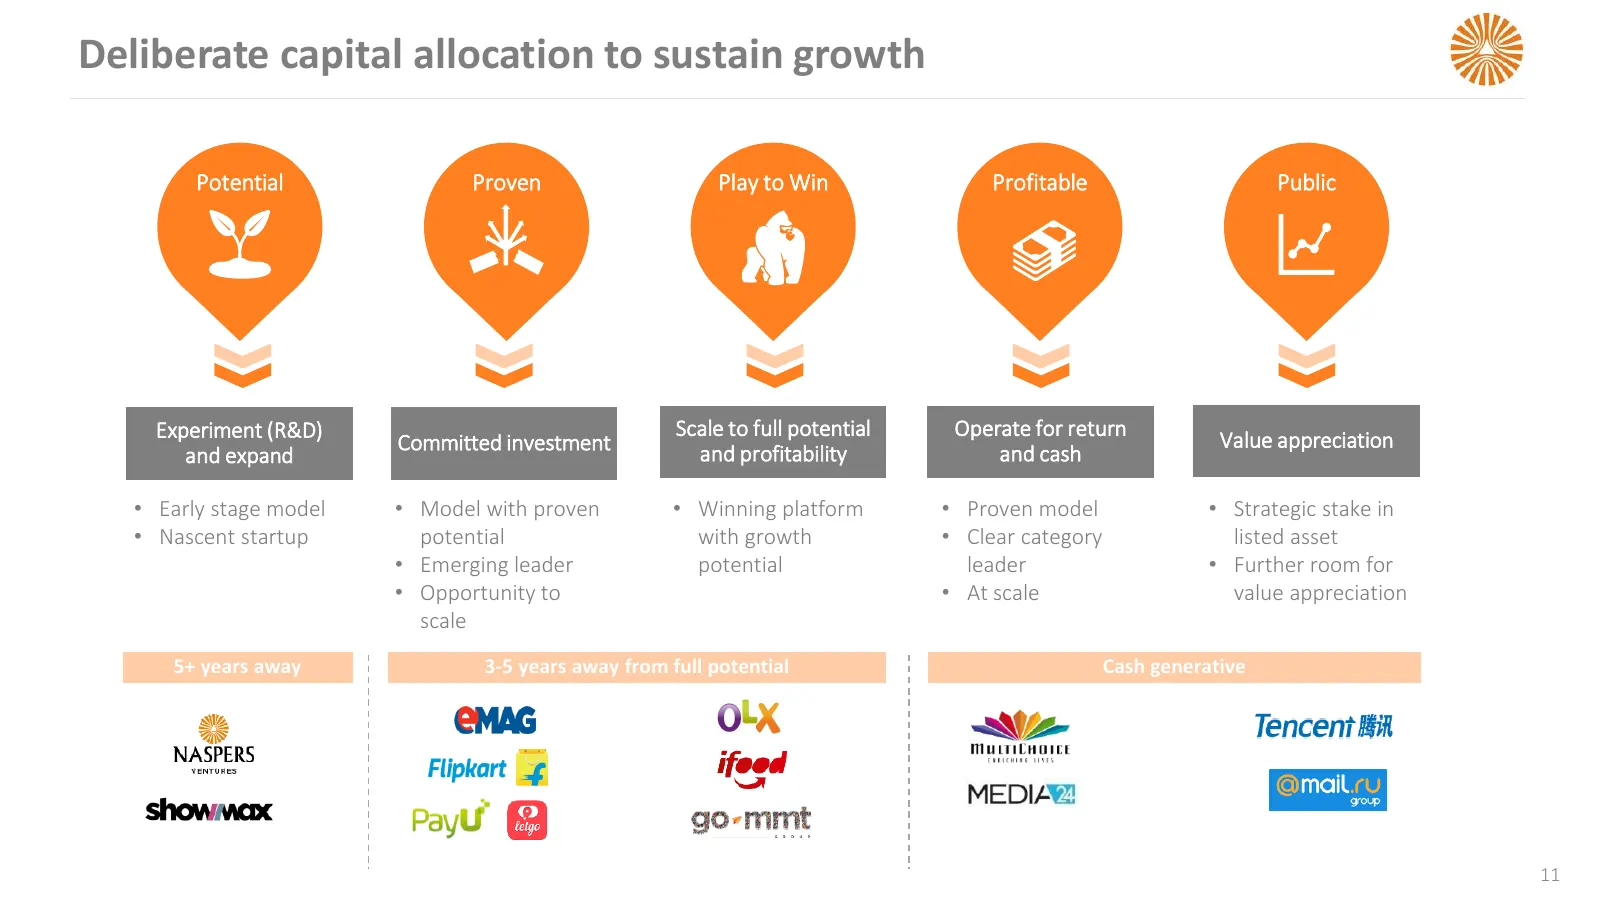
Slide 11: Deliberate capital allocation to sustain growth
Deliberate capital allocation to sustain growth Potential Proven Play to Win Profitable Public Experiment (R&D) Scale to full potential Operate for return Committed investment Value appreciation and expand and profitability and cash • Early stage model • Model with proven • Winning platform • Proven
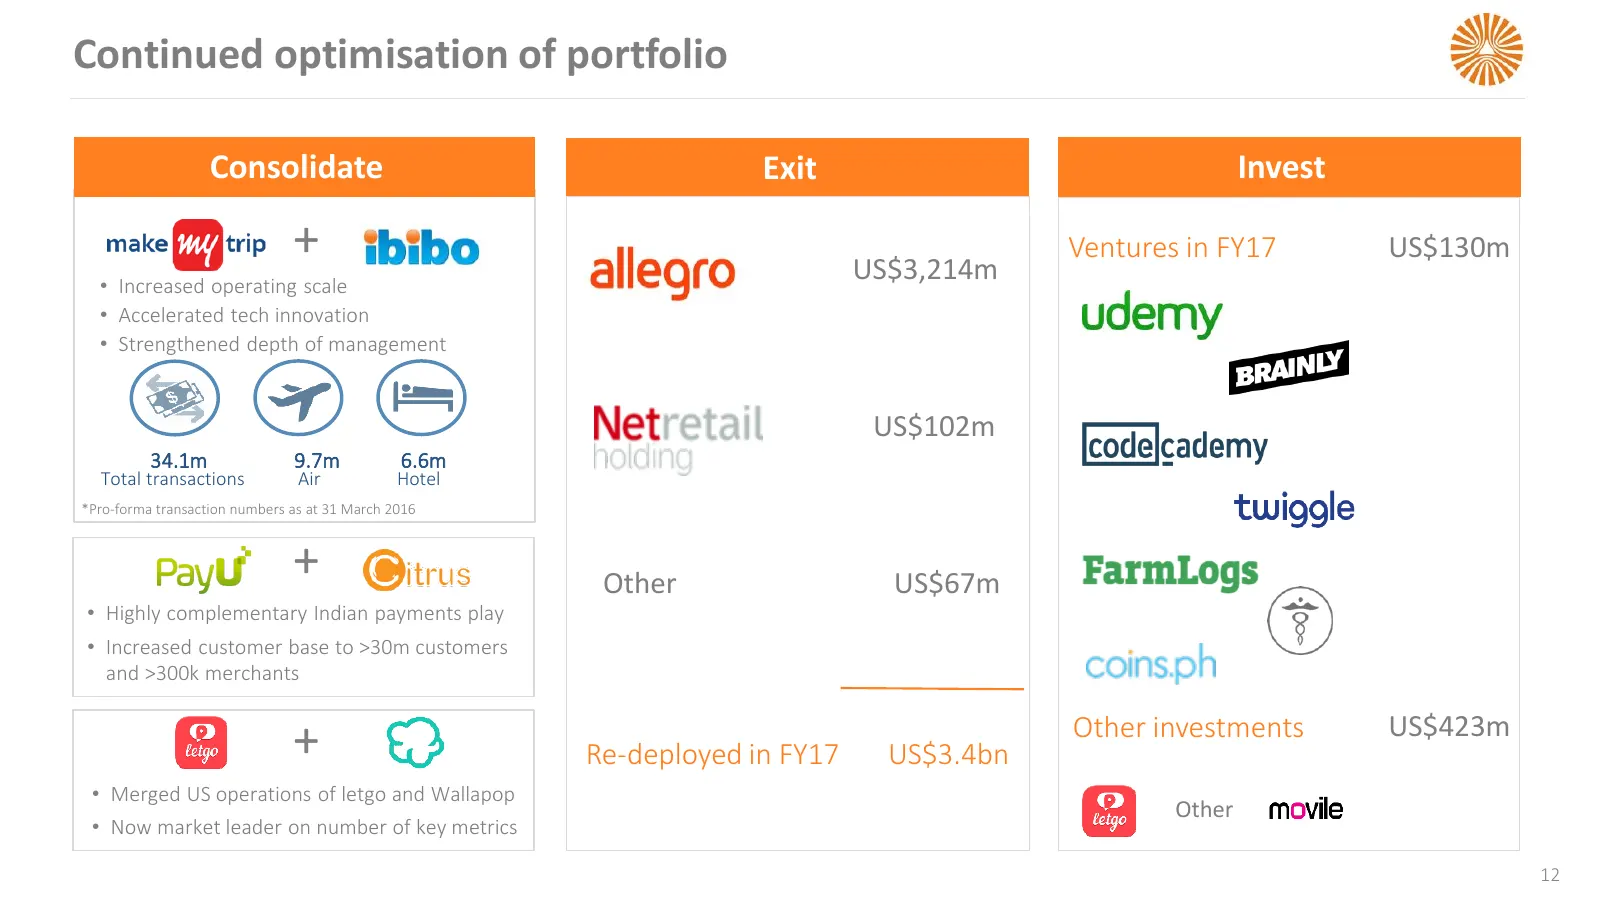
Slide 12: Continued optimisation of portfolio
Continued optimisation of portfolio Consolidate Exit Invest + US$3,214m Ventures in FY17 US$130m • Increased operating scale • Accelerated tech innovation • Strengthened depth of management US$102m 34.1m 9.7m 6.6m Total transactions Air Hotel *Pro-forma transaction numbers as at 31 March 2016 + Othe

Slide 13: Operations
OPERATIONS
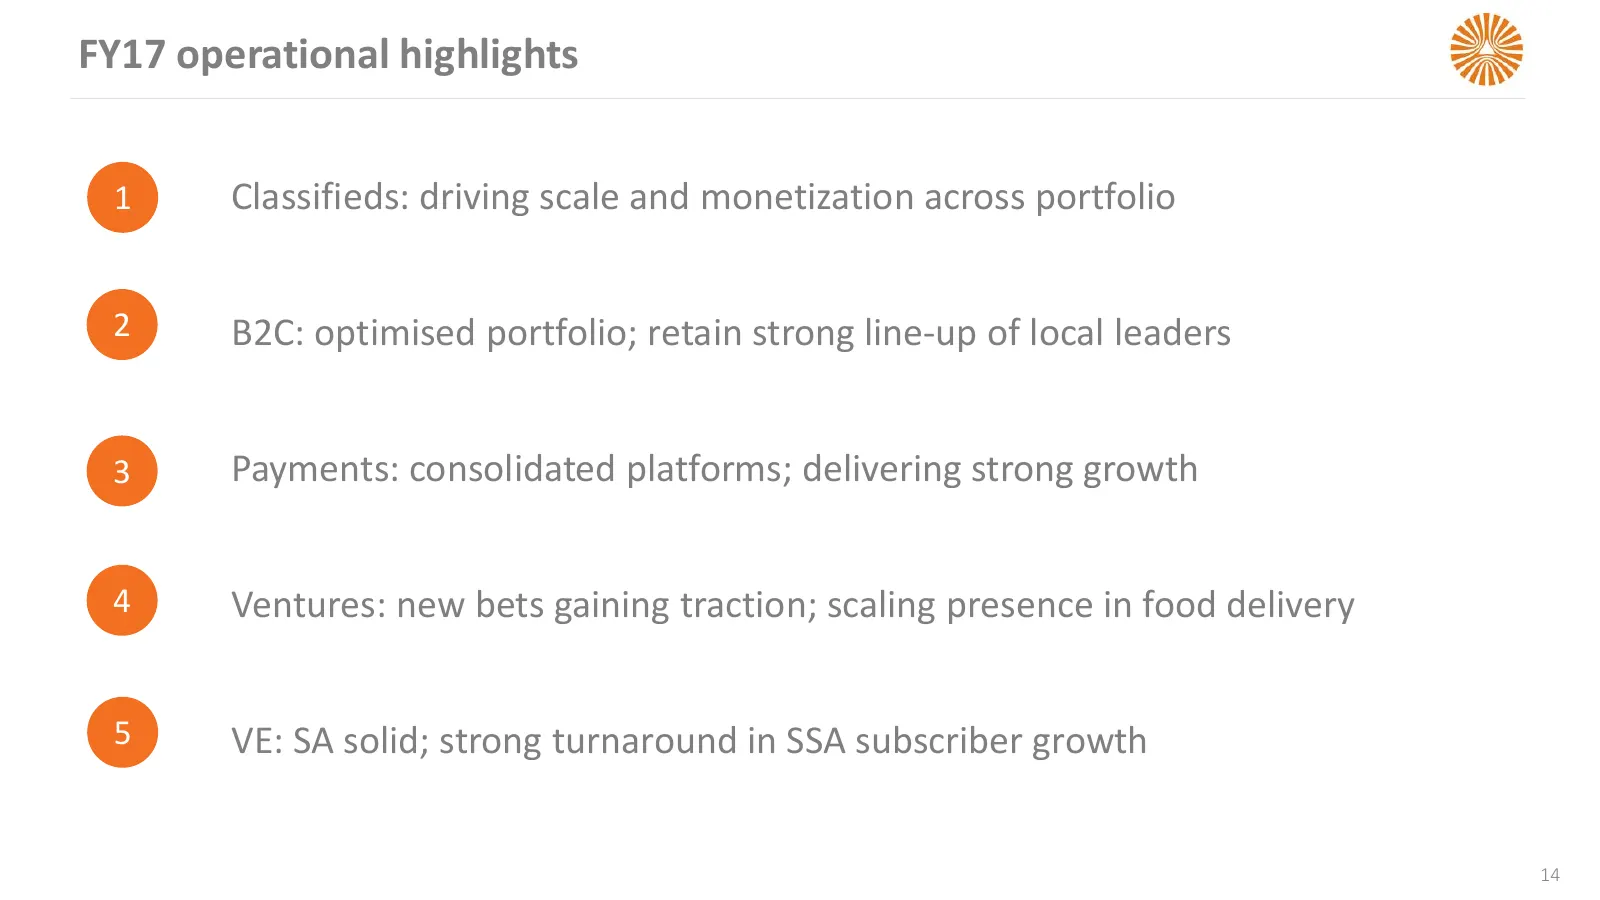
Slide 14: FY17 operational highlights
FY17 operational highlights 1 Classifieds: driving scale and monetization across portfolio 2 B2C: optimised portfolio; retain strong line-up of local leaders 3 Payments: consolidated platforms; delivering strong growth 4 Ventures: new bets gaining traction; scaling presence in food delivery 5 VE: SA
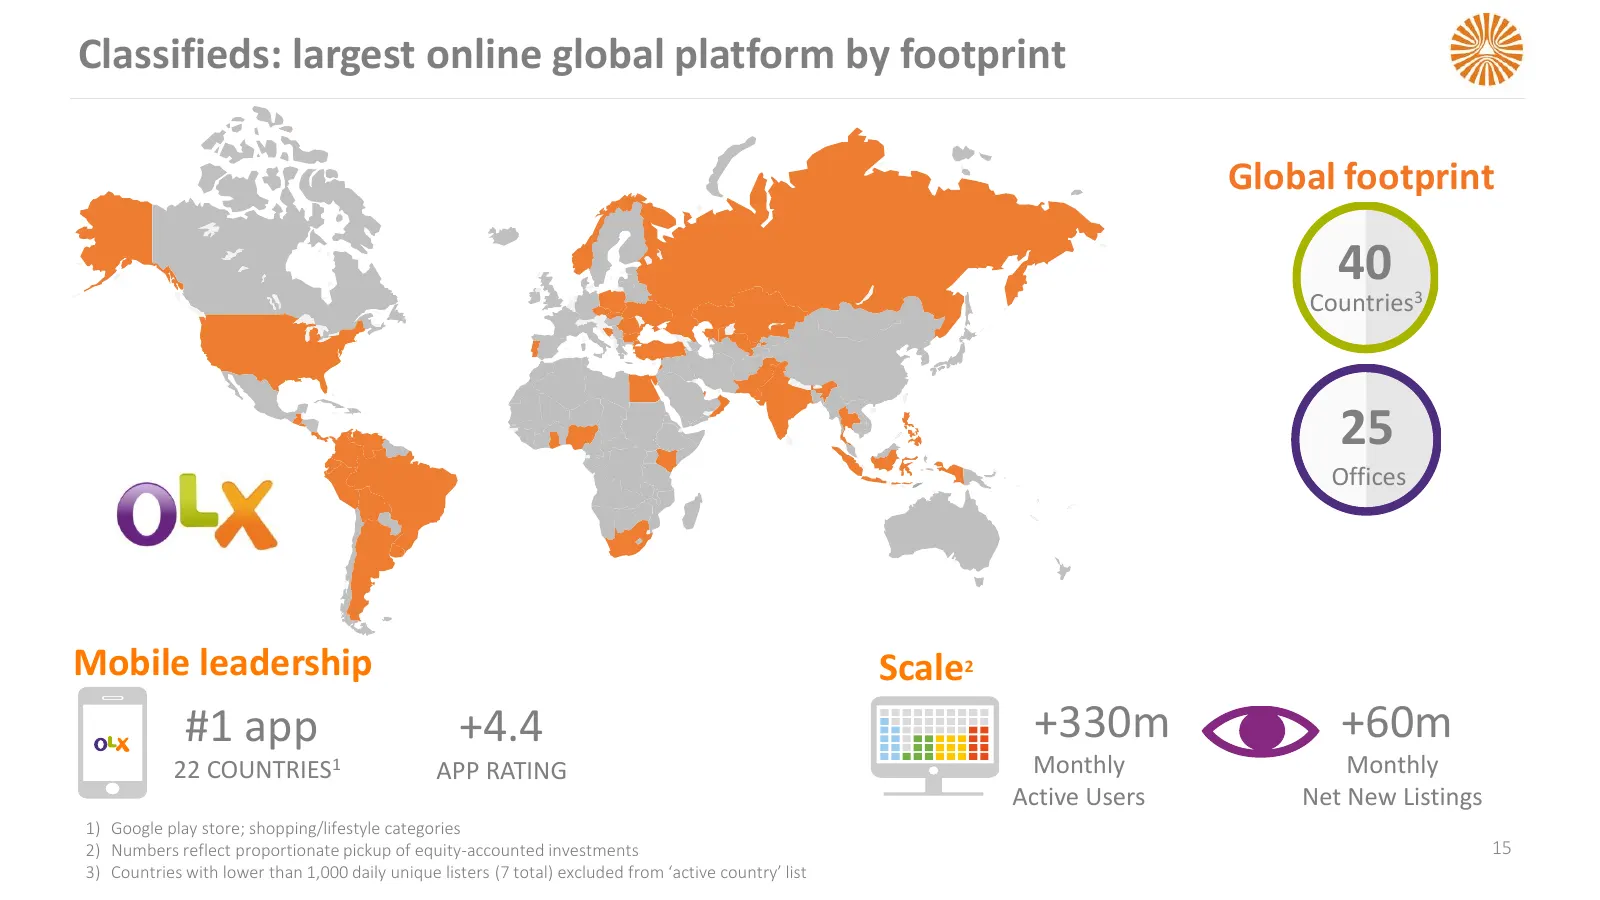
Slide 15: Classifieds: largest online global platform by footprint
Classifieds: largest online global platform by footprint Global footprint 40 Countries3 25 Offices Mobile leadership Scale2 #1 app +4.4 +330m +60m 22 COUNTRIES1 APP RATING Monthly Monthly Active Users Net New Listings 1) Google play store; shopping/lifestyle categories 2) Numbers reflect proportiona
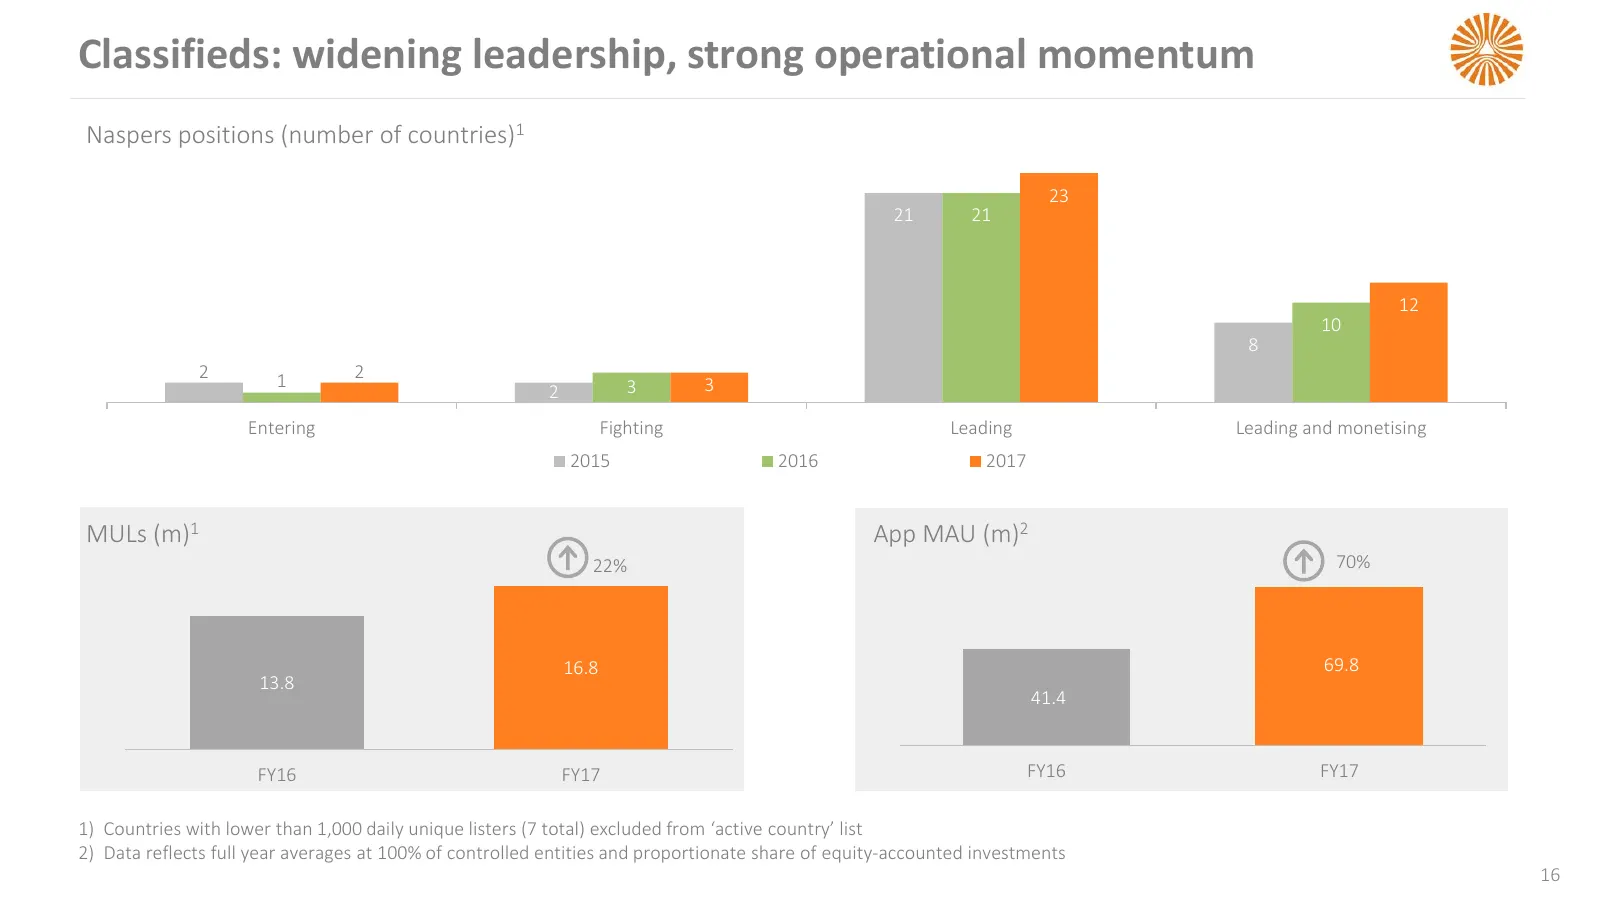
Slide 16: Classifieds: widening leadership, strong operational momentum
Classifieds: widening leadership, strong operational momentum Naspers positions (number of countries)1 23 21 21 12 10 8 2 1 2 2 3 3 Entering Fighting Leading Leading and monetising 2015 2016 2017 MULs (m)1 App MAU (m)2 22% 70% 16.8 69.8 13.8 41.4 FY16 FY17 FY16 FY17 1) Countries with lower than 1,00
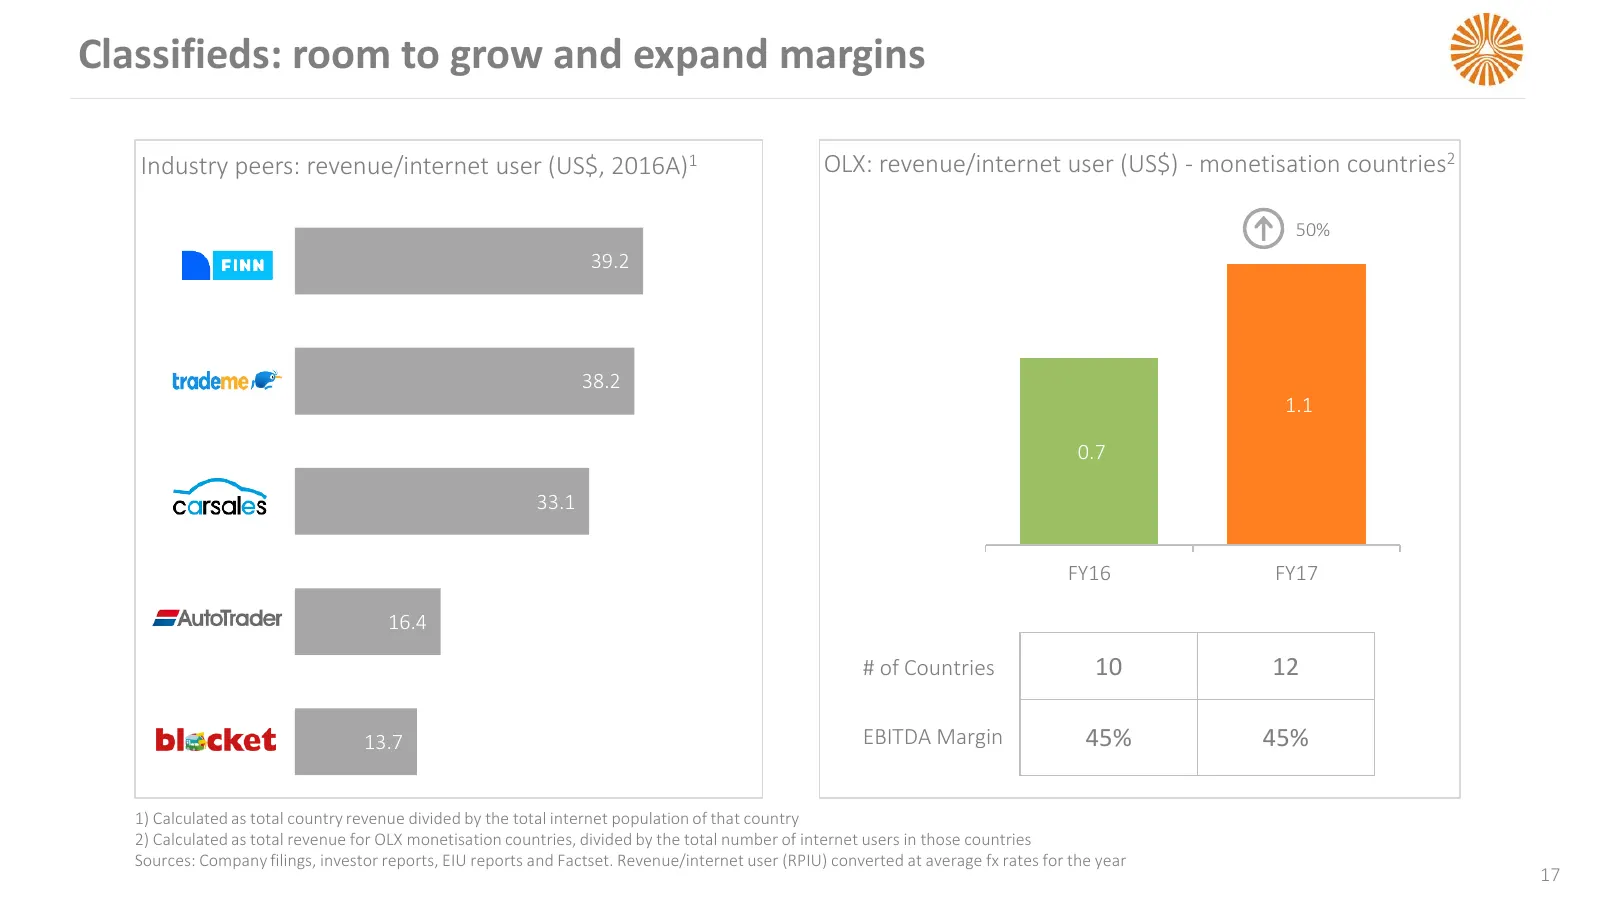
Slide 17: Classifieds: room to grow and expand margins
Classifieds: room to grow and expand margins Industry peers: revenue/internet user (US$, 2016A)1 OLX: revenue/internet user (US$) - monetisation countries2 50% 39.2 38.2 1.1 0.7 33.1 FY16 FY17 16.4 # of Countries 10 12 13.7 EBITDA Margin 45% 45% 1) Calculated as total country revenue divided by the
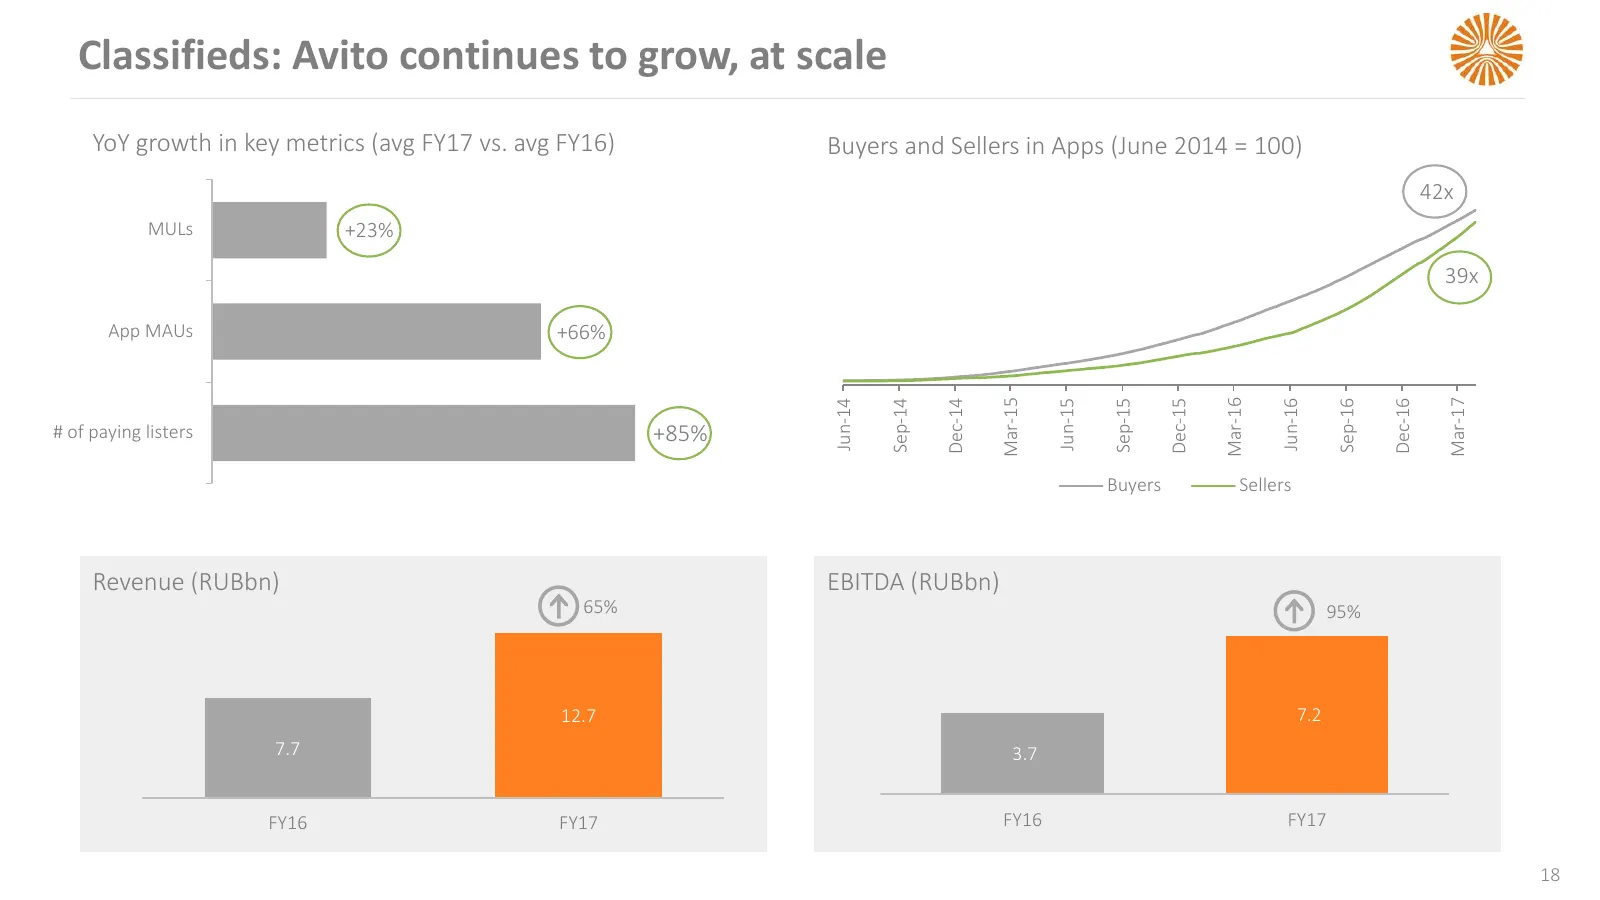
Slide 18: Classifieds: Avito continues to grow, at scale
Classifieds: Avito continues to grow, at scale YoY growth in key metrics (avg FY17 vs. avg FY16) Buyers and Sellers in Apps (June 2014 = 100) 42x MULs +23% 39x App MAUs +66% Mar-16 Mar-15 Mar-17 Sep-14 Sep-15 Sep-16 Jun-14 Jun-15 Jun-16 Dec-14 Dec-15 Dec-16 # of paying listers +85% Buyers Sellers Re
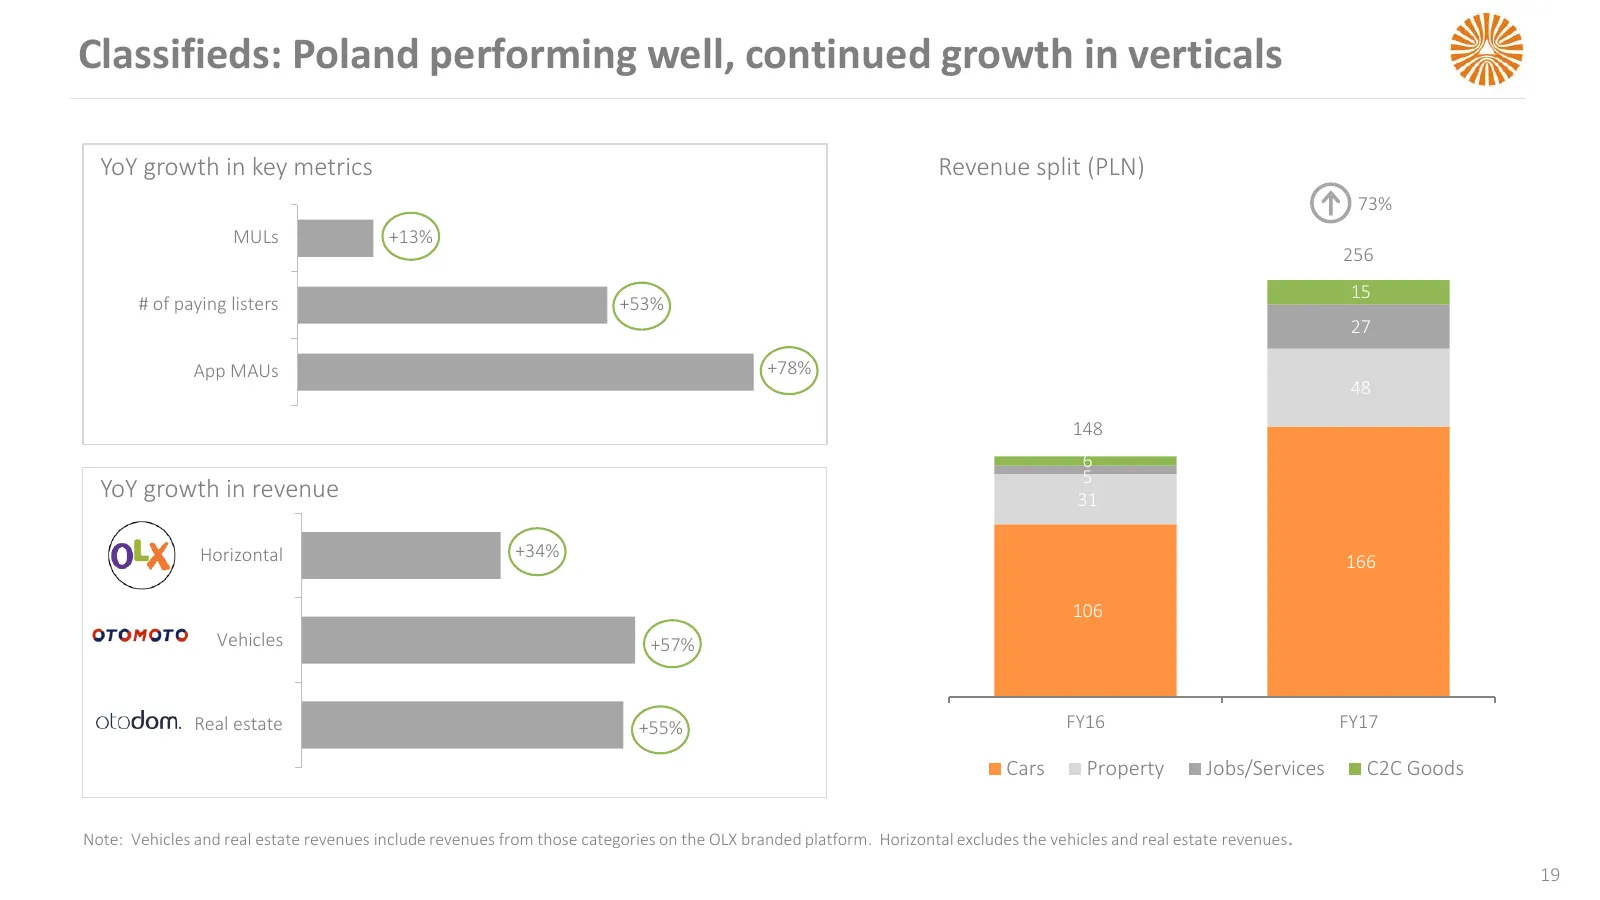
Slide 19: Classifieds: Poland performing well, continued growth in verticals
Classifieds: Poland performing well, continued growth in verticals YoY growth in key metrics Revenue split (PLN) 73% MULs +13% 256 15 # of paying listers +53% 27 App MAUs +78% 48 148 6 5 YoY growth in revenue 31 Horizontal +34% 166 106 Vehicles +57% Real estate +55% FY16 FY17 Cars Property Jobs/Serv
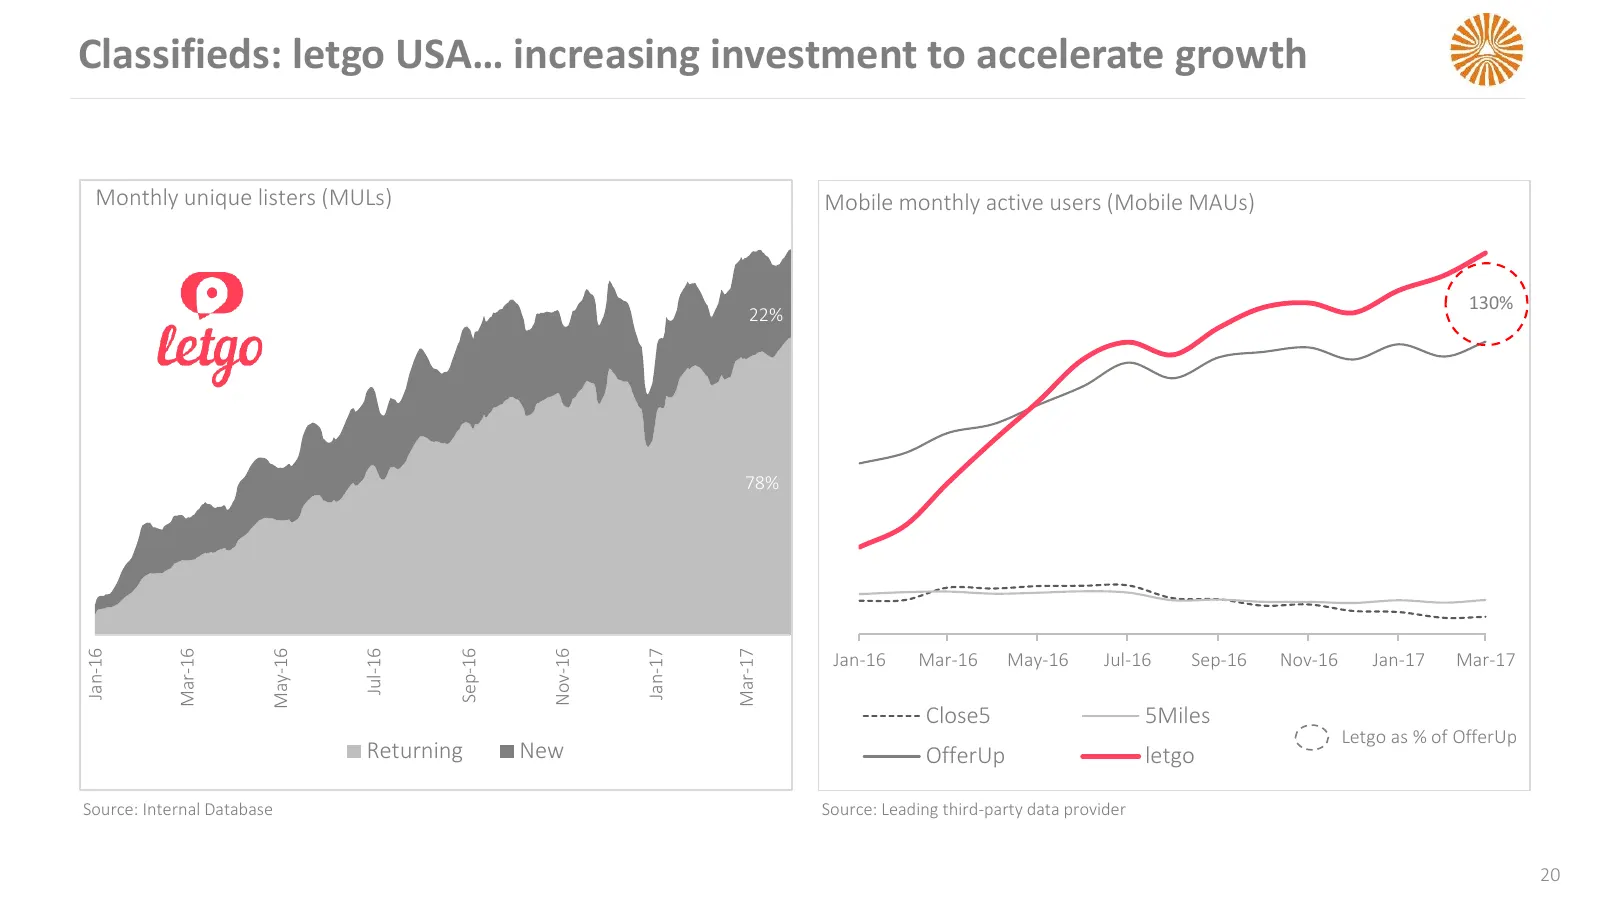
Slide 20: Classifieds: letgo USA increasing investment to accelerate growth
Classifieds: letgo USA… increasing investment to accelerate growth Monthly unique listers (MULs) Mobile monthly active users (Mobile MAUs) 130% 22% 78% Jan-16 Mar-16 May-16 Jul-16 Sep-16 Jan-17 Mar-17 Nov-16 Jan-16 Mar-16 May-16 Jul-16 Sep-16 Nov-16 Jan-17 Mar-17 Close5 5Miles Letgo as % of OfferUp
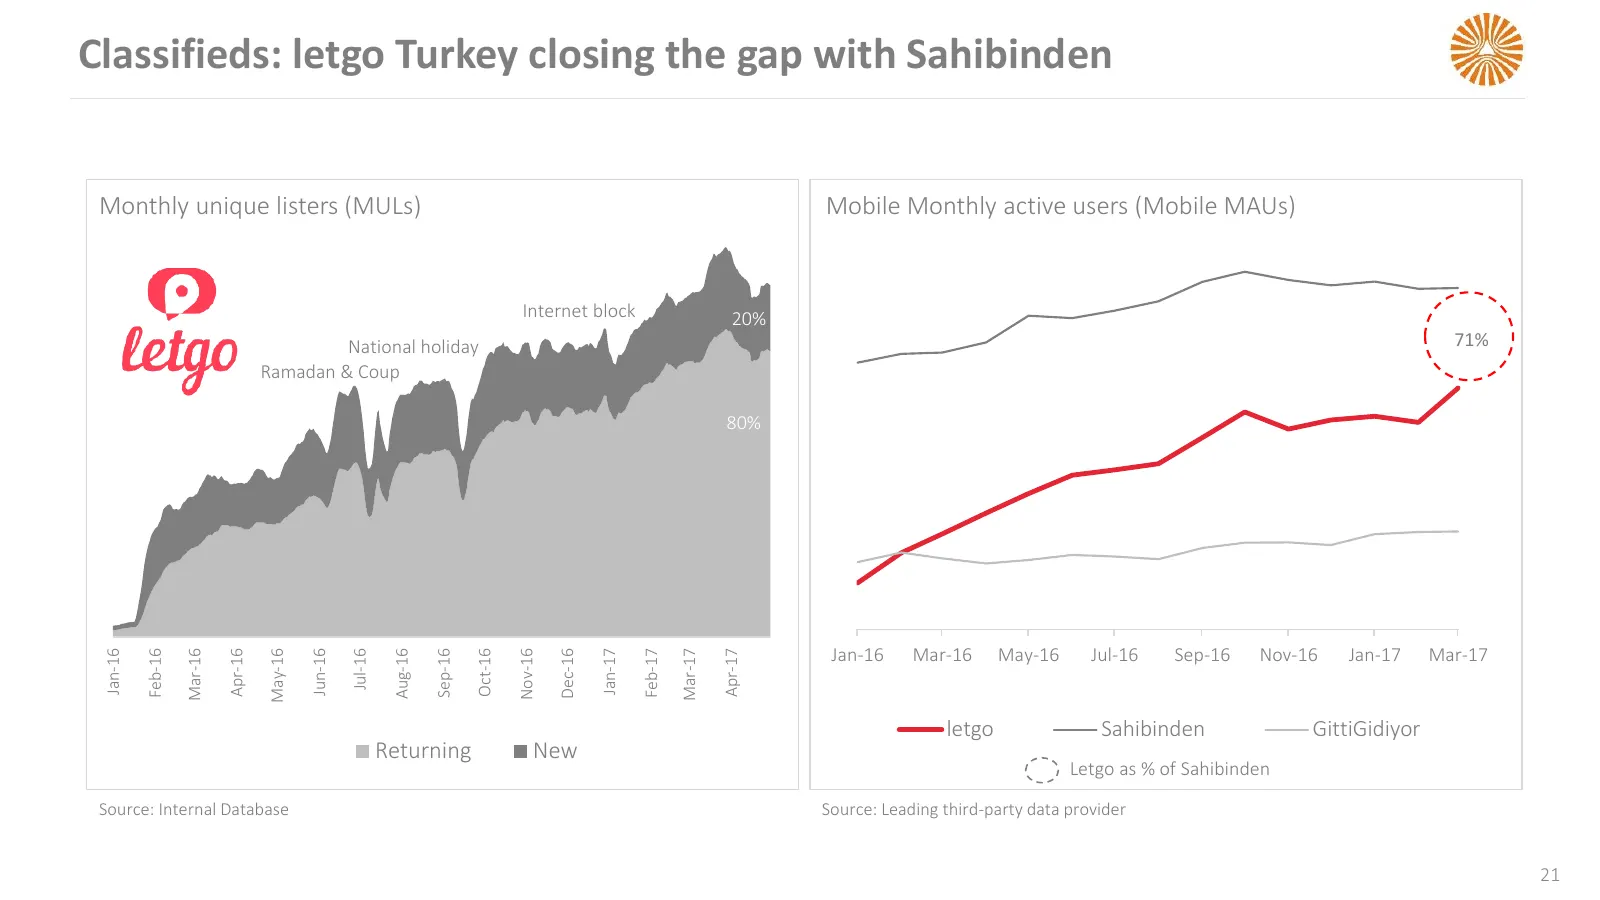
Slide 21: Classifieds: letgo Turkey closing the gap with Sahibinden
Classifieds: letgo Turkey closing the gap with Sahibinden Monthly unique listers (MULs) Mobile Monthly active users (Mobile MAUs) Internet block 20% National holiday 71% Ramadan & Coup 80% Jan-16 Mar-16 May-16 Jul-16 Sep-16 Nov-16 Jan-17 Mar-17 Mar-16 Aug-16 Mar-17 Jan-16 Sep-16 Oct-16 Nov-16 Dec-16
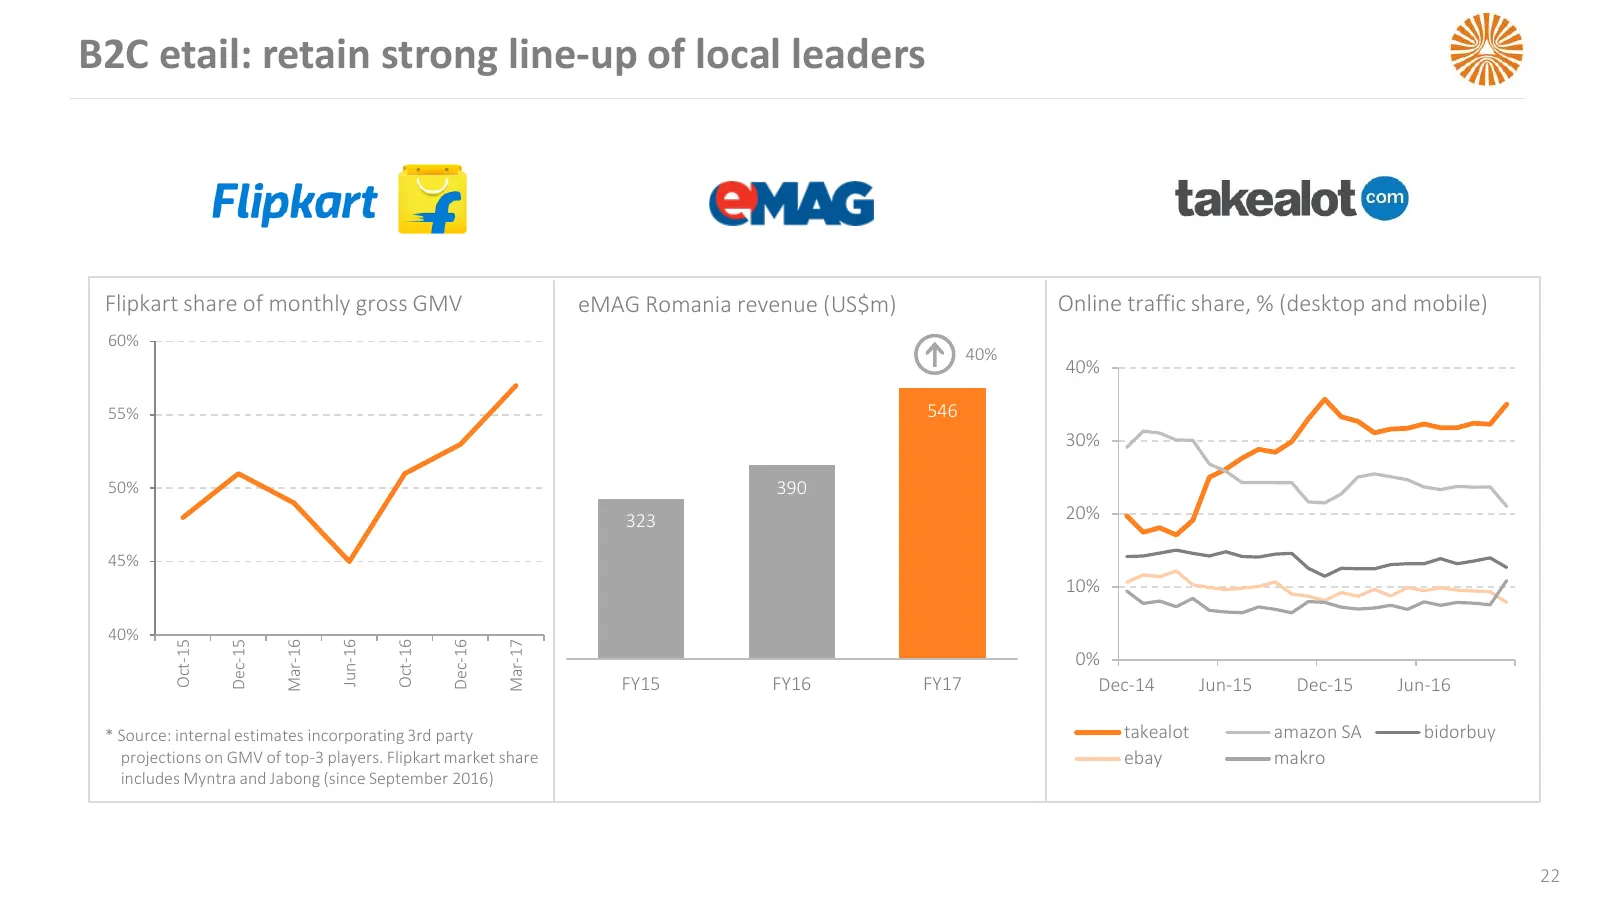
Slide 22: B2C etail: retain strong line-up of local leaders
B2C etail: retain strong line-up of local leaders Flipkart share of monthly gross GMV eMAG Romania revenue (US$m) Online traffic share, % (desktop and mobile) 60% 40% 40% 55% 546 30% 50% 390 323 20% 45% 10% 40% Dec-15 Mar-16 Dec-16 Mar-17 Oct-15 Oct-16 Jun-16 0% FY15 FY16 FY17 Dec-14 Jun-15 Dec-15 J
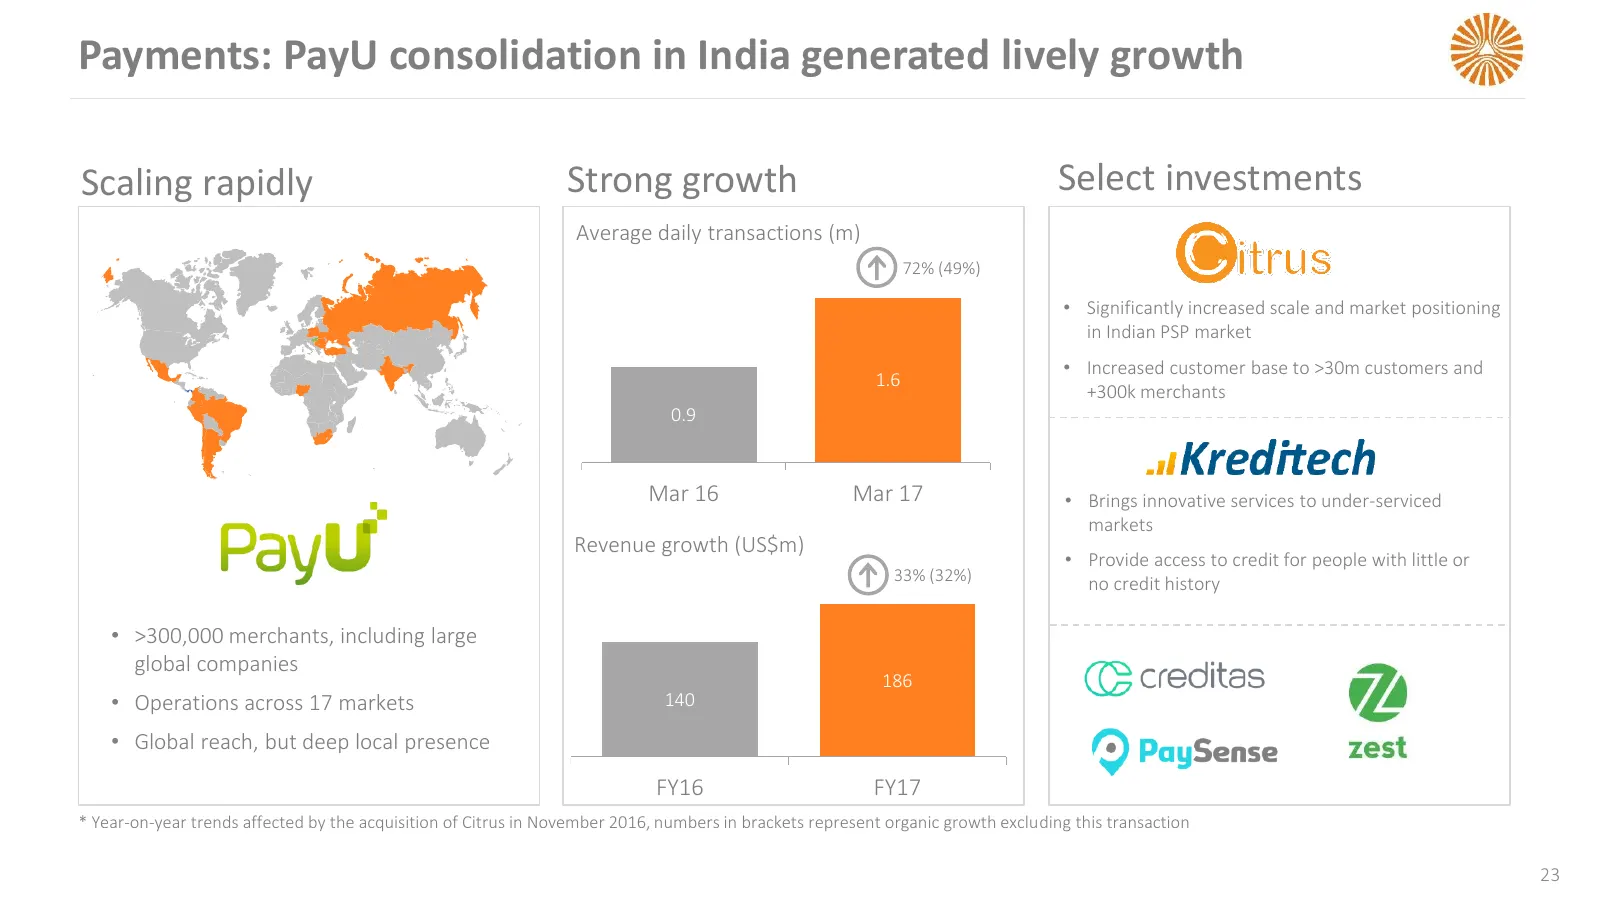
Slide 23: Payments: PayU consolidation in India generated lively growth
Payments: PayU consolidation in India generated lively growth Scaling rapidly Strong growth Select investments Average daily transactions (m) 72% (49%) • Significantly increased scale and market positioning in Indian PSP market • Increased customer base to >30m customers and 1.6 +300k merchants 0.9
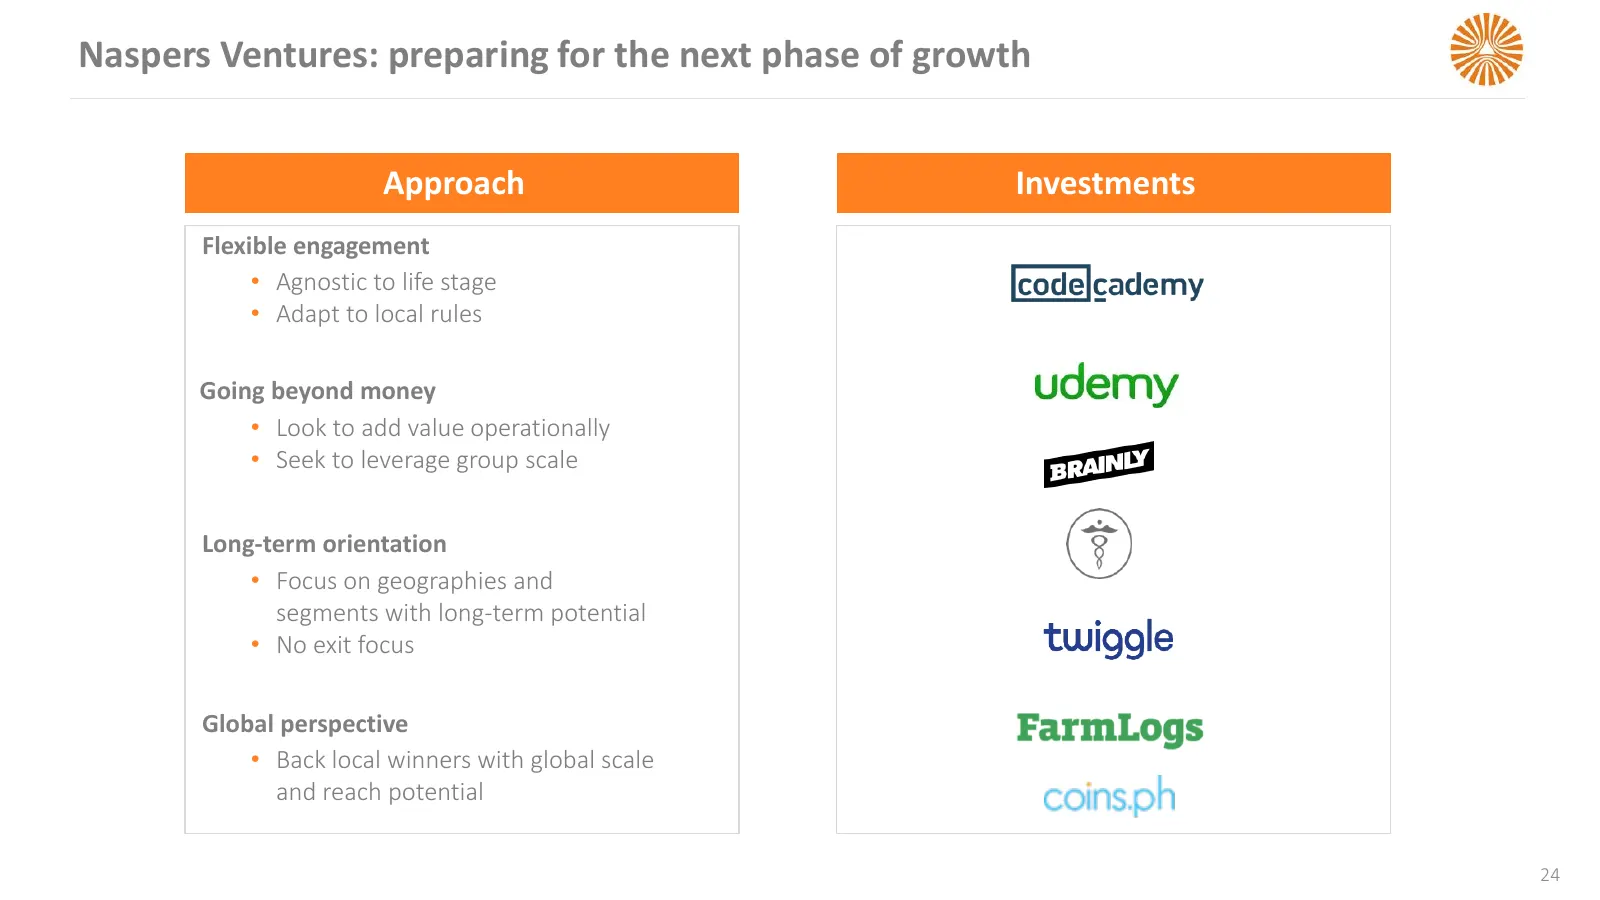
Slide 24: Naspers Ventures: preparing for the next phase of growth
Naspers Ventures: preparing for the next phase of growth Approach Investments Flexible engagement • Agnostic to life stage • Adapt to local rules Going beyond money • Look to add value operationally • Seek to leverage group scale Long-term orientation • Focus on geographies and segments with long-te
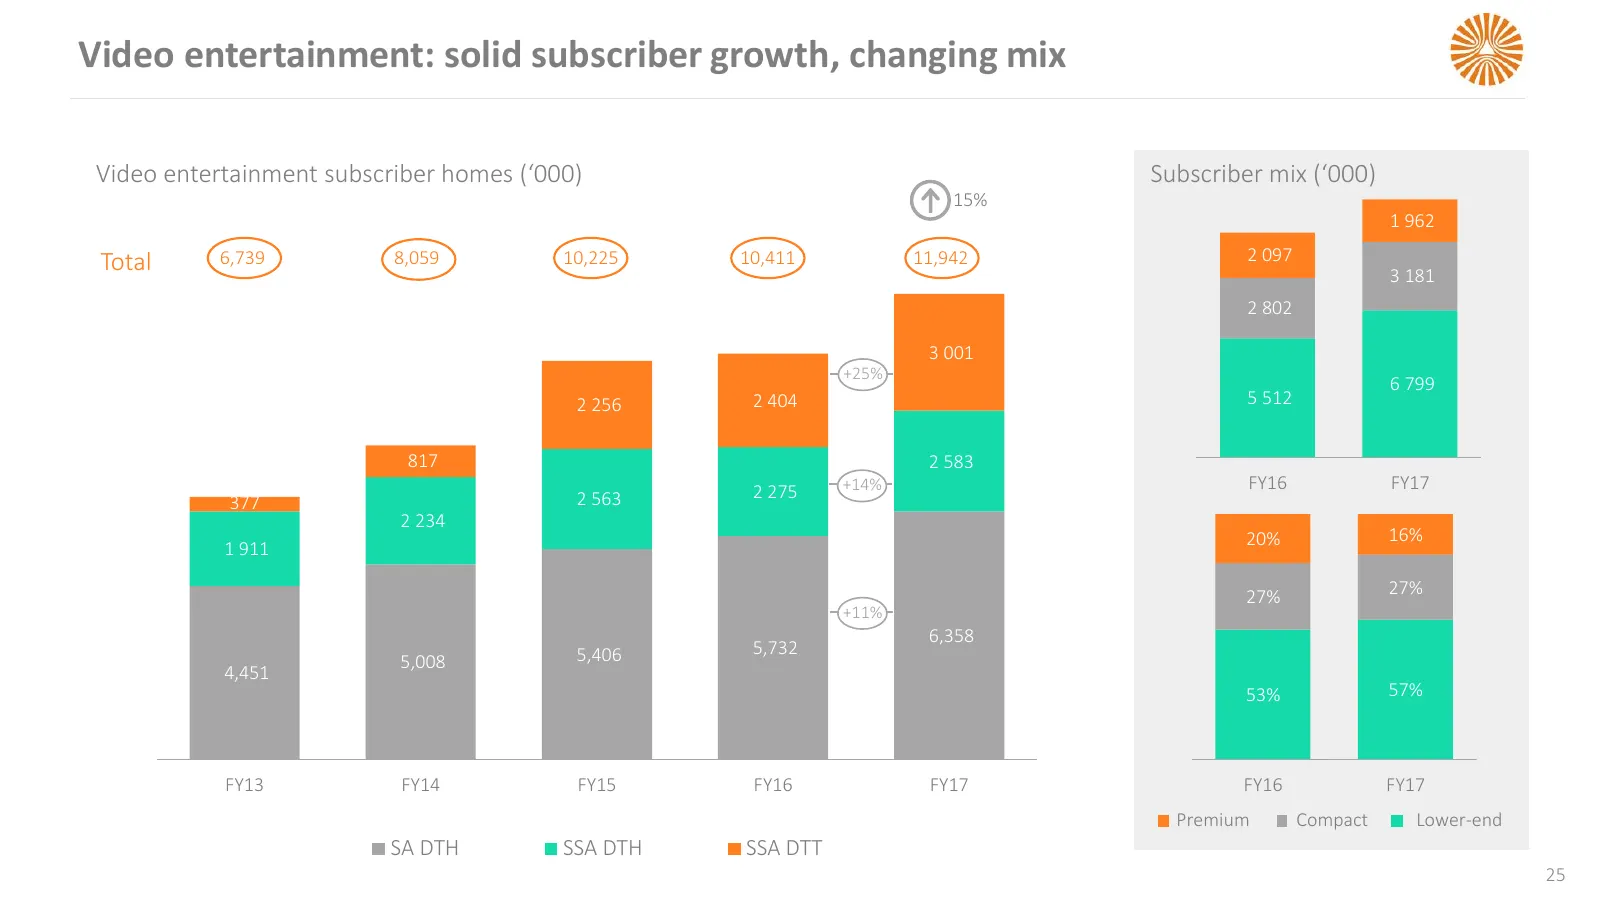
Slide 25: Video entertainment: solid subscriber growth, changing mix
Video entertainment: solid subscriber growth, changing mix Video entertainment subscriber homes (‘000) Subscriber mix (‘000) 15% 1 962 Total 6,739 8,059 10,225 10,411 11,942 2 097 3 181 2 802 3 001 +25% 6 799 2 256 2 404 5 512 817 2 583 2 275 +14% FY16 FY17 377 2 563 2 234 20% 16% 1 911 27% 27% +11%
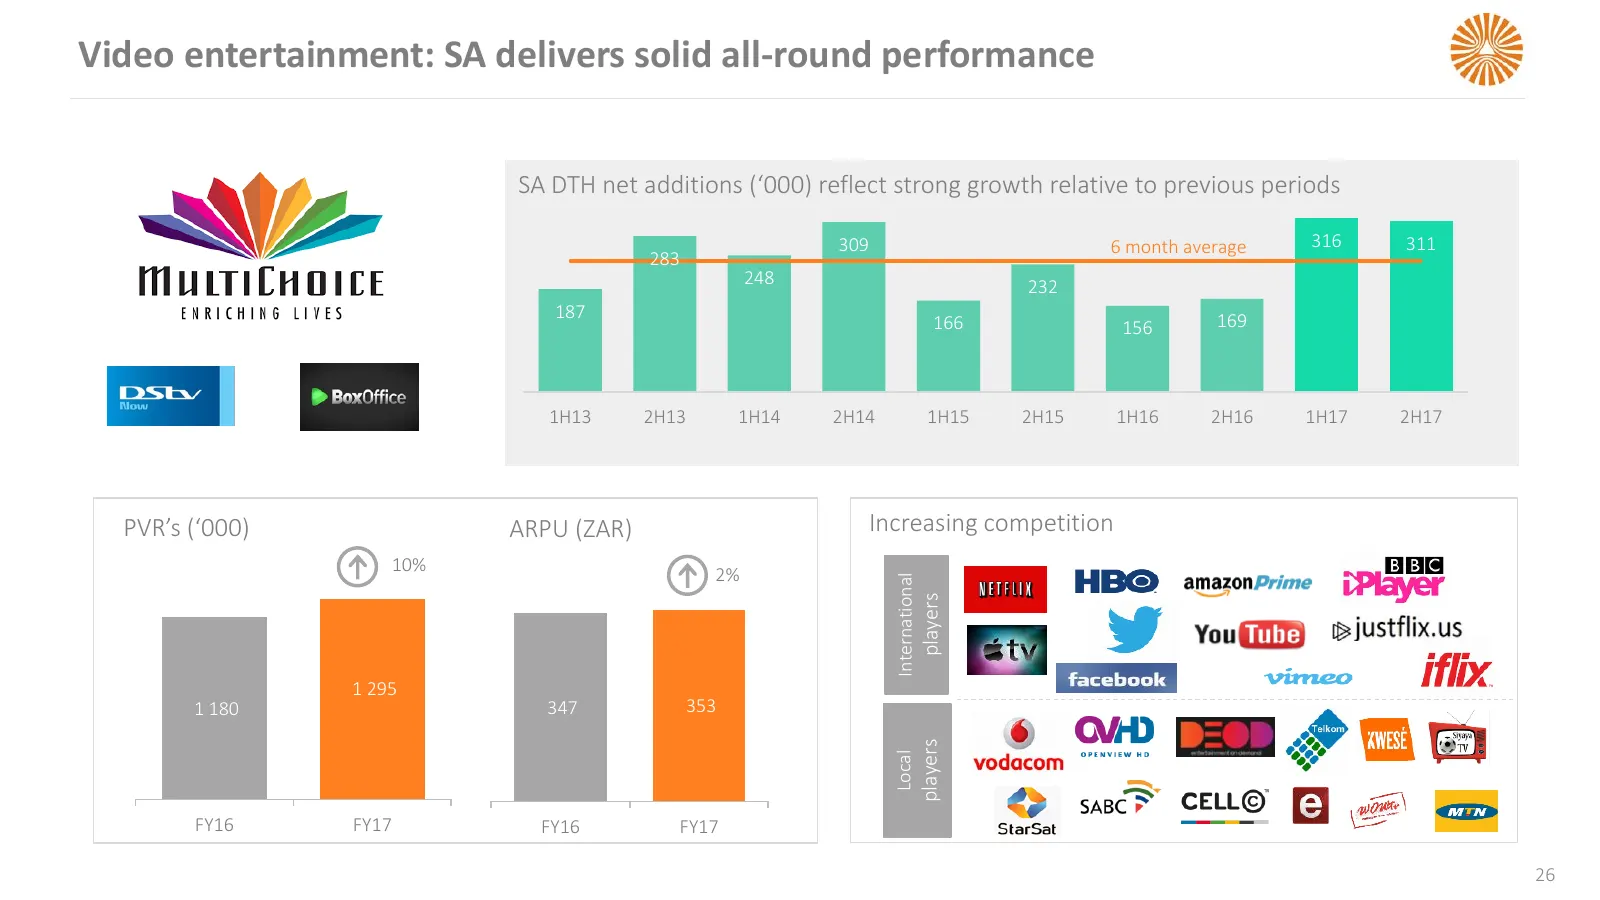
Slide 26: Video entertainment: SA delivers solid all-round performance
Video entertainment: SA delivers solid all-round performance SA DTH net additions (‘000) reflect strong growth relative to previous periods 309 6 month average 316 311 283 248 232 187 169 166 156 1H13 2H13 1H14 2H14 1H15 2H15 1H16 2H16 1H17 2H17 PVR’s (‘000) ARPU (ZAR) Increasing competition 10% 2%
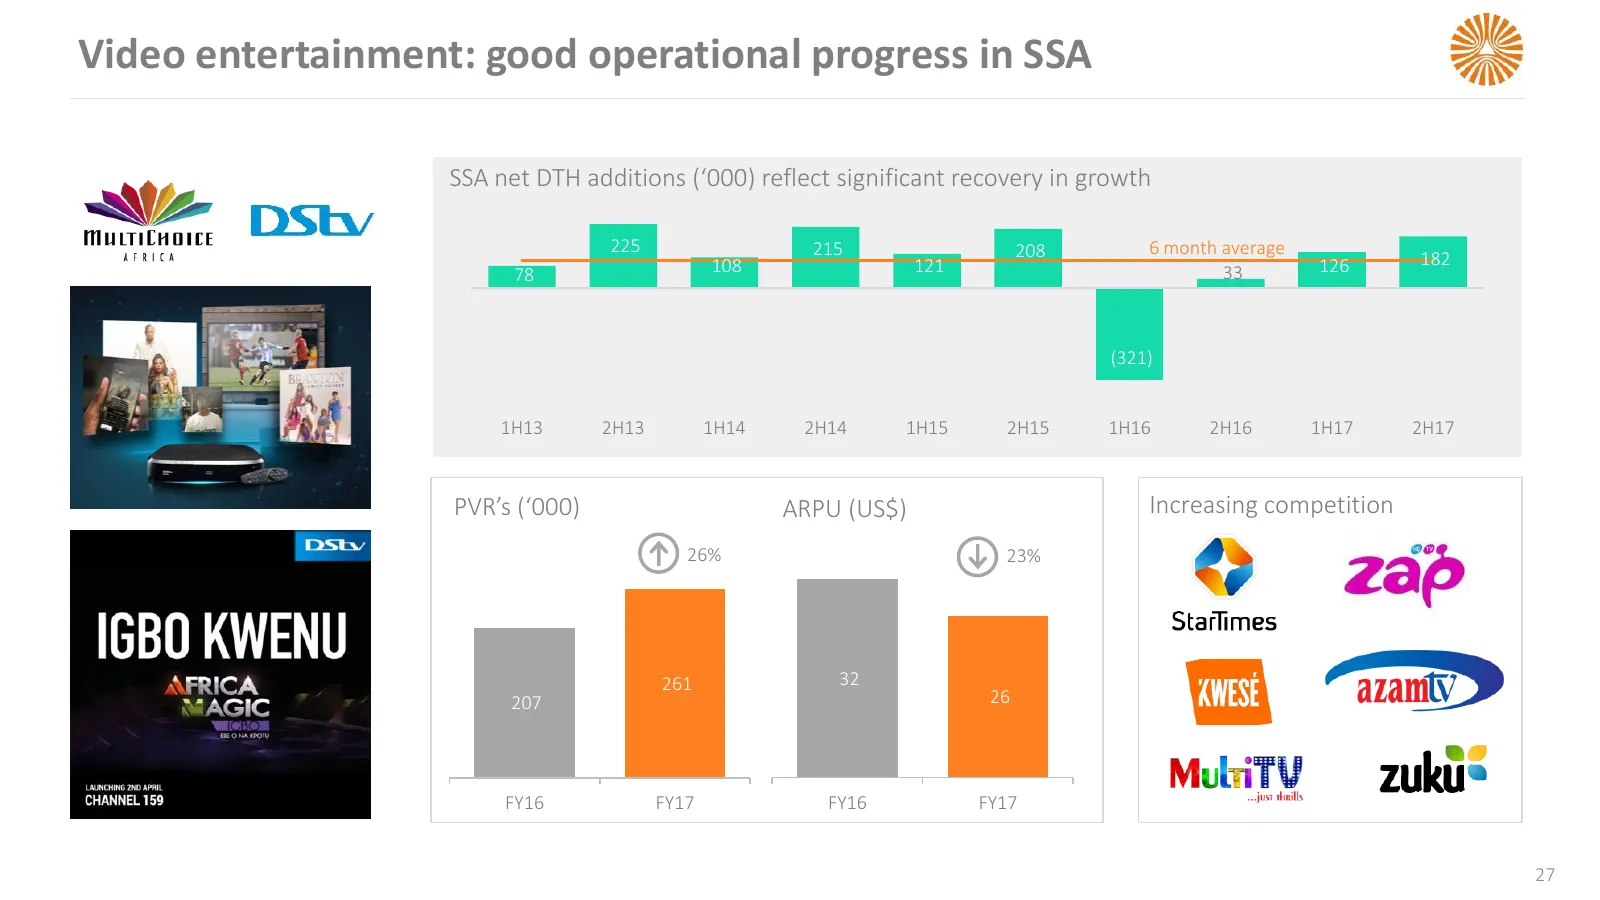
Slide 27: Video entertainment: good operational progress in SSA
Video entertainment: good operational progress in SSA SSA net DTH additions (‘000) reflect significant recovery in growth 225 215 208 6 month average 108 121 126 182 78 33 (321) 1H13 2H13 1H14 2H14 1H15 2H15 1H16 2H16 1H17 2H17 PVR’s (‘000) ARPU (US$) Increasing competition 26% 23% 261 32 207 26 FY1
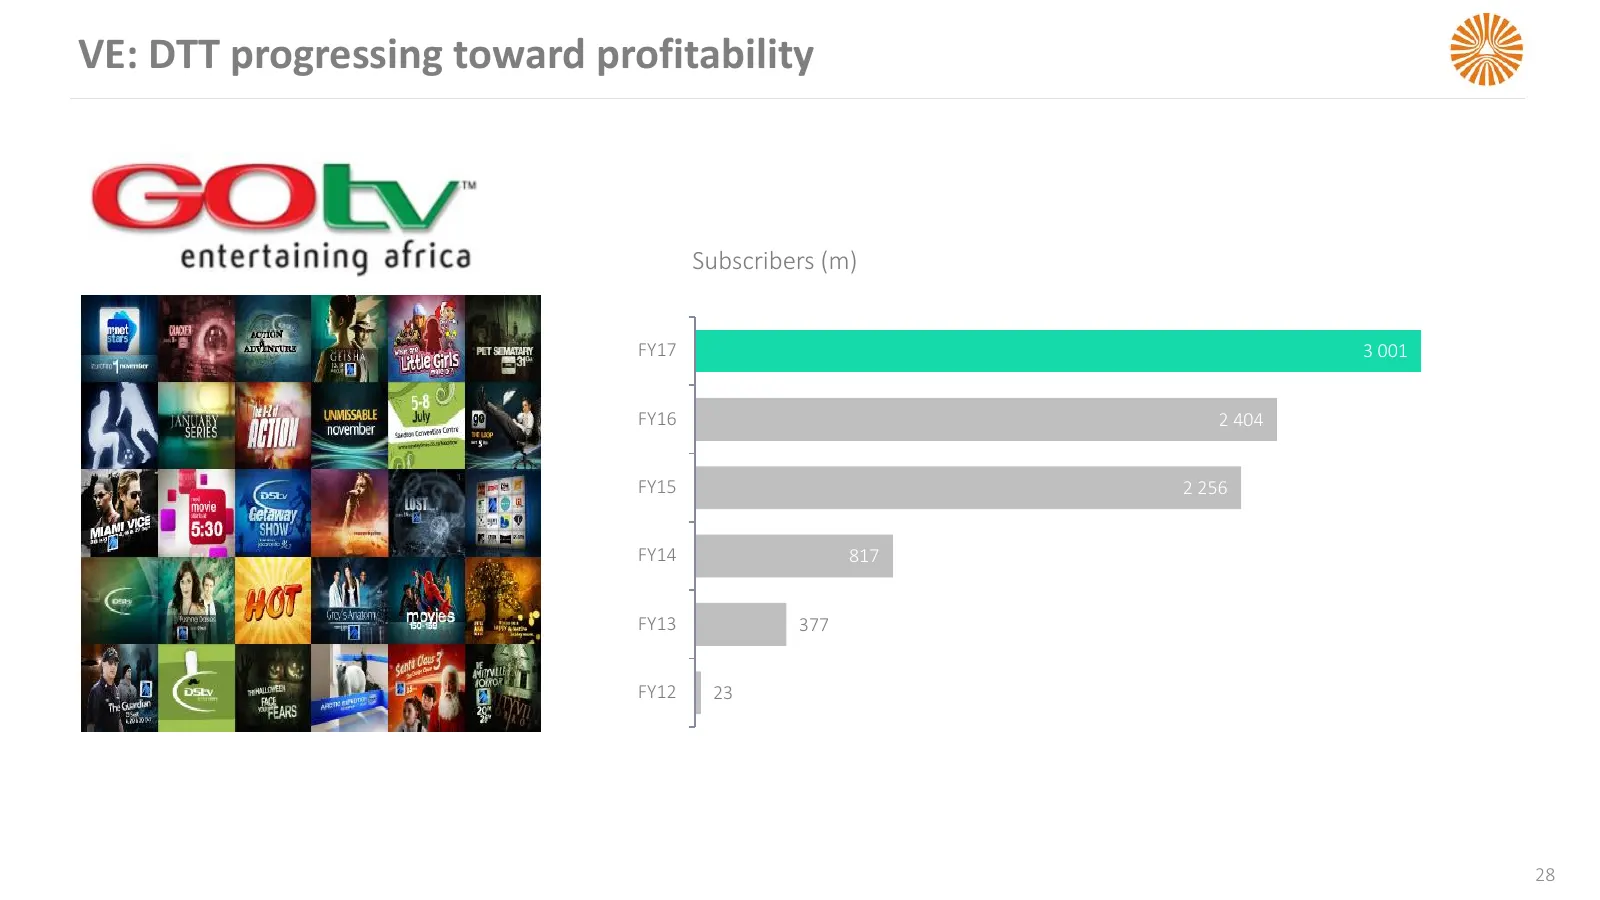
Slide 28: VE: DTT progressing toward profitability
VE: DTT progressing toward profitability Subscribers (m) FY17 3 001 FY16 2 404 FY15 2 256 FY14 817 FY13 377 FY12 23 28

Slide 29: Financials
FINANCIALS
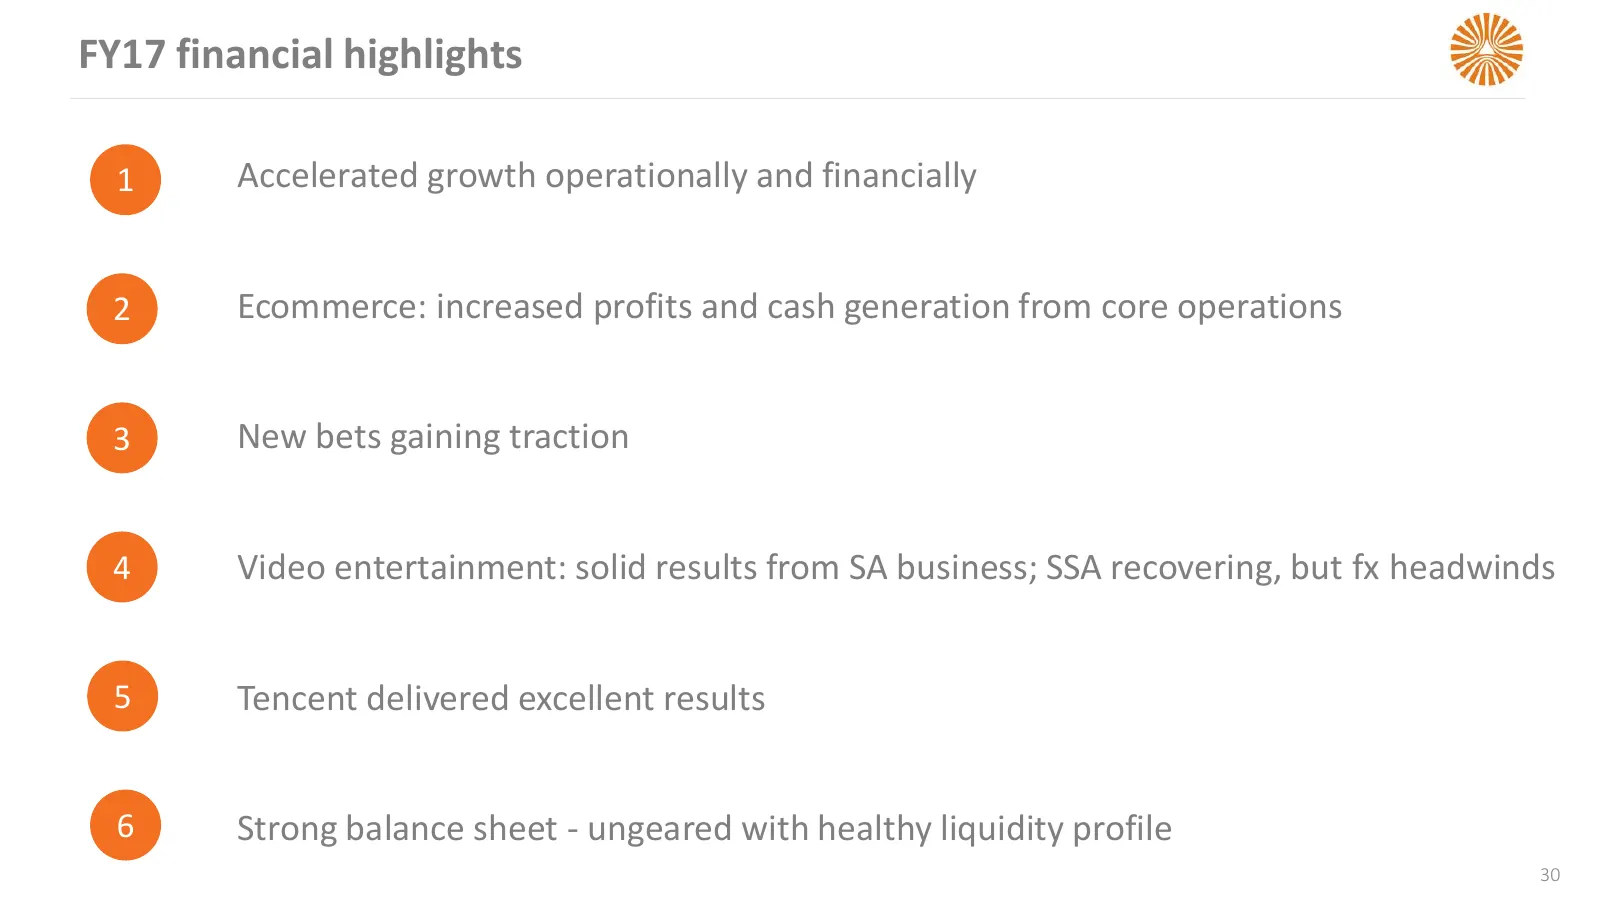
Slide 30: FY17 financial highlights
FY17 financial highlights 1 Accelerated growth operationally and financially 2 Ecommerce: increased profits and cash generation from core operations 3 New bets gaining traction 4 Video entertainment: solid results from SA business; SSA recovering, but fx headwinds 5 Tencent delivered excellent resul
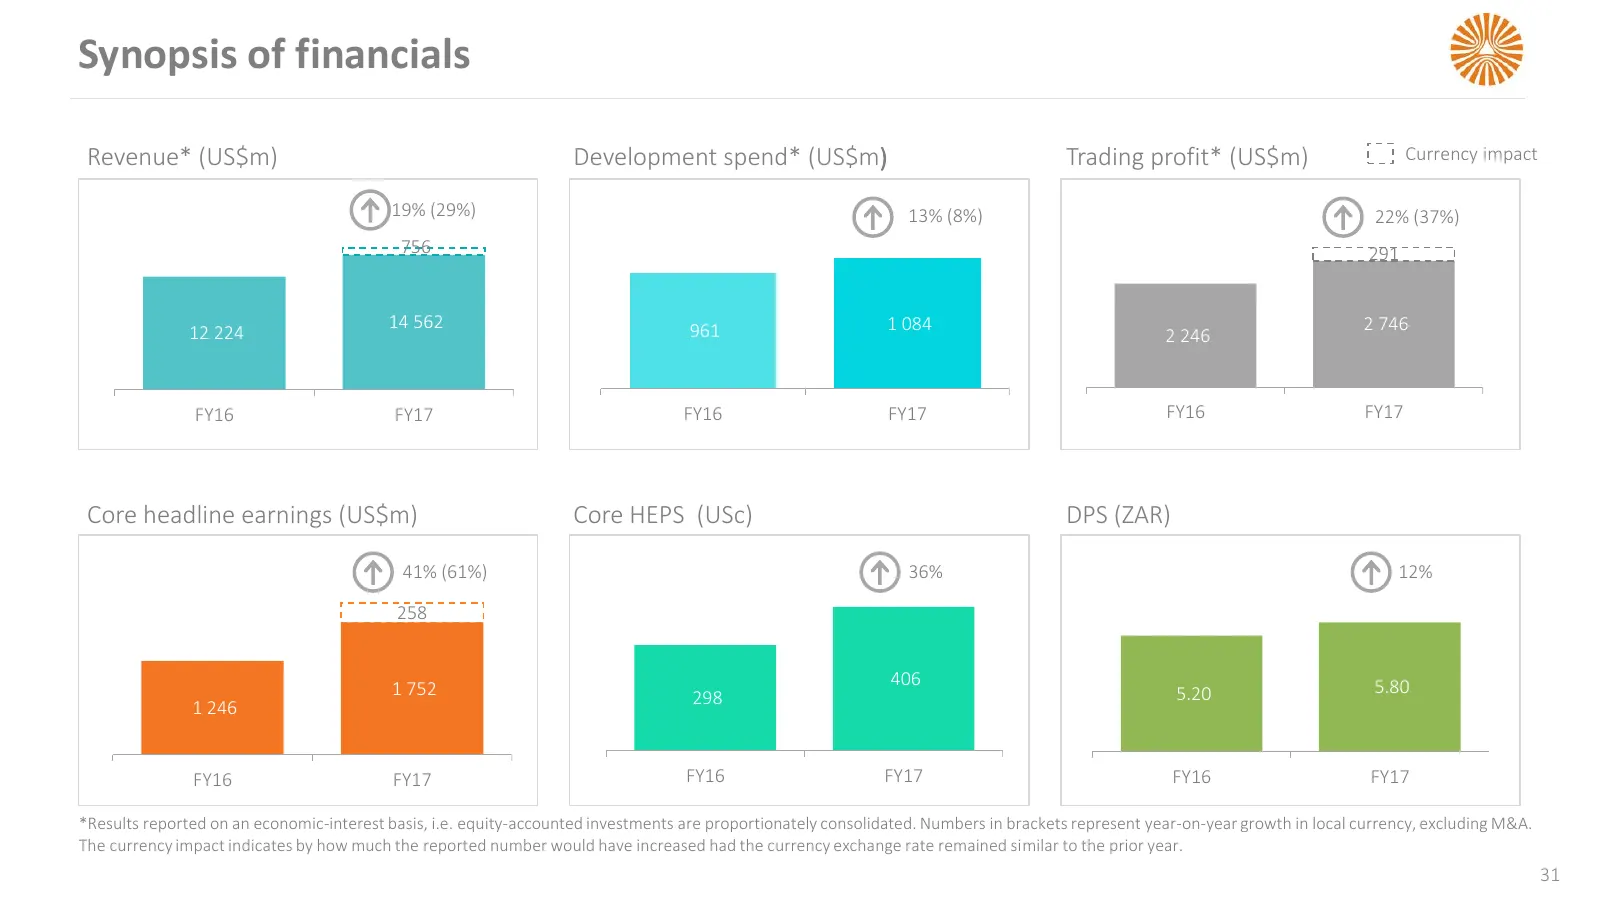
Slide 31: Synopsis of financials
Synopsis of financials Revenue* (US$m) Development spend* (US$m) Trading profit* (US$m) Currency impact 19% (29%) 13% (8%) 22% (37%) 756 291 14 562 961 1 084 2 746 12 224 2 246 FY16 FY17 FY16 FY17 FY16 FY17 Core headline earnings (US$m) Core HEPS (USc) DPS (ZAR) 41% (61%) 36% 12% 258 406 5.80 1 752
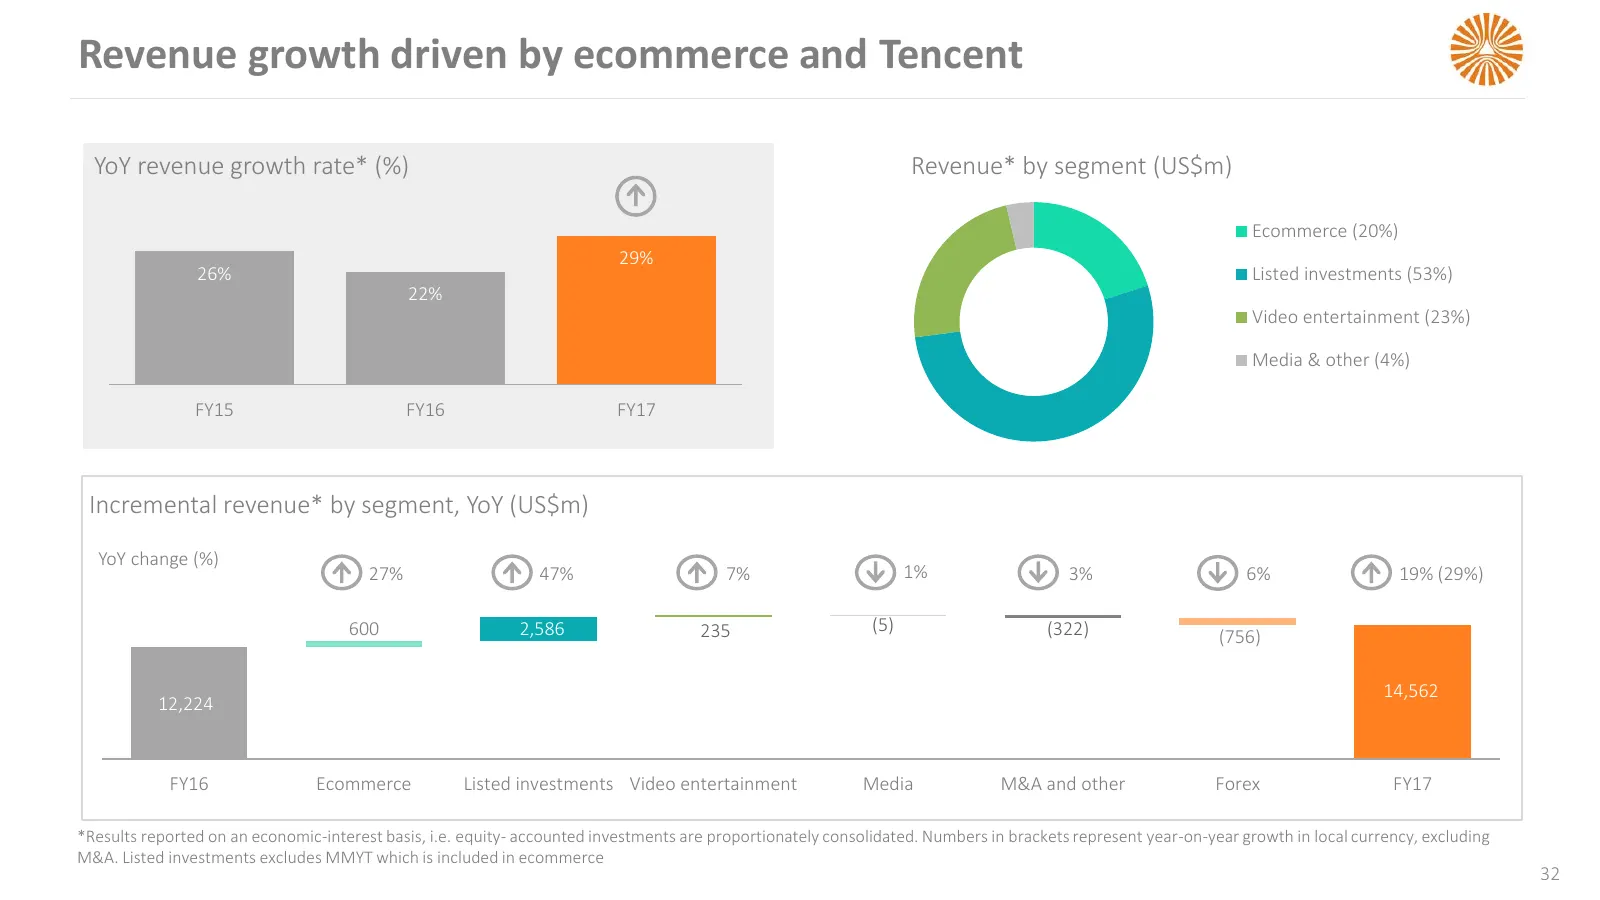
Slide 32: Revenue growth driven by ecommerce and Tencent
Revenue growth driven by ecommerce and Tencent YoY revenue growth rate* (%) Revenue* by segment (US$m) Ecommerce (20%) 29% 26% Listed investments (53%) 22% Video entertainment (23%) Media & other (4%) FY15 FY16 FY17 Incremental revenue* by segment, YoY (US$m) YoY change (%) 27% 47% 7% 1% 3% 6% 19% (
Slide 33: Development spend higher due to new growth initiatives
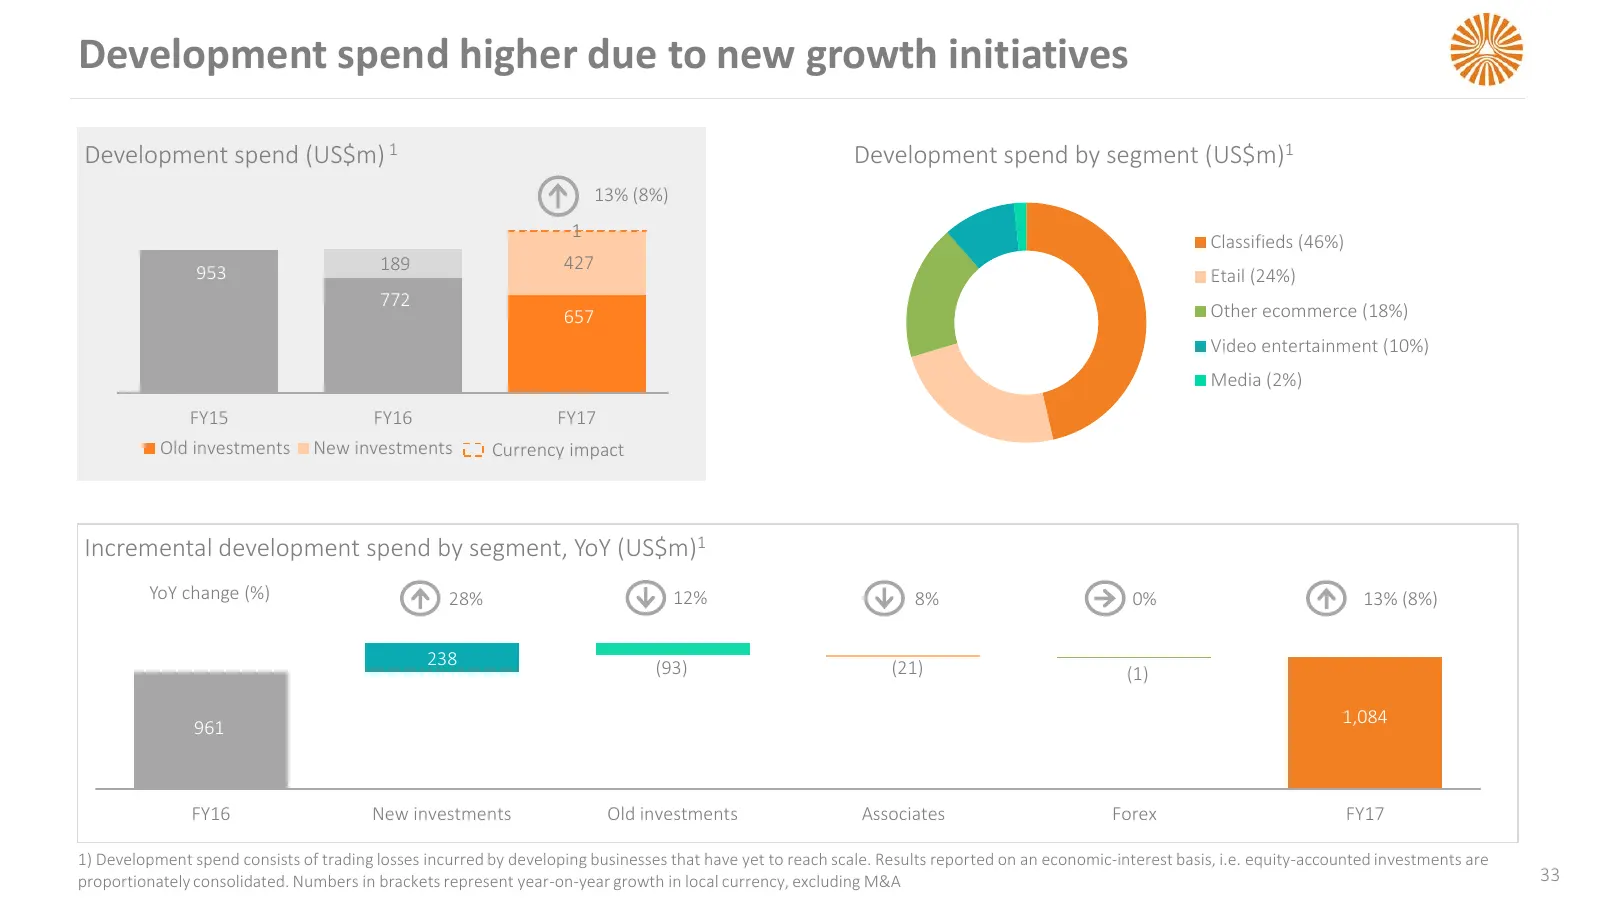
Development spend higher due to new growth initiatives Development spend (US$m) 1 Development spend by segment (US$m)1 13% (8%) 1 Classifieds (46%) 953 189 427 Etail (24%) 772 657 Other ecommerce (18%) Video entertainment (10%) Media (2%) FY15 FY16 FY17 Old investments New investments Currency impac
Slide 34: Ecommerce: accelerating growth
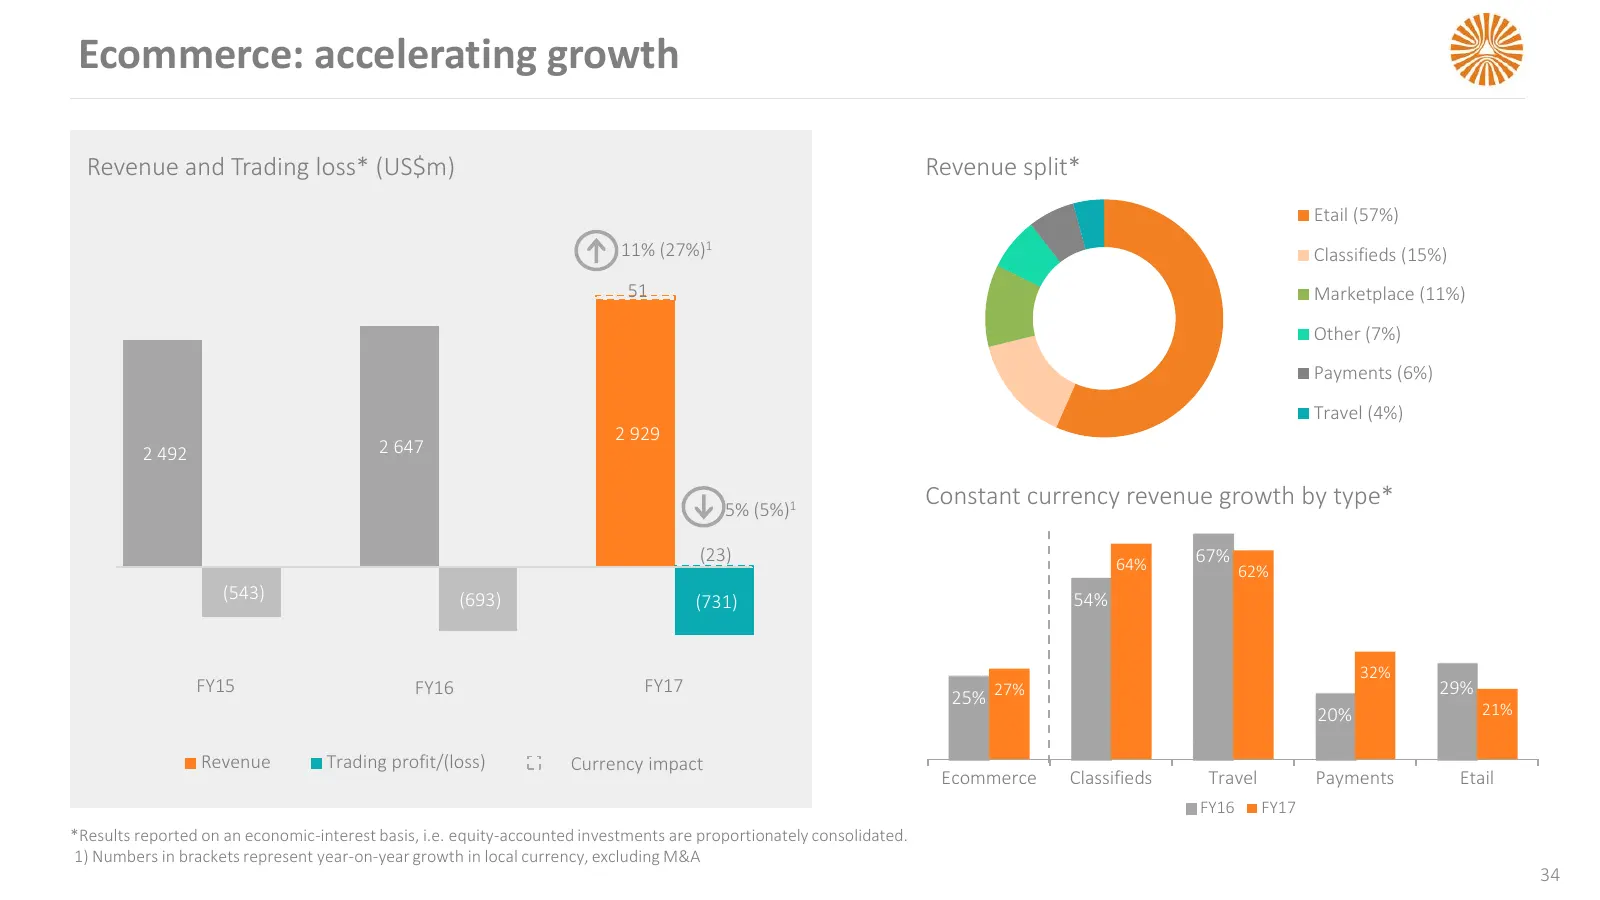
Ecommerce: accelerating growth Revenue and Trading loss* (US$m) Revenue split* Etail (57%) 11% (27%)1 Classifieds (15%) 51 Marketplace (11%) Other (7%) Payments (6%) Travel (4%) 2 929 2 492 2 647 5% (5%)1 Constant currency revenue growth by type* (23) 64% 67% 62% (543) (693) (731) 54% 32% FY15 FY16
Slide 35: Increase in number of profitable ecommerce entities
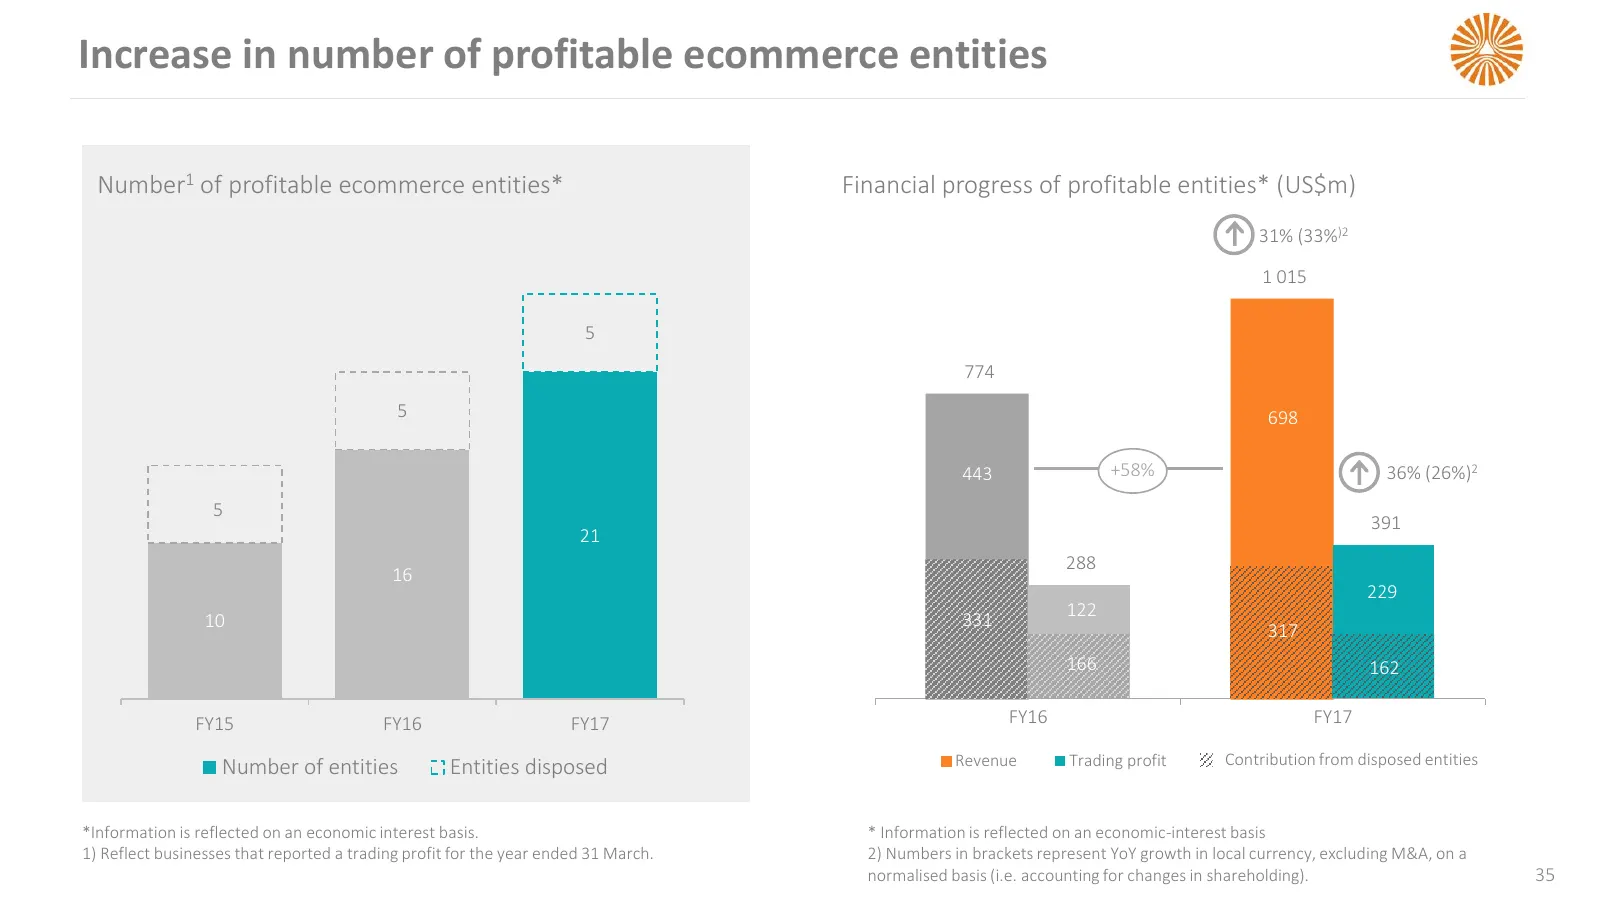
Increase in number of profitable ecommerce entities Number1 of profitable ecommerce entities* Financial progress of profitable entities* (US$m) 31% (33%)2 1 015 5 774 5 698 443 +58% 36% (26%)2 5 391 21 288 16 229 122 10 331 317 166 162 FY15 FY16 FY17 FY16 FY17 Number of entities Entities disposed Re
Slide 36: Classifieds: OLX Group moving toward profitability in core platform
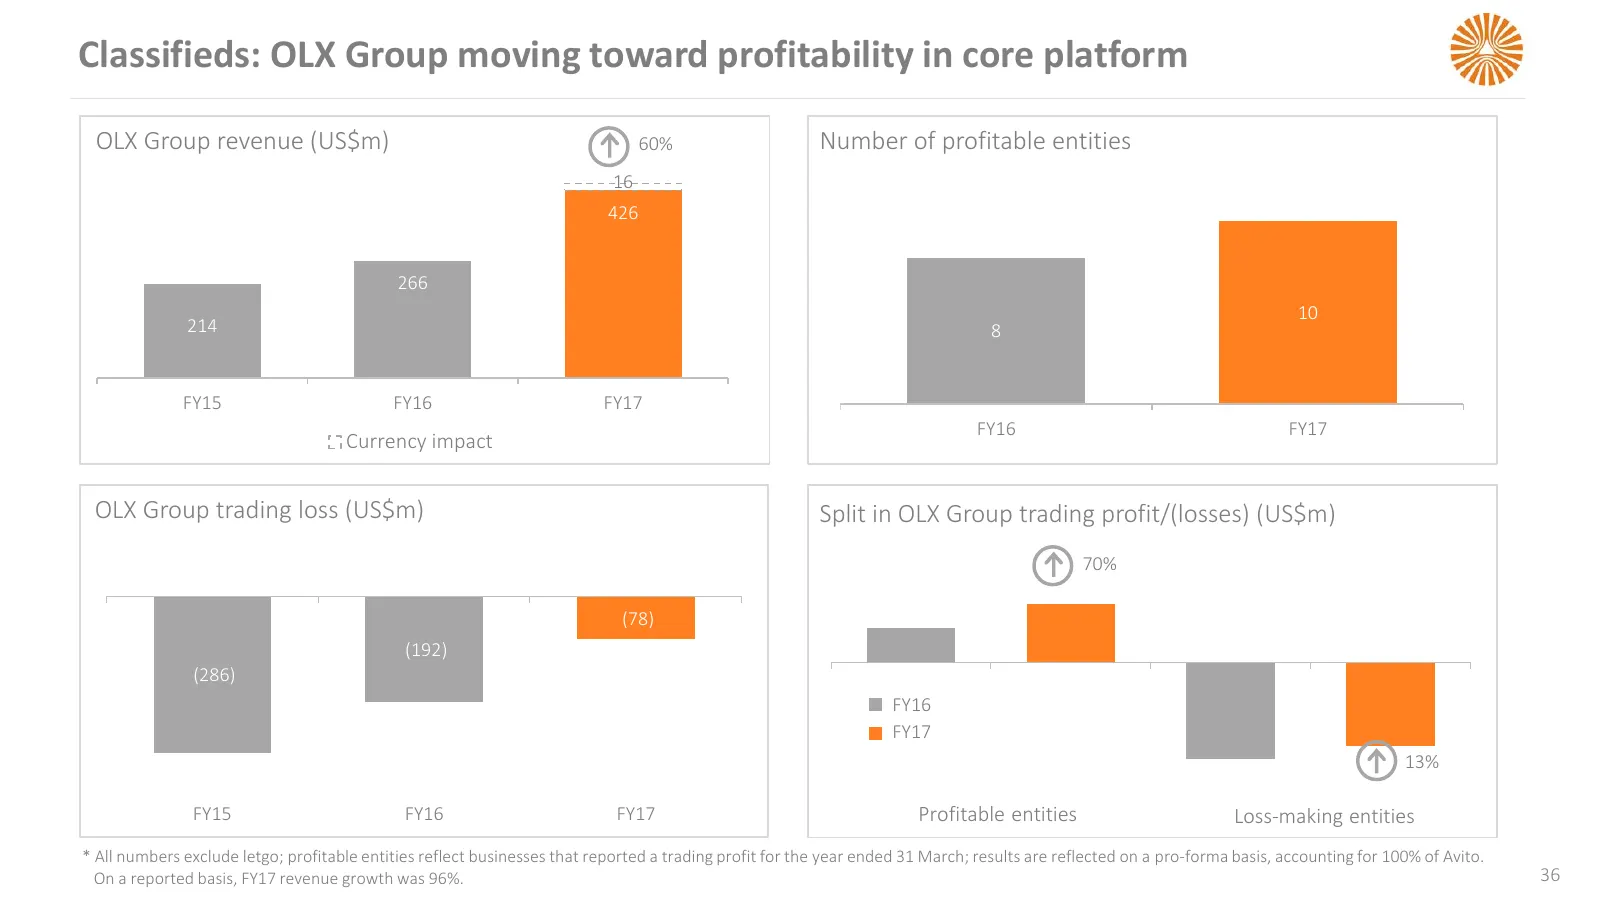
Classifieds: OLX Group moving toward profitability in core platform OLX Group revenue (US$m) 60% Number of profitable entities 16 426 266 10 214 8 FY15 FY16 FY17 FY16 FY17 Currency impact OLX Group trading loss (US$m) Split in OLX Group trading profit/(losses) (US$m) Revenue 70% Revenue TP TP (78) (
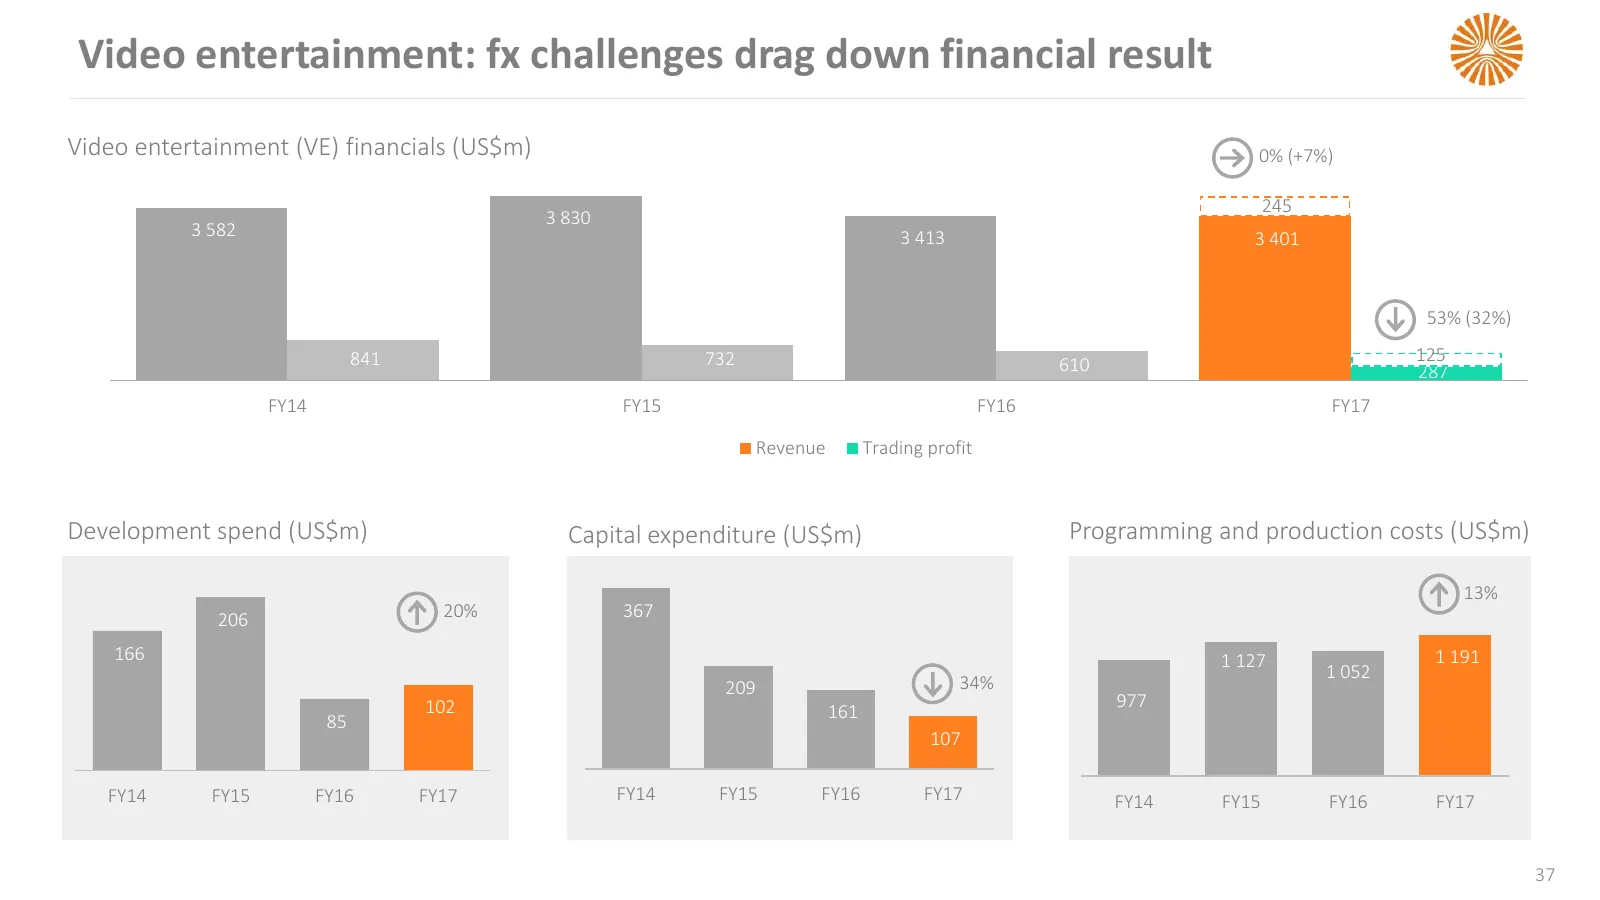
Slide 37: Video entertainment: fx challenges drag down financial result
Video entertainment: fx challenges drag down financial result Video entertainment (VE) financials (US$m) 0% (+7%) 245 3 830 3 582 3 413 3 401 53% (32%) 841 732 125 610 287 FY14 FY15 FY16 FY17 Revenue Trading profit Development spend (US$m) Capital expenditure (US$m) Programming and production costs
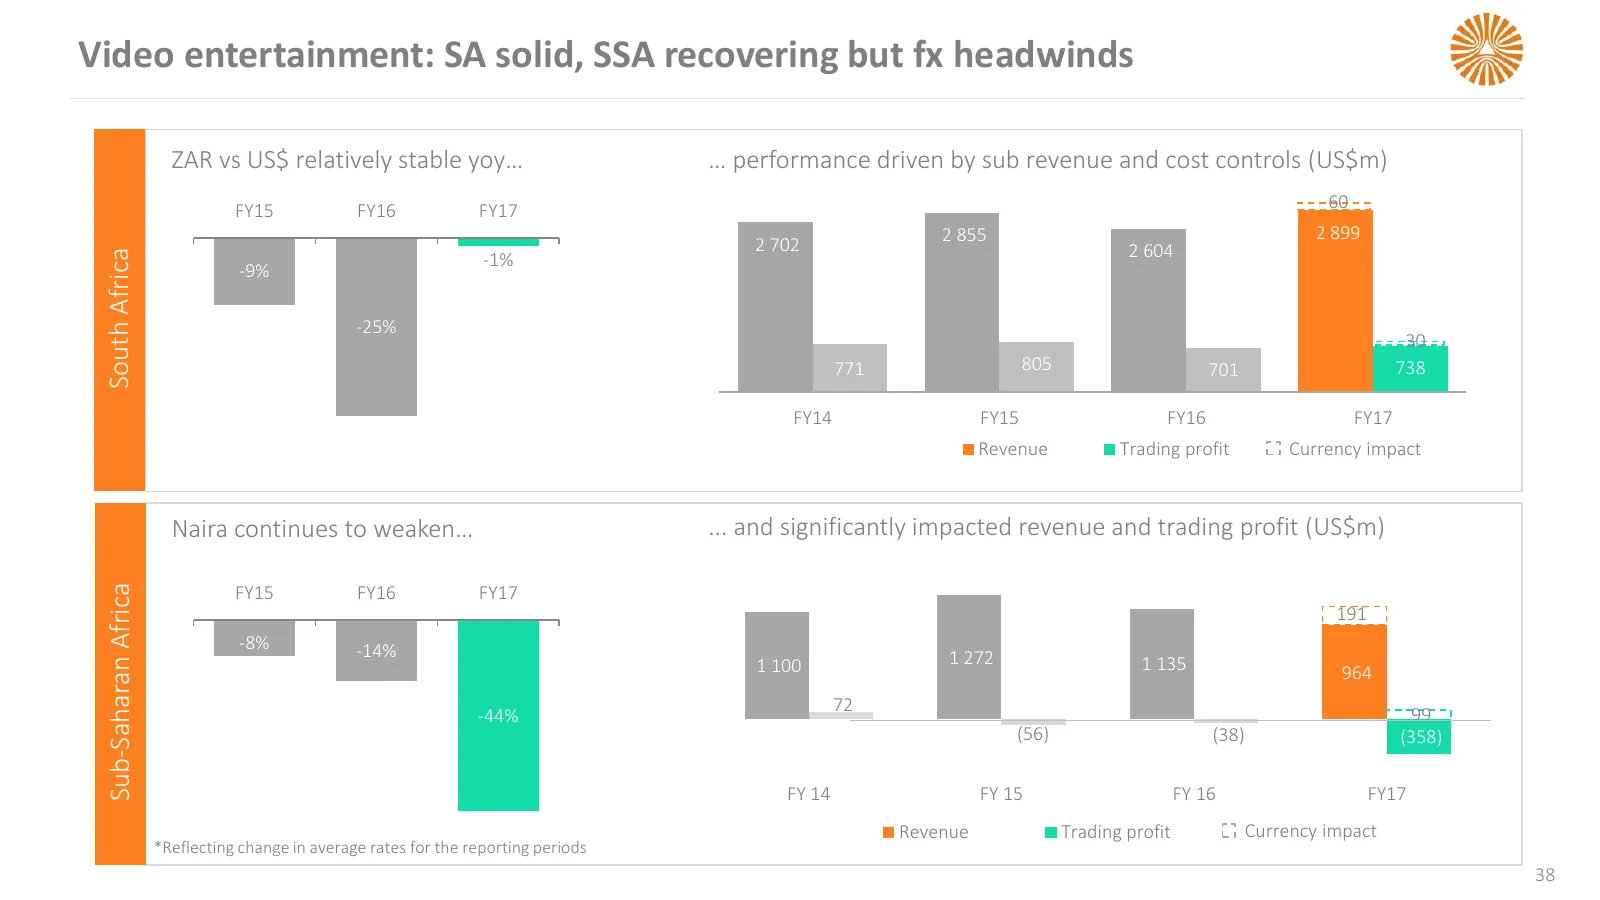
Slide 38: Video entertainment: SA solid, SSA recovering but fx headwinds
Video entertainment: SA solid, SSA recovering but fx headwinds ZAR vs US$ relatively stable yoy… … performance driven by sub revenue and cost controls (US$m) FY15 FY16 FY17 60 2 855 2 899 2 702 2 604 South Africa -1% -9% -25% 30 771 805 701 738 FY14 FY15 FY16 FY17 Revenue Trading profit Currency imp
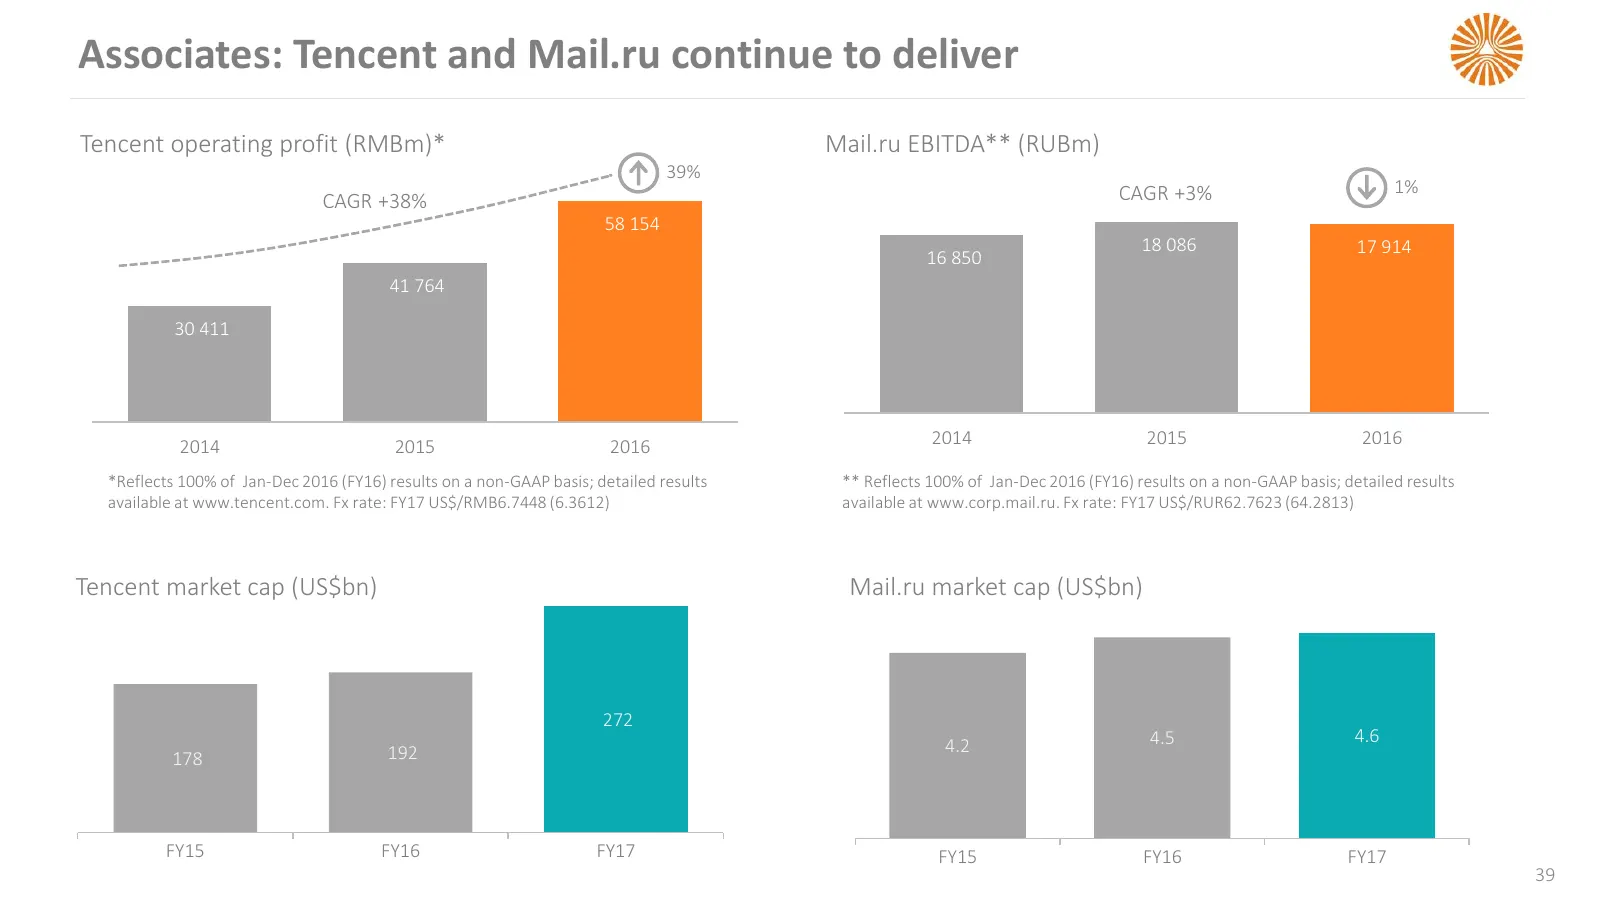
Slide 39: Associates: Tencent and Mail.ru continue to deliver
Associates: Tencent and Mail.ru continue to deliver Tencent operating profit (RMBm)* Mail.ru EBITDA** (RUBm) 39% CAGR +3% 1% CAGR +38% 58 154 18 086 17 914 16 850 41 764 30 411 2014 2015 2016 2014 2015 2016 *Reflects 100% of Jan-Dec 2016 (FY16) results on a non-GAAP basis; detailed results ** Reflec
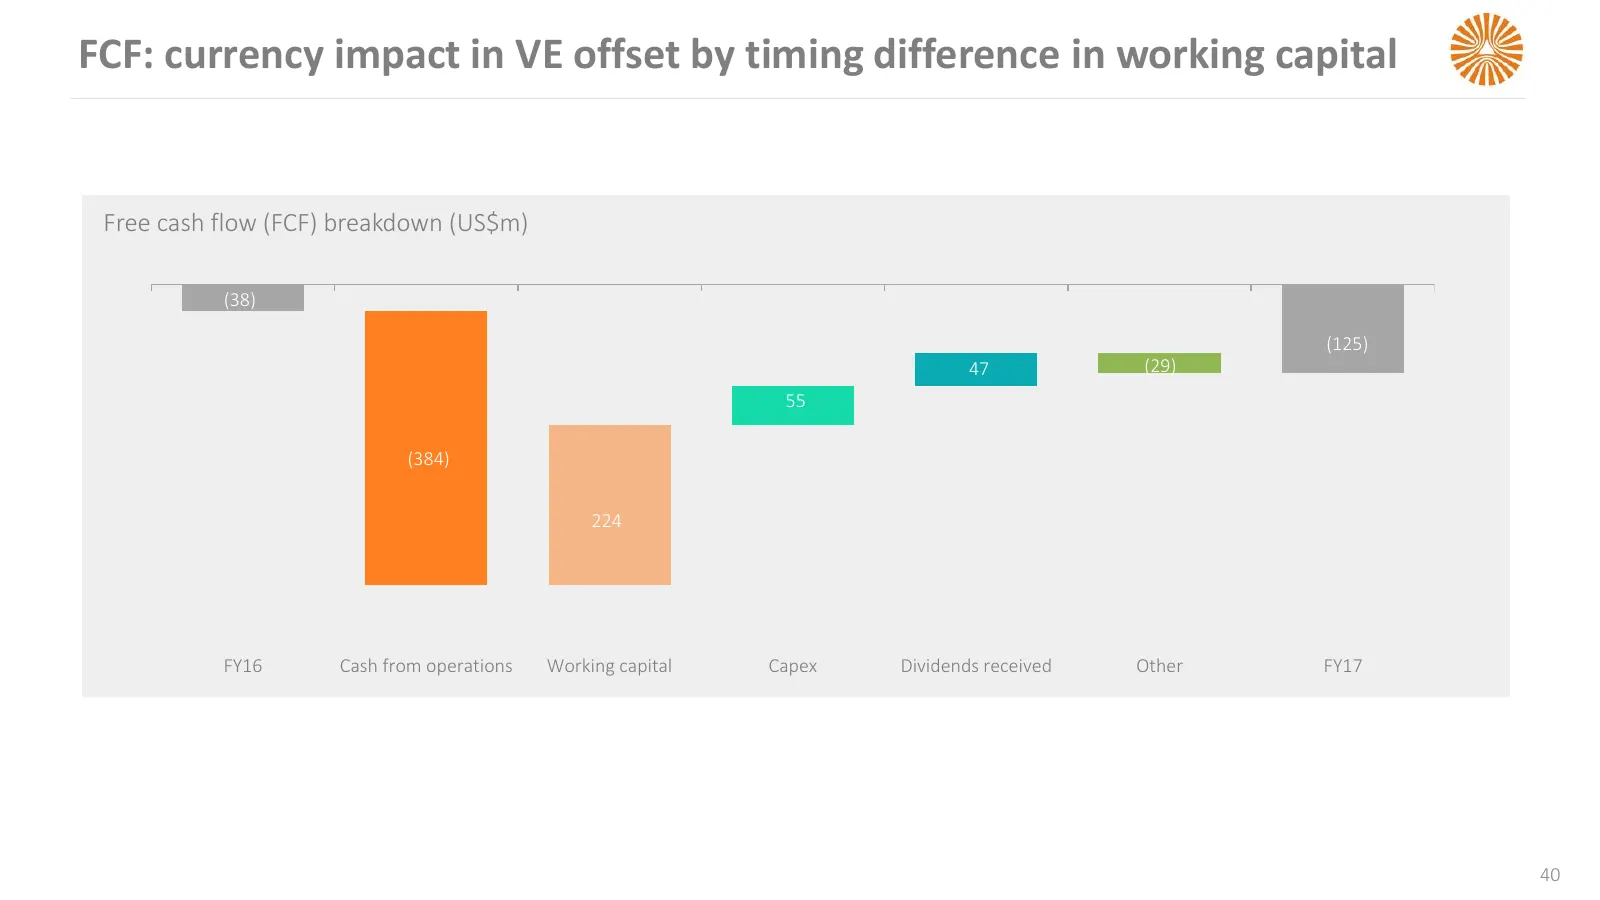
Slide 40: FCF: currency impact in VE offset by timing difference in working capital
FCF: currency impact in VE offset by timing difference in working capital Free cash flow (FCF) breakdown (US$m) (38) (125) 47 (29) 55 (384) 224 FY16 Cash from operations Working capital Capex Dividends received Other FY17 40
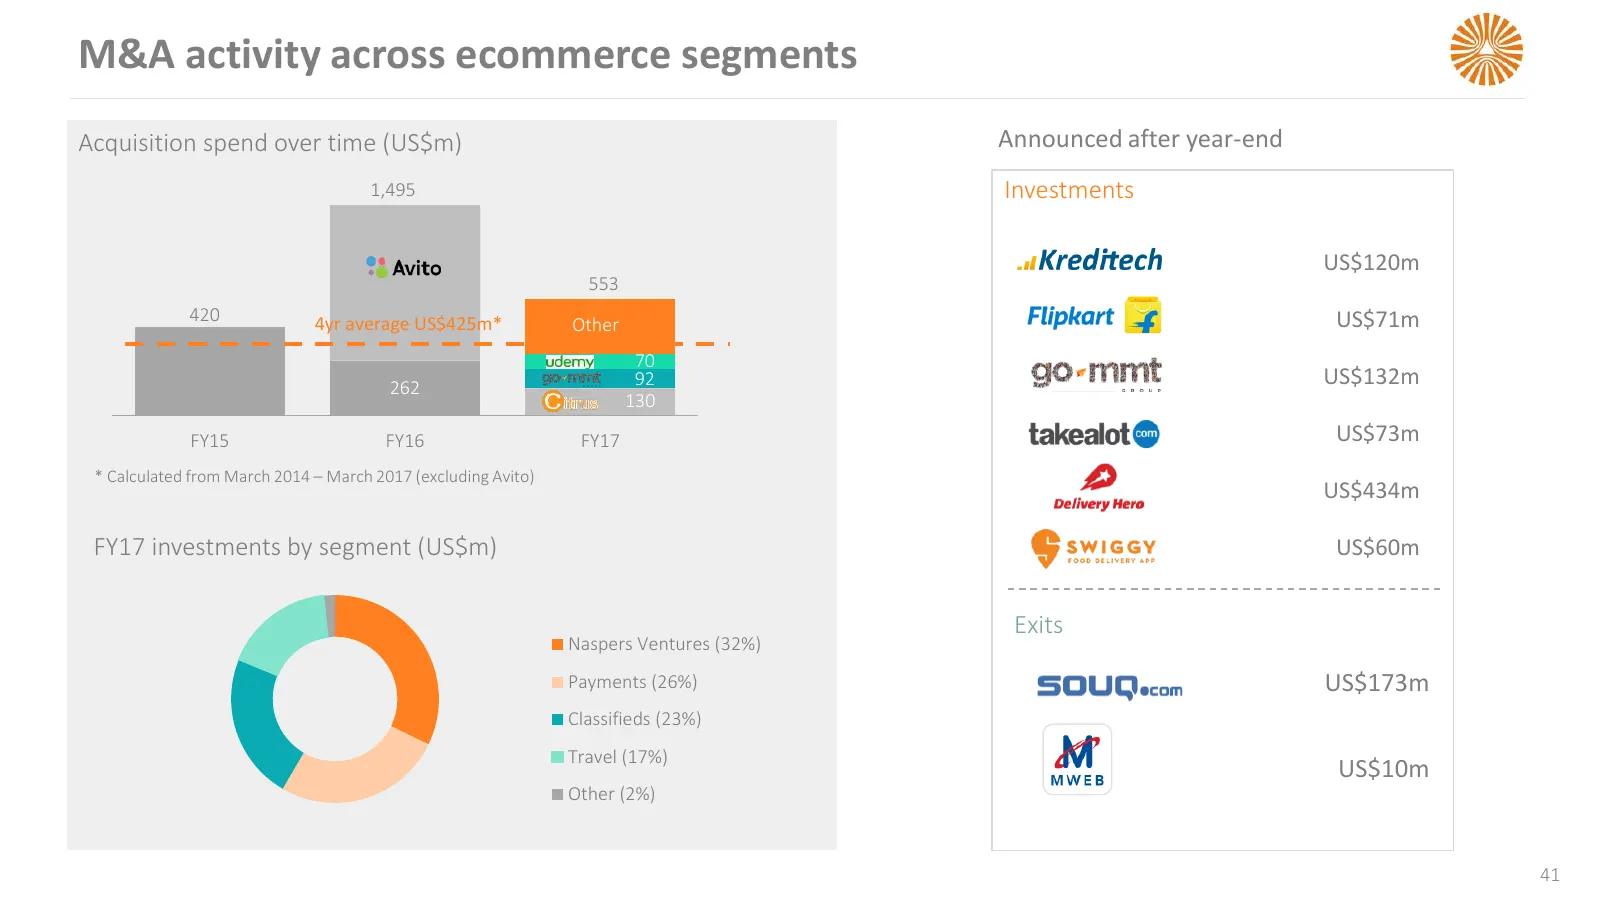
Slide 41: M&A activity across ecommerce segments
M&A activity across ecommerce segments Acquisition spend over time (US$m) Announced after year-end 1,495 Investments US$120m 553 420 4yr average US$425m* US$71m Other 70 262 92 US$132m 130 FY15 FY16 FY17 US$73m * Calculated from March 2014 – March 2017 (excluding Avito) US$434m FY17 investments by s
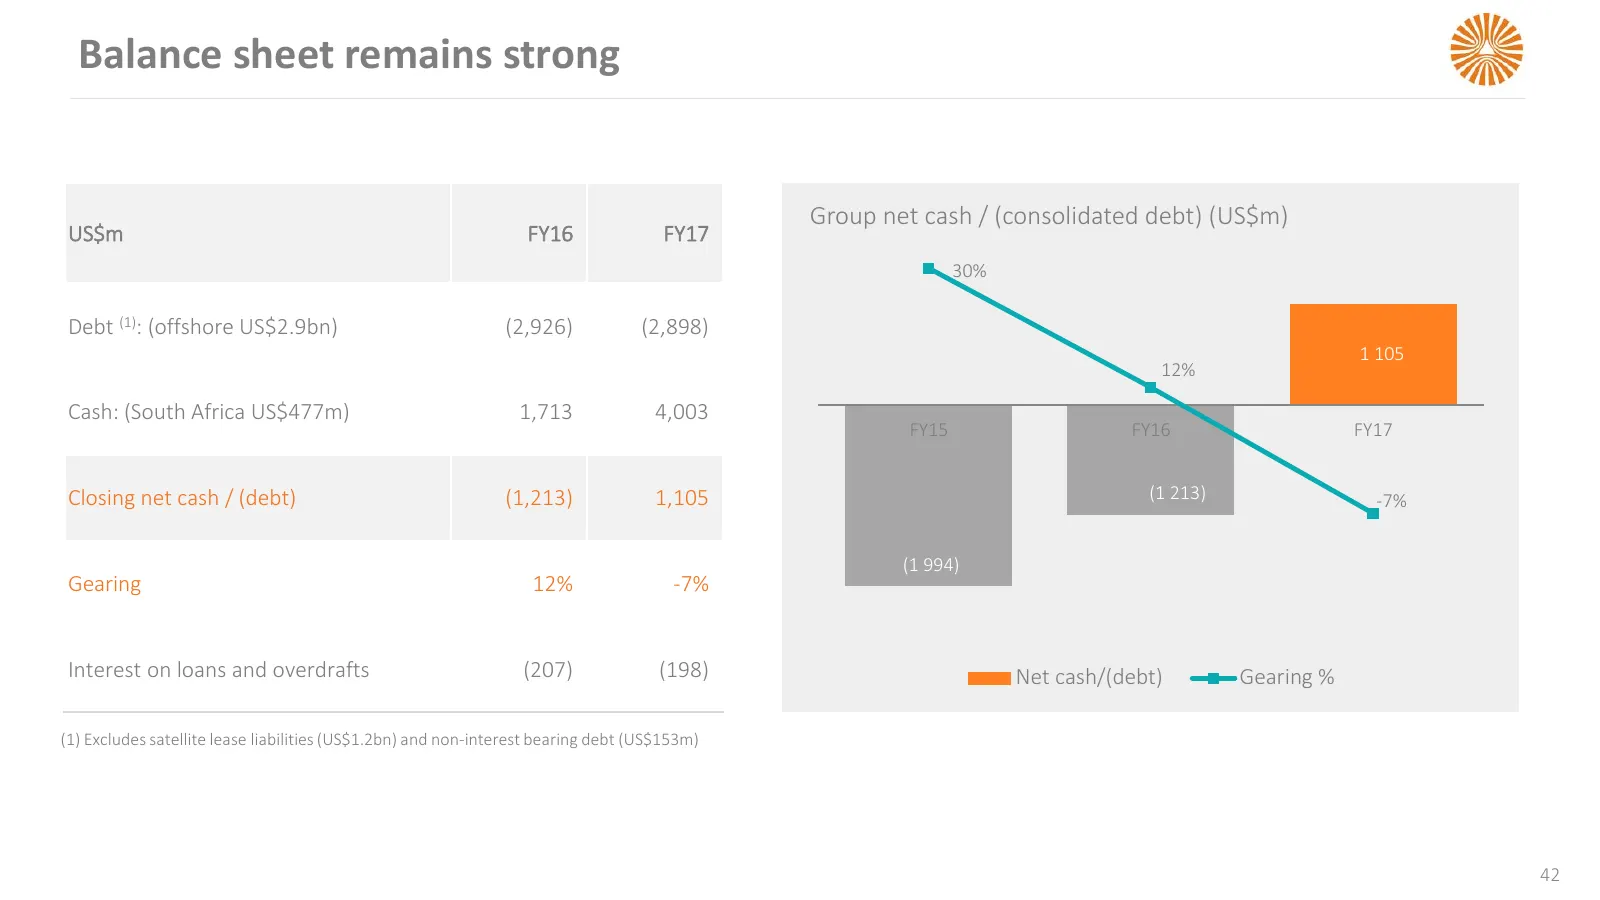
Slide 42: Balance sheet remains strong
Balance sheet remains strong Group net cash / (consolidated debt) (US$m) US$m FY16 FY17 30% 25% Debt (1): (offshore US$2.9bn) (2,926) (2,898) 1 105 12% 15% Cash: (South Africa US$477m) 1,713 4,003 FY15 FY16 FY17 5% Closing net cash / (debt) (1,213) 1,105 (1 213) -7% -5% (1 994) -15% Gearing 12% -7%

Slide 43: Outlook
OUTLOOK
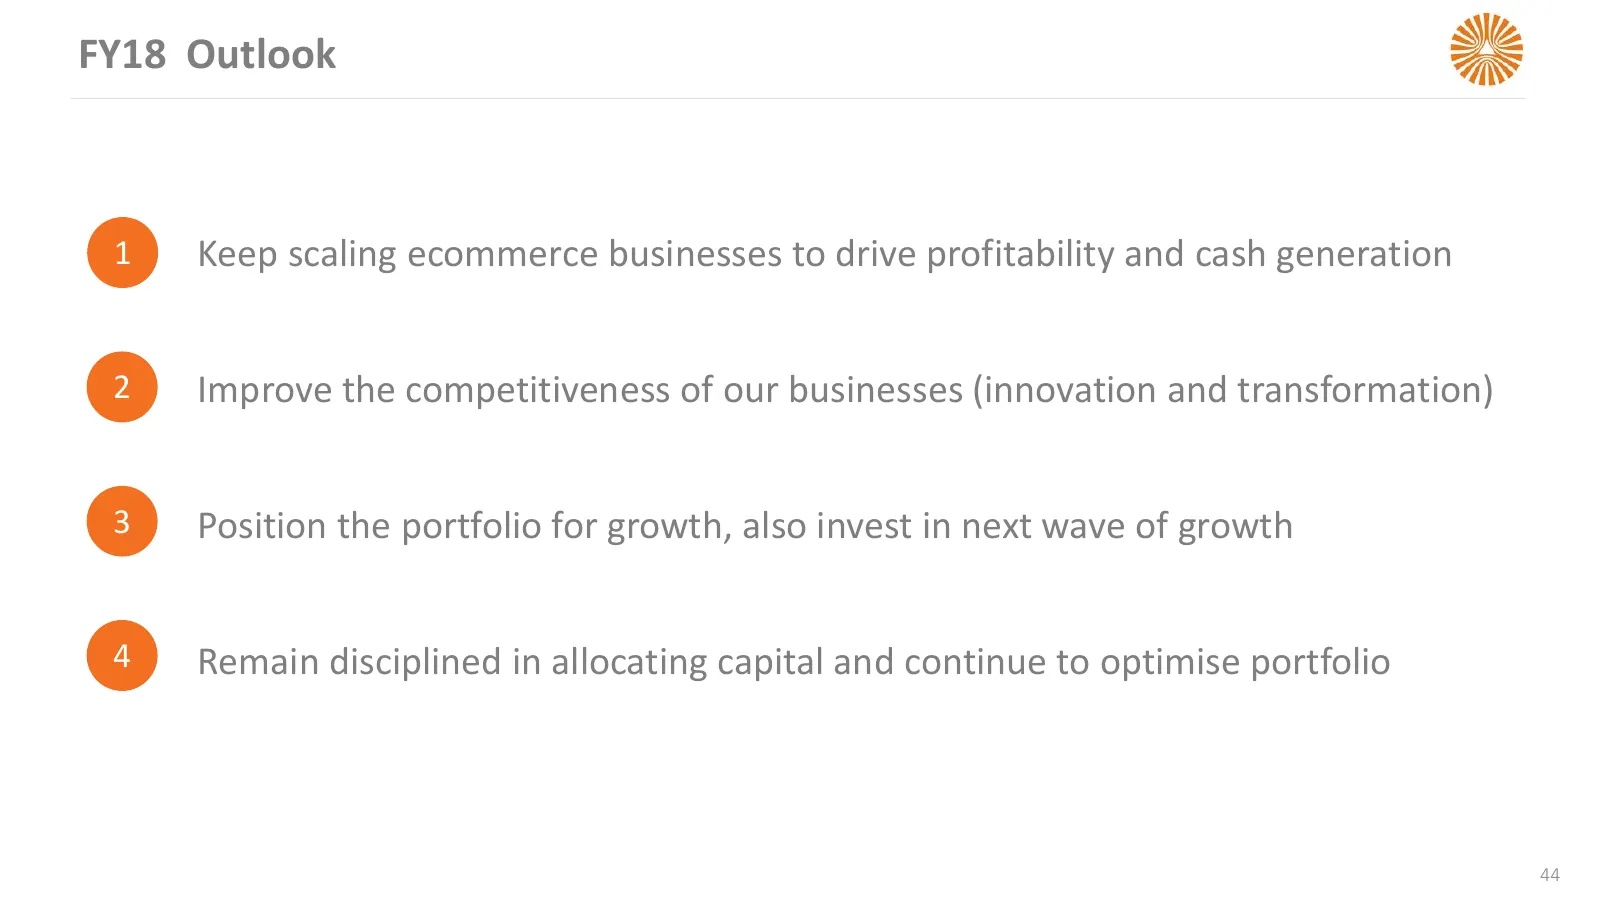
Slide 44: FY18 Outlook
FY18 Outlook 1 Keep scaling ecommerce businesses to drive profitability and cash generation 2 Improve the competitiveness of our businesses (innovation and transformation) 3 Position the portfolio for growth, also invest in next wave of growth 4 Remain disciplined in allocating capital and continue

Slide 45: Appendix
APPENDIX
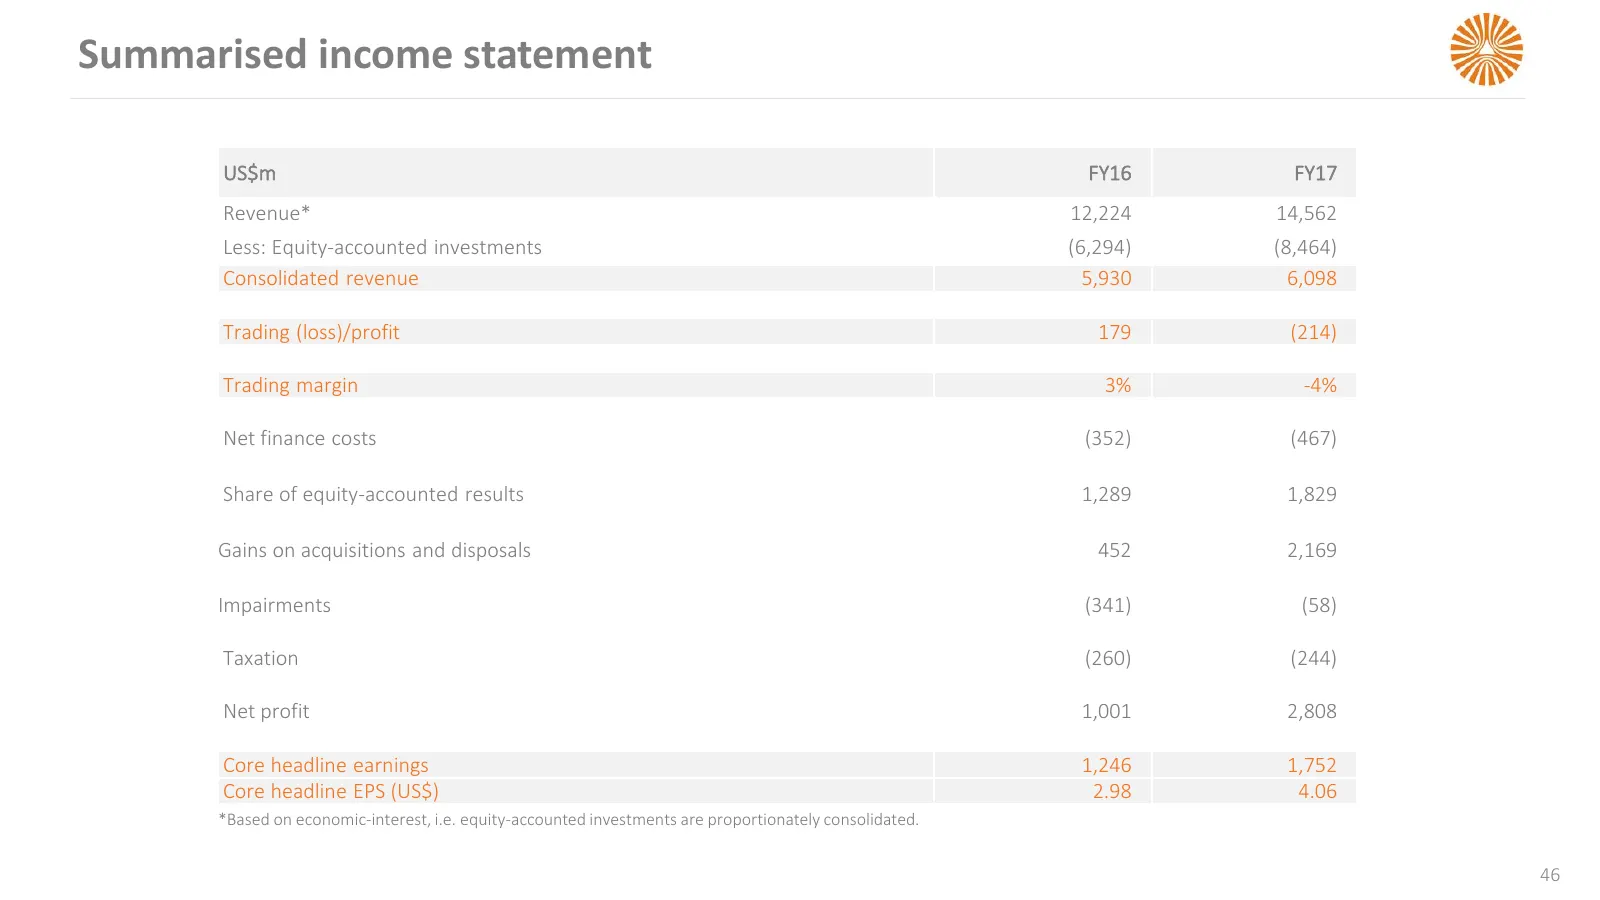
Slide 46: Summarised income statement
Summarised income statement US$m FY16 FY17 Revenue* 12,224 14,562 Less: Equity-accounted investments (6,294) (8,464) Consolidated revenue 5,930 6,098 Trading (loss)/profit 179 (214) Trading margin 3% -4% Net finance costs (352) (467) Share of equity-accounted results 1,289 1,829 Gains on acquisition
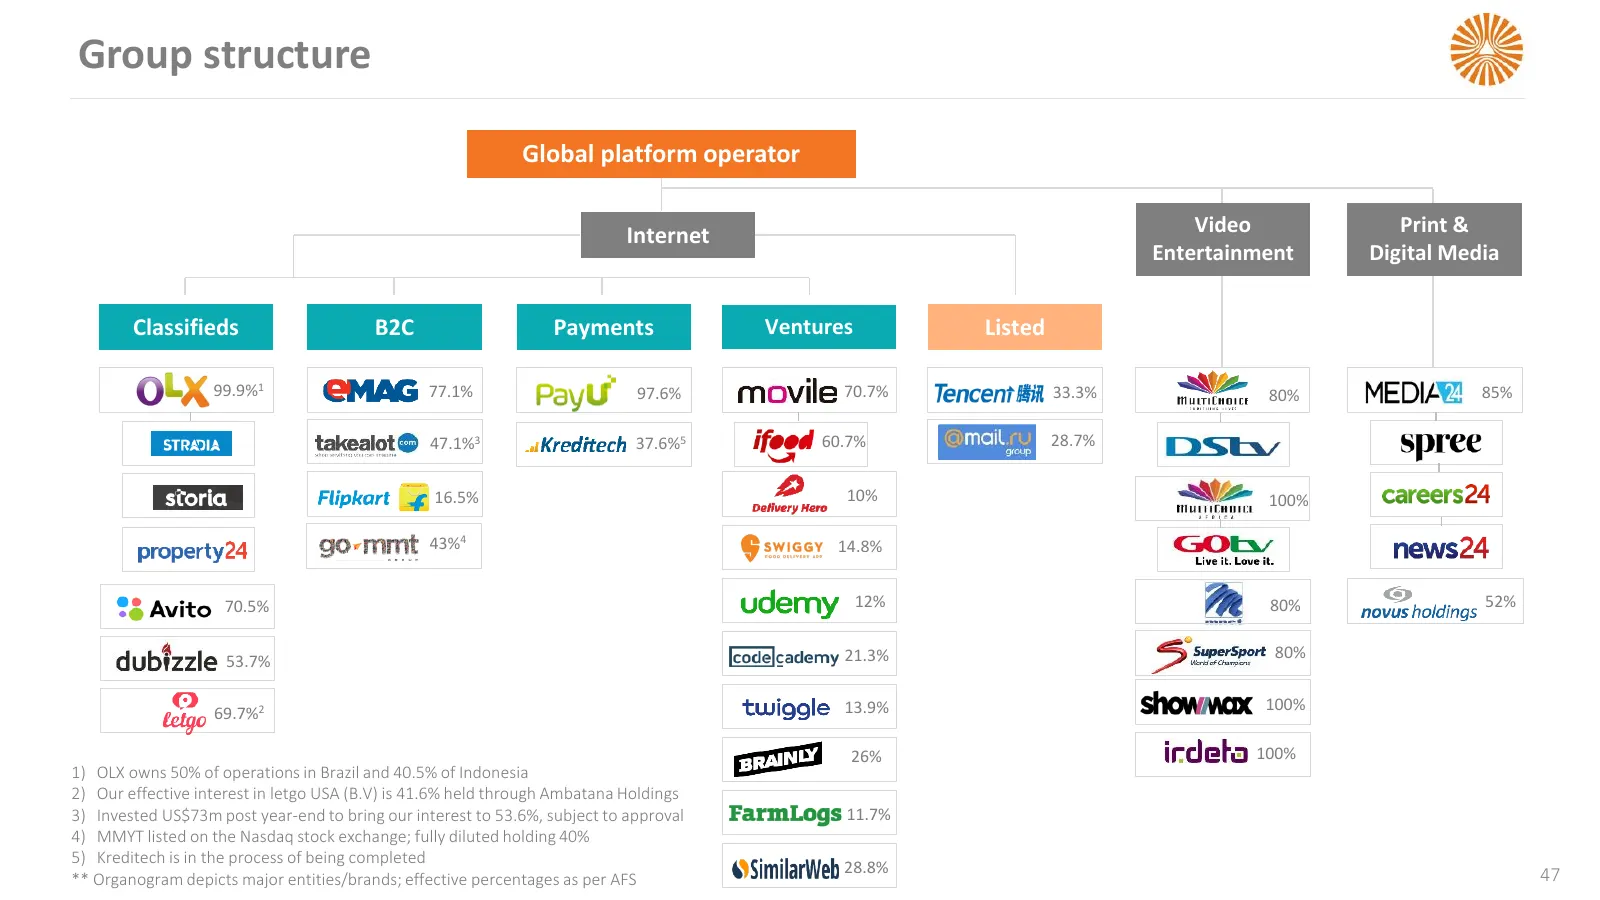
Slide 47: Group structure
Group structure Global platform operator Internet Video Print & Entertainment Digital Media Classifieds B2C Payments Ventures Listed 99.9%1 77.1% 97.6% 70.7% 33.3% 80% 85% 47.1%3 37.6%5 60.7% 28.7% 16.5% 10% 100% 43%4 14.8% 70.5% 12% 80% 52% 53.7% 21.3% 80% 69.7%2 13.9% 100% 26% 100% 1) OLX owns 50%
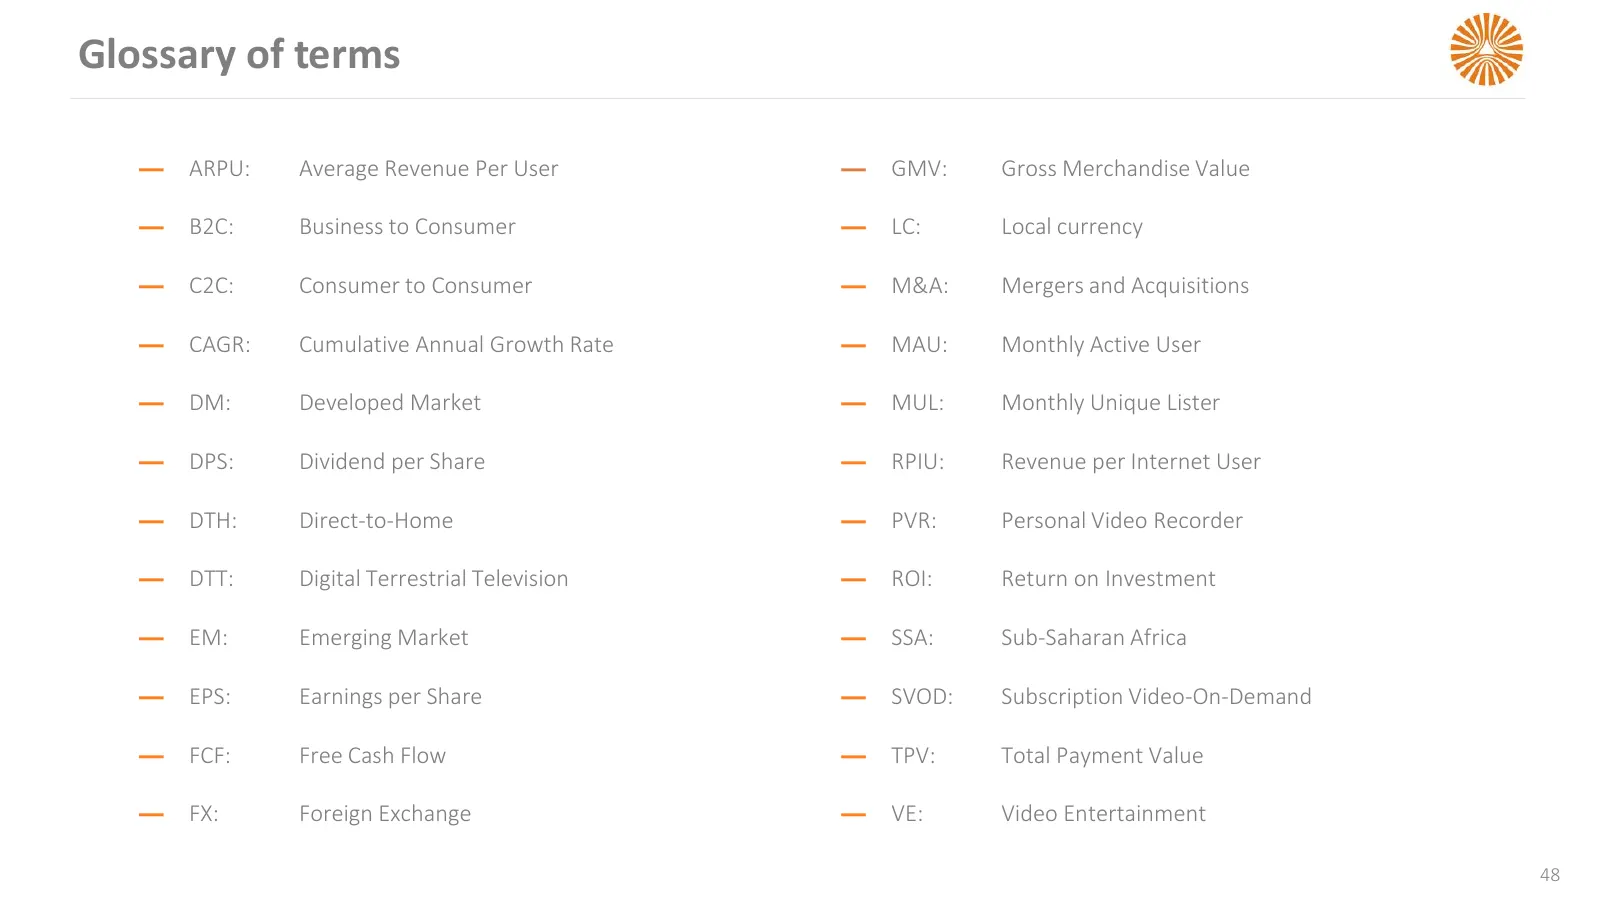
Slide 48: Glossary of terms
Glossary of terms — ARPU: Average Revenue Per User — GMV: Gross Merchandise Value — B2C: Business to Consumer — LC: Local currency — C2C: Consumer to Consumer — M&A: Mergers and Acquisitions — CAGR: Cumulative Annual Growth Rate — MAU: Monthly Active User — DM: Developed Market — MUL: Monthly Unique

Slide 49: Thank you
THANK YOU Meloy Horn +27 11 289 3320 +27 82 7727 123 InvestorRelations@naspers.com www.naspers.com
Source: Internet Archive copy of naspers.com
More decks from Naspers Limited Class N
 FY2026 Earnings Presentation60 slides · Jun 29, 2026
 FY2026 Earnings Presentation17 slides · Mar 31, 2026
 H1 2026 Earnings Presentation64 slides · Nov 24, 2025
 H1 FY26 Earnings Presentation17 slides · November 2025
 FY2025 Earnings Presentation51 slides · June 2025
 FY2025 Earnings Presentation17 slides · 2025