Beverly Enterprises — Investor Day (February 2005)
92 slides from Beverly Enterprises's investor day presentation, Feb 9, 2005
Slide 1: Growing Forward: Beverly Enterprises Investor Day
GROWING FORWARD Beverly Enterprises Investor Day
Slide 2: Bill Floyd, Chairman and Chief Executive Officer
BILL FLOYD Chairman and Chief Executive Officer
Slide 3: Forward Looking Statements
Forward Looking Statements The statements in this presentation relating to matters that are not historical facts are forward-looking statements based on management's beliefs and assumptions using currently available information and expectations as of the date hereof. Forward-looking statements are n
Slide 4: EBITDA Definition
EBITDA Definition We use EBITDA to evaluate financial performance and to design incentive compensation for management. In addition, EBITDA is commonly used by our lenders and investors to assess our leverage capacity, debt service ability and liquidity. We define EBITDA as earnings from continuing o
Slide 5: Important Information
Important Information Beverly Enterprises, Inc. ("BEI") plans to file a proxy statement with the Securities and Exchange Commission relating to BEI's solicitation of proxies from the stockholders of BEI with respect to its 2005 annual meeting of stockholders. BEI URGES INVESTORS AND SECURITY HOLDERS
Slide 6: Information Regarding Participants
Information Regarding Participants BEI, its directors, executive officers and certain of BEI's other officers may be deemed to be participants in the solicitation of proxies (the "Solicitation") for BEI's 2005 annual meeting of stockholders. Information regarding the directors, executive officers an
Slide 7: Growing Forward: Beverly Enterprises Investor Day
GROWING FORWARD Beverly Enterprises Investor Day
Slide 8: Cindy Susienka, EVP and COO, Aegis and AseraCare
CINDY SUSIENKA Executive Vice President Chief Operating Officer Aegis and AseraCare
Slide 9: Service Businesses
SERVICE BUSINESSES
Slide 10: Aegis Therapies and AseraCare Hospice
fy aegis). aseraWcare. therapies ». hospice
Slide 11: Presentation Overview
Presentation Overview Strategic Importance of Service Businesses Overview of Key Businesses Growth Projections
Slide 12: Service Business Contribution
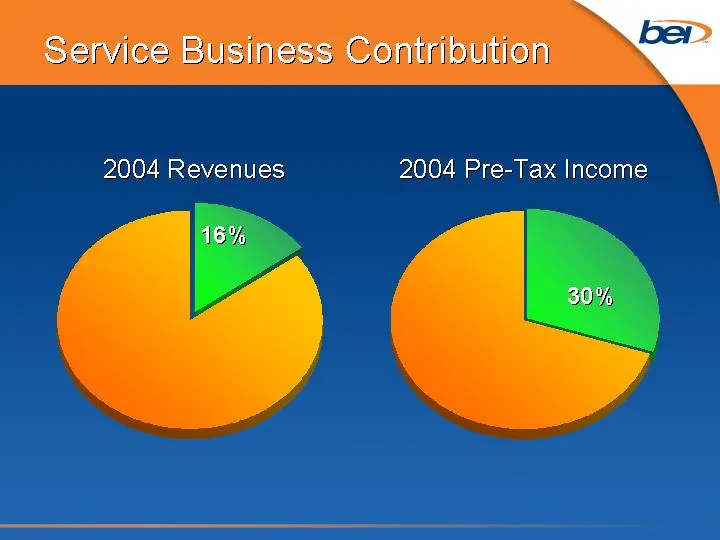
Service Business Contribution 2004 Revenues Beds Admissions Data 15 85 16% Beds Admissions Data 30 70 2004 Pre-Tax Income 30%
Slide 13: Aegis Therapies
Aegis Therapies $285 Million Revenue Run-rate $134 Million (47%) from Third-Party In 2005, Third-Party Revenue Will Exceed Beverly Revenue
Slide 14: Aegis Therapies: All Organic Growth
Aegis Therapies All Organic Growth New Customers Same Facility Growth New Locations With Existing Customers
Slide 15: Aegis Therapies
Aegis Therapies 585 Outside Customers In 37 States + DC EBITDA Margins In Mid-teens Industry Average: 5%
Slide 16: AseraCare Hospice
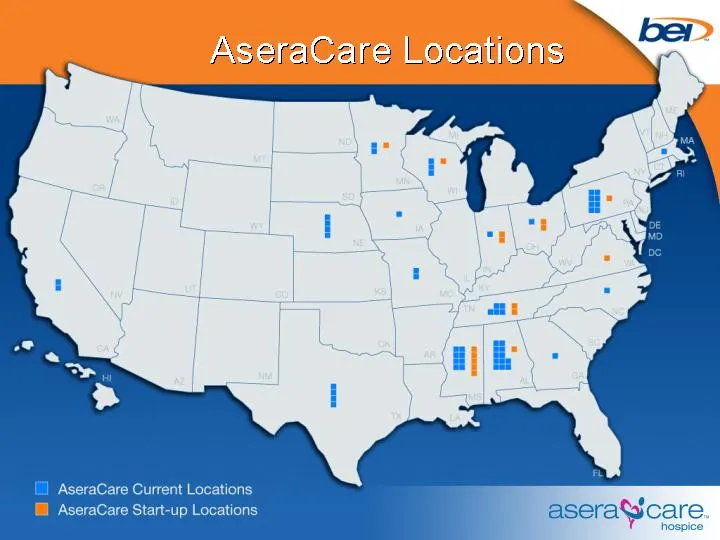
AseraCare Hospice $93 Million Revenue Run-rate ADC Run-rate: 2,250 6th Largest For-profit Hospice Provider 51 Locations In 14 States 16 Start-ups In 2005 31% Increase In Locations
Slide 17: Growing Forward: Service Business Expansion
GROWING FORWARD SERVICE BUSINESS EXPANSION
Slide 18: Service Business Rationale
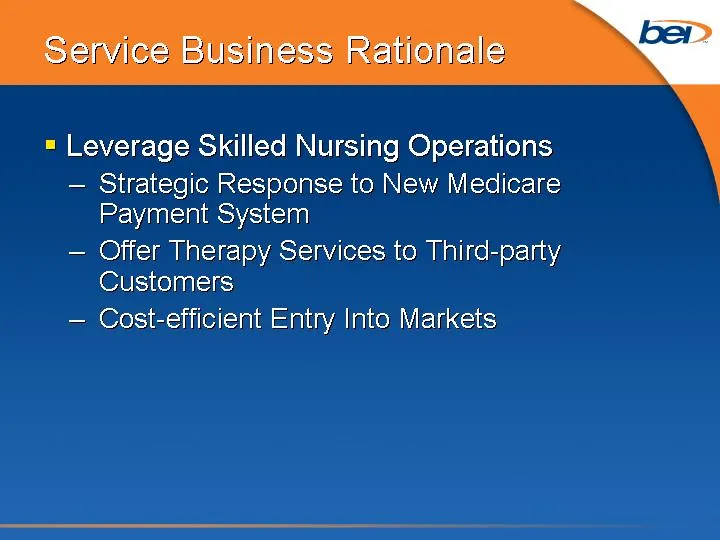
Service Business Rationale Leverage Skilled Nursing Operations Strategic Response to New Medicare Payment System Offer Therapy Services to Third-party Customers Cost-efficient Entry Into Markets
Slide 19: Service Business Rationale: Lower Capital Requirements
Service Business Rationale Leverage Skilled Nursing Operations Lower Capital Requirements Result In Higher Margins
Slide 20: Service Business Rationale: Growth Businesses
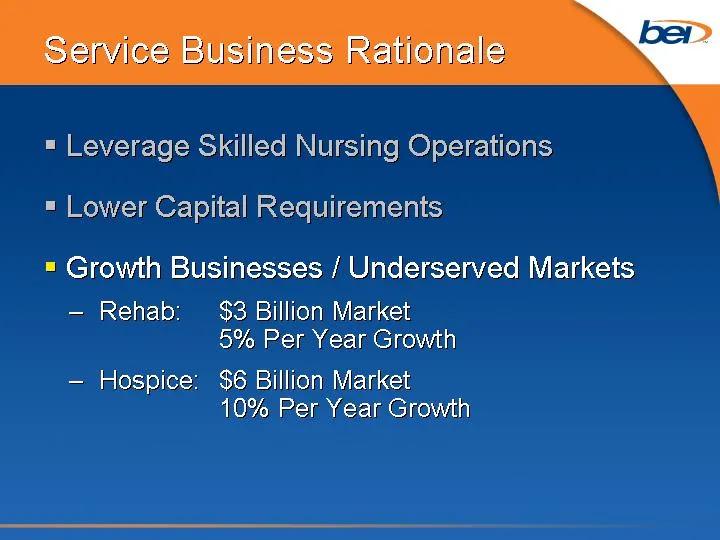
Service Business Rationale Leverage Skilled Nursing Operations Lower Capital Requirements Growth Businesses / Underserved Markets Rehab: $3 Billion Market 5% Per Year Growth Hospice: $6 Billion Market 10% Per Year Growth
Slide 21: Success Factors
Success Factors Scalability Balance Quality
Slide 22: Success Factors
Success Factors Scalability Balance Quality
Slide 23: Scalability
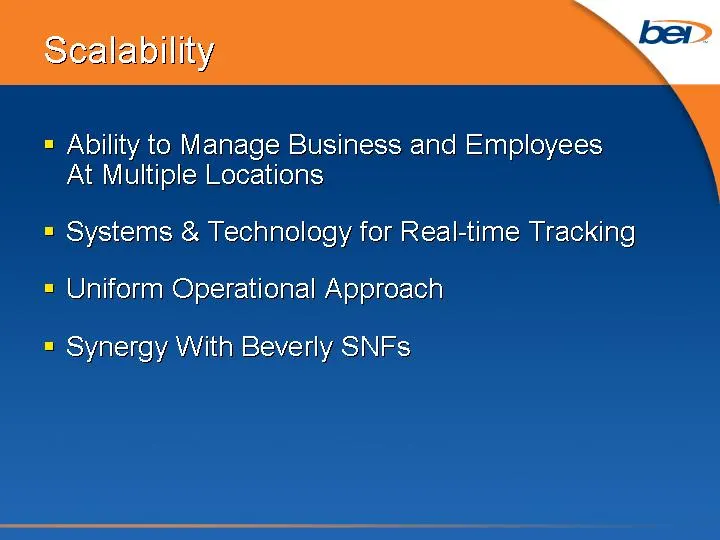
Scalability Ability to Manage Operations and Employees At Multiple Locations Aegis: 5,100 Therapists 936 Locations AseraCare: 1,100 Associates Hundreds of Locations (Patient's Homes, Hospitals, SNFs)
Slide 24: Scalability
Scalability Ability to Manage Business and Employees At Multiple Locations Systems & Technology for Real-time Tracking Uniform Operational Approach Synergy With Beverly SNFs
Slide 25: Success Factors
Success Factors Scalability Balance Quality
Slide 26: Balanced Growth
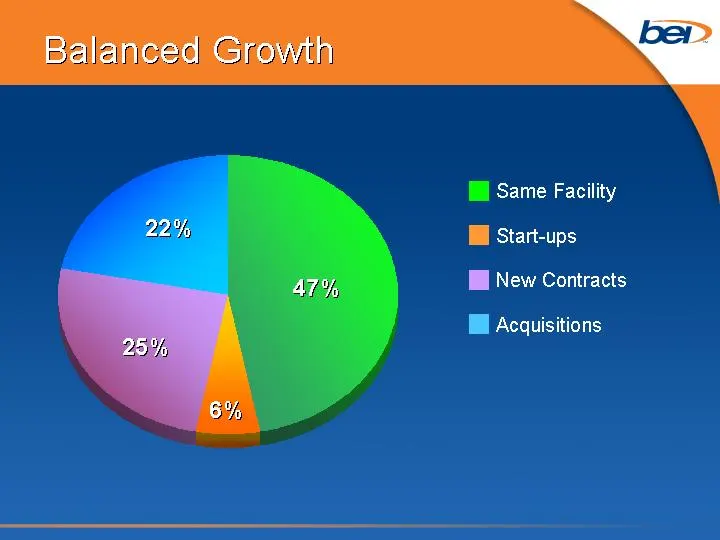
Balanced Growth Same Fac Start New Cont Acquisitions Data 47 6 25 22 Same Facility Start-ups New Contracts Acquisitions 47% 6% 25% 22%
Slide 27: Balanced Hospice Diagnoses
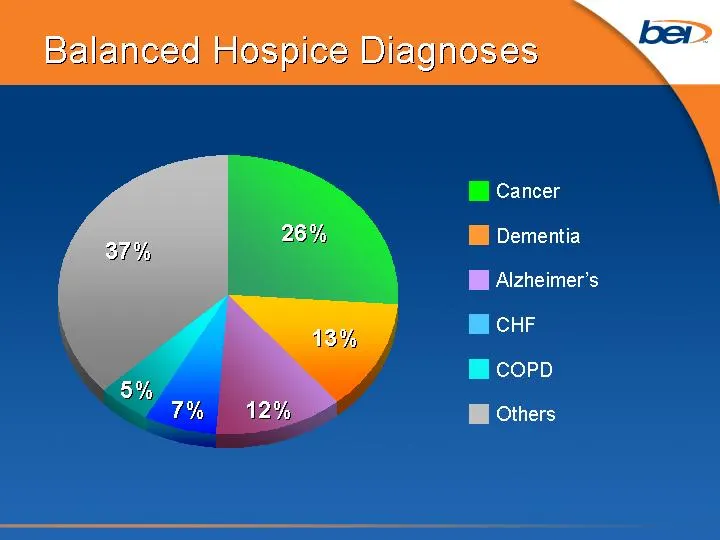
Balanced Hospice Diagnoses Cancer Dementia Alz CHR COPD Others Data 26 13 12 7 5 37 Cancer Dementia Alzheimer's CHF 26% 13% 5% 37% COPD Others 12% 7%
Slide 28: Balanced Aegis Customer Base
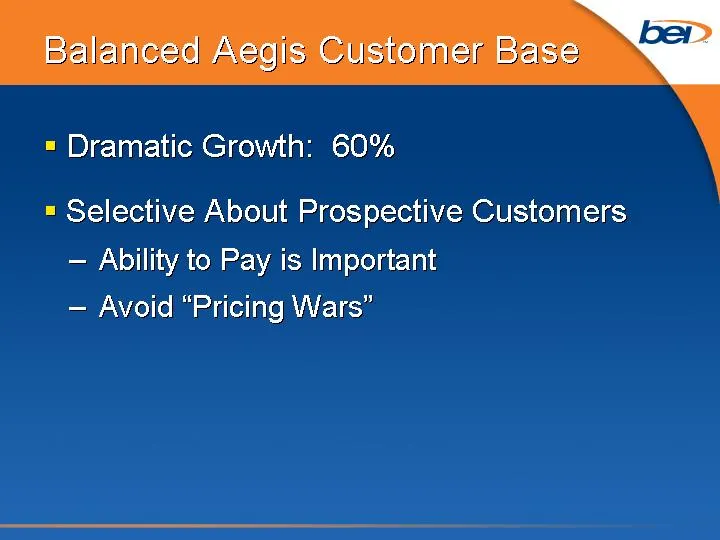
Balanced Aegis Customer Base Dramatic Growth: 60% Selective About Prospective Customers Ability to Pay is Important Avoid "Pricing Wars"
Slide 29: Success Factors
Success Factors Scalability Balance Quality
Slide 30: Quality of Care
Quality Of Care Critical Differentiator Important to SNF Operators We Know How to Address SNF Needs Clinical Programs - Not Just Staff Enhances Business / Attracts Patients Increases Customer Retention ROM - Proven, Quantifiable Results
Slide 31: Quality of Care: Therapists' Employer of Choice
Quality Of Care Therapists' Employer of Choice Reduces Turnover Increased Retention = Increased Margins
Slide 32: Quality of Care: Industry Leader
Quality Of Care Industry Leader In Quality & Satisfaction Increases Profitability Fuels Growth
Slide 33: Growing Forward: Service Business Potential
GROWING FORWARD SERVICE BUSINESS POTENTIAL
Slide 34: Home Health
Home Health $37 Billion Industry (Skilled Nursing Component) Trend: More Use of Home Health Services What the Market Wants AseraCare Home Health in Pilot Stage Same Delivery Model as Rehab & Hospice Will Add 5 Locations in 2005
Slide 35: Service Businesses Summary
Service Businesses Summary Play Larger Role In BEI's Success Leverage BEI's Core Capabilities Success Factors: Cost-effective Scalability Balance Quality
Slide 36: Martha Schram, President, Aegis Therapies
MARTHA SCHRAM President Aegis Therapies

Slide 37
Slide 38: Aegis Therapies
Aegis Therapies Largest Contract Rehab Provider Revenue Customers Therapists Double-Digit Revenue Growth Rate Higher Margins Industry Leader In Client & Staff Retention
Slide 39: Contract Rehab Overview
$3 Billion Industry Largest Provider with 10% Market Share Highly Fragmented Industry Contract Rehab Overview
Slide 40: Aegis Overview
Speech, Physical, Occupational Therapy 5,100 Therapists Primary Customers: Skilled Nursing Facilities Aegis Overview
Slide 41: Aegis Overview: Third-Party Provider Contracts
585 Third-Party Provider Contracts 155 New In 2004 28% Increase In Revenue Per Contract 71% Third-Party Business: Chain Clients 2003: 64% Balanced Portfolio Aegis Overview
Slide 42: Beverly Nursing Homes Leveraged As Springboard For Growth
Beverly Nursing Homes Leveraged As Springboard For Growth Core Base of Business Provide Easy Entry Into Beverly Markets Aegis Overview
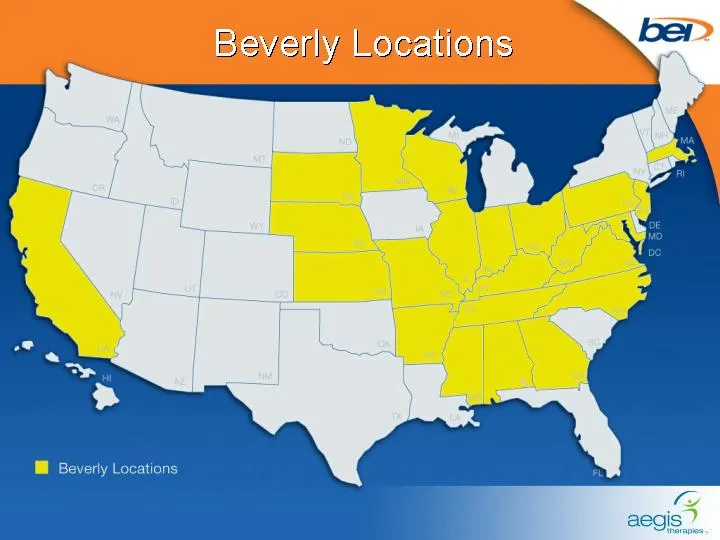
Slide 43: Beverly Locations
Beverly Locations
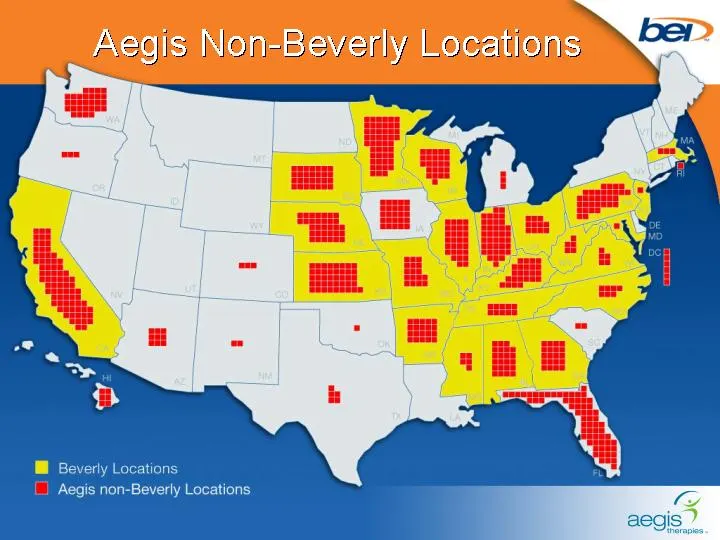
Slide 44: Aegis Non-Beverly Locations
Aegis Non-Beverly Locations
Slide 45: Not a Bricks & Mortar Business
Not A Bricks & Mortar Business Therapists Work At Client Locations Managers Work from Home Cost-effective Scalability Manage Business and Employees at Multiple Locations Aegis Overview
Slide 46: Key Performance Metrics
Key Performance Metrics 2004 Third-party Revenue Up 60% (Projected) Double-Digit Annual Growth Rate Margins in Mid-Teens Therapist Retention Rate: 88% Customer-Initiated Turnover: 3%

Slide 47
Slide 48: Growth Strategy: Drive Profitable Growth
Growth Strategy DRIVE PROFITABLE GROWTH
Slide 49: Growth Strategy
Growth Strategy Densify In Existing Markets Build Business With Existing Customers Align Staffing Efforts With Selling Efforts 1 2 3
Slide 50: Growth Strategy: Densify in Existing Markets
Growth Strategy Densify In Existing Markets 1 Competitive Differentiation
Slide 51: Competitive Differentiation
Competitive Differentiation We Deliver Better Economic Value Increase Therapy Utilization More Therapy = More Revenue & Profitability Superior Clinical Outcomes Less Staff Time Needed As Patient Improves Better Rehab = Reduced Customer Labor Costs
Slide 52: Competitive Differentiation: Rehab Outcome Measurement
Competitive Differentiation REHAB OUTCOME MEASURMENT
Slide 53: Rehab Outcome Measurement (ROM)
Rehab Outcome Measurement (ROM) Measures Patient Progress Aggressively Adopted ROM System 4 Years Ago Database of 1 Million Patient Records Improvement Translates Into Savings Setting Industry Benchmarks
Slide 54: Growth Strategy: Build Business With Existing Customers
Growth Strategy Build Business With Existing Customers Add New Locations with Chain Clients Generate Same-Facility Growth 2
Slide 55: Freedom Through Functionality
Freedom Through Functionality Geriatric Strength-Training Program Proprietary Aegis Therapy Protocols
Slide 56: Freedom Through Functionality Benefits
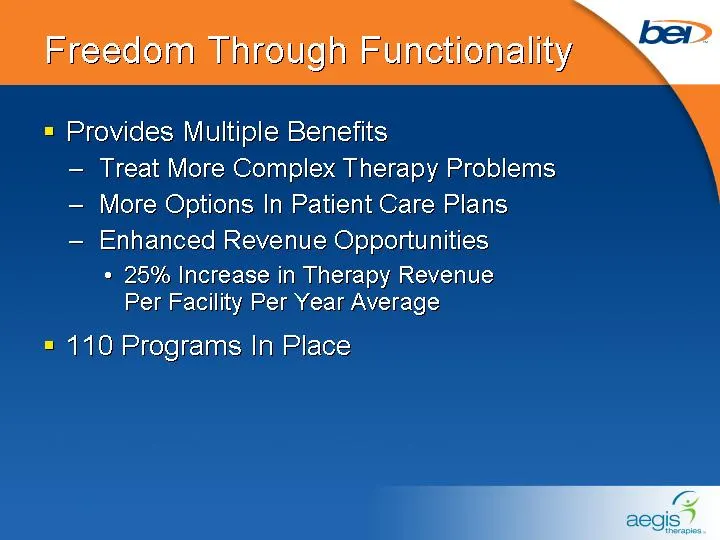
Freedom Through Functionality Provides Multiple Benefits Treat More Complex Therapy Problems More Options In Patient Care Plans Enhanced Revenue Opportunities 25% Increase in Therapy Revenue Per Facility Per Year Average 110 Programs In Place
Slide 57: Growth Strategy: Align Staffing Efforts With Selling Efforts
Growth Strategy Align Staffing Efforts With Selling Efforts High-Quality, Well-Trained Therapists Critical to Success Ensure Ability to Recruit & Retain 3
Slide 58: Staffing
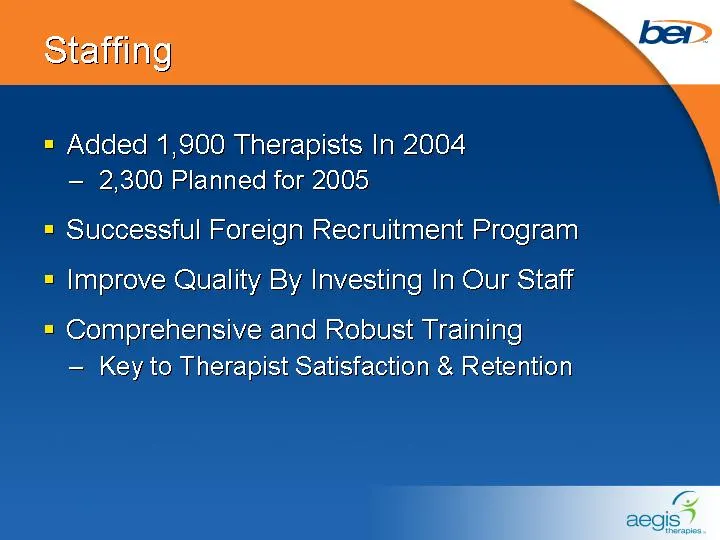
Staffing Added 1,900 Therapists In 2004 2,300 Planned for 2005 Successful Foreign Recruitment Program Improve Quality By Investing In Our Staff Comprehensive and Robust Training Key to Therapist Satisfaction & Retention
Slide 59: Growth Strategy: Align Staffing Efforts With Selling Efforts
Growth Strategy Align Staffing Efforts With Selling Efforts Optimize Time Spent on Patient Care Reduce the Need for New Staff 3
Slide 60: Information Management System
Information Management System Real-Time Access to Data Tracks Remote Operations Reduces Labor Costs / Staffing Needs Optimizes Time and Assignments More Patient Care Time = More Pre-Tax Income
Slide 61: Aegis Therapies Summary
Aegis Therapies Summary $285 Million Revenue Run-rate 936 Customer Locations Largest Contract Rehab Provider Industry-leading Performance
Slide 62: Growth Strategy
Growth Strategy Densify In Existing Markets Build Business With Existing Customers Align Staffing Efforts With Selling Efforts 1 2 3
Slide 63: Chris Roussos, President, AseraCare Hospice
CHRIS ROUSSOS President AseraCare Hospice
Slide 64: Hospice Business
HOSPICE BUSINESS
Slide 65: Presentation Outline
Presentation Outline Hospice Overview AseraCare Overview Growth Strategies
Slide 66: Hospice Overview: A Service, Not a Building
Hospice Overview A SERVICE, NOT A BUILDING
Slide 67: Hospice Overview: AseraCare Patient Locations
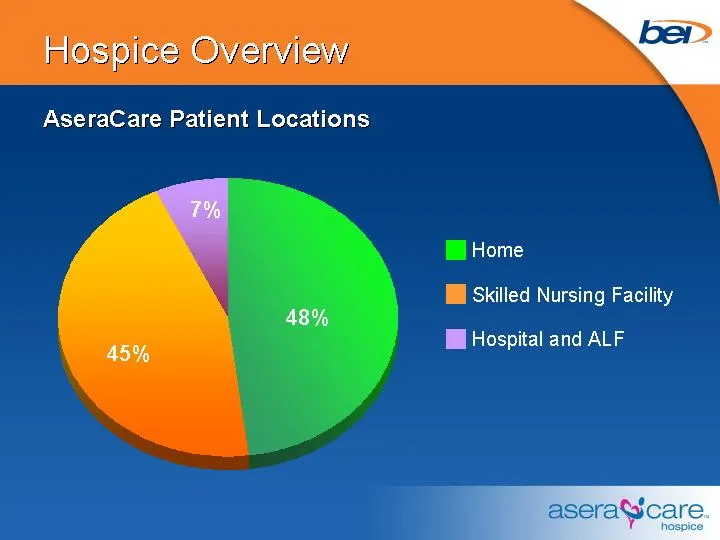
Home SNF Hospital Data 48 45 7 Hospice Overview Home Skilled Nursing Facility Hospital and ALF 48% 7% 45% AseraCare Patient Locations
Slide 68: Hospice Overview
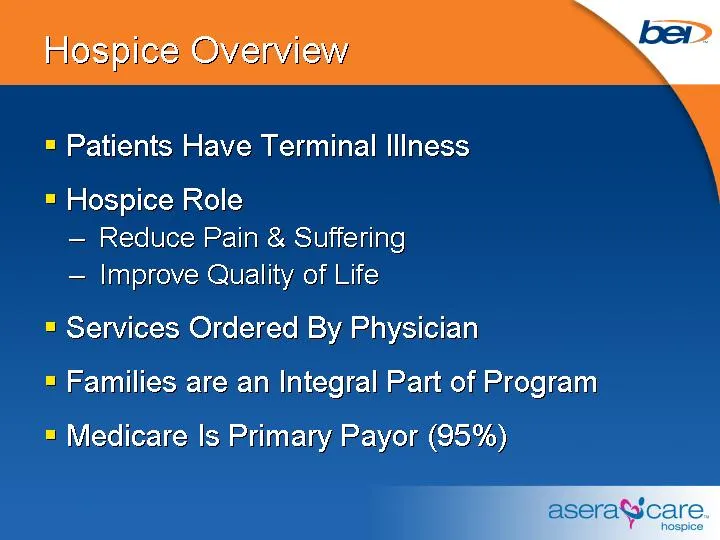
Hospice Overview Patients Have Terminal Illness Hospice Role Reduce Pain & Suffering Improve Quality of Life Services Ordered By Physician Families are an Integral Part of Program Medicare Is Primary Payor (95%)
Slide 69: AseraCare Hospice
“Ne aseraS care. iospice
Slide 70: AseraCare Locations
AseraCare Locations
Slide 71: Beverly Synergy
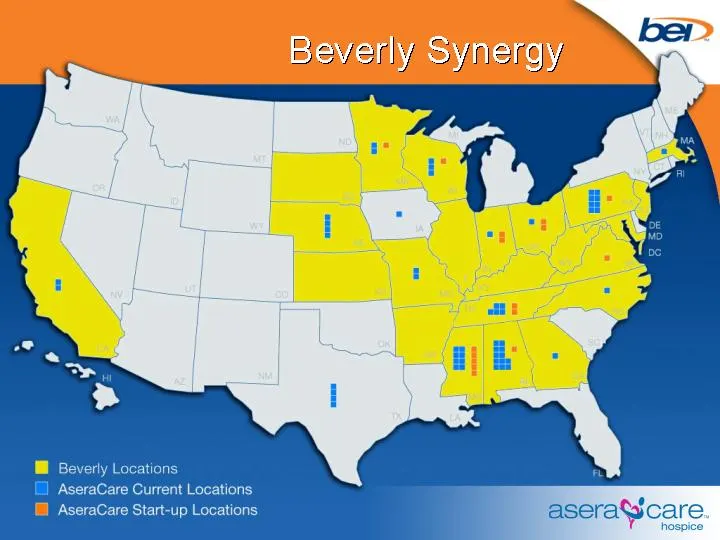
Beverly Synergy
Slide 72: Hospice USA Acquisition
Hospice USA Acquisition Integration Complete Seamless Organization Retained Operations Management & Staff Maintained Solid Referral Sources Admissions & ADC Above Projections
Slide 73: Performance Metrics
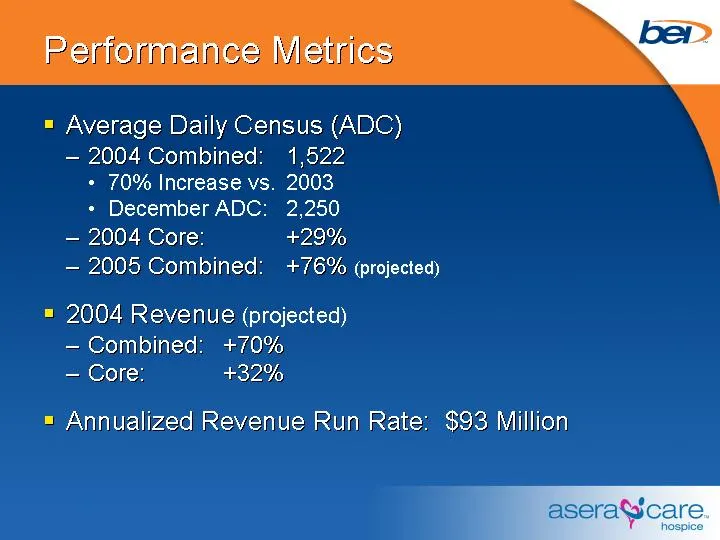
Performance Metrics Average Daily Census (ADC) 2004 Combined: 1,522 70% Increase vs. 2003 December ADC: 2,250 2004 Core: +29% 2005 Combined: +76% (projected) 2004 Revenue (projected) Combined: +70% Core: +32% Annualized Revenue Run Rate: $93 Million
Slide 74: Performance Metrics: EBITDA
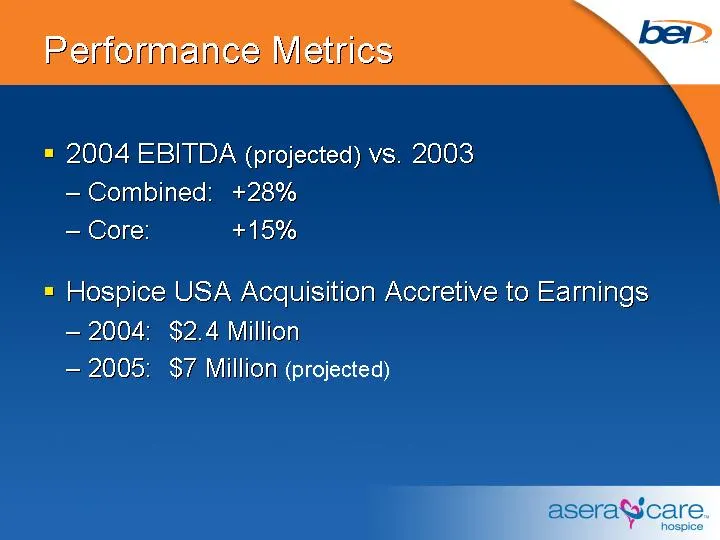
Performance Metrics 2004 EBITDA (projected) vs. 2003 Combined: +28% Core: +15% Hospice USA Acquisition Accretive to Earnings 2004: $2.4 Million 2005: $7 Million (projected)
Slide 75: AseraCare Hospice
“Ne aseraS care. iospice
Slide 76: Growth Strategy: Drive Profitable Growth
Growth Strategy DRIVE PROFITABLE GROWTH
Slide 77: Growth Strategy
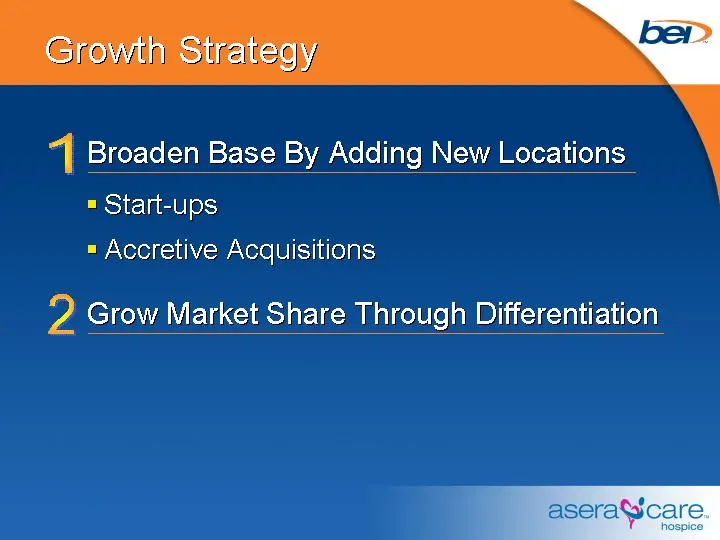
Growth Strategy Broaden Base By Adding New Locations Grow Market Share Through Differentiation 1 2 Start-ups Accretive Acquisitions
Slide 78: Start-up Advantages
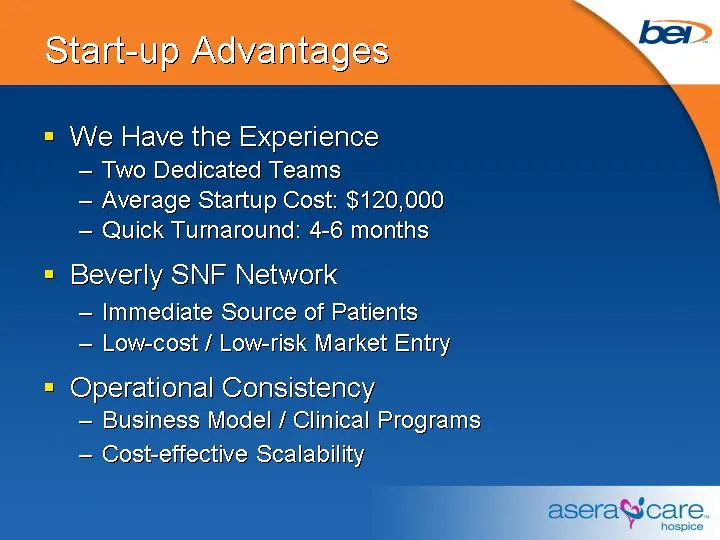
Start-up Advantages We Have the Experience Two Dedicated Teams Average Startup Cost: $120,000 Quick Turnaround: 4-6 months Beverly SNF Network Immediate Source of Patients Low-cost / Low-risk Market Entry Operational Consistency Business Model / Clinical Programs Cost-effective Scalability
Slide 79: Start-up Economics
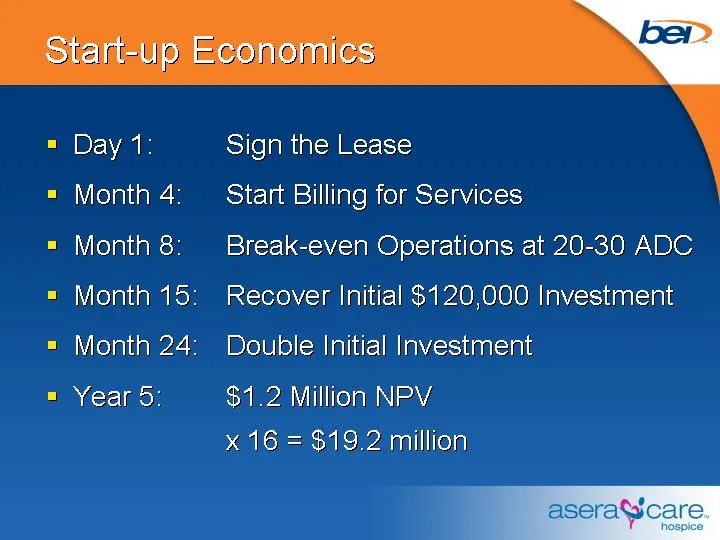
Start-up Economics Day 1: Sign the Lease Month 4: Start Billing for Services Month 8: Break-even Operations at 20-30 ADC Month 15: Recover Initial $120,000 Investment Month 24: Double Initial Investment Year 5: $1.2 Million NPV x 16 = $19.2 million
Slide 80: Acquisitions: Key Component of Growth Strategy
Acquisitions Key Component of Growth Strategy Hospice USA: An Acquisition Model
Slide 81: Growth Strategy
Growth Strategy Broaden Base By Adding New Locations 1 Start-ups Accretive Acquisitions
Slide 82: Growth Strategy
Growth Strategy Broaden Base By Adding New Locations Grow Market Share Through Differentiation 1 2 Start-ups Accretive Acquisitions
Slide 83: Growing Market Share
Growing Market Share AseraCare Not a Commodity Business Opportunity to Differentiate Become Preferred Provider for Referral Sources
Slide 84: Key Differentiators
Key Differentiators Unmatched Clinical Quality Value-added Programs & Services
Slide 85: Industry-Leading Clinical Quality
Industry-Leading Clinical Quality Primary AseraCare Differentiator Results In Higher Satisfaction Leads to More Referrals Superior NHPCO Quality & Satisfaction Scores
Slide 86: Key Differentiators
Key Differentiators Industry-leading Clinical Quality Value-added Programs & Services
Slide 87: Value-Added Programs & Services
Value-Added Programs & Services Family-Centered Hospice Designed to Meet Patient & Family Needs Alzheimer's Program Family Access to Caregivers New 24 / 7 Call Center Family Communications Secure Web Page for Patient Updates
Slide 88: AseraCare Hospice: Brand Identity and Marketing
AseraCare Hospice Distinctive Brand Identity National Marketing Campaign Advertising Trade Shows Editorial Coverage
Slide 89: AseraCare Hospice Summary
AseraCare Hospice Summary We Have the Formula for Success Strategies for Profitable Growth: Broaden Business Base Grow Market Share Leverage Beverly Healthcare Relationship Value-added Programs / Superior Quality Operational Consistency / Scalability Proven Start-up Approach
Slide 90: AseraCare Hospice: 6th Largest For-Profit Hospice Provider
AseraCare Hospice 6th LARGEST FOR-PROFIT HOSPICE PROVIDER IN THE COUNTRY!
Slide 91: AseraCare Hospice
“Ne aseraS care. iospice
Slide 92: Growing Forward: Beverly Enterprises Investor Day
GROWING FORWARD Beverly Enterprises Investor Day
Source: SEC EDGAR · 8-K filed Feb 9, 2005