Beverly Enterprises — Proxy Contest (March 2005)
21 slides from Beverly Enterprises's proxy contest presentation, Mar 15, 2005
Slide 1: Building Shareholder Value
BUILDING SHAREHOLDER VALUE Beverly Enterprises, Inc. March 2005
Slide 2: Important Information / Information Regarding Participants
Building Shareholder Value On March 14, 2005, Beverly Enterprises, Inc. ("BEI") filed a preliminary proxy statement with the Securities and Exchange Commission relating to BEI's solicitation of proxies with respect to its 2005 annual meeting of stockholders. Prior to the annual meeting, BEI will fur
Slide 3: Forward-Looking Statements
Building Shareholder Value The statements in this document relating to matters that are not historical facts are forward-looking statements based on management's beliefs and assumptions using currently available information and expectations as of the date hereof. Forward-looking statements are not g
Slide 4: EBITDA Definition
Building Shareholder Value EBITDA Definition We use EBITDA to evaluate financial performance and to design incentive compensation for management. In addition, EBITDA is commonly used by our lenders and investors to assess our leverage capacity, debt service ability and liquidity. We define EBITDA as
Slide 5: Agenda
Agenda Beverly Enterprises - A New Company Long Term Value Creation Review of the Formation Letters Beverly Board of Directors Questions and Answers
Slide 6: Key Investor Themes
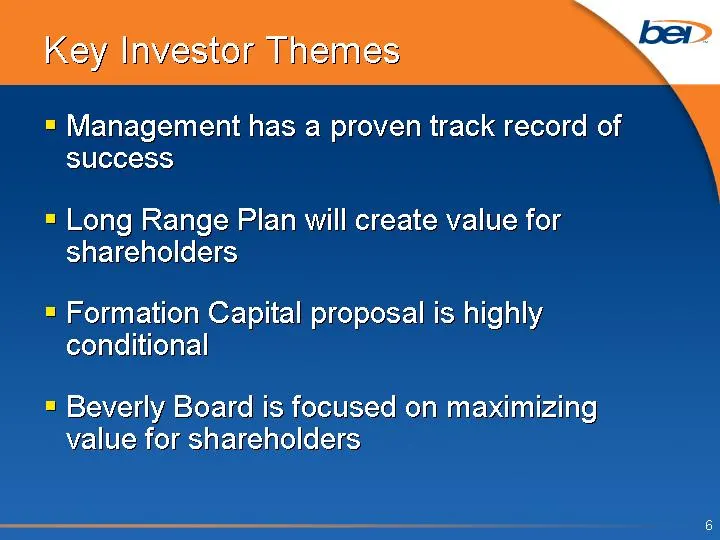
Key Investor Themes Management has a proven track record of success Long Range Plan will create value for shareholders Formation Capital proposal is highly conditional Beverly Board is focused on maximizing value for shareholders
Slide 7: Management Track Record
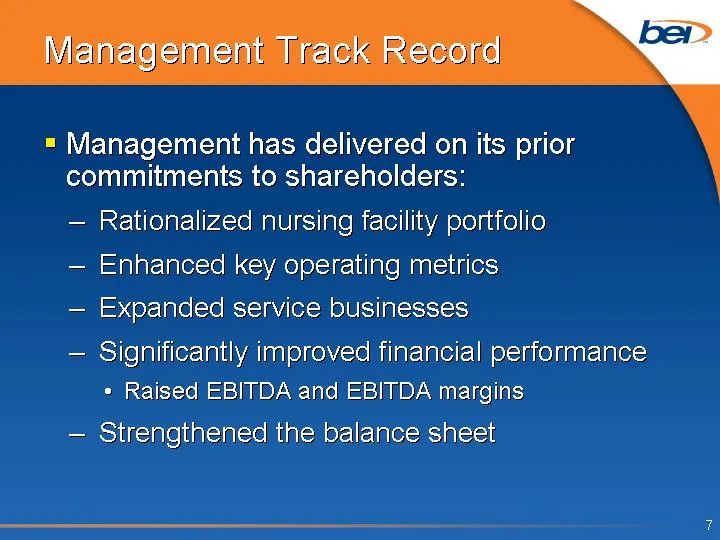
Management Track Record Management has delivered on its prior commitments to shareholders: Rationalized nursing facility portfolio Enhanced key operating metrics Expanded service businesses Significantly improved financial performance Raised EBITDA and EBITDA margins Strengthened the balance sheet
Slide 8: Proven Results - Operating Metrics
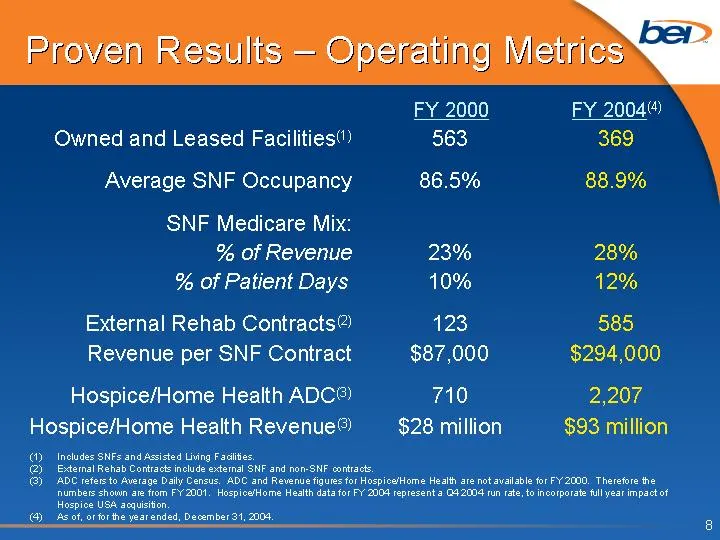
Proven Results - Operating Metrics 563 86.5% 23% 10% 123 $87,000 710 $28 million FY 2000 Owned and Leased Facilities(1) Average SNF Occupancy SNF Medicare Mix: % of Revenue % of Patient Days External Rehab Contracts(2) Revenue per SNF Contract Hospice/Home Health ADC(3) Hospice/Home Health Revenue(3
Slide 9: Proven Results - Financial Metrics
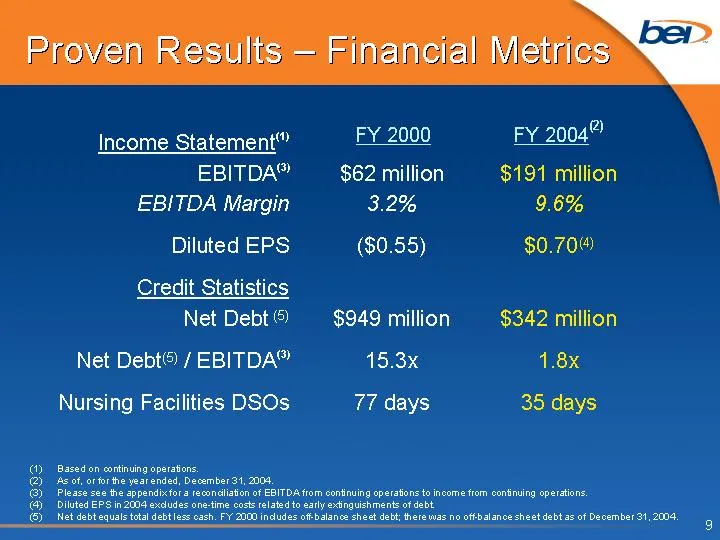
$62 million 3.2% ($0.55) $949 million 15.3x 77 days $191 million 9.6% $0.70(4) $342 million 1.8x 35 days Proven Results - Financial Metrics FY 2000 Income Statement(1) EBITDA(3) EBITDA Margin Diluted EPS Credit Statistics Net Debt (5) Net Debt(5) / EBITDA(3) Nursing Facilities DSOs FY 2004(2) Based
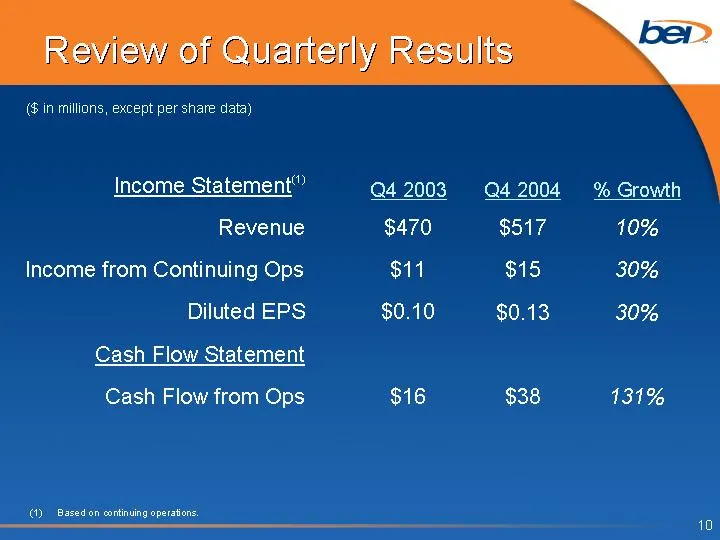
Slide 10: Review of Quarterly Results
$470 $11 $0.10 $16 Review of Quarterly Results Income Statement(1) Revenue Income from Continuing Ops Diluted EPS Cash Flow Statement Cash Flow from Ops Based on continuing operations. ($ in millions, except per share data) Q4 2003 $517 $15 $0.13 $38 Q4 2004 10% 30% 30% 131% % Growth
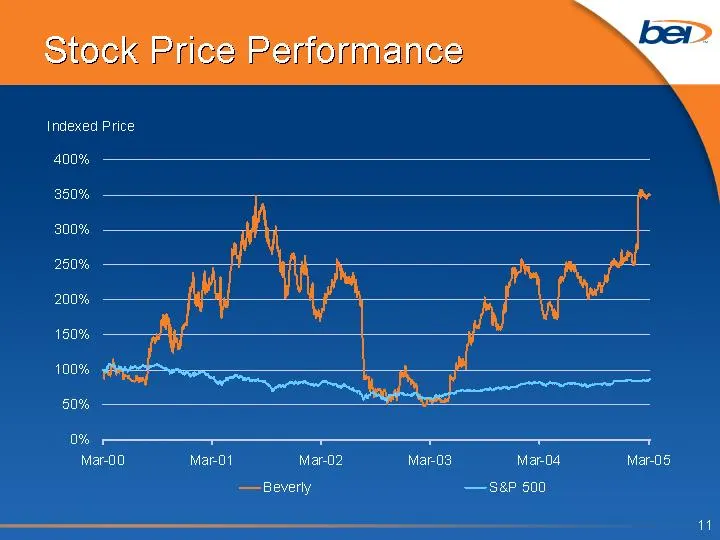
Slide 11: Stock Price Performance
Stock Price Performance Beverly S&P 500 3/3/2000 1 1 3/6/2000 1 0.99 3/7/2000 0.87 0.96 3/8/2000 0.93 0.97 3/9/2000 0.95 0.99 3/10/2000 0.96 0.99 3/13/2000 0.96 0.98 3/14/2000 0.98 0.96 3/15/2000 0.98 0.99 3/16/2000 0.98 1.03 3/17/2000 0.98 1.04 3/20/2000 0.93 1.03 3/21/2000 0.93 1.06 3/22/2000 0.96
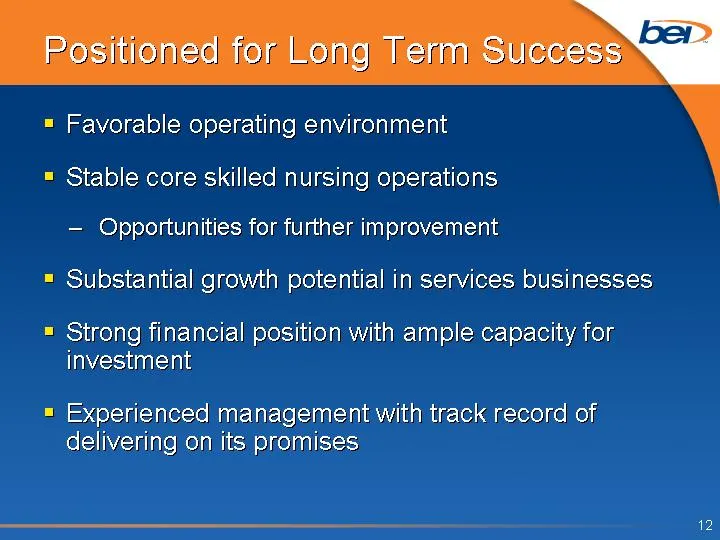
Slide 12: Positioned for Long Term Success
Positioned for Long Term Success Favorable operating environment Stable core skilled nursing operations Opportunities for further improvement Substantial growth potential in services businesses Strong financial position with ample capacity for investment Experienced management with track record of d
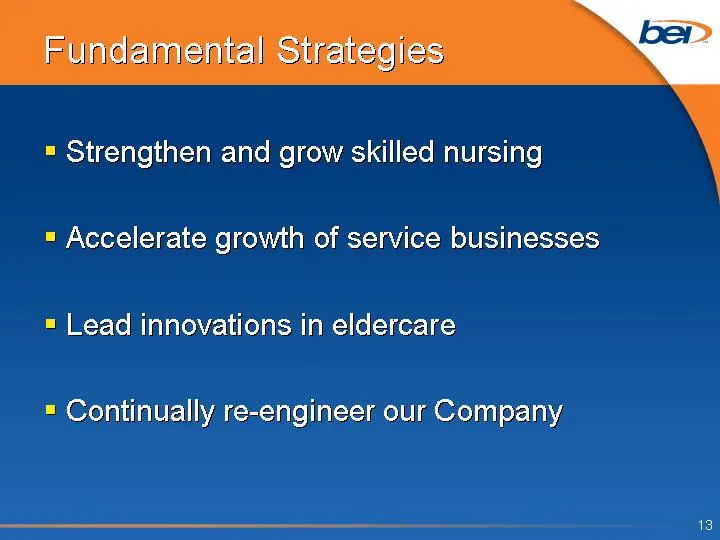
Slide 13: Fundamental Strategies
Fundamental Strategies Strengthen and grow skilled nursing Accelerate growth of service businesses Lead innovations in eldercare Continually re-engineer our Company
Slide 14: Consolidated Beverly - Guidance
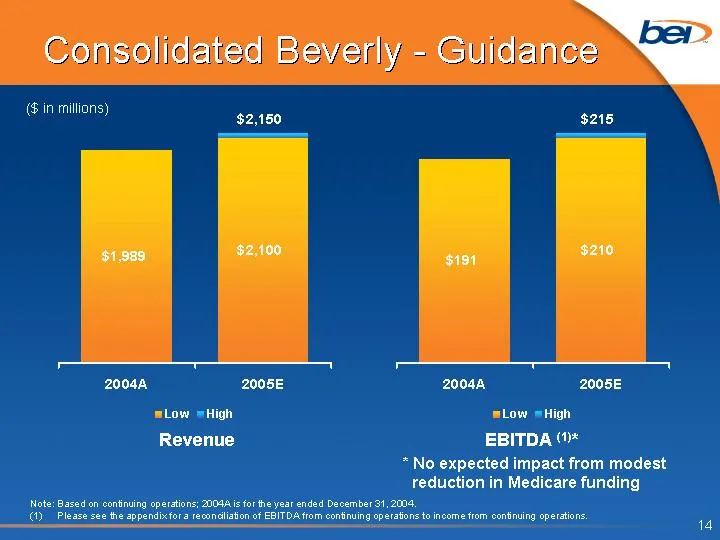
Consolidated Beverly - Guidance 2004A 2005E 2006E 2007E Low 1989 2100 2287.038 2492.706003 High 0 50 193.052 326.0607599 1989 2150 2480.09 2818.766762 Revenue EBITDA (1)* 2004A 2005E 2006E 2007E Low 191 210 239.4 281.4219195 High 0 5 26.438 47.41101392 191 215 265.838 328.8329334 ($ in millions) Not
Slide 15: Creating Shareholder Value
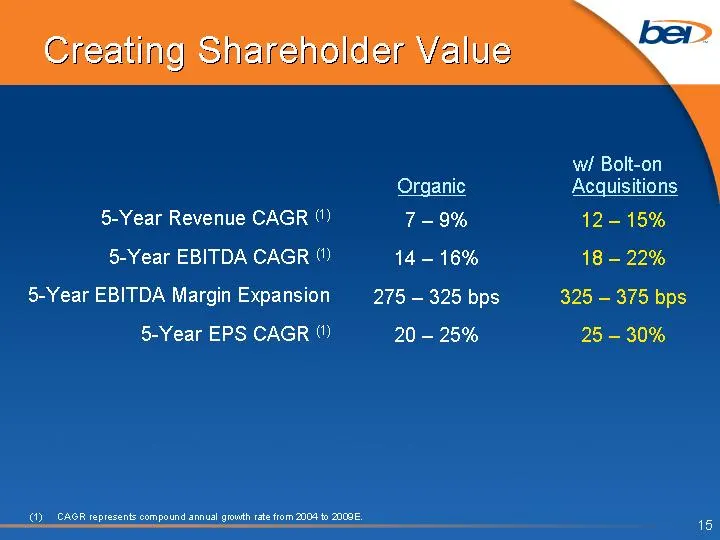
Creating Shareholder Value 7 - 9% 14 - 16% 275 - 325 bps 20 - 25% Organic 5-Year Revenue CAGR (1) 5-Year EBITDA CAGR (1) 5-Year EBITDA Margin Expansion 5-Year EPS CAGR (1) 12 - 15% 18 - 22% 325 - 375 bps 25 - 30% w/ Bolt-on Acquisitions CAGR represents compound annual growth rate from 2004 to 2009E.
Slide 16: Formation Letters Not Real Offers
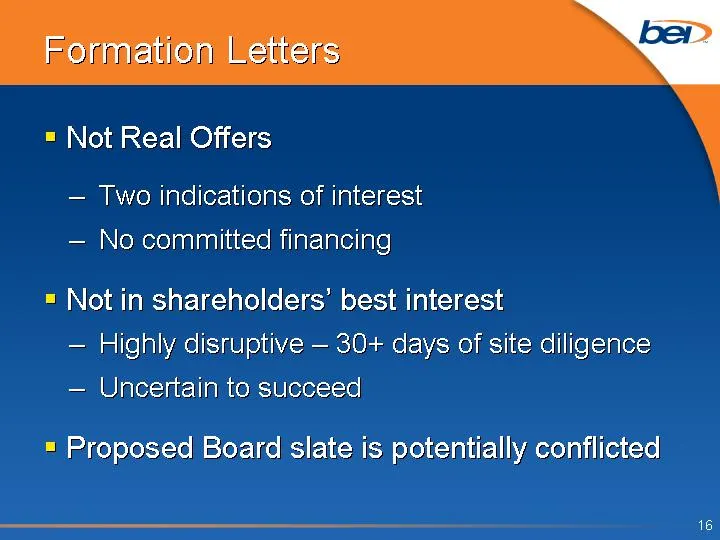
Formation Letters Not Real Offers Two indications of interest No committed financing Not in shareholders' best interest Highly disruptive - 30+ days of site diligence Uncertain to succeed Proposed Board slate is potentially conflicted
Slide 17: Arkansas Legislation
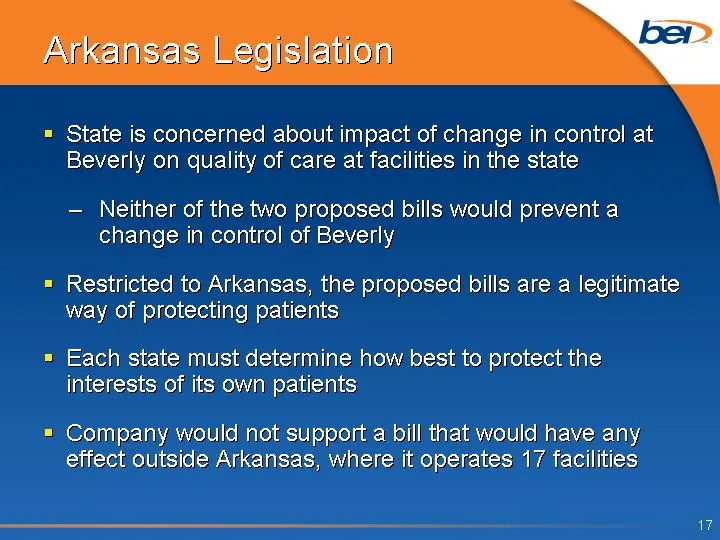
Arkansas Legislation State is concerned about impact of change in control at Beverly on quality of care at facilities in the state Neither of the two proposed bills would prevent a change in control of Beverly Restricted to Arkansas, the proposed bills are a legitimate way of protecting patients Eac
Slide 18: Committed To Maximizing Value
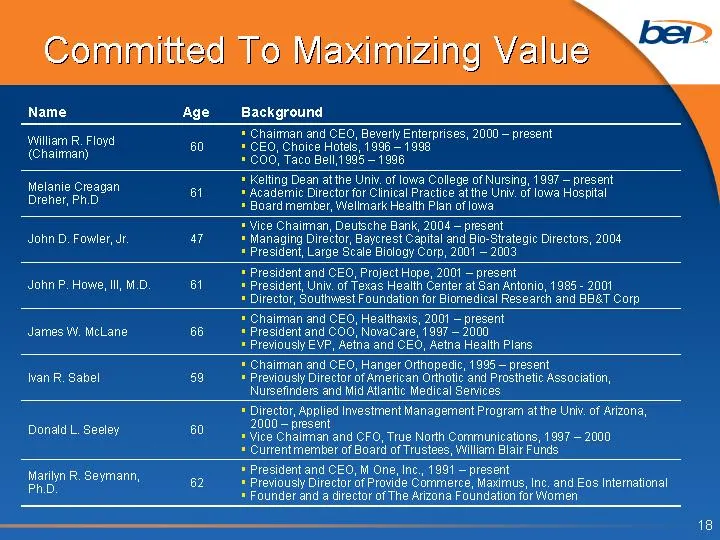
Committed To Maximizing Value Name Age Background William R. Floyd (Chairman) 60 Chairman and CEO, Beverly Enterprises, 2000 - present CEO, Choice Hotels, 1996 - 1998 COO, Taco Bell,1995 - 1996 Melanie Creagan Dreher, Ph.D 61 Kelting Dean at the Univ. of Iowa College of Nursing, 1997 - present Acade
Slide 19: Appendix
APPENDIX 19
Slide 20: EBITDA Reconciliation
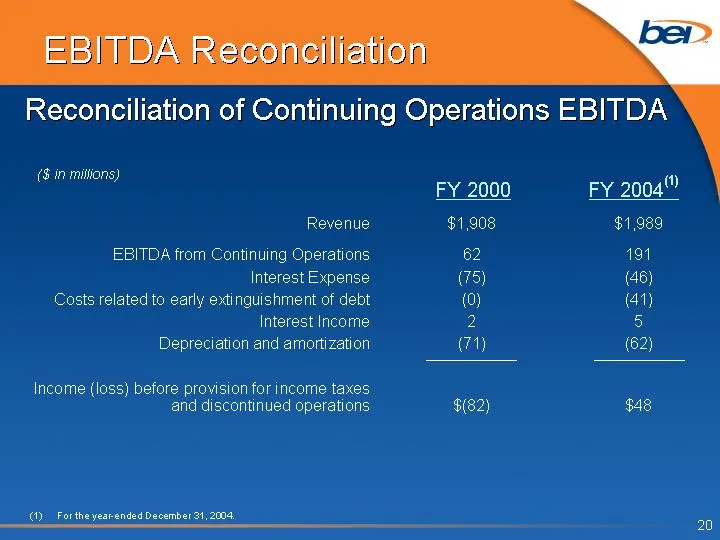
EBITDA Reconciliation $1,908 62 (75) (0) 2 (71) $(82) FY 2000 Revenue EBITDA from Continuing Operations Interest Expense Costs related to early extinguishment of debt Interest Income Depreciation and amortization Income (loss) before provision for income taxes and discontinued operations FY 2004(1)
Slide 21: Projected EBITDA Reconciliation
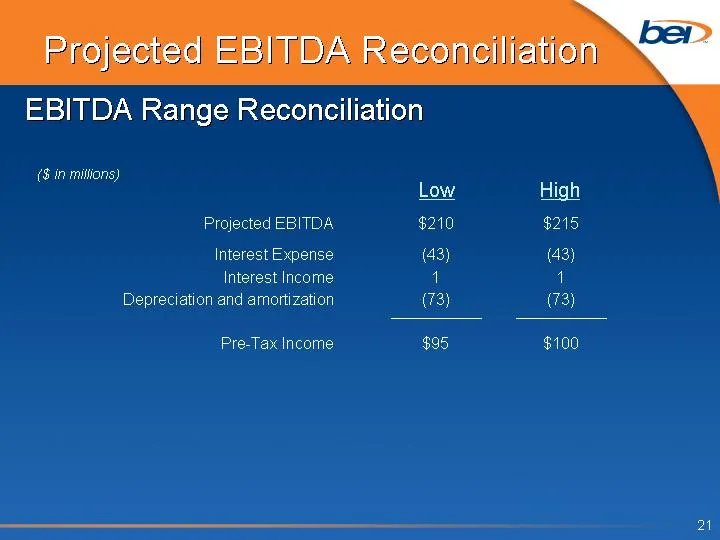
Projected EBITDA Reconciliation $210 (43) 1 (73) $95 Low Projected EBITDA Interest Expense Interest Income Depreciation and amortization Pre-Tax Income High EBITDA Range Reconciliation $215 (43) 1 (73) $100 ($ in millions)
Source: SEC EDGAR · DEFA14A filed Mar 15, 2005