Beverly Enterprises — Investor Day (February 2005)
139 slides from Beverly Enterprises's investor day presentation, Feb 9, 2005
Slide 1: Growing Forward: Beverly Enterprises Investor Day
GROWING FORWARD Beverly Enterprises Investor Day
Slide 2: Bill Floyd, Chairman and CEO
BILL FLOYD Chairman and Chief Executive Officer
Slide 3: Forward Looking Statements
Forward Looking Statements The statements in this presentation relating to matters that are not historical facts are forward-looking statements based on management's beliefs and assumptions using currently available information and expectations as of the date hereof. Forward-looking statements are n
Slide 4: EBITDA Definition
EBITDA Definition We use EBITDA to evaluate financial performance and to design incentive compensation for management. In addition, EBITDA is commonly used by our lenders and investors to assess our leverage capacity, debt service ability and liquidity. We define EBITDA as earnings from continuing o
Slide 5: Important Information
Important Information Beverly Enterprises, Inc. ("BEI") plans to file a proxy statement with the Securities and Exchange Commission relating to BEI's solicitation of proxies from the stockholders of BEI with respect to its 2005 annual meeting of stockholders. BEI URGES INVESTORS AND SECURITY HOLDERS
Slide 6: Information Regarding Participants
Information Regarding Participants BEI, its directors, executive officers and certain of BEI's other officers may be deemed to be participants in the solicitation of proxies (the "Solicitation") for BEI's 2005 annual meeting of stockholders. Information regarding the directors, executive officers an

Slide 7: Investment Community Survey
INVESTMENT COMMUNITY SURVEY
Slide 8: Growing Forward
GROWING FORWARD Beverly Enterprises Investor Day
Slide 9: BEI Today
BEI Today A New Company More Successful Operating Units Solid Financials "Can Do" Culture
Slide 10: BEI Business Units Drive Profitable Growth
BEI Business Units DRIVE PROFITABLE GROWTH
Slide 11: My Topics Today
My Topics Today BEI Profile How Far We've Come Fundamental Strategies EBITDA Guidance for 2005 1 2 3 4
Slide 12: BEI Today: Leading Provider of Eldercare Services
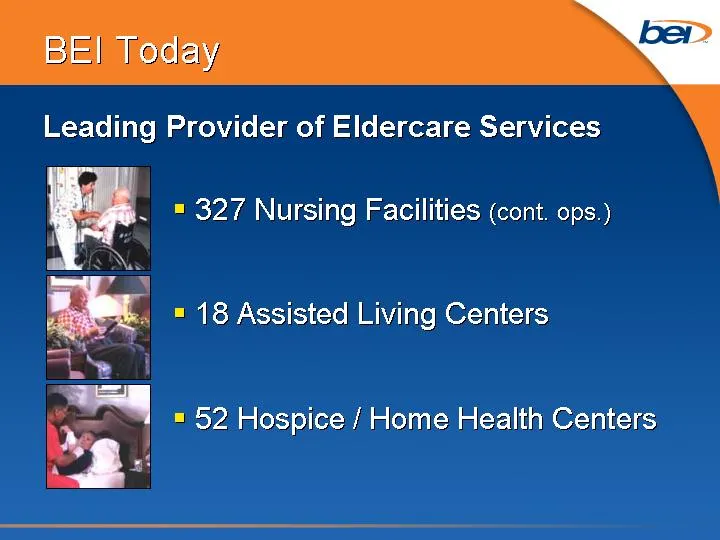
BEI Today Leading Provider of Eldercare Services 327 Nursing Facilities (cont. ops.) 18 Assisted Living Centers 52 Hospice / Home Health Centers
Slide 13: BEI Today: Own Facilities Plus Other Providers
BEI Today In Our Own Facilities Plus 585 Operated by Other Providers Rehabilitative Therapy
Slide 14: BEI Today: 34,000 Employees, $2 Billion Revenues
BEI Today 34,000 Men and Women Providing High Quality Healthcare More than $2 Billion Annual Revenues Successfully Operate in 37 States and the District of Columbia
Slide 15: How Far We've Come
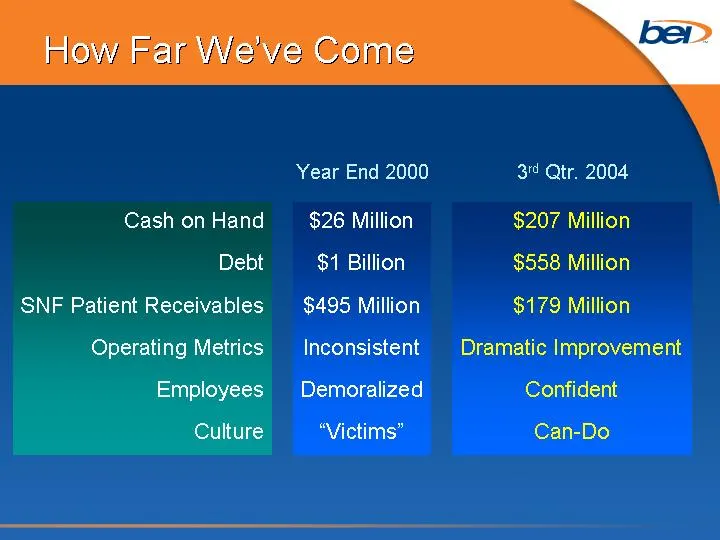
How Far We've Come $26 Million $1 Billion $495 Million Inconsistent Demoralized "Victims" $207 Million $558 Million $179 Million Dramatic Improvement Confident Can-Do Year End 2000 3rd Qtr. 2004 Cash on Hand Debt SNF Patient Receivables Operating Metrics Employees Culture
Slide 16: The New BEI: Strategic Plan
The New BEI STRATEGIC PLAN
Slide 17: Fundamental Strategies
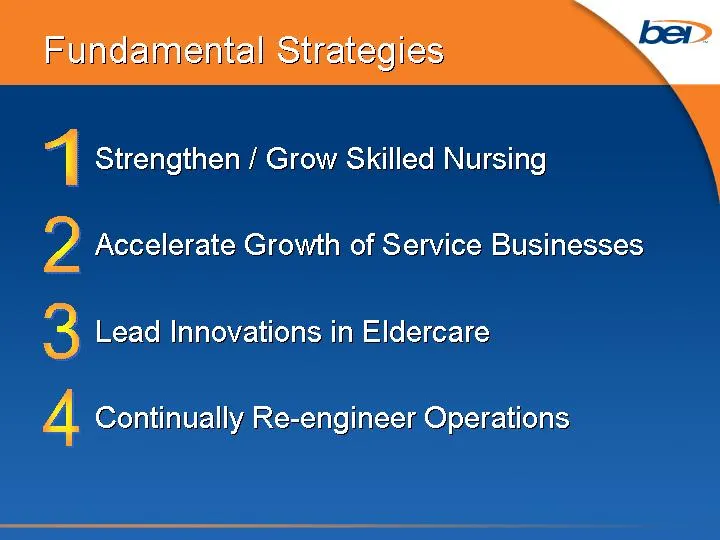
Fundamental Strategies Strengthen / Grow Skilled Nursing Accelerate Growth of Service Businesses Lead Innovations in Eldercare Continually Re-engineer Operations 1 2 3 4
Slide 18: Fundamental Strategies
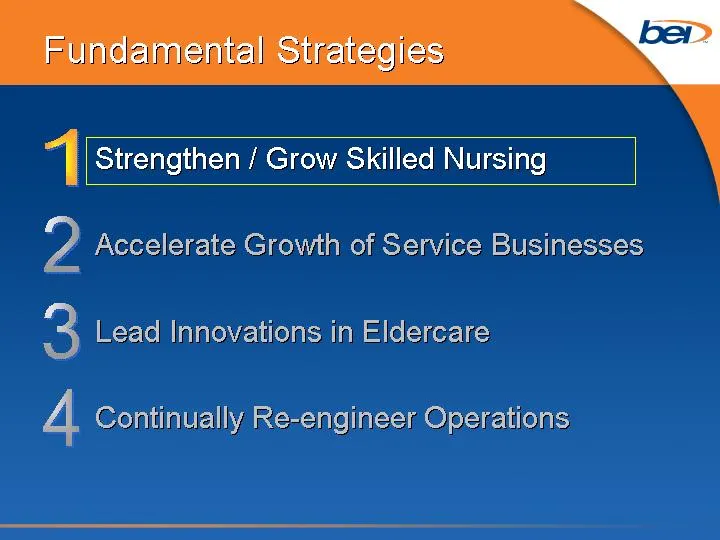
Fundamental Strategies Strengthen / Grow Skilled Nursing Accelerate Growth of Service Businesses Lead Innovations in Eldercare Continually Re-engineer Operations 1 2 3 4
Slide 19: Fundamental Strategies
Fundamental Strategies Strengthen / Grow Skilled Nursing Accelerate Growth of Service Businesses Lead Innovations in Eldercare Continually Re-engineer Operations 1 2 3 4
Slide 20: Fundamental Strategies
Fundamental Strategies Strengthen / Grow Skilled Nursing Accelerate Growth of Service Businesses Lead Innovations in Eldercare Continually Re-engineer Operations 1 2 3 4
Slide 21: Innovations in Eldercare
Innovations in Eldercare Quality-of-Care Alzheimer's Program Freedom Through Functionality
Slide 22: Innovations in Eldercare: Technology
Innovations in Eldercare Technology CareTracker Proper Payment for Care Provided Labor Management System Effectively Manage Labor Costs
Slide 23: Innovations in Eldercare: Corporate Support
Innovations in Eldercare Corporate Support Procurement Group Market Expertise to Other Providers Offset Overhead Turn Cost Centers Into Profit Centers
Slide 24: Innovations in Eldercare: Opportunities
Innovations in Eldercare Opportunities Reduce Costs / Improve Quality Further Increase Efficiency Tele-monitoring Tele-medicine
Slide 25: Fundamental Strategies
Fundamental Strategies Strengthen / Grow Skilled Nursing Accelerate Growth of Service Businesses Lead Innovations in Eldercare Continually Re-engineer Operations 1 2 3 4
Slide 26: Re-engineering Operations
Re-engineering Operations CareTracker Labor Management System Restructuring Balance Sheet Changes In the Way We Do Business
Slide 27: Re-engineering Operations: GAP Initiatives
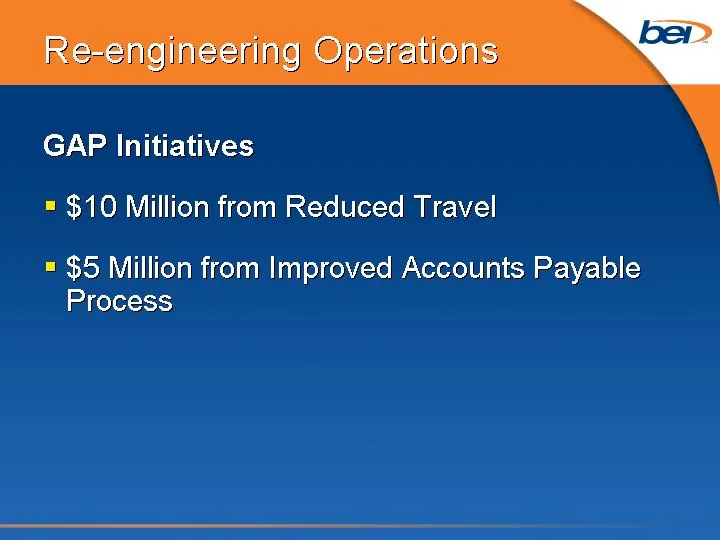
Re-engineering Operations GAP Initiatives $10 Million from Reduced Travel $5 Million from Improved Accounts Payable Process
Slide 28: Re-engineering Operations: Total Cost Reductions $220 Million
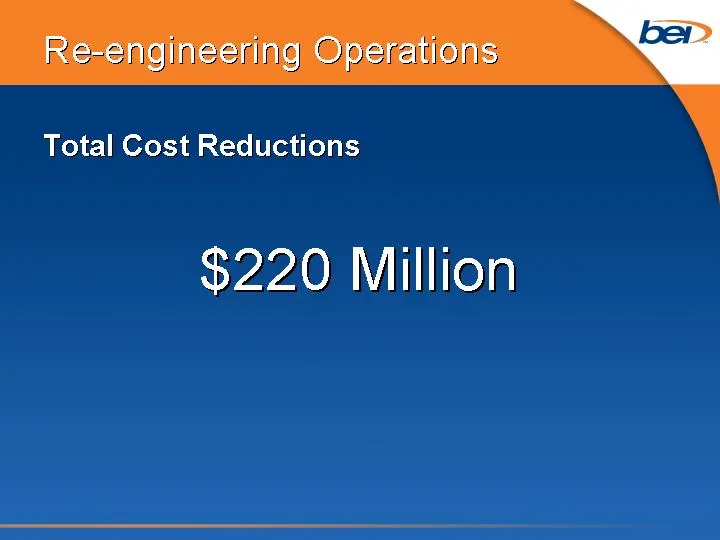
Re-engineering Operations Total Cost Reductions $220 Million

Slide 29: The New BEI: Strategic Synergies
The New BEI STRATEGIC SYNERGIES
Slide 30: Strategic Synergies
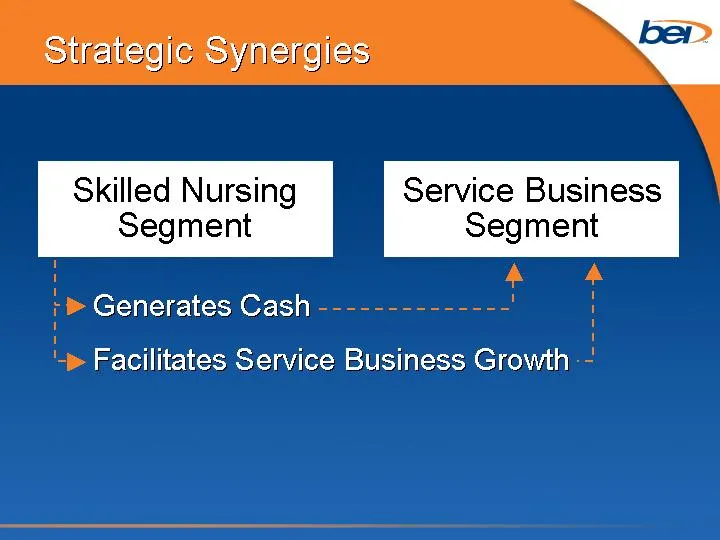
Strategic Synergies Generates Cash Facilitates Service Business Growth Skilled Nursing Segment Service Business Segment
Slide 31: Strategic Synergies: Other Nursing Home Business, Aegis
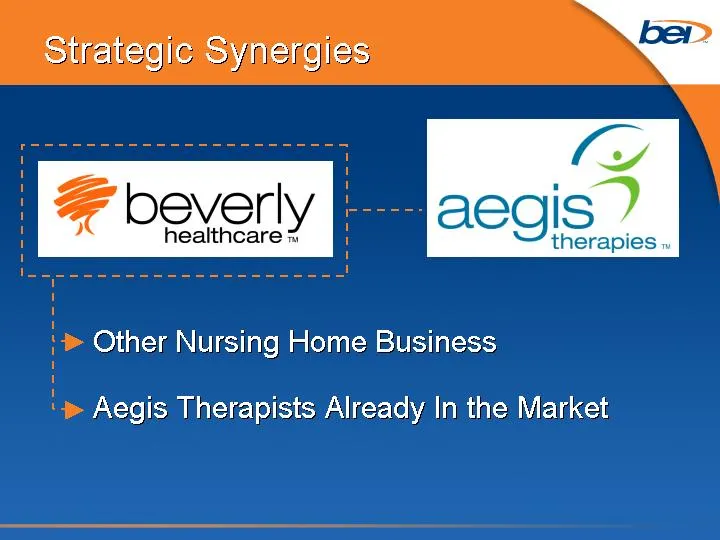
Strategic Synergies Other Nursing Home Business Aegis Therapists Already In the Market
Slide 32: Strategic Synergies: Other Nursing Home Business
Strategic Synergies Other Nursing Home Business - - May Be Part of Larger Regional Chain - - Low-Cost / Low-Risk Entry
Slide 33: Strategic Synergies: New Locations in Beverly Healthcare Markets
Strategic Synergies 30 of 51 In Beverly Healthcare Markets 16 of 16 New Locations
Slide 34: Holistic Strategy
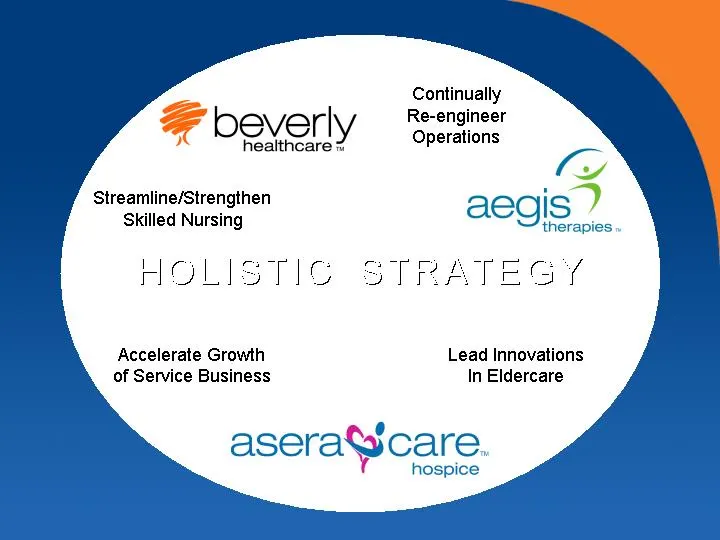
HOLISTIC STRATEGY Streamline/Strengthen Skilled Nursing Accelerate Growth of Service Business Lead Innovations In Eldercare Continually Re-engineer Operations
Slide 35: Holistic Strategy
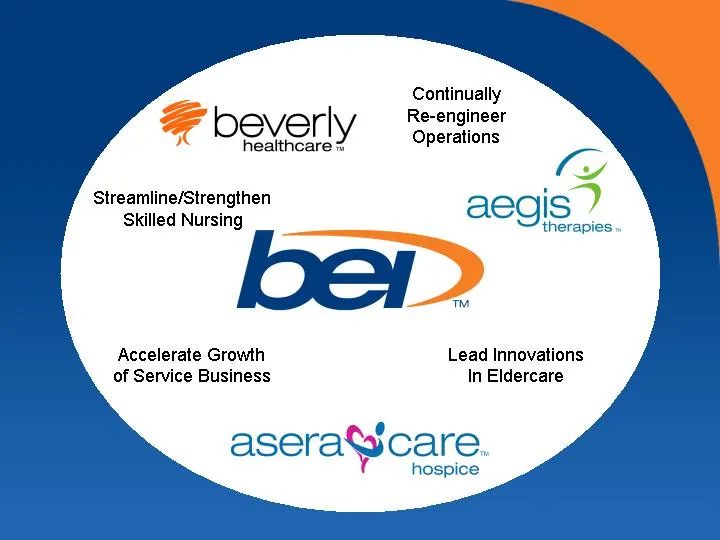
Streamline/Strengthen Skilled Nursing Accelerate Growth of Service Business Continually Re-engineer Operations Lead Innovations In Eldercare
Slide 36: BEI Today: Performance
BEI Today PERFORMANCE
Slide 37: Performance: EBITDA Guidance
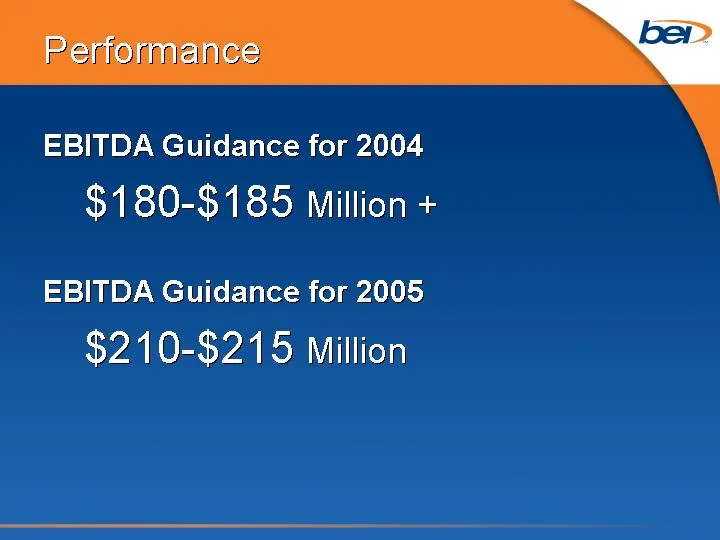
Performance EBITDA Guidance for 2004 $180-$185 Million + EBITDA Guidance for 2005 $210-$215 Million
Slide 38: 2005 EBITDA Guidance: Medicare Funding
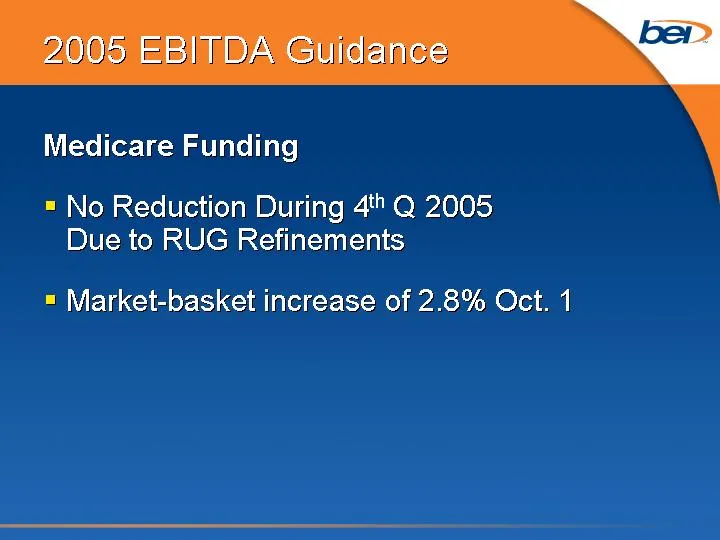
2005 EBITDA Guidance Medicare Funding No Reduction During 4th Q 2005 Due to RUG Refinements Market-basket increase of 2.8% Oct. 1
Slide 39: 2005 EBITDA Guidance: Medicare Funding
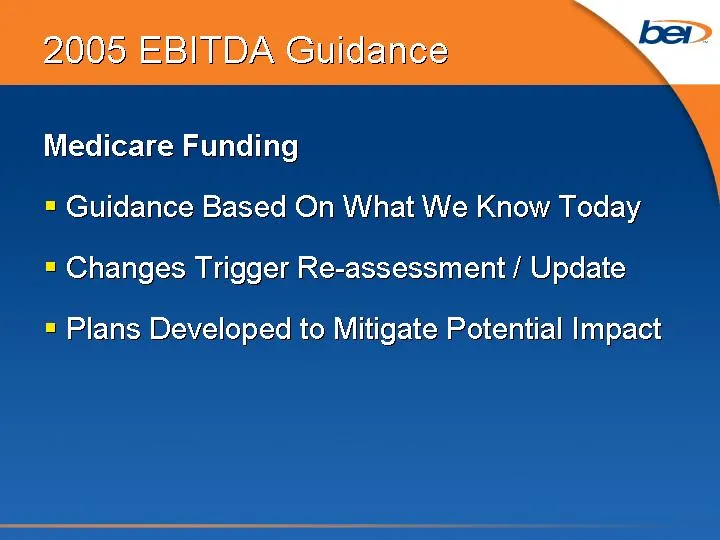
2005 EBITDA Guidance Medicare Funding Guidance Based On What We Know Today Changes Trigger Re-assessment / Update Plans Developed to Mitigate Potential Impact
Slide 40: Dave Devereaux, COO Beverly Healthcare
DAVE DEVEREAUX Executive Vice President Chief Operating Officer Beverly Healthcare
Slide 41: Skilled Nursing Facilities
SKILLED NURSING FACILITIES
Slide 42: Improving Operations
IMPROVING OPERATIONS
Slide 43: Improving Operations: Reshaping Our Portfolio
Improving Operations Reshaping Our Portfolio
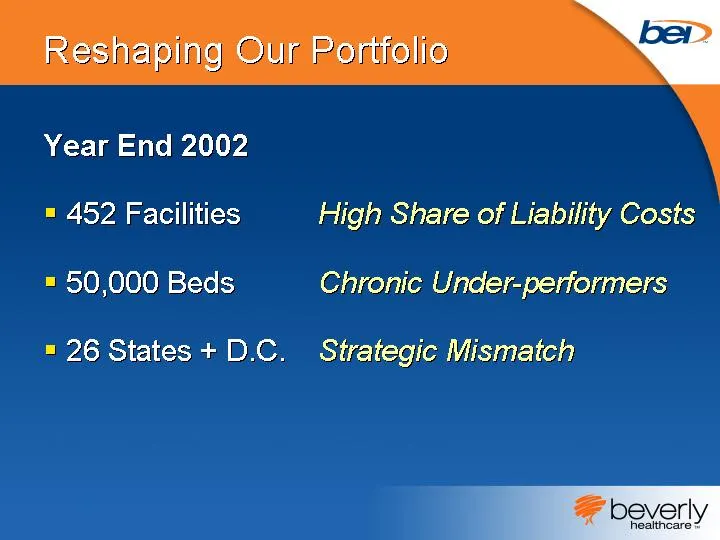
Slide 44: Reshaping Our Portfolio: Year End 2002
Reshaping Our Portfolio Year End 2002 452 Facilities 50,000 Beds 26 States + D.C. High Share of Liability Costs Chronic Under-performers Strategic Mismatch
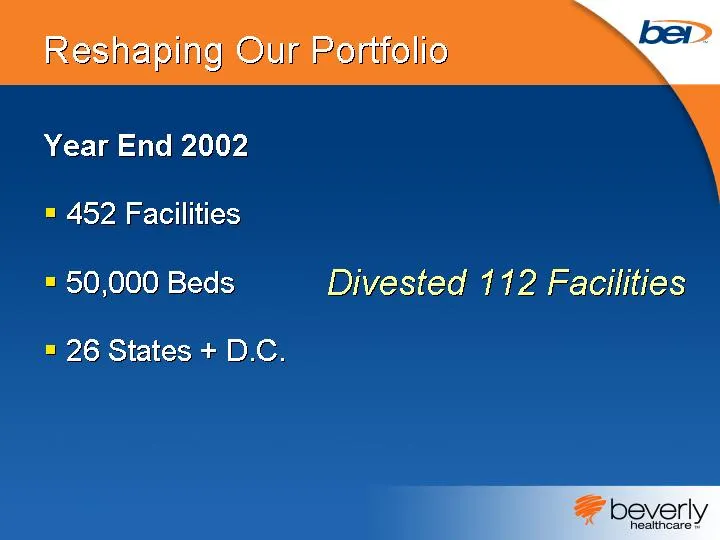
Slide 45: Reshaping Our Portfolio: Divested 112 Facilities
Reshaping Our Portfolio Year End 2002 452 Facilities 50,000 Beds 26 States + D.C. Divested 112 Facilities
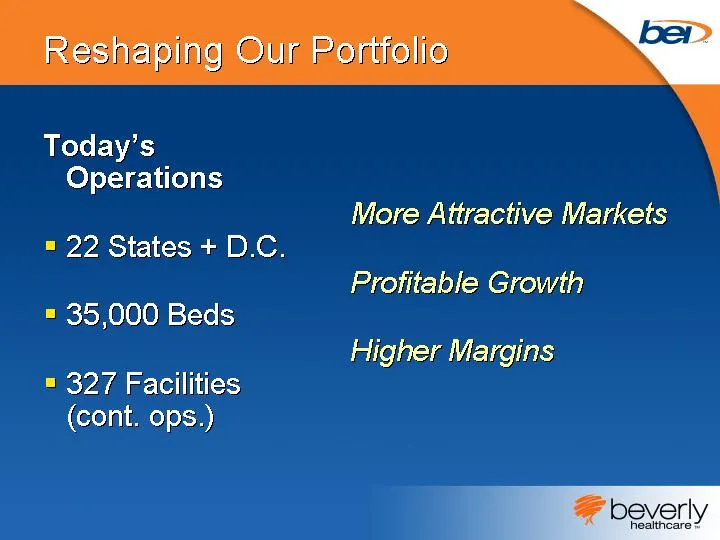
Slide 46: Reshaping Our Portfolio: Today's Operations
Reshaping Our Portfolio Today's Operations 22 States + D.C. 35,000 Beds 327 Facilities (cont. ops.) More Attractive Markets Profitable Growth Higher Margins
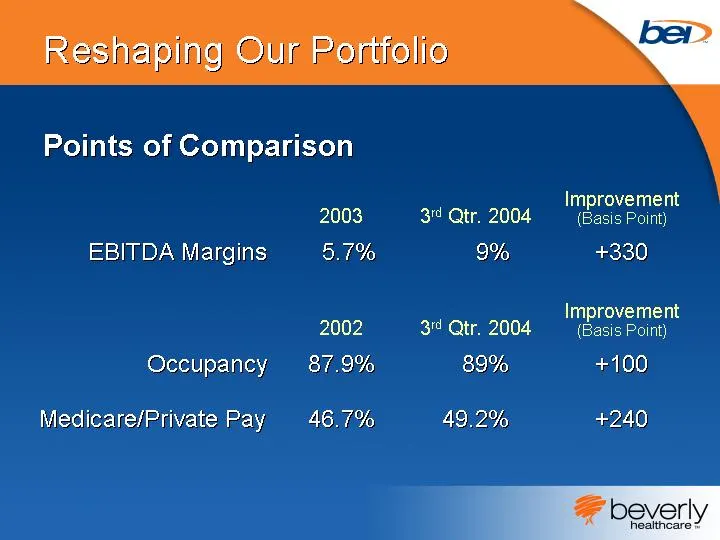
Slide 47: Reshaping Our Portfolio: Points of Comparison
Reshaping Our Portfolio 5.7% 87.9% 46.7% 9% 89% 49.2% 2003 3rd Qtr. 2004 EBITDA Margins Occupancy Medicare/Private Pay +330 +100 +240 Improvement (Basis Point) Points of Comparison 2002 3rd Qtr. 2004 Improvement (Basis Point)
Slide 48: Better Quality of Care
Improving Operations Reshaping Our Portfolio Better Quality of Care
Slide 49: Quality of Care Starts at the Facility Level
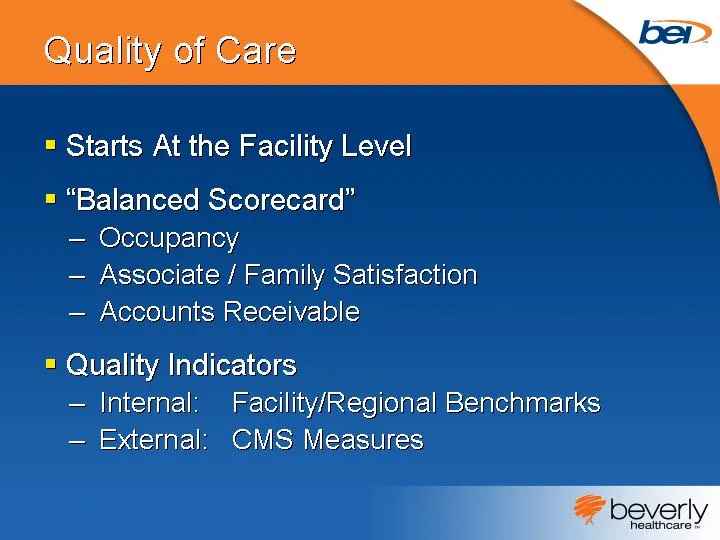
Quality of Care Starts At the Facility Level "Balanced Scorecard" Occupancy Associate / Family Satisfaction Accounts Receivable Quality Indicators Internal: Facility/Regional Benchmarks External: CMS Measures
Slide 50: Quality of Care: Leadership Compensation
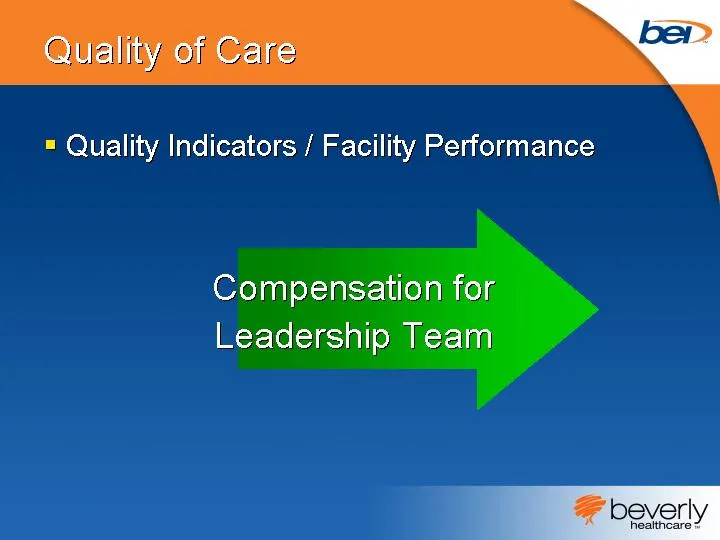
Quality of Care Quality Indicators / Facility Performance Compensation for Leadership Team
Slide 51: Quality of Care: Exceptional Facility Performance
Quality of Care Exceptional Facility Performance $100 Cash Bonus for All Facility Associates!
Slide 52: Quality of Care: Results of Improvement
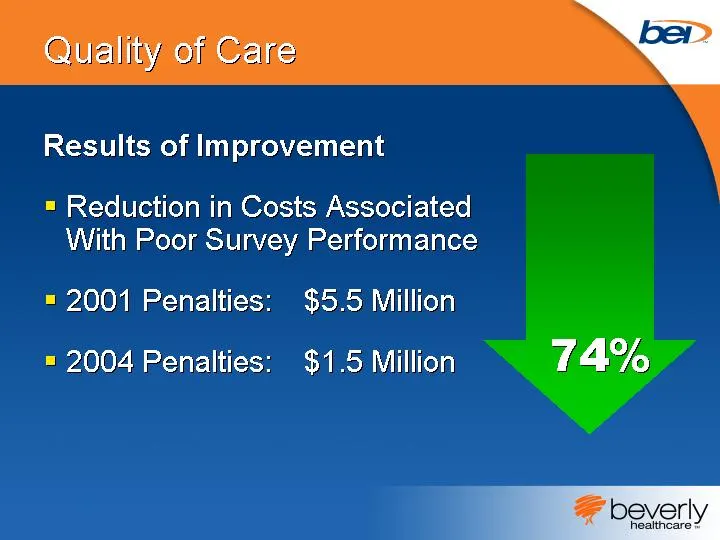
Quality of Care Results of Improvement Reduction in Costs Associated With Poor Survey Performance 2001 Penalties: $5.5 Million 2004 Penalties: $1.5 Million 74%
Slide 53: Incentive Compensation
Improving Operations Reshaping Our Portfolio Better Quality of Care Incentive Compensation
Slide 54: Incentive Compensation 2004
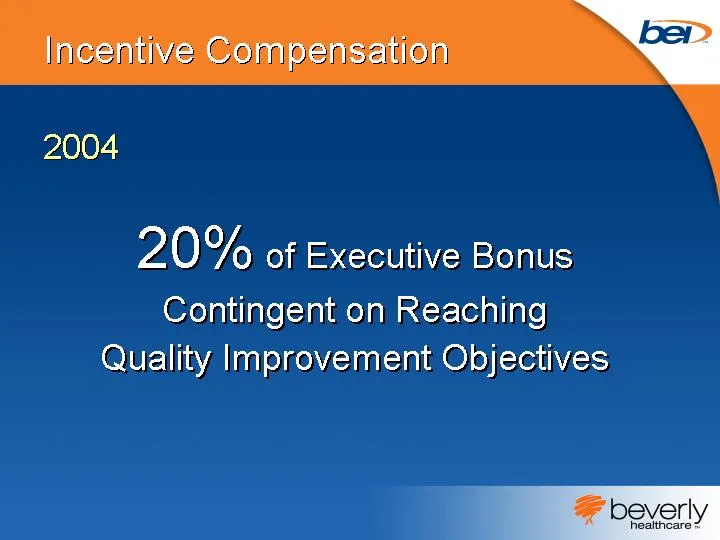
Incentive Compensation 2004 20% of Executive Bonus Contingent on Reaching Quality Improvement Objectives
Slide 55: Incentive Compensation 2005
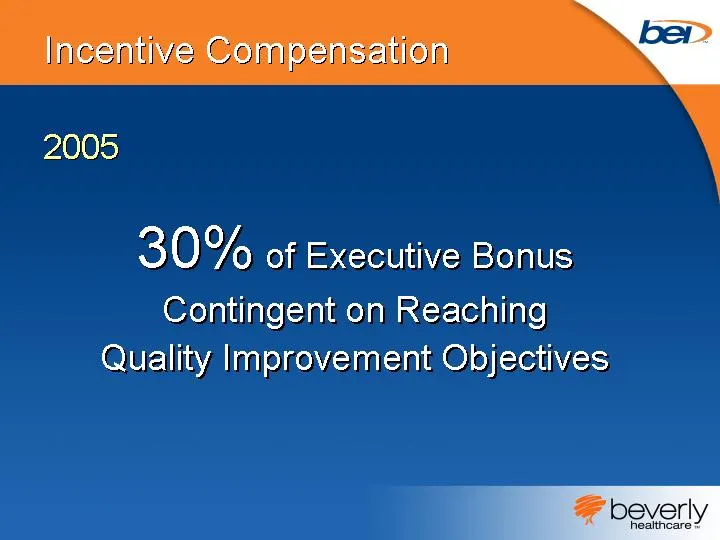
Incentive Compensation 2005 30% of Executive Bonus Contingent on Reaching Quality Improvement Objectives
Slide 56: Skilled Nursing Facilities: A Solid Portfolio
Skilled Nursing Facilities A SOLID PORTFOLIO
Slide 57: Profitable Growth Initiatives
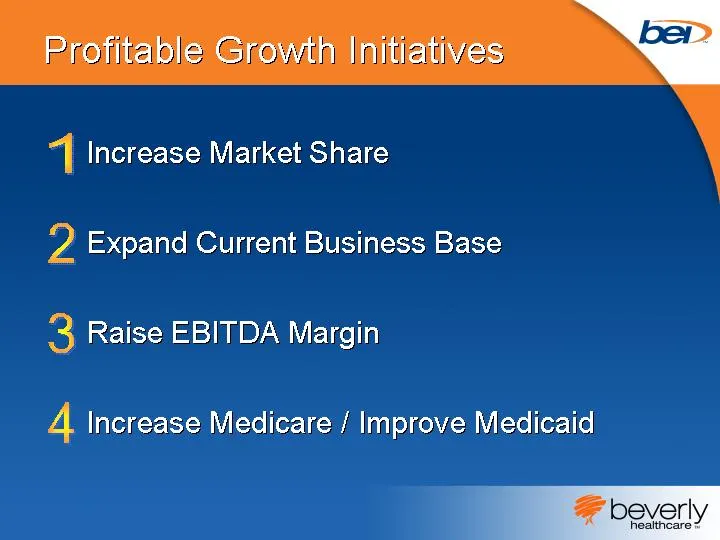
Profitable Growth Initiatives Increase Market Share Expand Current Business Base Raise EBITDA Margin Increase Medicare / Improve Medicaid 1 2 3 4
Slide 58: Key Points
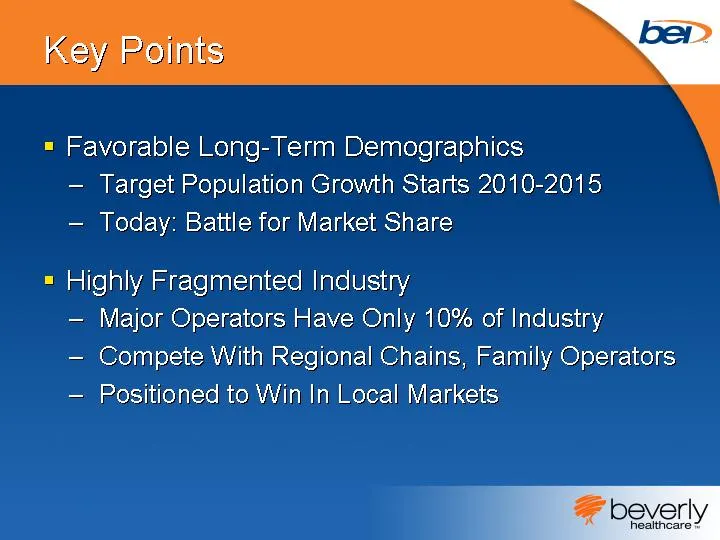
Key Points Favorable Long-Term Demographics Target Population Growth Starts 2010-2015 Today: Battle for Market Share Highly Fragmented Industry Major Operators Have Only 10% of Industry Compete With Regional Chains, Family Operators Positioned to Win In Local Markets
Slide 59: Increase Market Share: Broaden Clinical Products
Profitable Growth Initiatives Increase Market Share 1 Broaden Base of Clinical Products Offered Differentiate from Other Providers
Slide 60: Typical Nursing Home Today
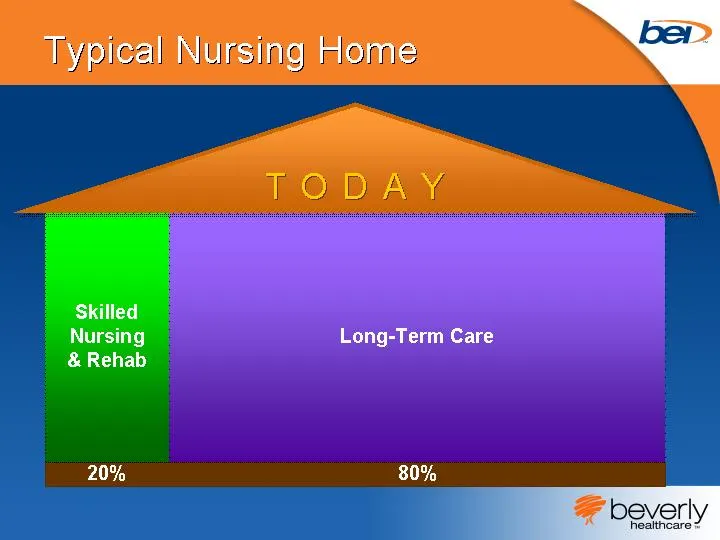
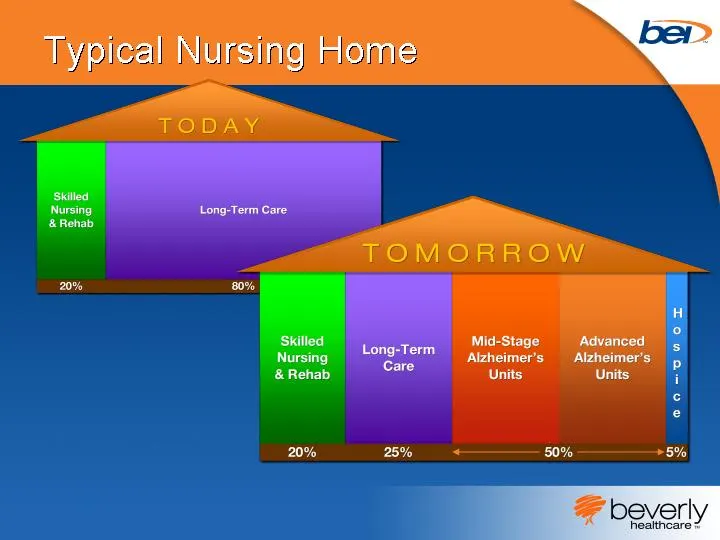
Typical Nursing Home Skilled Nursing & Rehab Long-Term Care 20% 80% TODAY
Slide 61: Typical Nursing Home: Two Product Lines
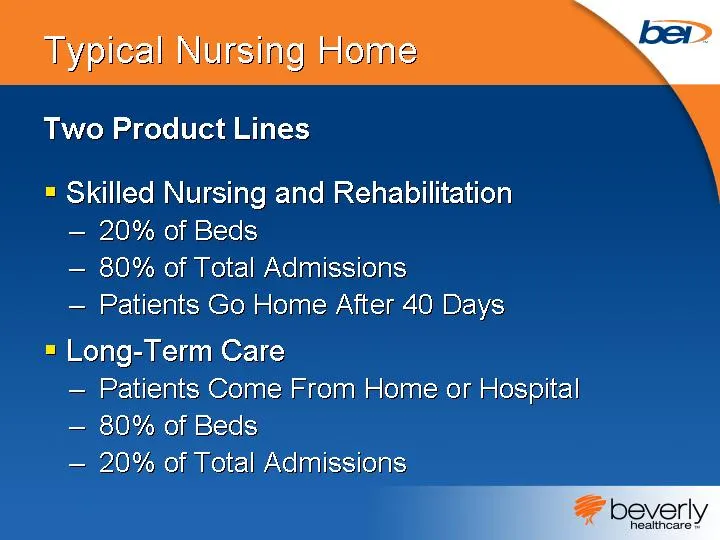
Typical Nursing Home Skilled Nursing and Rehabilitation 20% of Beds 80% of Total Admissions Patients Go Home After 40 Days Long-Term Care Patients Come From Home or Hospital 80% of Beds 20% of Total Admissions Two Product Lines
Slide 62: Typical Nursing Home: Incorrectly Viewed as a Commodity
Typical Nursing Home Two Product Lines INCORRECTLY VIEWED AS A COMMODITY BUSINESS
Slide 63: Major Challenges to Building Market Share
Typical Nursing Home Two Product Lines MAJOR CHALLENGES TO BUILDING / MAINTAINING MARKET SHARE
Slide 64: Continuous Bed Turnover
Typical Nursing Home Continuous Bed Turnover Marketing and Admissions Work Hard to Stay Even Skilled Nursing & Rehab
Slide 65: Long-Term Care: Difficult to Grow
Typical Nursing Home Relatively More Stable Difficult to Grow Long-Term Care
Slide 66: Five Product Business Model
Generates Higher / More Stable Occupancy Larger Share of Local Market Based on Premise: Skilled Nursing Facilities Are NOT a Commodity Business Allows Us to Differentiate Five Product Business Model Increase Market Share
Slide 67: Typical Nursing Home Tomorrow
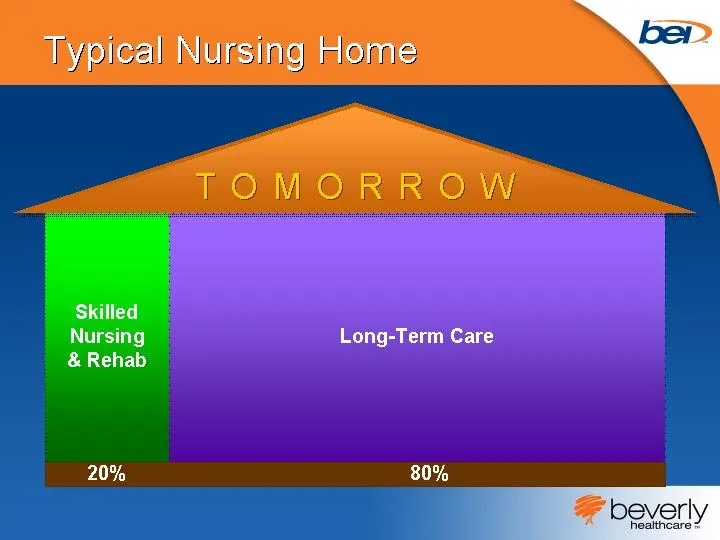
Long-Term Care 80% Typical Nursing Home Skilled Nursing & Rehab 20% TOMORROW 80%
Slide 68: Tomorrow: Mid-Stage and Advanced Alzheimer's Units
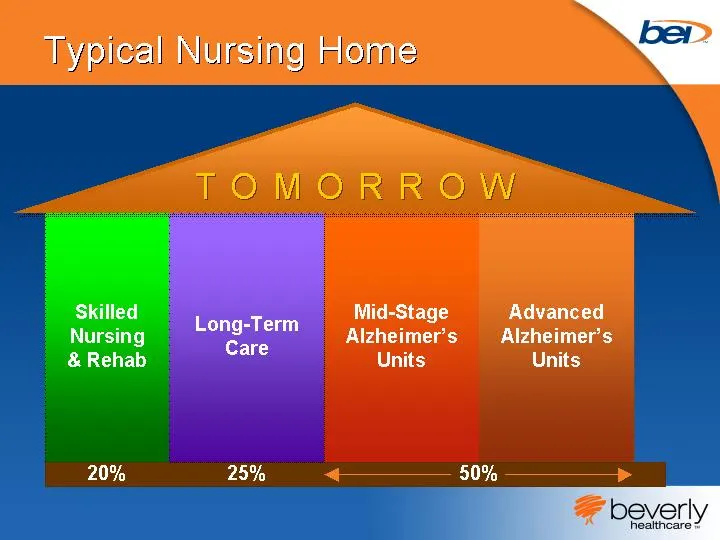
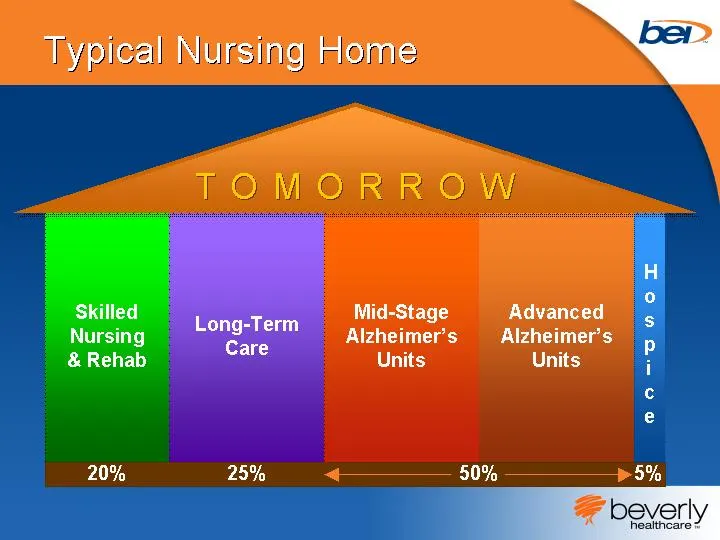
Mid-Stage Alzheimer's Units Advanced Alzheimer's Units 80% Typical Nursing Home Skilled Nursing & Rehab 20% Long-Term Care 25% TOMORROW 50%
Slide 69: Differentiates Us From Local Competitors
Differentiates Us From Local Competitors Provides a Stable Platform for Growth Increase Market Share
Slide 70: Mid-Stage Units
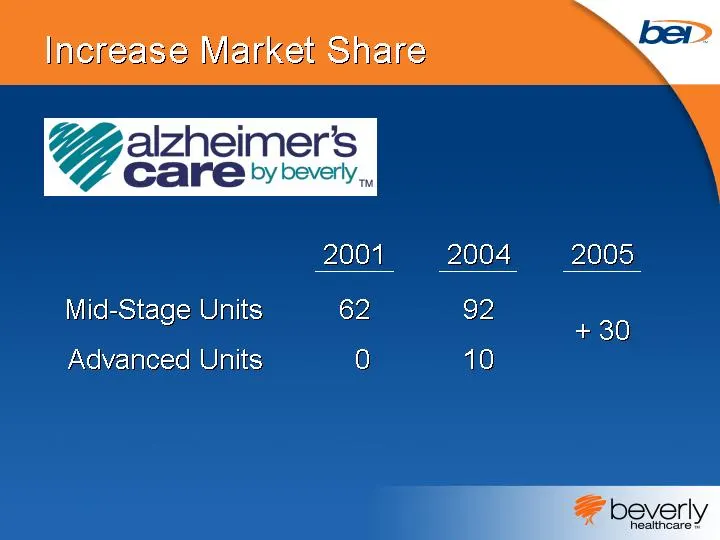
Operate 92 Units Designed for Patients In Middle Stages Occupy One Wing: 25-35 Beds Investment: $250,000 per unit Provide a More Home-Like Environment Mid-Stage Units Increase Market Share
Slide 71: Mid-Stage Units: Specially Trained Staff
Staff Specially Trained Curriculum Developed With National Alzheimer's Association Mid-Stage Units Increase Market Share
Slide 72: Advanced-Care Units
Mid-Stage Unit Not Suited for Patients In Advanced Stages Patients Are Less Mobile / Require More Complex Care Increase Market Share Advanced-Care Units
Slide 73: Advanced-Care Units: Investment and ROI
Investment: $275,000 per unit Annual ROI: 20% avg. For Both Types of Units Advanced-Care Units Increase Market Share
Slide 74: Revenue Contributions
Increase Market Share Revenue Contributions Modest Private Pay Premium Incremental Census Gains
Slide 75: Alzheimer's Focus
Increase Market Share Alzheimer's Focus Distinctive Clinical Service Reduce Patient Turnover Capture Larger Share of Local Market
Slide 76: Mid-Stage and Advanced Units Growth
Mid-Stage Units Advanced Units 62 0 2001 92 10 2004 Increase Market Share
Slide 77: Tomorrow: Including Hospice
Typical Nursing Home Skilled Nursing & Rehab 20% Long-Term Care 25% TOMORROW Mid-Stage Alzheimer's Units Advanced Alzheimer's Units 50% 5% H o s p i c e
Slide 78: Typical Nursing Home Tomorrow
Typical Nursing Home ad BRAC Eye Long-Term Care TOMORROW 20% H Mid-Stage Advanced tong-rerm Alzheimer’s Alzheimer's 5 Units Units c e 20% 25% 50% 5% everly
Slide 79: Hospice Programs
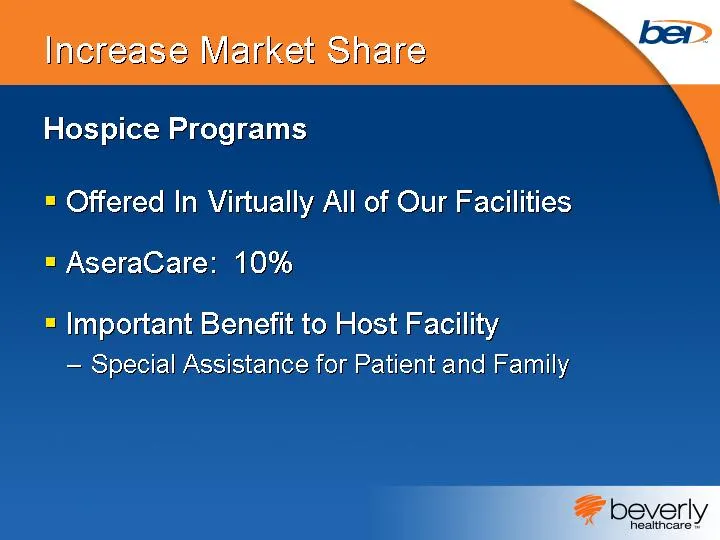
Hospice Programs Offered In Virtually All of Our Facilities AseraCare: 10% Important Benefit to Host Facility Special Assistance for Patient and Family Increase Market Share
Slide 80: Five Product Business Model
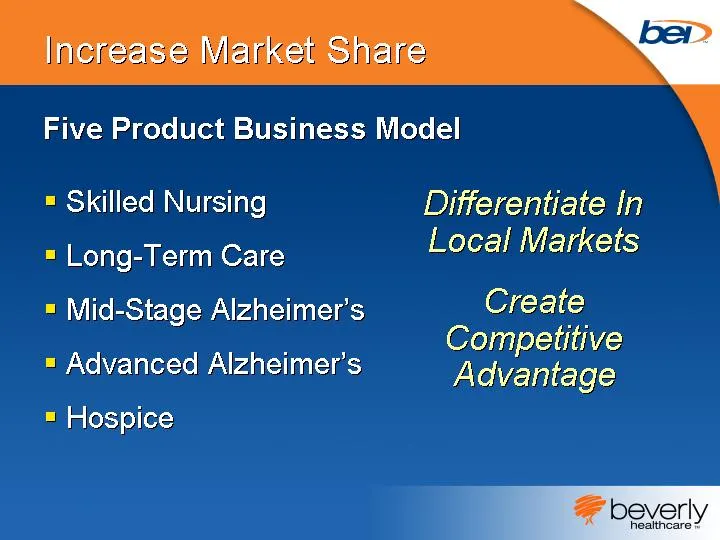
Skilled Nursing Long-Term Care Mid-Stage Alzheimer's Advanced Alzheimer's Hospice Five Product Business Model Differentiate In Local Markets Create Competitive Advantage Increase Market Share
Slide 81: Five Product Business Model: Adapt the Model
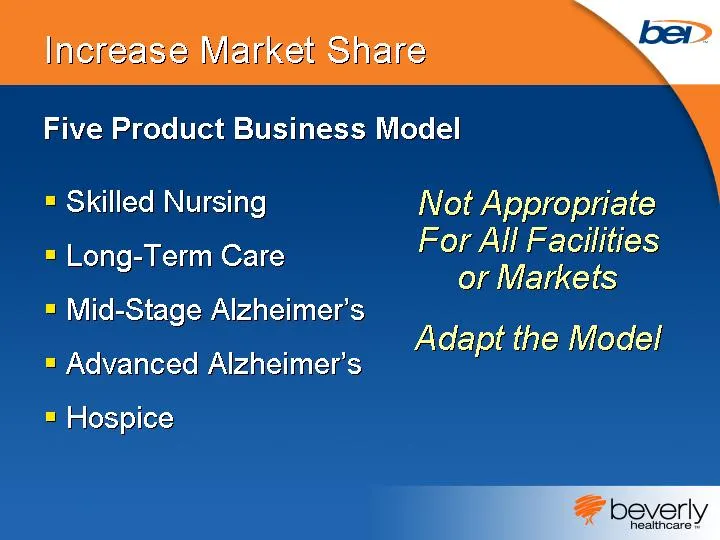
Skilled Nursing Long-Term Care Mid-Stage Alzheimer's Advanced Alzheimer's Hospice Five Product Business Model Not Appropriate For All Facilities or Markets Adapt the Model Increase Market Share
Slide 82: Local Marketing Plans
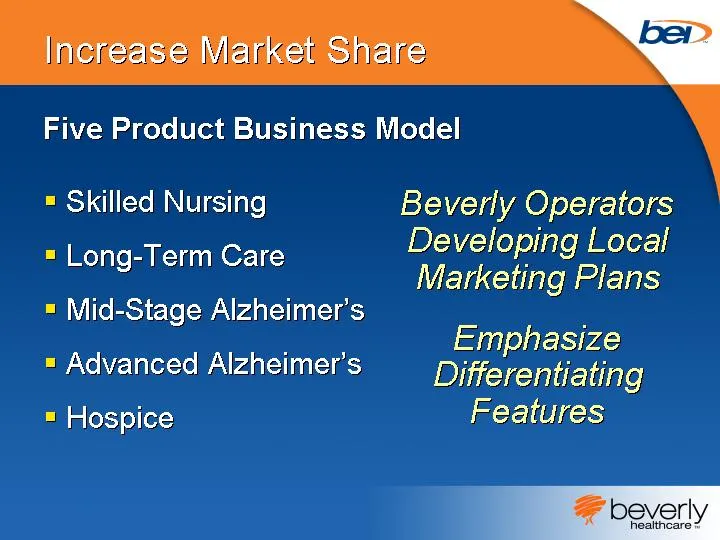
Skilled Nursing Long-Term Care Mid-Stage Alzheimer's Advanced Alzheimer's Hospice Five Product Business Model Beverly Operators Developing Local Marketing Plans Emphasize Differentiating Features Increase Market Share
Slide 83: Profitable Growth Initiatives: Increase Market Share
Profitable Growth Initiatives Increase Market Share 1 Broaden Base of Clinical Products Offered Differentiate from Other Providers
Slide 84: Expand Current Business
Profitable Growth Initiatives Expand Current Business Build New & Replacement Facilities Add Bed Capacity 2
Slide 85: Expand Current Business: Capital Spending
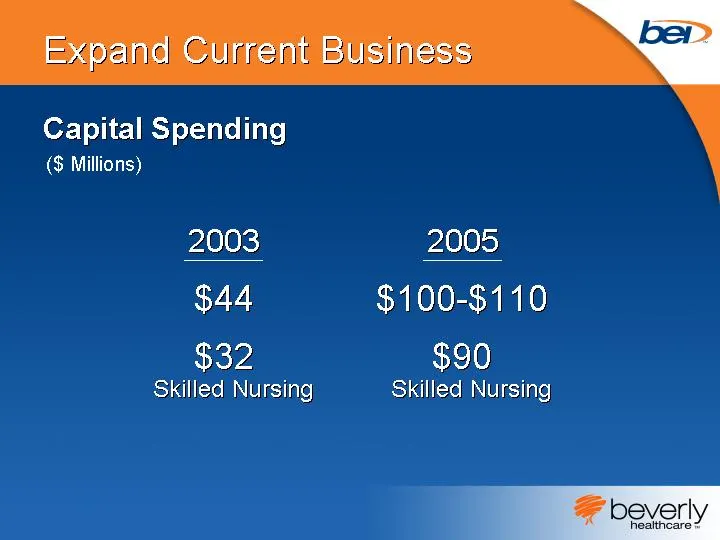
Expand Current Business Capital Spending $44 2003 ($ Millions) $32 Skilled Nursing $100-$110 2005 $90 Skilled Nursing
Slide 86: Four New Skilled Nursing Facilities
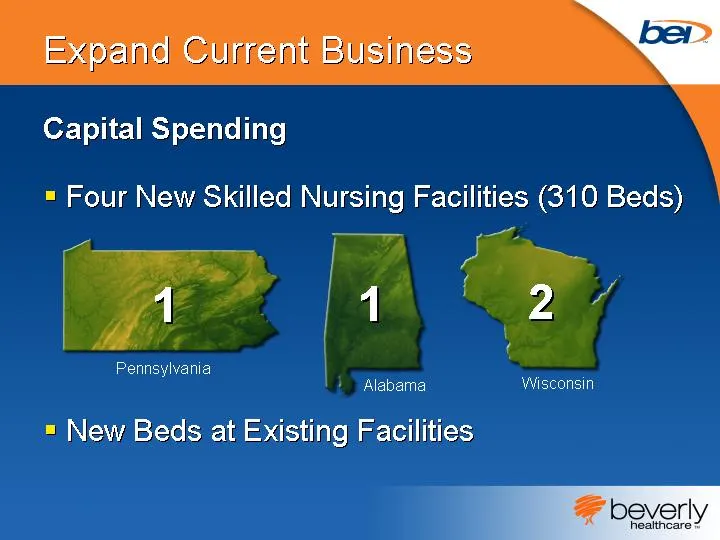
1 Pennsylvania Expand Current Business Four New Skilled Nursing Facilities (310 Beds) Capital Spending 1 Alabama 2 Wisconsin New Beds at Existing Facilities
Slide 87: Strengthen Skilled Nursing Segment
Expand Current Business Strengthen Skilled Nursing Segment Individual Facilities Regional Chain Operators Densify Position In Key Markets Explore Accretive Acquisitions
Slide 88: Raise EBITDA Margins
Profitable Growth Initiatives Raise EBITDA Margins More Profit From Each Revenue Dollar 3
Slide 89: Raise EBITDA Margins: Two Initiatives
Raise EBITDA Margins Two Initiatives Improve Overall Performance, Turn Around Underperforming Facilities Use Technology to Improve Margins
Slide 90: Massachusetts: Microcosm of a Corporate Turnaround
Massachusetts: Microcosm of a Corporate Turnaround Corporate Turnaround
Slide 91: Kevin Roberts, SVP Financial Operations
KEVIN ROBERTS Senior Vice President, Financial Operations Beverly Healthcare
Slide 92: Penny Business: Grow Revenue and Contain Costs
Penny Business Grow Revenue & Contain Costs

Slide 93: Innovative Technology
Innovative Technology
Slide 94: Activities of Daily Living
ACTIVITIES OF DAILY LIVING
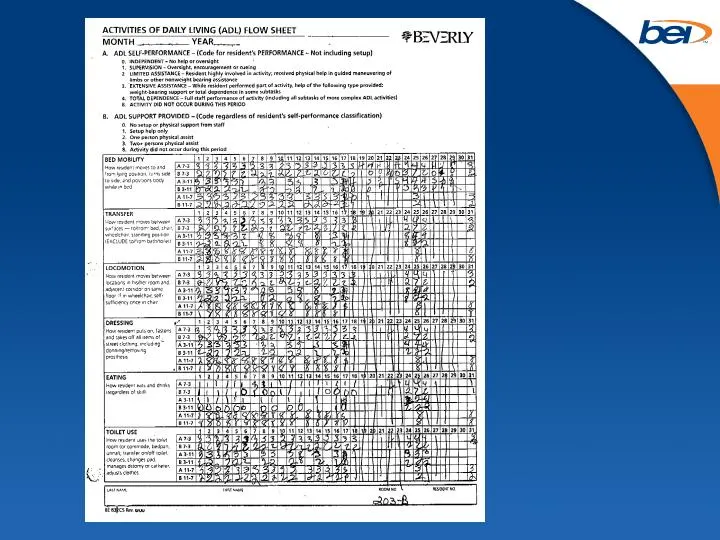
Slide 95: Activities of Daily Living Flow Sheet
ACTIVITIES OF DAY LIVING (AOL) FLOW SuEET Mow Yean_—_ Ea ear Ct fe eee rare; Be

Slide 96
Slide 97: Documentation Takes Second Place!
DOCUMENTATION TAKES SECOND PLACE!
Slide 98: CareTracker Touch-screen Kiosk
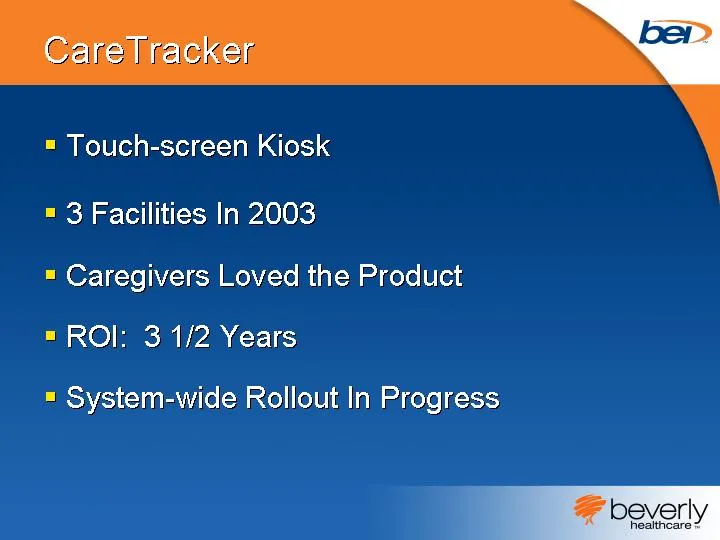
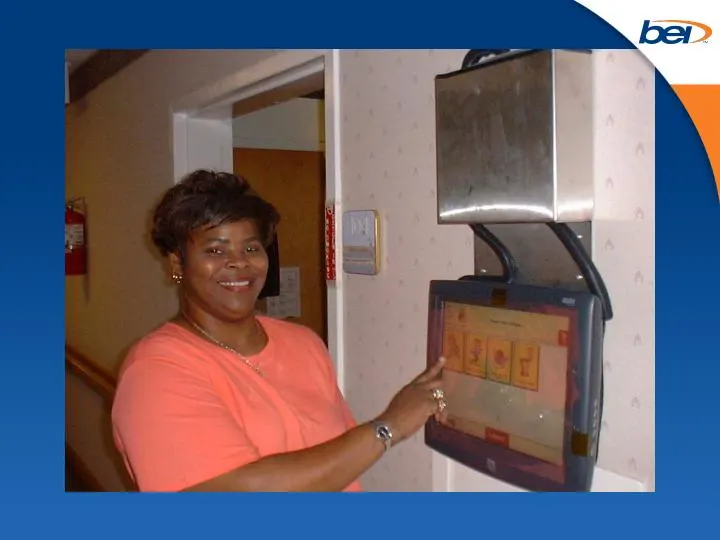
CareTracker Touch-screen Kiosk 3 Facilities In 2003 Caregivers Loved the Product ROI: 3 1/2 Years System-wide Rollout In Progress
Slide 99
Slide 100: CareTracker Staff Login Screen
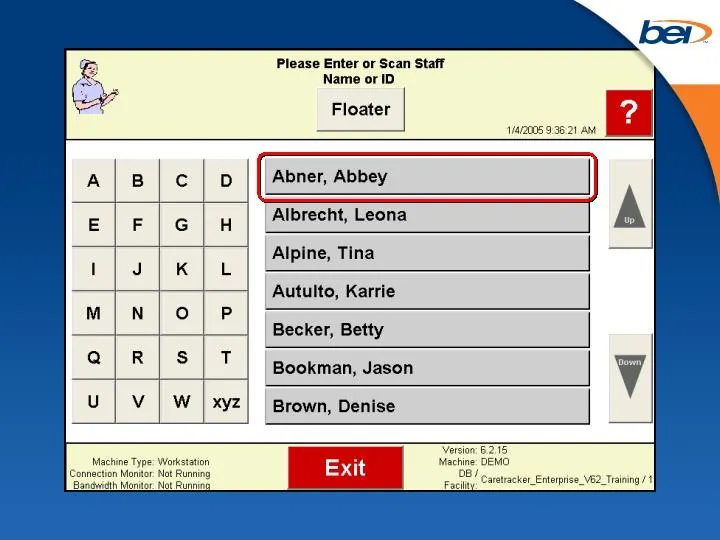
jease Enter or Scan Staff Name or ID Floater “VAl2006 9:36.21 ANA |? | R| Ss (= < Ww Abner, Abbey Albrecht, Leona Alpine, Tina Autulto, Karrie Becker, Betty Bookman, Jason Brown, Denise A v Varsion 6215 Machine DEMO OB/ sci Caretracker_Enlerpice V62_Taiing/
Slide 101: Please Select Resident
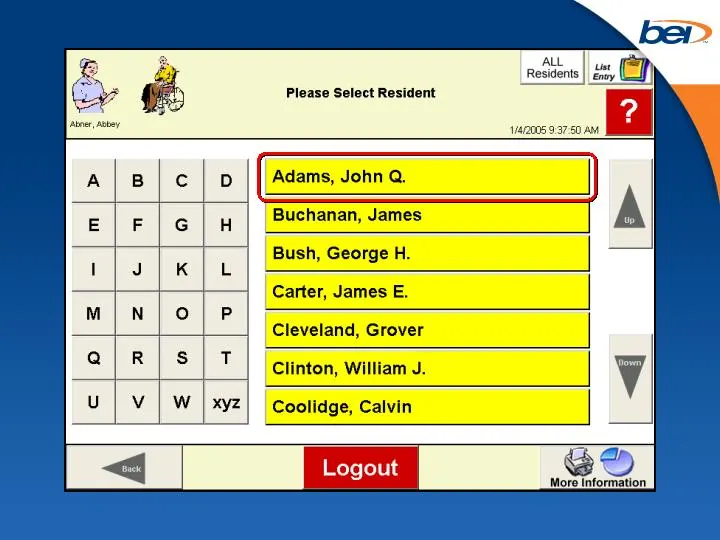
Please Select Resident resins |e 11472005 937-50 AM
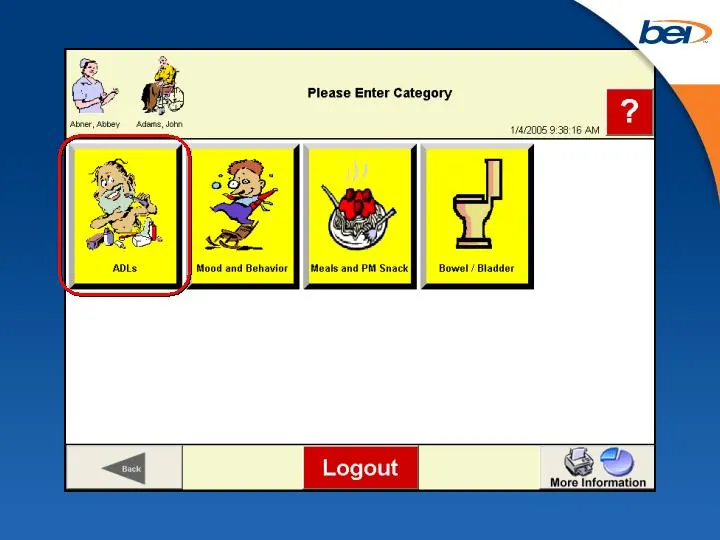
Slide 102: Please Enter Category
Please Enter Category 1182005 938.16 AM gD More Information
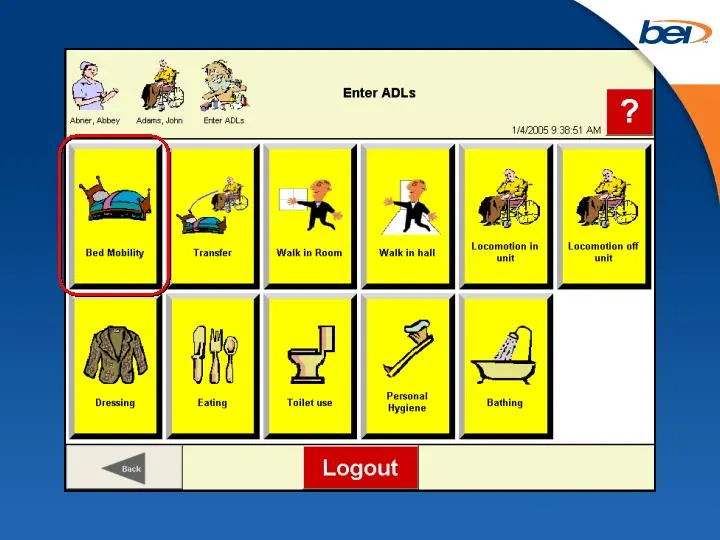
Slide 103: Enter ADLs
Enter ADLs
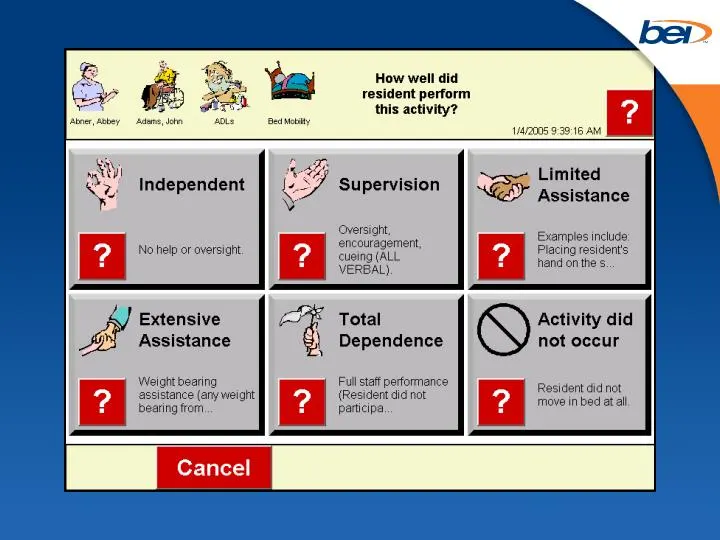
Slide 104: How Well Did Resident Perform This Activity?
How welll did resident perform this activity? 11472005 9:39:16 AM Independent Supervision wersight encouragement, cueing (AL VERBAL) No help or oversight av Total Dependence Extensive Assistance Ful staff performance (Resident did not Participa, assistance (any weig bearing from Limited Assistance E
Slide 105: CareTracker Benefits
CareTracker Benefits No Language Skills Required Accurate Record of Services Improved Documentation Positive Medicaid / Medicare Rate Impact
Slide 106: CareTracker Incremental Revenue
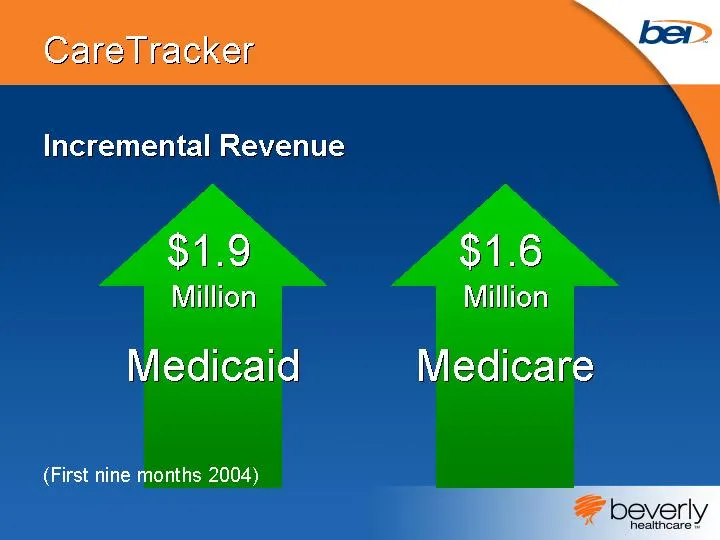
CareTracker Incremental Revenue $1.9 Million Medicaid $1.6 Million Medicare (First nine months 2004)
Slide 107: Labor Cost Containment
LABOR COST CONTAINMENT
Slide 108: Labor Management System
LABOR MANAGEMENT SYSTEM
Slide 109: Labor Management System
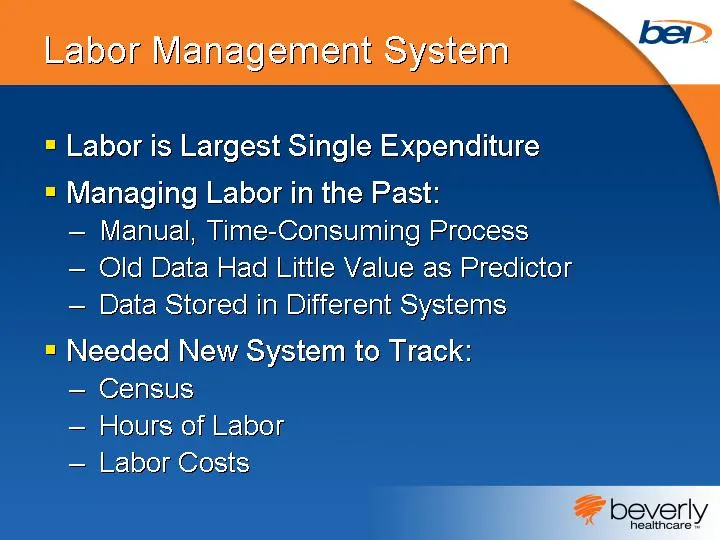
Labor Management System Labor is Largest Single Expenditure Managing Labor in the Past: Manual, Time-Consuming Process Old Data Had Little Value as Predictor Data Stored in Different Systems Needed New System to Track: Census Hours of Labor Labor Costs
Slide 110: Labor Management System: Datamart
Labor Management System Datamart Data Pulled Nightly - Available by Noon Flexible Reports by District, Facility, Department or Individual Improved Accountability
Slide 111: Labor Management System: Cost Containment Benefits
Labor Management System Cost Containment Benefits Decrease in Overtime Decrease in Facilities Exceeding Needed Hours of Labor Reduced Special Pay Program Expense Maintain Reasonable Growth in Weighted Average Wage Rate
Slide 112: Summary: Leveraged Technology
Summary Leveraged Technology to: Generate Attractive Return on Investment Improve EBITDA Margins CareTracker Payback on $7 Million Cost in 2 Years Labor Management System Reduced Labor Cost Increases by 40 BP
Slide 113: Dave Devereaux, COO Beverly Healthcare
DAVE DEVEREAUX Executive Vice President Chief Operating Officer Beverly Healthcare
Slide 114: Profitable Growth Initiatives: Increase Medicare / Improve Medicaid
Profitable Growth Initiatives Increase Medicare / Improve Medicaid 4

Slide 115: Medicare
» MEDICARE
Slide 116: Increase Medicare Revenues
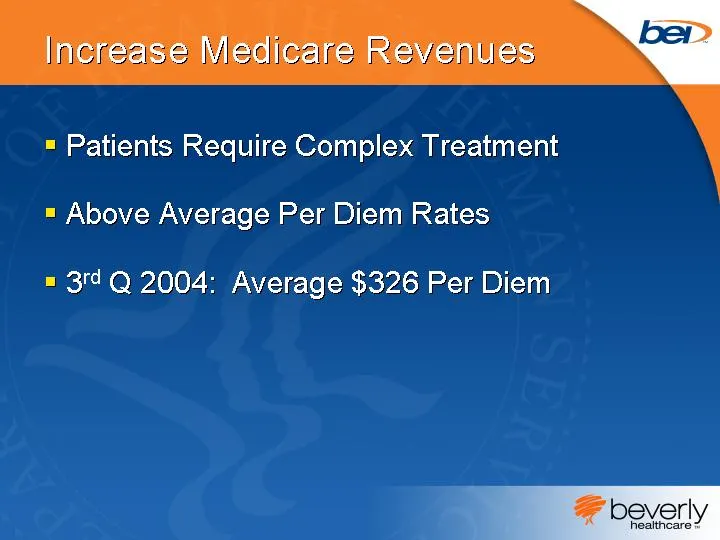
Increase Medicare Revenues Patients Require Complex Treatment Above Average Per Diem Rates 3rd Q 2004: Average $326 Per Diem
Slide 117: Medicare Per Diems
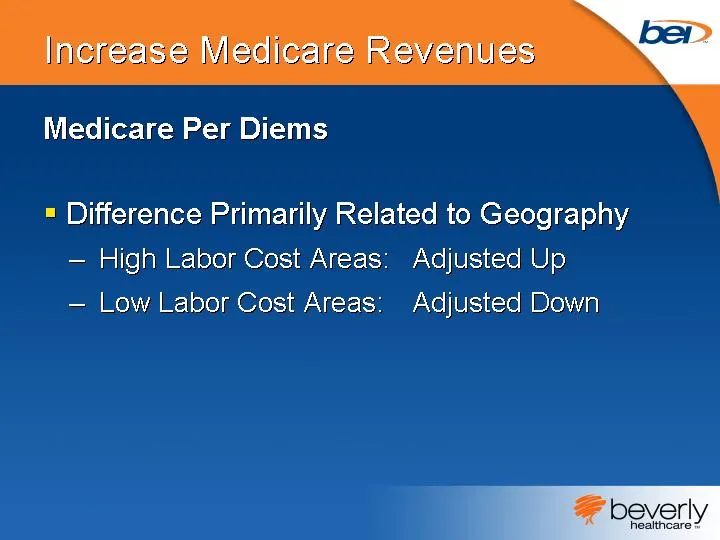
Increase Medicare Revenues Difference Primarily Related to Geography High Labor Cost Areas: Adjusted Up Low Labor Cost Areas: Adjusted Down Medicare Per Diems
Slide 118: Share of Medicare Patients: Patient Days
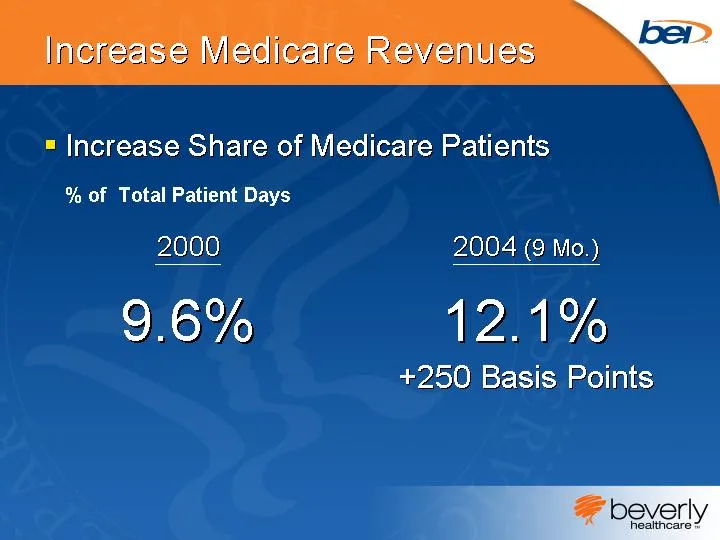
Increase Medicare Revenues Increase Share of Medicare Patients % of Total Patient Days 12.1% 2004 (9 Mo.) 2000 9.6% +250 Basis Points
Slide 119: Share of Medicare Patients: Revenues
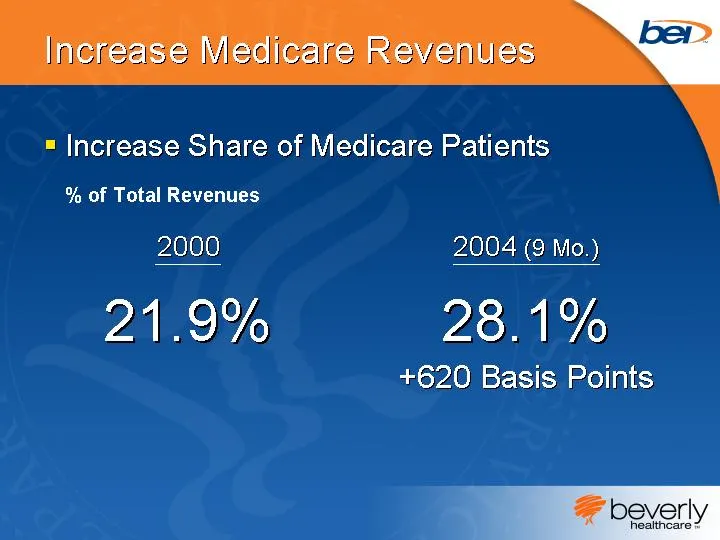
Increase Medicare Revenues Increase Share of Medicare Patients % of Total Revenues 28.1% 2004 (9 Mo.) 2000 21.9% +620 Basis Points
Slide 120: Medicare Improvements
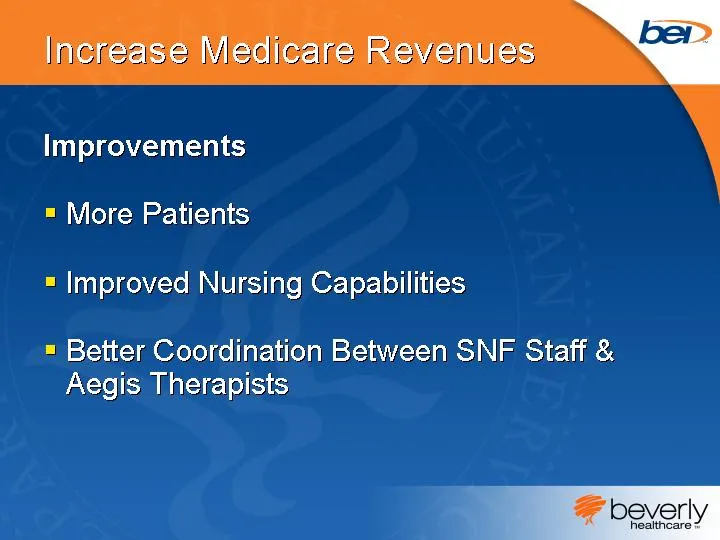
Increase Medicare Revenues Improvements More Patients Improved Nursing Capabilities Better Coordination Between SNF Staff & Aegis Therapists
Slide 121: New Initiatives: Medicare Units Within Facilities
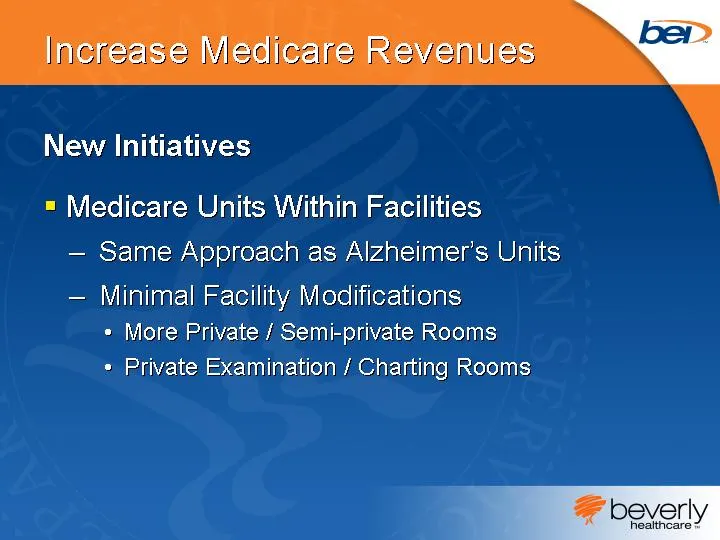
Increase Medicare Revenues New Initiatives Medicare Units Within Facilities Same Approach as Alzheimer's Units Minimal Facility Modifications More Private / Semi-private Rooms Private Examination / Charting Rooms
Slide 122: Freedom Through Functionality Program
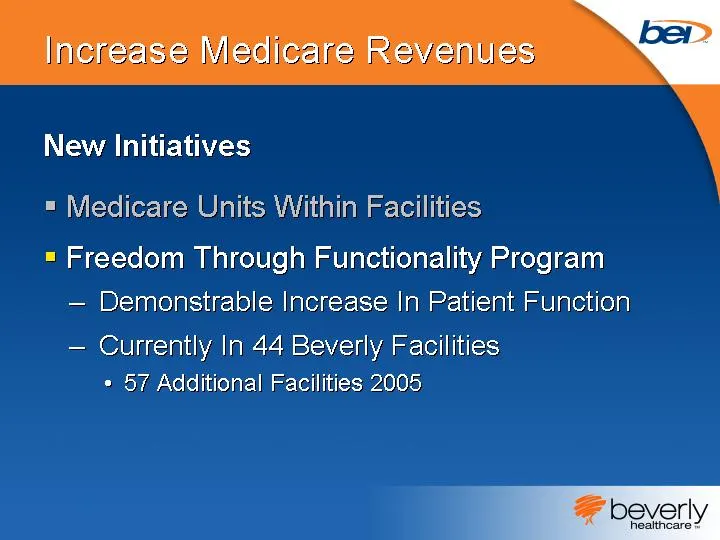
Increase Medicare Revenues New Initiatives Medicare Units Within Facilities Freedom Through Functionality Program Demonstrable Increase In Patient Function Currently In 44 Beverly Facilities 57 Additional Facilities 2005
Slide 123: Local Revenue Development: Datamart System
Increase Medicare Revenues New Initiatives Medicare Units Within Facilities Freedom Through Functionality Program Local Revenue Development Datamart System More Effective Labor Management Admissions / Payor Records Analysis Tool Identify Missed Opportunities
Slide 124: Local Revenue Development
Increase Medicare Revenues New Initiatives Medicare Units Within Facilities Freedom Through Functionality Program Local Revenue Development

Slide 125: Medicaid
» MEDICAID
Slide 126: Improve Medicaid Business
Improve Medicaid Business Opportunities to Enhance Business Proper Compensation for Quality Care Capabilities to Treat Complex Patients
Slide 127: Improve Medicaid: Key Strategies
Improve Medicaid Business Key Strategies Concentrate On States Where Payment System Is Similar to Medicare Develop State Plans to Increase Funding
Slide 128: Improve Medicaid: Case Mix System
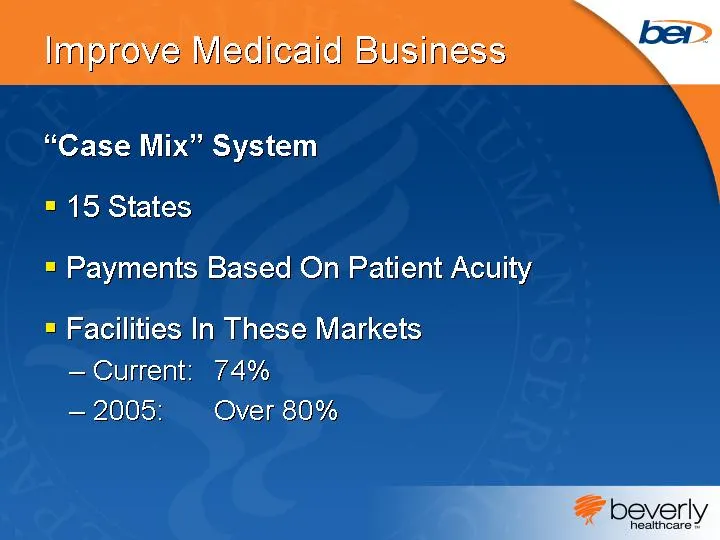
Improve Medicaid Business "Case Mix" System 15 States Payments Based On Patient Acuity Facilities In These Markets Current: 74% 2005: Over 80%
Slide 129: Case Mix: Higher Payments for Complex Patients
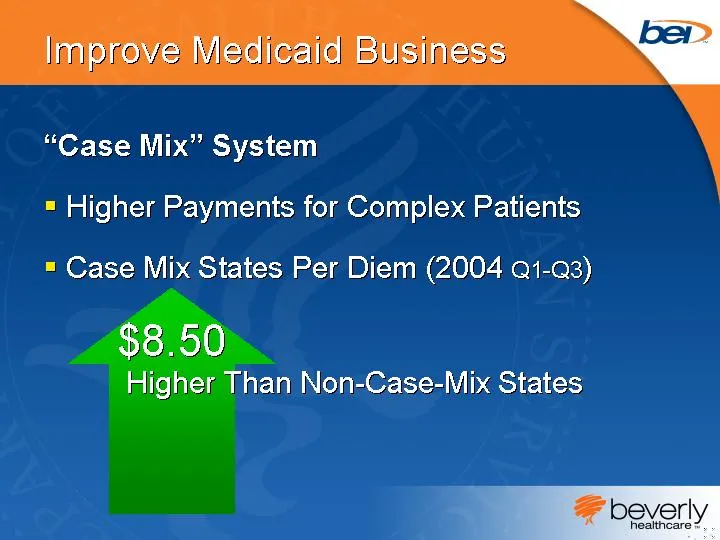
Improve Medicaid Business "Case Mix" System Higher Payments for Complex Patients Case Mix States Per Diem (2004 Q1-Q3) $8.50 Higher Than Non-Case-Mix States
Slide 130: State Funding Enhanced by Provider Taxes
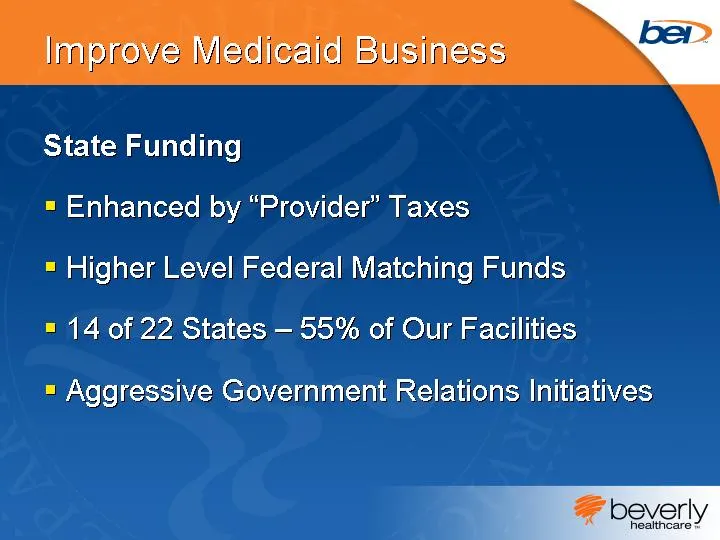
Improve Medicaid Business State Funding Enhanced by "Provider" Taxes Higher Level Federal Matching Funds 14 of 22 States - 55% of Our Facilities Aggressive Government Relations Initiatives
Slide 131: Provider Tax States: Higher Rate Increases
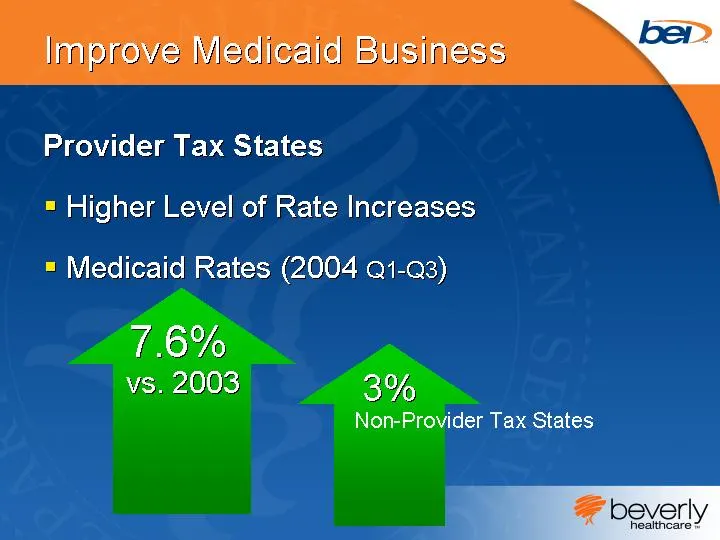
Improve Medicaid Business Provider Tax States Higher Level of Rate Increases Medicaid Rates (2004 Q1-Q3) 7.6% vs. 2003 3% Non-Provider Tax States
Slide 132: Strategic Concentration
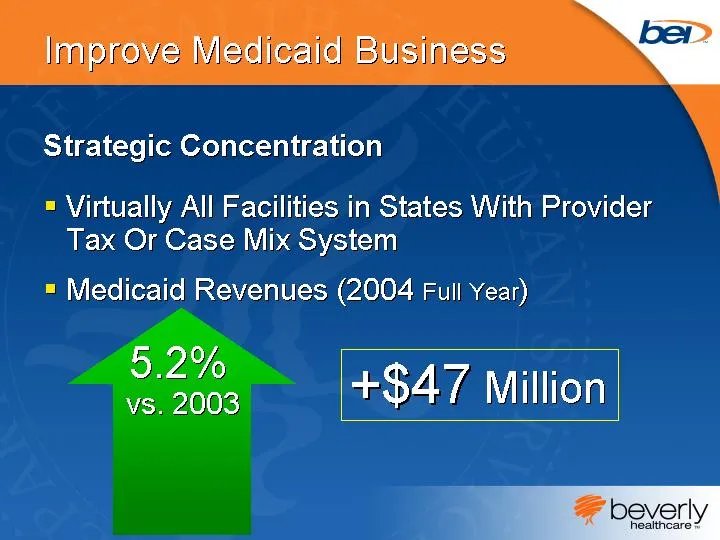
Improve Medicaid Business Strategic Concentration Virtually All Facilities in States With Provider Tax Or Case Mix System Medicaid Revenues (2004 Full Year) 5.2% vs. 2003 +$47 Million
Slide 133: 2005 Increase in Medicaid Per Diems
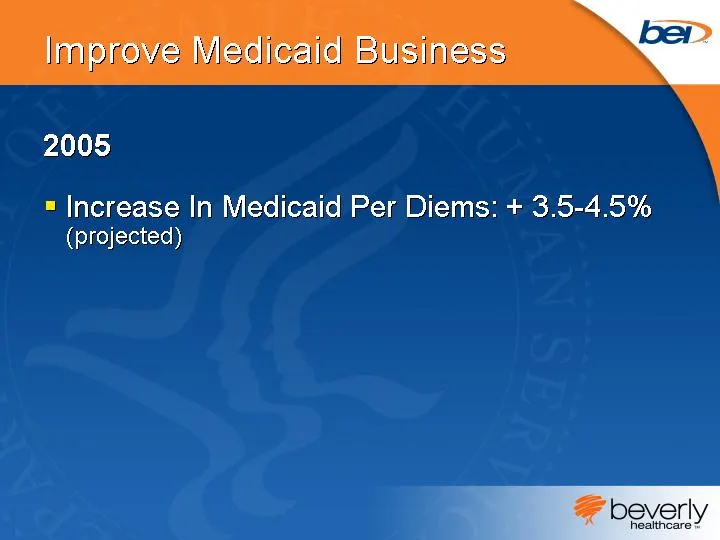
Improve Medicaid Business 2005 Increase In Medicaid Per Diems: + 3.5-4.5% (projected)
Slide 134: Medicaid: Myth and Reality
Improve Medicaid Business MEDICAID Myth Reality
Slide 135: Strategic Synergies
Sifalegic Synergies Nad = aegis # beverly aseraSicare. Bhapie. healthcare * hospice
Slide 136: Skilled Nursing Facilities: Cash to Invest in Higher Margin Businesses
Skilled Nursing Facilities Cash to Invest In Higher Margin Businesses Core Competencies Contribute to Success Low-Cost / Low-Risk Launching Pad Generates Significant Profitable Growth
Slide 137: Profitable Growth Initiatives
Profitable Growth Initiatives Increase Market Share Expand Current Business Raise EBITDA Margin Increase Medicare / Improve Medicaid 1 2 3 4
Slide 138: Skilled Nursing: Past Defense, Now Offense
Skilled Nursing Past: Play Defense, Strengthen Portfolio Now: Play Offense, Grow Business
Slide 139: Growing Forward: Beverly Enterprises Investor Day
GROWING FORWARD Beverly Enterprises Investor Day
Source: SEC EDGAR · DEFA14A filed Feb 9, 2005