Railamerica — Q1 2005 Earnings Presentation
15 slides from Railamerica's earnings presentation, Apr 28, 2005
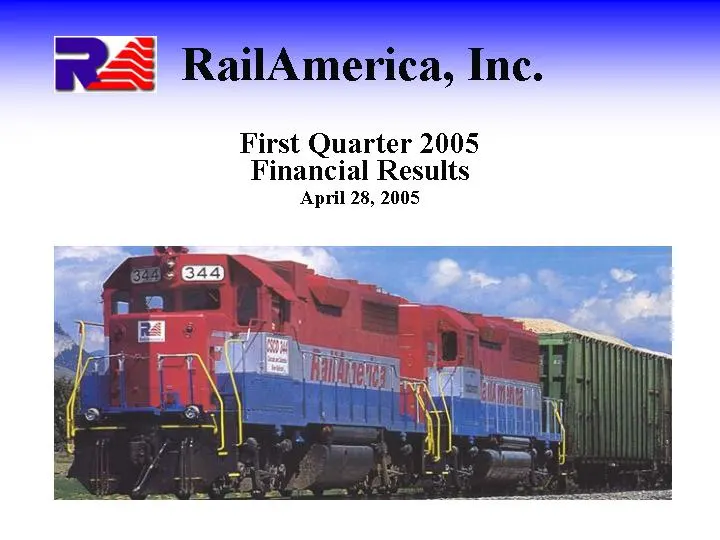
Slide 1: First Quarter 2005 Financial Results
RailAmerica, Inc. First Quarter 2005 Financial Results April 28, 2005
Slide 2: Forward Looking Statements and Forecasts
Forward Looking Statements and Forecasts This presentation contains forward-looking statements, forecasts, and information regarding future events and the future performance of RailAmerica that involve risks and uncertainties that could cause actual results and actions to differ materially, includin
Slide 3: Charles Swinburn, Chief Executive Officer
Charles Swinburn Chief Executive Officer
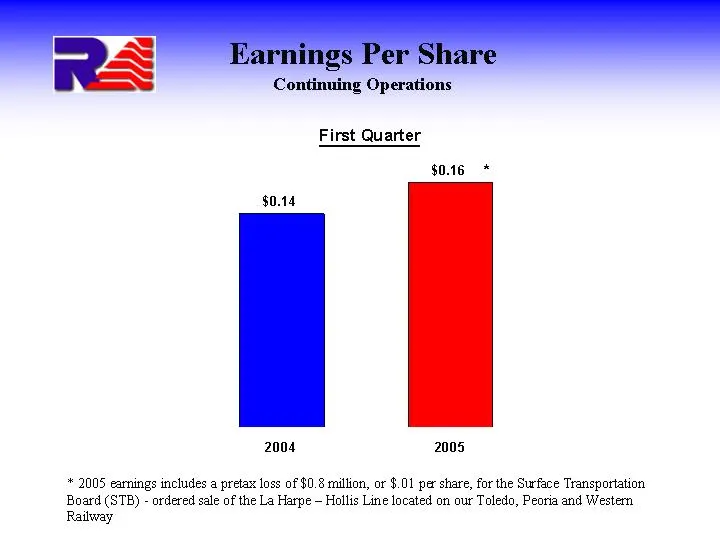
Slide 4: Earnings Per Share Continuing Operations
Earnings Per Share Continuing Operations * 2005 earnings includes a pretax loss of $0.8 million, or $.01 per share, for the Surface Transportation Board (STB) - ordered sale of the La Harpe - Hollis Line located on our Toledo, Peoria and Western Railway 2004 2005 EPS 0.14 0.16 *
Slide 5: First Quarter Highlights
First Quarter Highlights Safety Strong organic growth High fuel costs Ohio
Slide 6: Michael Howe, Executive Vice President and Chief Financial Officer
Michael Howe Executive Vice President and Chief Financial Officer
Slide 7: First Quarter Income Statement
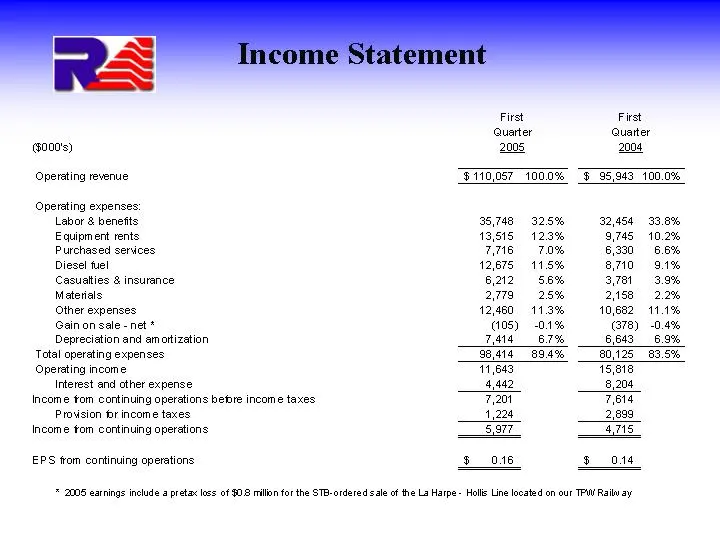
Mi First Quarter goons) 2005 Operating revenue 310,057 _1000% Operating expenses: Labor & benefits Equipment rents 925% 123% Purchased services 7.0% Diesel tuel 11.5% Casuatties & insurance 56% Materials 25% Other expenses 11.3% Gainon sale-net * 0.1% Depreciation and amortization 687% Total operati
Slide 8: Revenue Growth First Quarter
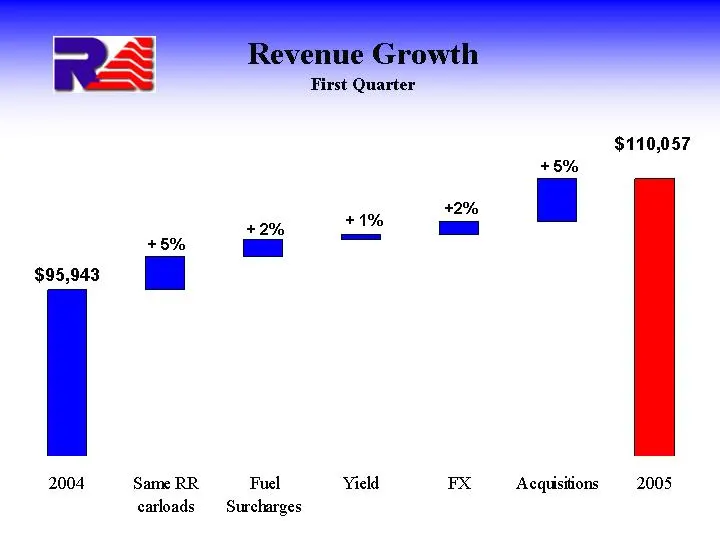
Revenue Growth First Quarter 2004 Same RR carloads Fuel Surcharges Yield FX Acquisitions 2005 X 95943 95943 100260 102371 102957 104588 110057 Y 4317 2111 586 1631 5469 + 5% + 2% + 1% + 5% +2%
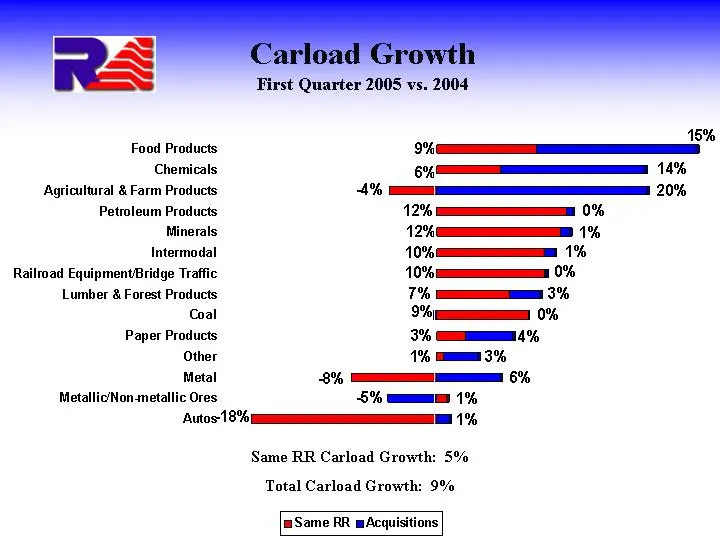
Slide 9: Carload Growth First Quarter 2005 vs. 2004
Carload Growth First Quarter 2005 vs. 2004 Same RR Carload Growth: 5% Total Carload Growth: 9%
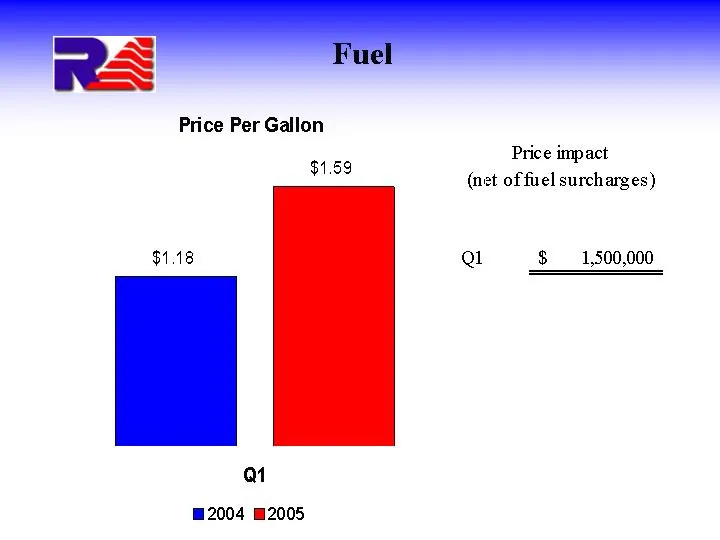
Slide 10: Price Per Gallon
Price Per Gallon Price impact #159 (net of frel surcharges) $1.48 Ql 1,500,000 a1 2004 2005
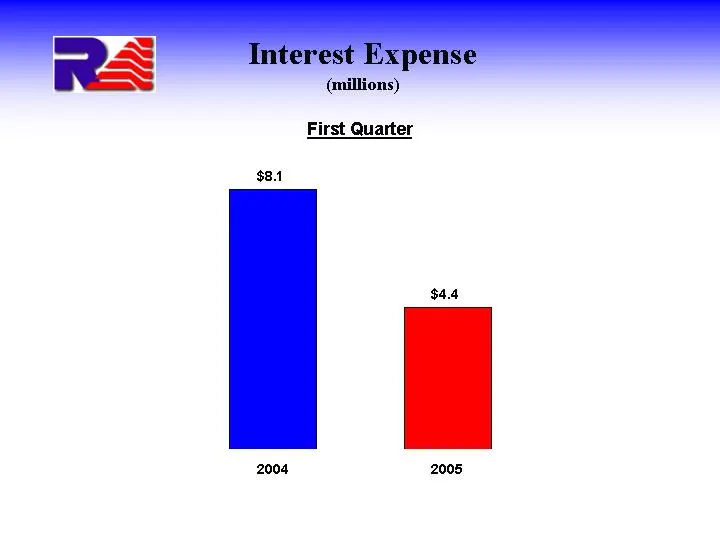
Slide 11: Interest Expense
Interest Expense (millions) 2004 2005 Interest Expense 8.1 4.4
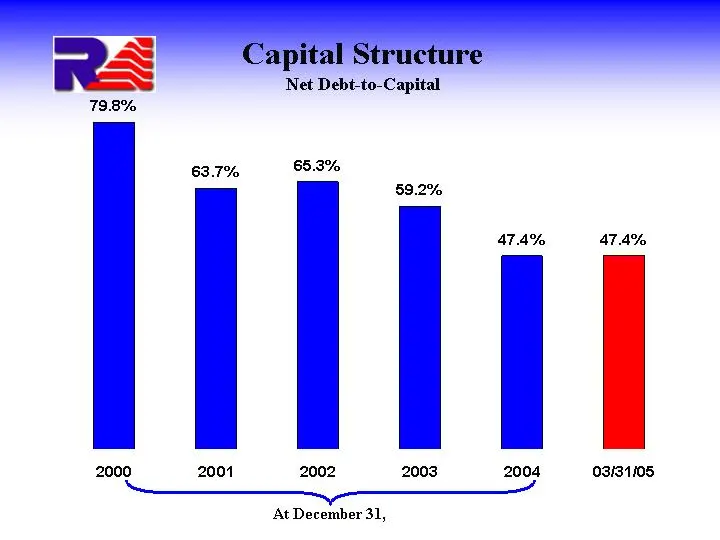
Slide 12: Capital Structure Net Debt-to-Capital
Capital Structure Net Debt-to-Capital 2000 2001 2002 2003 2004 3/31/2005 Net Debt to Capital 0.798 0.637 0.653 0.592 0.474 0.474 At December 31,
Slide 13: Updated 2005 Outlook
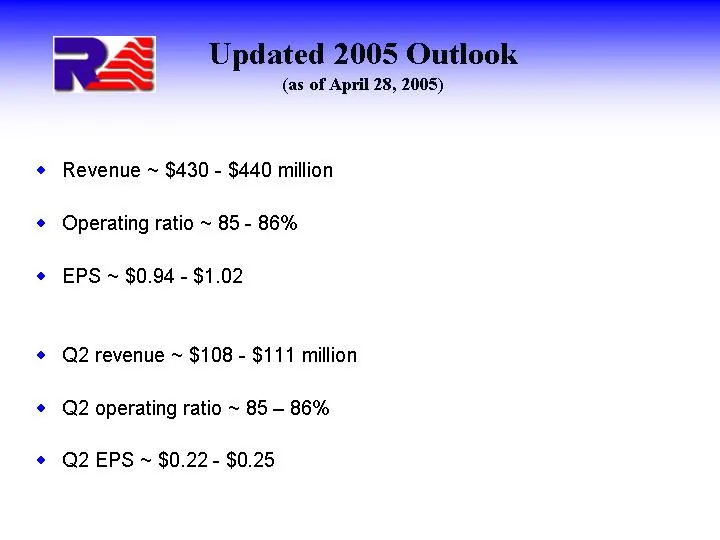
Updated 2005 Outlook (as of April 28, 2005) Revenue ~ $430 - $440 million Operating ratio ~ 85 - 86% EPS ~ $0.94 - $1.02 Q2 revenue ~ $108 - $111 million Q2 operating ratio ~ 85 - 86% Q2 EPS ~ $0.22 - $0.25
Slide 14: Charles Swinburn, Chief Executive Officer
Charles Swinburn Chief Executive Officer
Slide 15: Recap Outlook
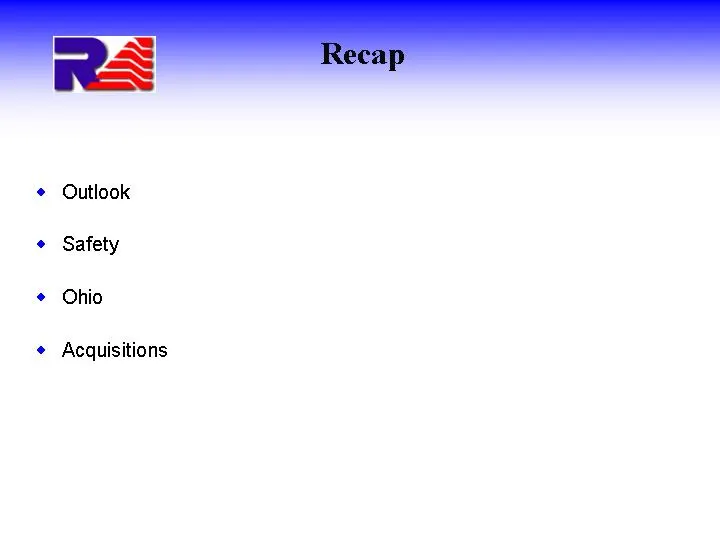
Recap Outlook Safety Ohio Acquisitions
Source: SEC EDGAR · 8-K filed Apr 28, 2005
More decks from Railamerica Inc
 Q2 2012 Earnings Presentation25 slides · Jul 25, 2012
 Q1 2012 Earnings Presentation29 slides · Apr 26, 2012
 Q4 2011 Earnings Presentation33 slides · Feb 9, 2012
 Q3 2011 Earnings Presentation28 slides · Oct 26, 2011
 Q2 2011 Earnings Presentation27 slides · Jul 28, 2011
 Q1 2011 Earnings Presentation28 slides · Apr 28, 2011