Railamerica — Q1 2011 Earnings Presentation
28 slides from Railamerica's earnings presentation, Apr 28, 2011
Slide 1: First Quarter 2011 Earnings Conference Call
First Quarter 2011 Earnings Conference Call April 28, 2011
Slide 2: Forward-Looking Statements
Forward-Looking Statements 2 Certain items in this presentation and other information we provide from time to time may constitute forward-looking statements within the meaning of the Private Securities Litigation Reform Act of 1995 including, but not necessarily limited to, statements relating to fu
Slide 3: Executive Summary
Executive Summary John Giles, President and Chief Executive Officer 3
Slide 4: First quarter 2011 overview
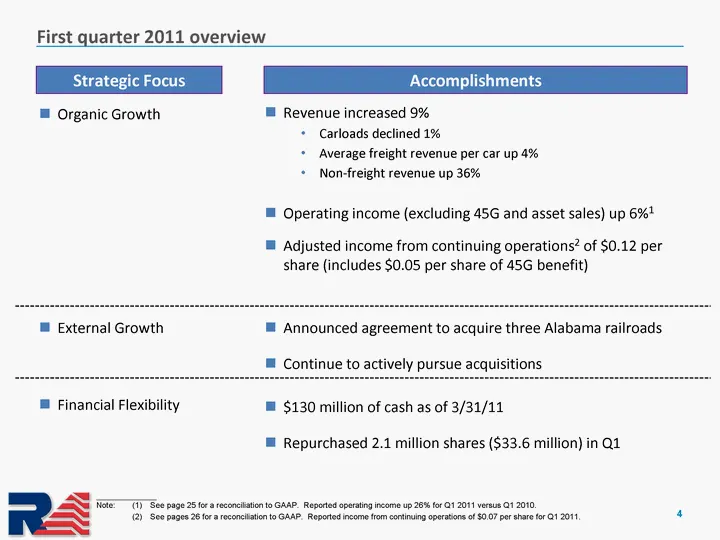
First quarter 2011 overview 4 Strategic Focus Accomplishments Organic Growth External Growth Financial Flexibility Revenue increased 9% Carloads declined 1% Average freight revenue per car up 4% Non-freight revenue up 36% Operating income (excluding 45G and asset sales) up 6%1 Adjusted income from c
Slide 5: Commercial Update
Commercial Update Charlie Patterson, Chief Commercial Officer 5
Slide 6: First quarter 2011 revenue up 9%
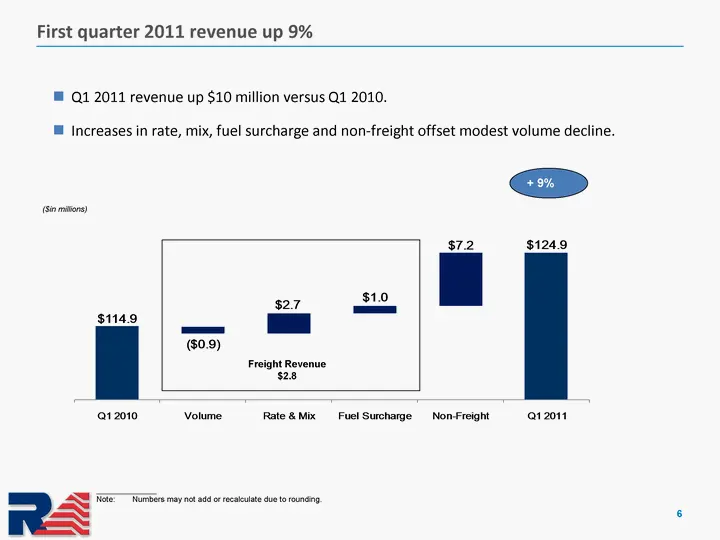
6 ($in millions) Q1 2011 revenue up $10 million versus Q1 2010. Increases in rate, mix, fuel surcharge and non-freight offset modest volume decline. Freight Revenue $2.8 First quarter 2011 revenue up 9% ______________________ Note: Numbers may not add or recalculate due to rounding. + 9%
Slide 7: First quarter 2011 carloads declined 1%
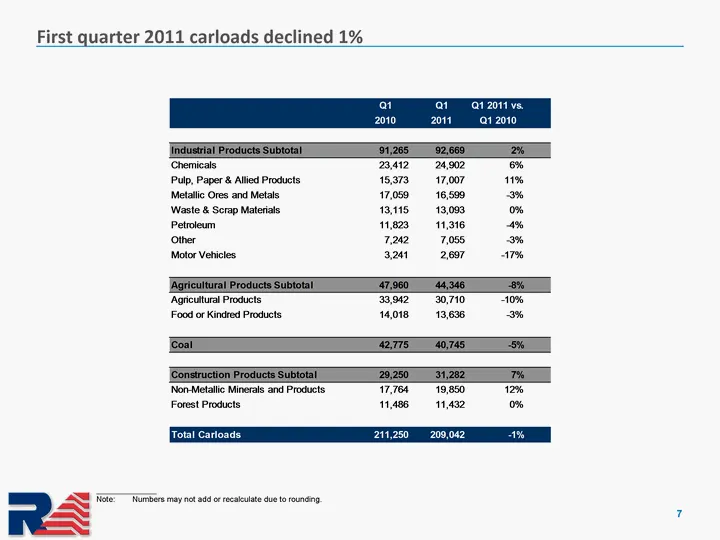
First quarter 2011 carloads declined 1% 7 ______________________ Note: Numbers may not add or recalculate due to rounding.
Slide 8: First quarter 2011 average freight revenue per carload up 4%
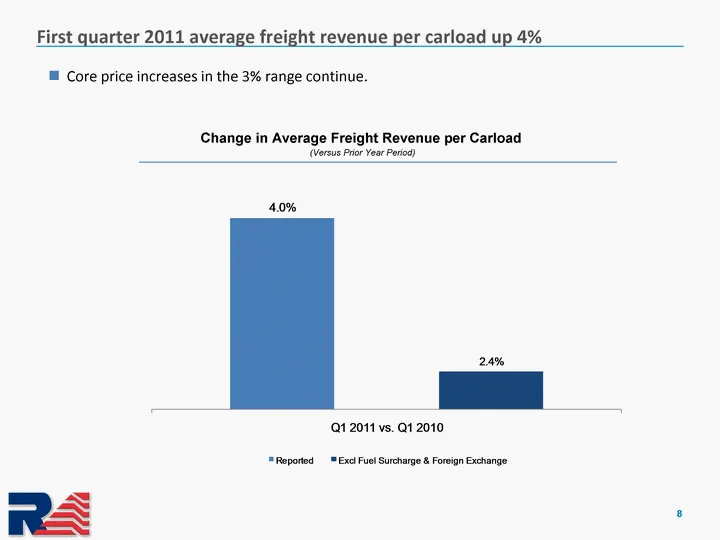
First quarter 2011 average freight revenue per carload up 4% 8 Change in Average Freight Revenue per Carload (Versus Prior Year Period) Core price increases in the 3% range continue.
Slide 9: First quarter non-freight revenue up 36%
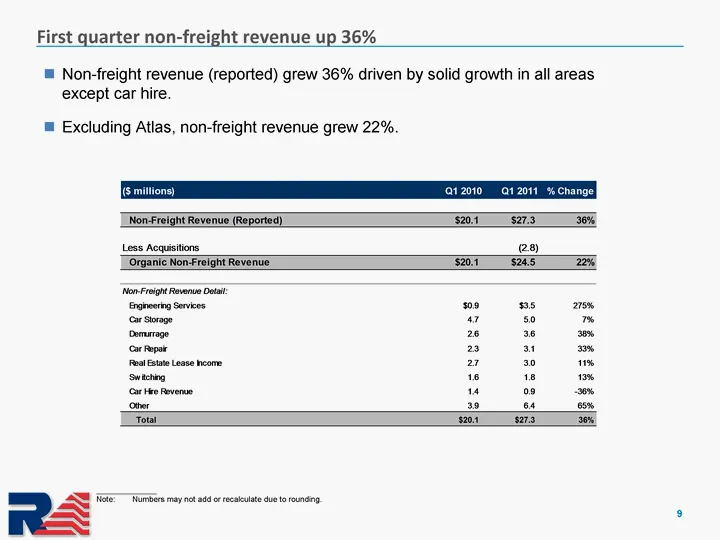
First quarter non-freight revenue up 36% 9 ______________________ Note: Numbers may not add or recalculate due to rounding. Non-freight revenue (reported) grew 36% driven by solid growth in all areas except car hire. Excluding Atlas, non-freight revenue grew 22%.
Slide 10: Operational Update
Operational Update John Giles, President and Chief Executive Officer 10
Slide 11: Continued focus on operating ratio improvement
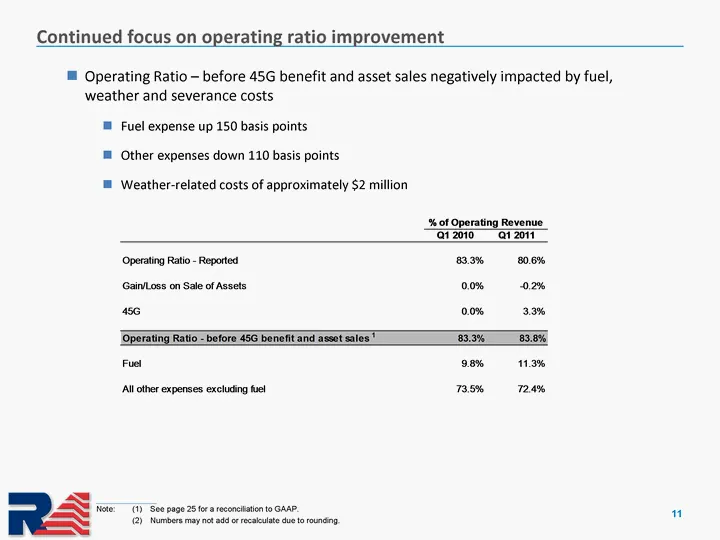
Continued focus on operating ratio improvement 11 Operating Ratio - before 45G benefit and asset sales negatively impacted by fuel, weather and severance costs Fuel expense up 150 basis points Other expenses down 110 basis points Weather-related costs of approximately $2 million ____________________
Slide 12: Project Horizon Update
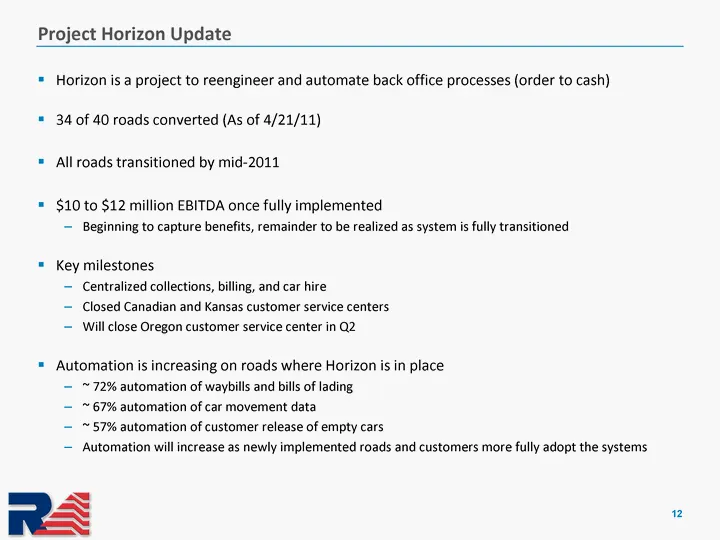
Project Horizon Update Horizon is a project to reengineer and automate back office processes (order to cash) 34 of 40 roads converted (As of 4/21/11) All roads transitioned by mid-2011 $10 to $12 million EBITDA once fully implemented Beginning to capture benefits, remainder to be realized as system
Slide 13: Safety remains a critical area of focus
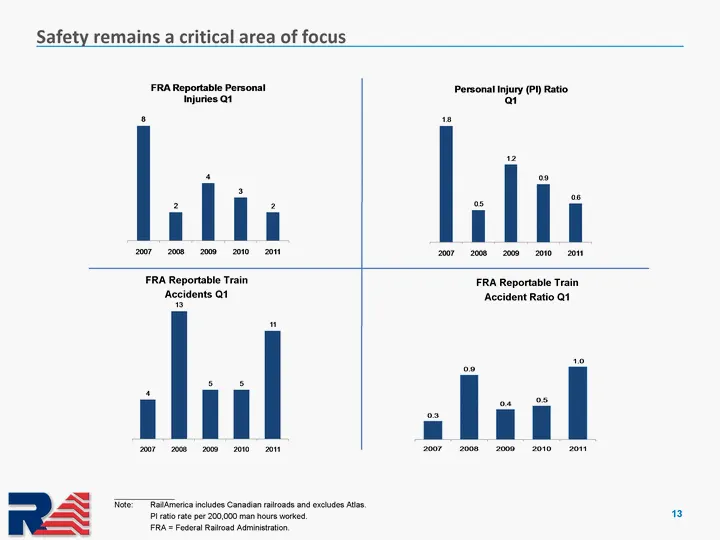
Safety remains a critical area of focus 13 ______________________ Note: RailAmerica includes Canadian railroads and excludes Atlas. PI ratio rate per 200,000 man hours worked. FRA = Federal Railroad Administration. FRA Reportable Train Accidents Q1 FRA Reportable Train Accident Ratio Q1
Slide 14: Announced agreement to acquire three Alabama railroads
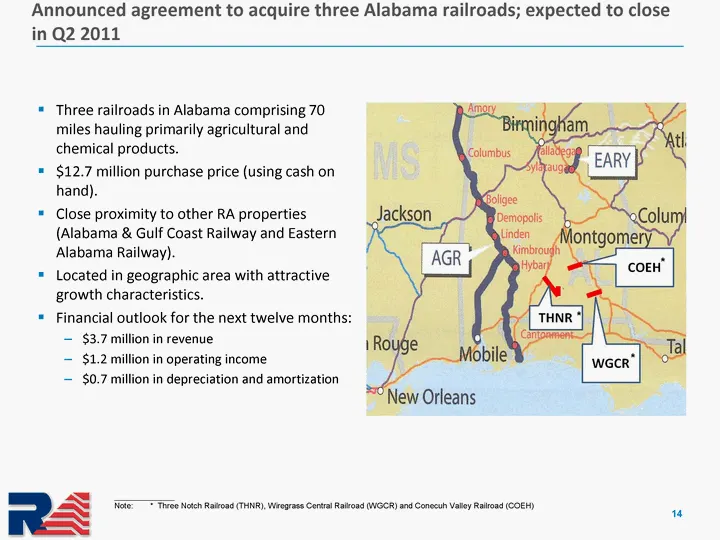
Announced agreement to acquire three Alabama railroads; expected to close in Q2 2011 Three railroads in Alabama comprising 70 miles hauling primarily agricultural and chemical products. $12.7 million purchase price (using cash on hand). Close proximity to other RA properties (Alabama & Gulf Coast Ra
Slide 15: Financial Update
Financial Update Clyde Preslar, Chief Financial Officer 15
Slide 16: First quarter 2011 EPS totaled $0.07 per share including 45G benefit
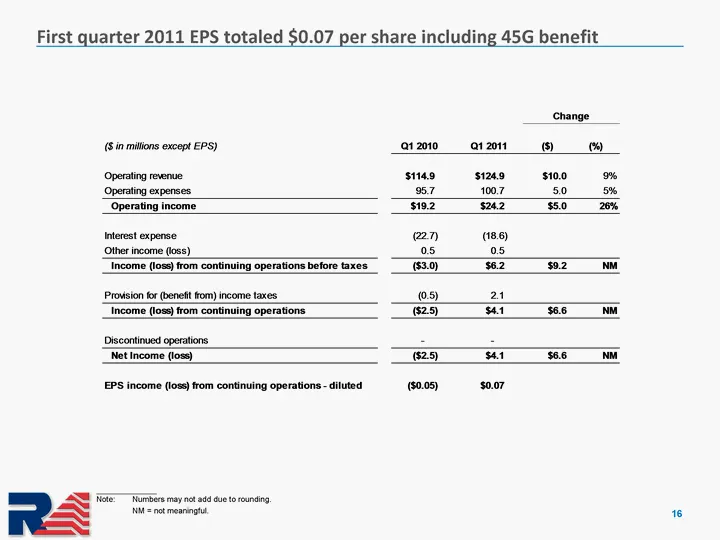
First quarter 2011 EPS totaled $0.07 per share including 45G benefit 16 ______________________ Note: Numbers may not add due to rounding. NM = not meaningful.
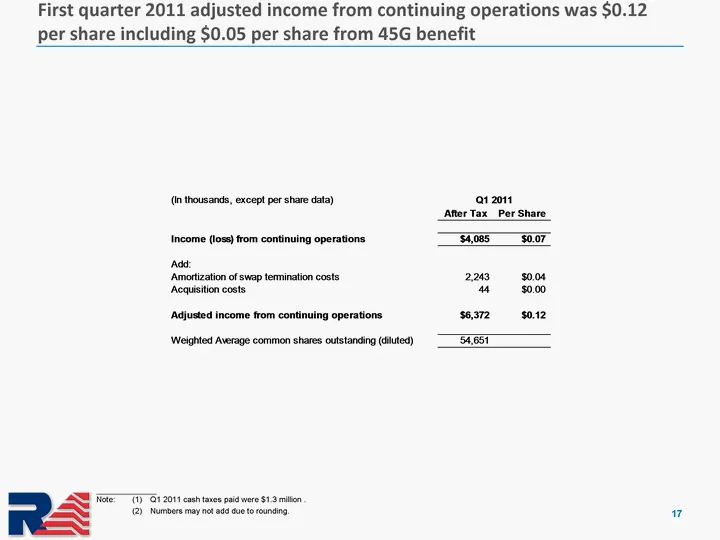
Slide 17: First quarter 2011 adjusted income from continuing operations was $0.12 per share
First quarter 2011 adjusted income from continuing operations was $0.12 per share including $0.05 per share from 45G benefit 17 ______________________ Note: (1) Q1 2011 cash taxes paid were $1.3 million . (2) Numbers may not add due to rounding.
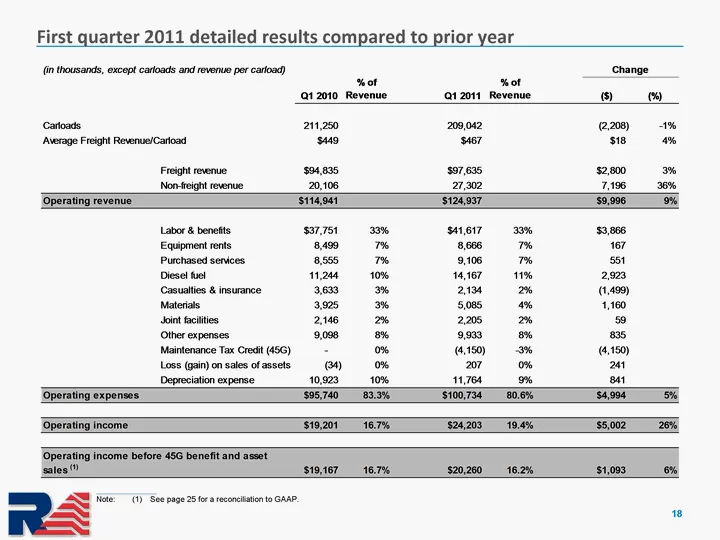
Slide 18: First quarter 2011 detailed results compared to prior year
First quarter 2011 detailed results compared to prior year 18 ______________________ Note: (1) See page 25 for a reconciliation to GAAP.
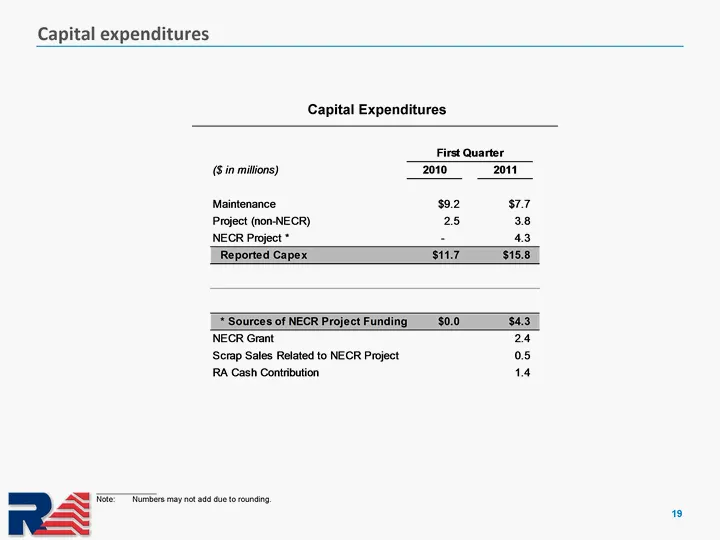
Slide 19: Capital expenditures
Capital expenditures 19 Capital Expenditures ______________________ Note: Numbers may not add due to rounding.
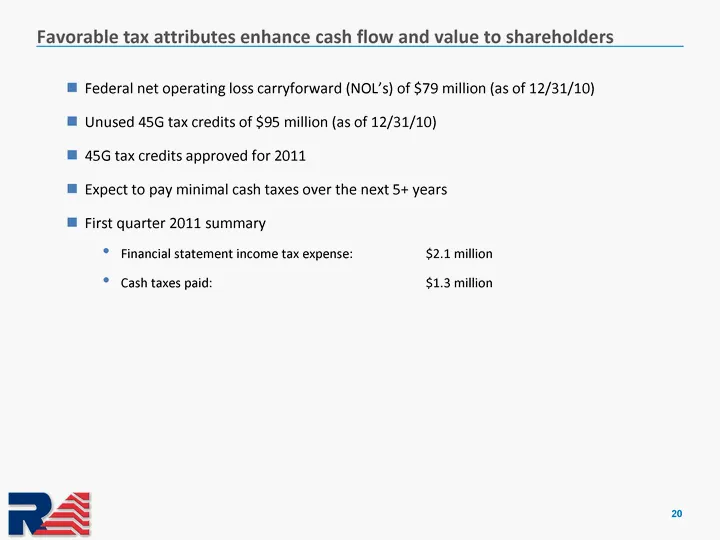
Slide 20: Favorable tax attributes enhance cash flow and value to shareholders
Favorable tax attributes enhance cash flow and value to shareholders 20 Federal net operating loss carryforward (NOL's) of $79 million (as of 12/31/10) Unused 45G tax credits of $95 million (as of 12/31/10) 45G tax credits approved for 2011 Expect to pay minimal cash taxes over the next 5+ years Fir
Slide 21: Strong capital structure supports organic growth and strategic investments
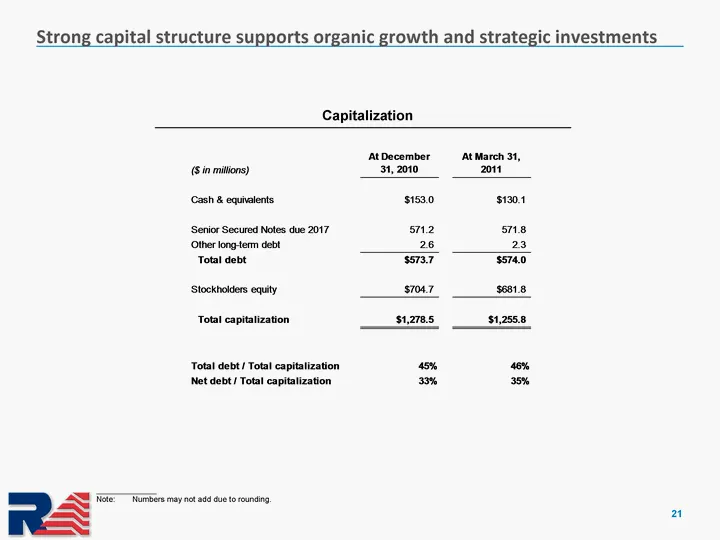
Strong capital structure supports organic growth and strategic investments 21 Capitalization ______________________ Note: Numbers may not add due to rounding.
Slide 22: Q2 and full year estimates
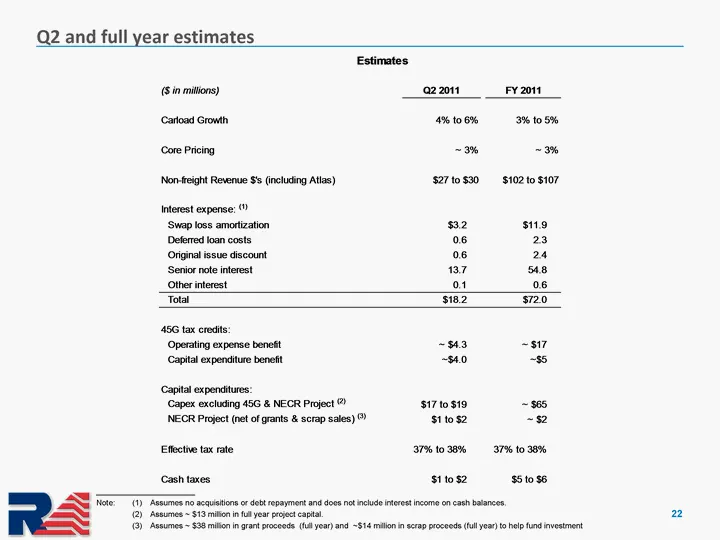
Q2 and full year estimates 22 ______________________ Note: (1) Assumes no acquisitions or debt repayment and does not include interest income on cash balances. (2) Assumes ~ $13 million in full year project capital. (3) Assumes ~ $38 million in grant proceeds (full year) and ~$14 million in scrap pr
Slide 23: 23
23
Slide 24: Appendix
Appendix 24
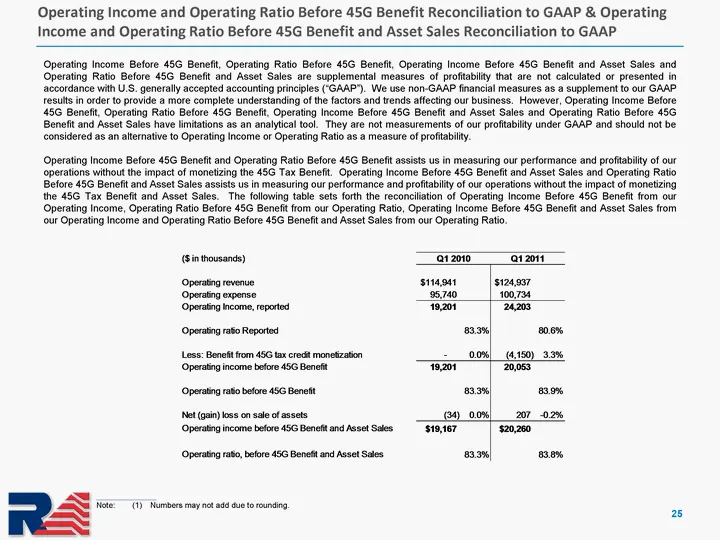
Slide 25: Operating Income and Operating Ratio Before 45G Benefit Reconciliation to GAAP
Operating Income and Operating Ratio Before 45G Benefit Reconciliation to GAAP & Operating Income and Operating Ratio Before 45G Benefit and Asset Sales Reconciliation to GAAP 25 Operating Income Before 45G Benefit, Operating Ratio Before 45G Benefit, Operating Income Before 45G Benefit and Asset Sa
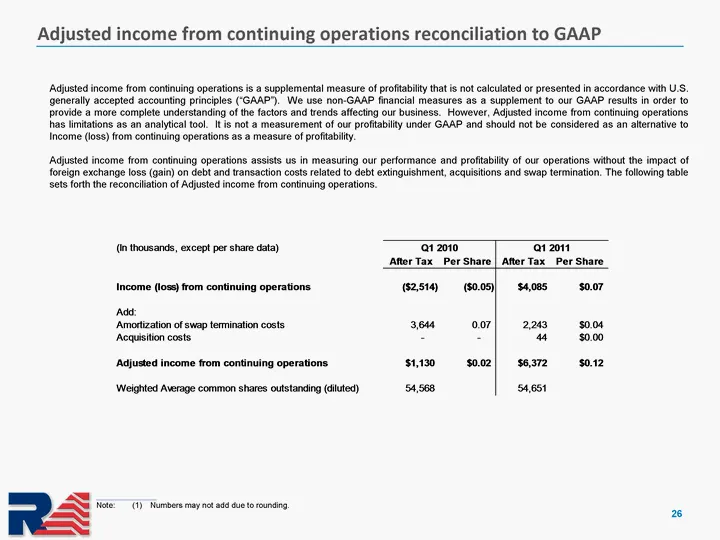
Slide 26: Adjusted income from continuing operations reconciliation to GAAP
Adjusted income from continuing operations reconciliation to GAAP 26 ______________________ Note: (1) Numbers may not add due to rounding. Adjusted income from continuing operations is a supplemental measure of profitability that is not calculated or presented in accordance with U.S. generally accep
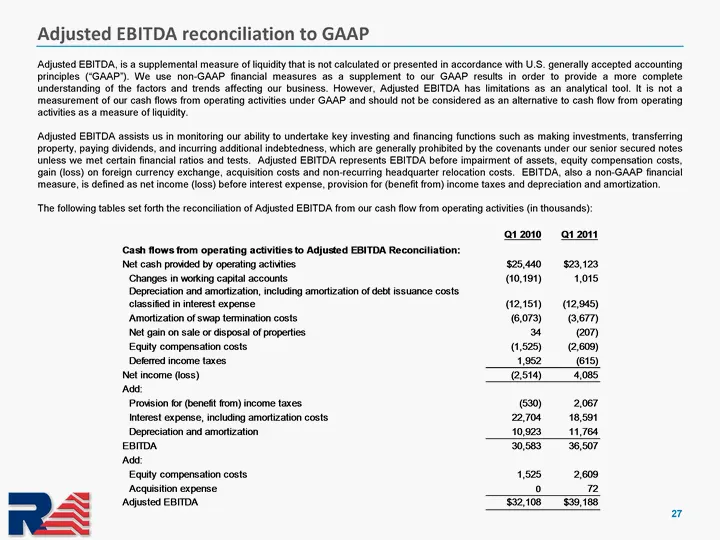
Slide 27: Adjusted EBITDA reconciliation to GAAP
Adjusted EBITDA reconciliation to GAAP 27 Adjusted EBITDA, is a supplemental measure of liquidity that is not calculated or presented in accordance with U.S. generally accepted accounting principles ("GAAP"). We use non-GAAP financial measures as a supplement to our GAAP results in order to provide
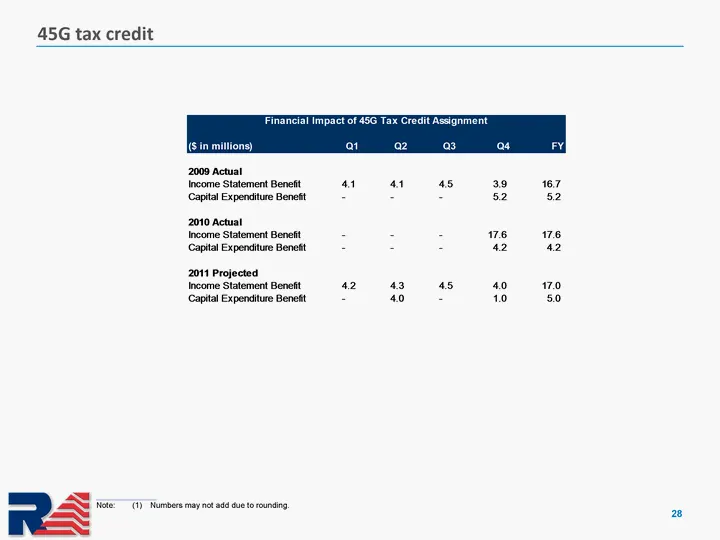
Slide 28: 45G tax credit
45G tax credit 28 ______________________ Note: (1) Numbers may not add due to rounding.
Source: SEC EDGAR · 8-K filed Apr 28, 2011
More decks from Railamerica Inc
 Q2 2012 Earnings Presentation25 slides · Jul 25, 2012
 Q1 2012 Earnings Presentation29 slides · Apr 26, 2012
 Q4 2011 Earnings Presentation33 slides · Feb 9, 2012
 Q3 2011 Earnings Presentation28 slides · Oct 26, 2011
 Q2 2011 Earnings Presentation27 slides · Jul 28, 2011
 Q4 2010 Earnings Presentation31 slides · Feb 24, 2011