Railamerica — Q1 2012 Earnings Presentation
29 slides from Railamerica's earnings presentation, Apr 26, 2012
Slide 1: First Quarter 2012 Earnings Conference Call
Exhibit 99.2 First Quarter 2012 Earnings Conference Call April 26, 2012
Slide 2: Forward-Looking Statements
Forward-Looking Statements Certain items in this presentation and other information we provide from time to time may constitute forward-looking statements within the meaning of the Private Securities Litigation Reform Act of 1995 including, but not necessarily limited to, statements relating to futu
Slide 3: Executive Summary
Executive Summary John Giles, President and Chief Executive Officer 3
Slide 4: First quarter 2012 overview
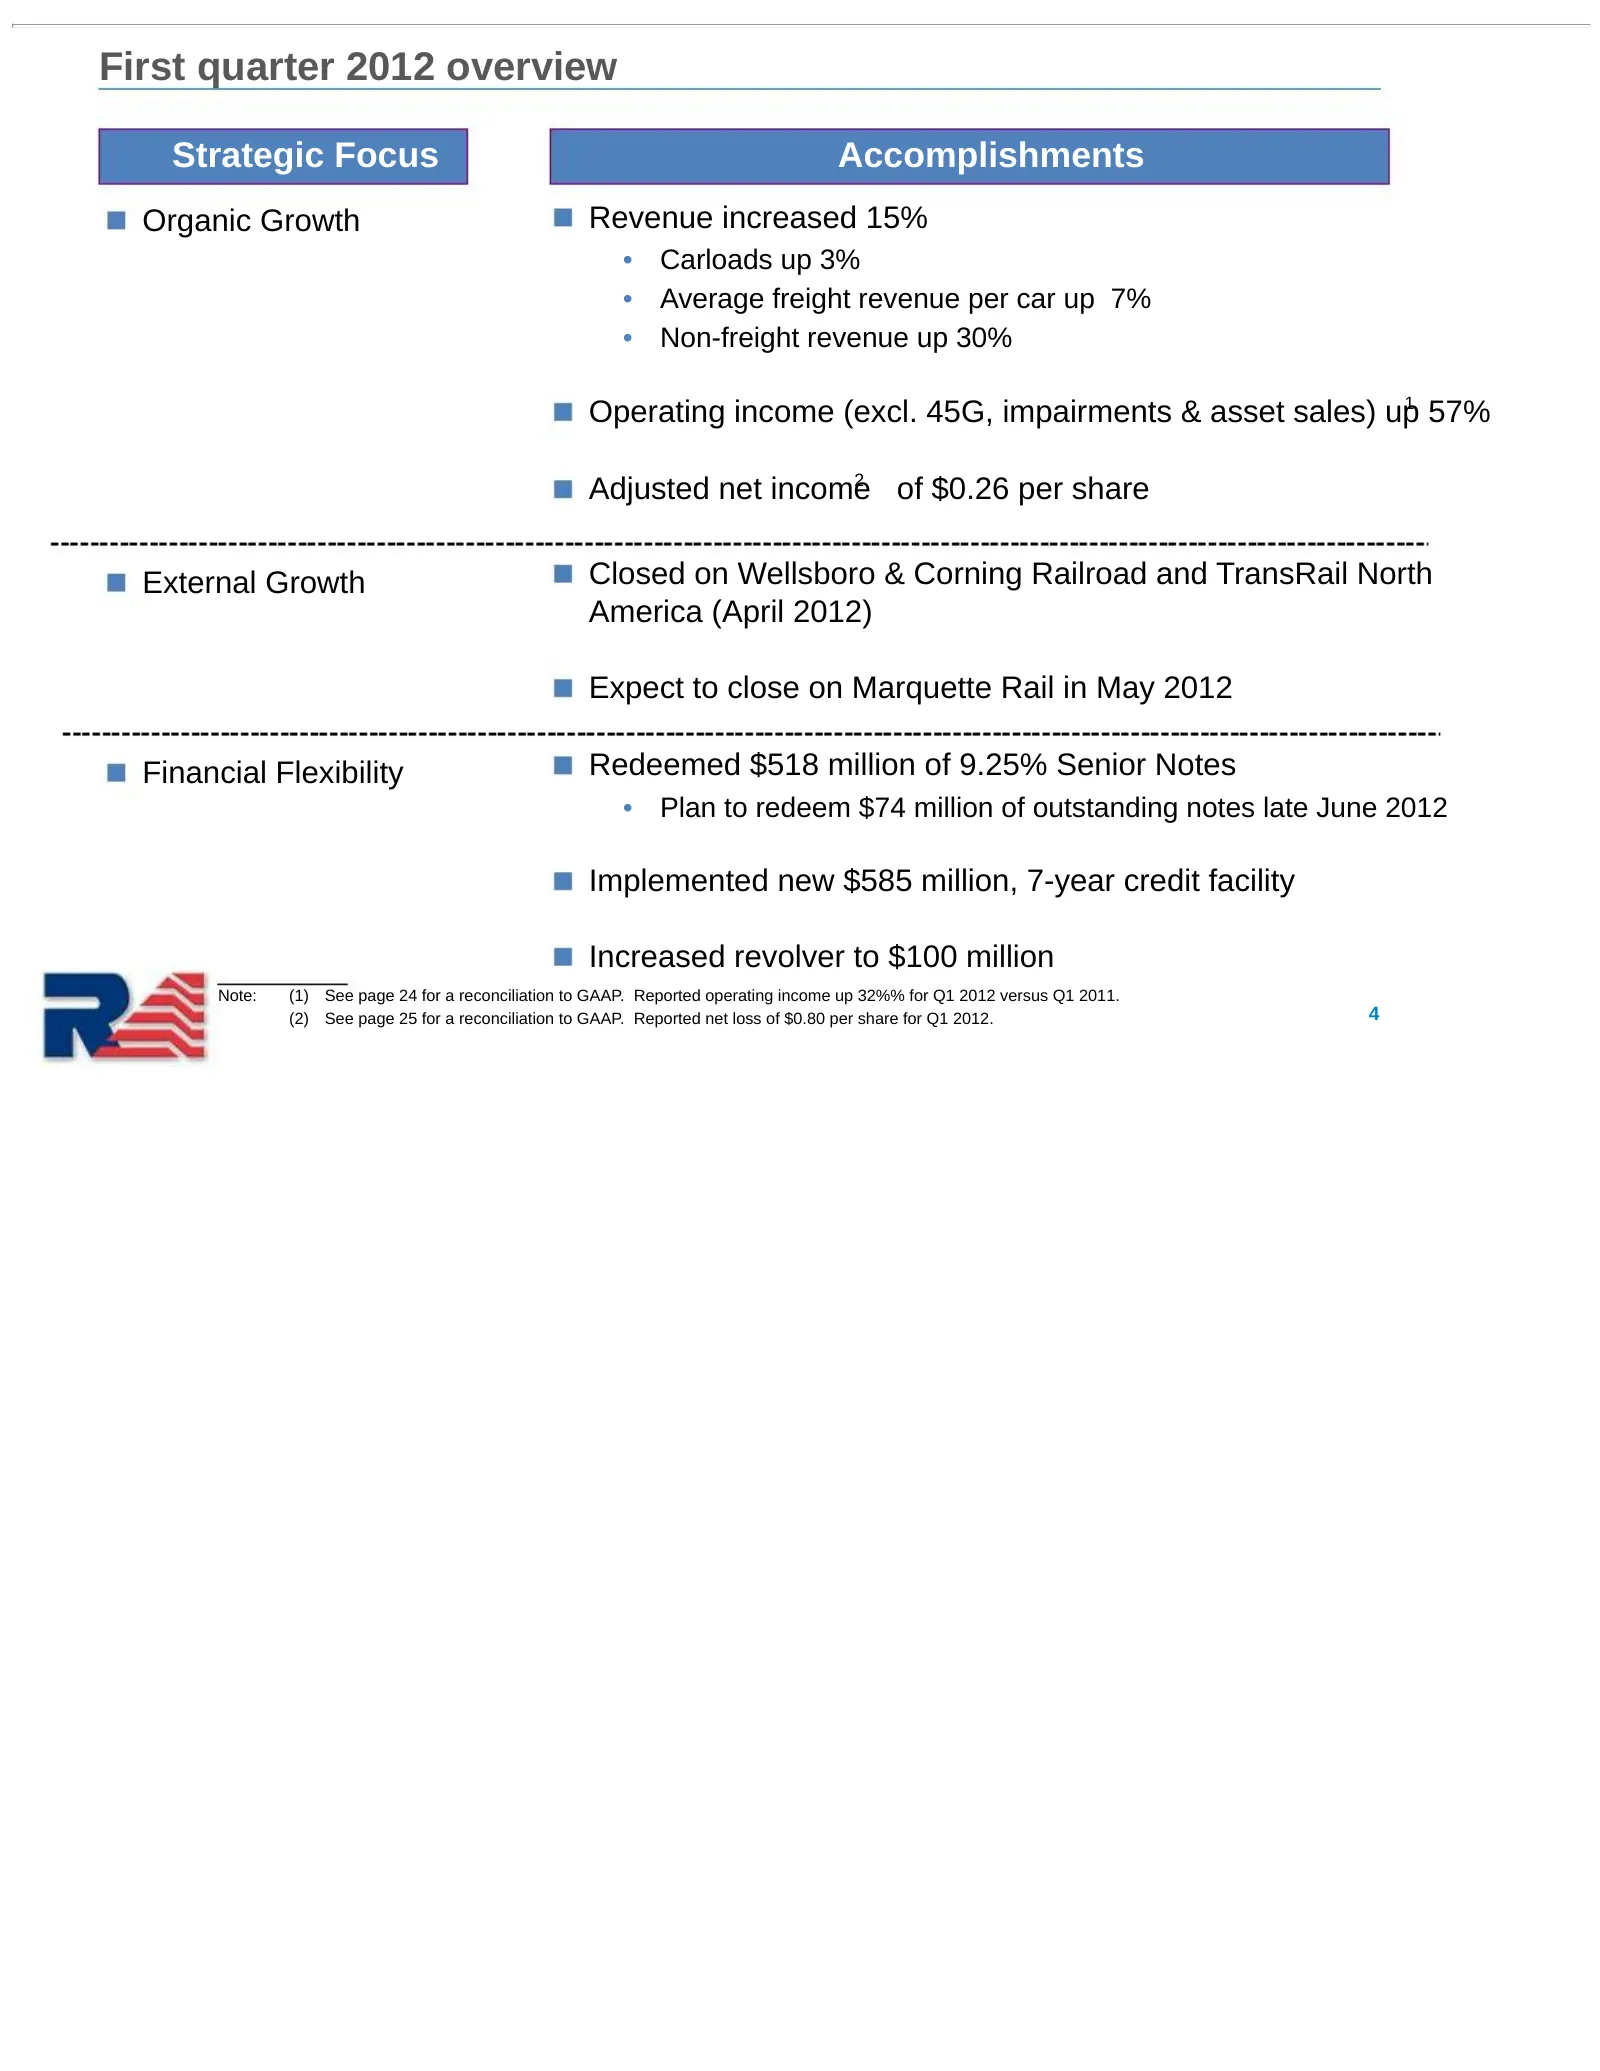
First quarter 2012 overview Strategic Focus Accomplishments Organic Growth Revenue increased 15% • Carloads up 3% • Average freight revenue per car up 7% • Non-freight revenue up 30% Operating income (excl. 45G, impairments & asset sales) up1 57% 2 Adjusted net income of $0.26 per share External Gro
Slide 5: Commercial Update
Commercial Update 5
Slide 6: First quarter 2012 revenue up 15%
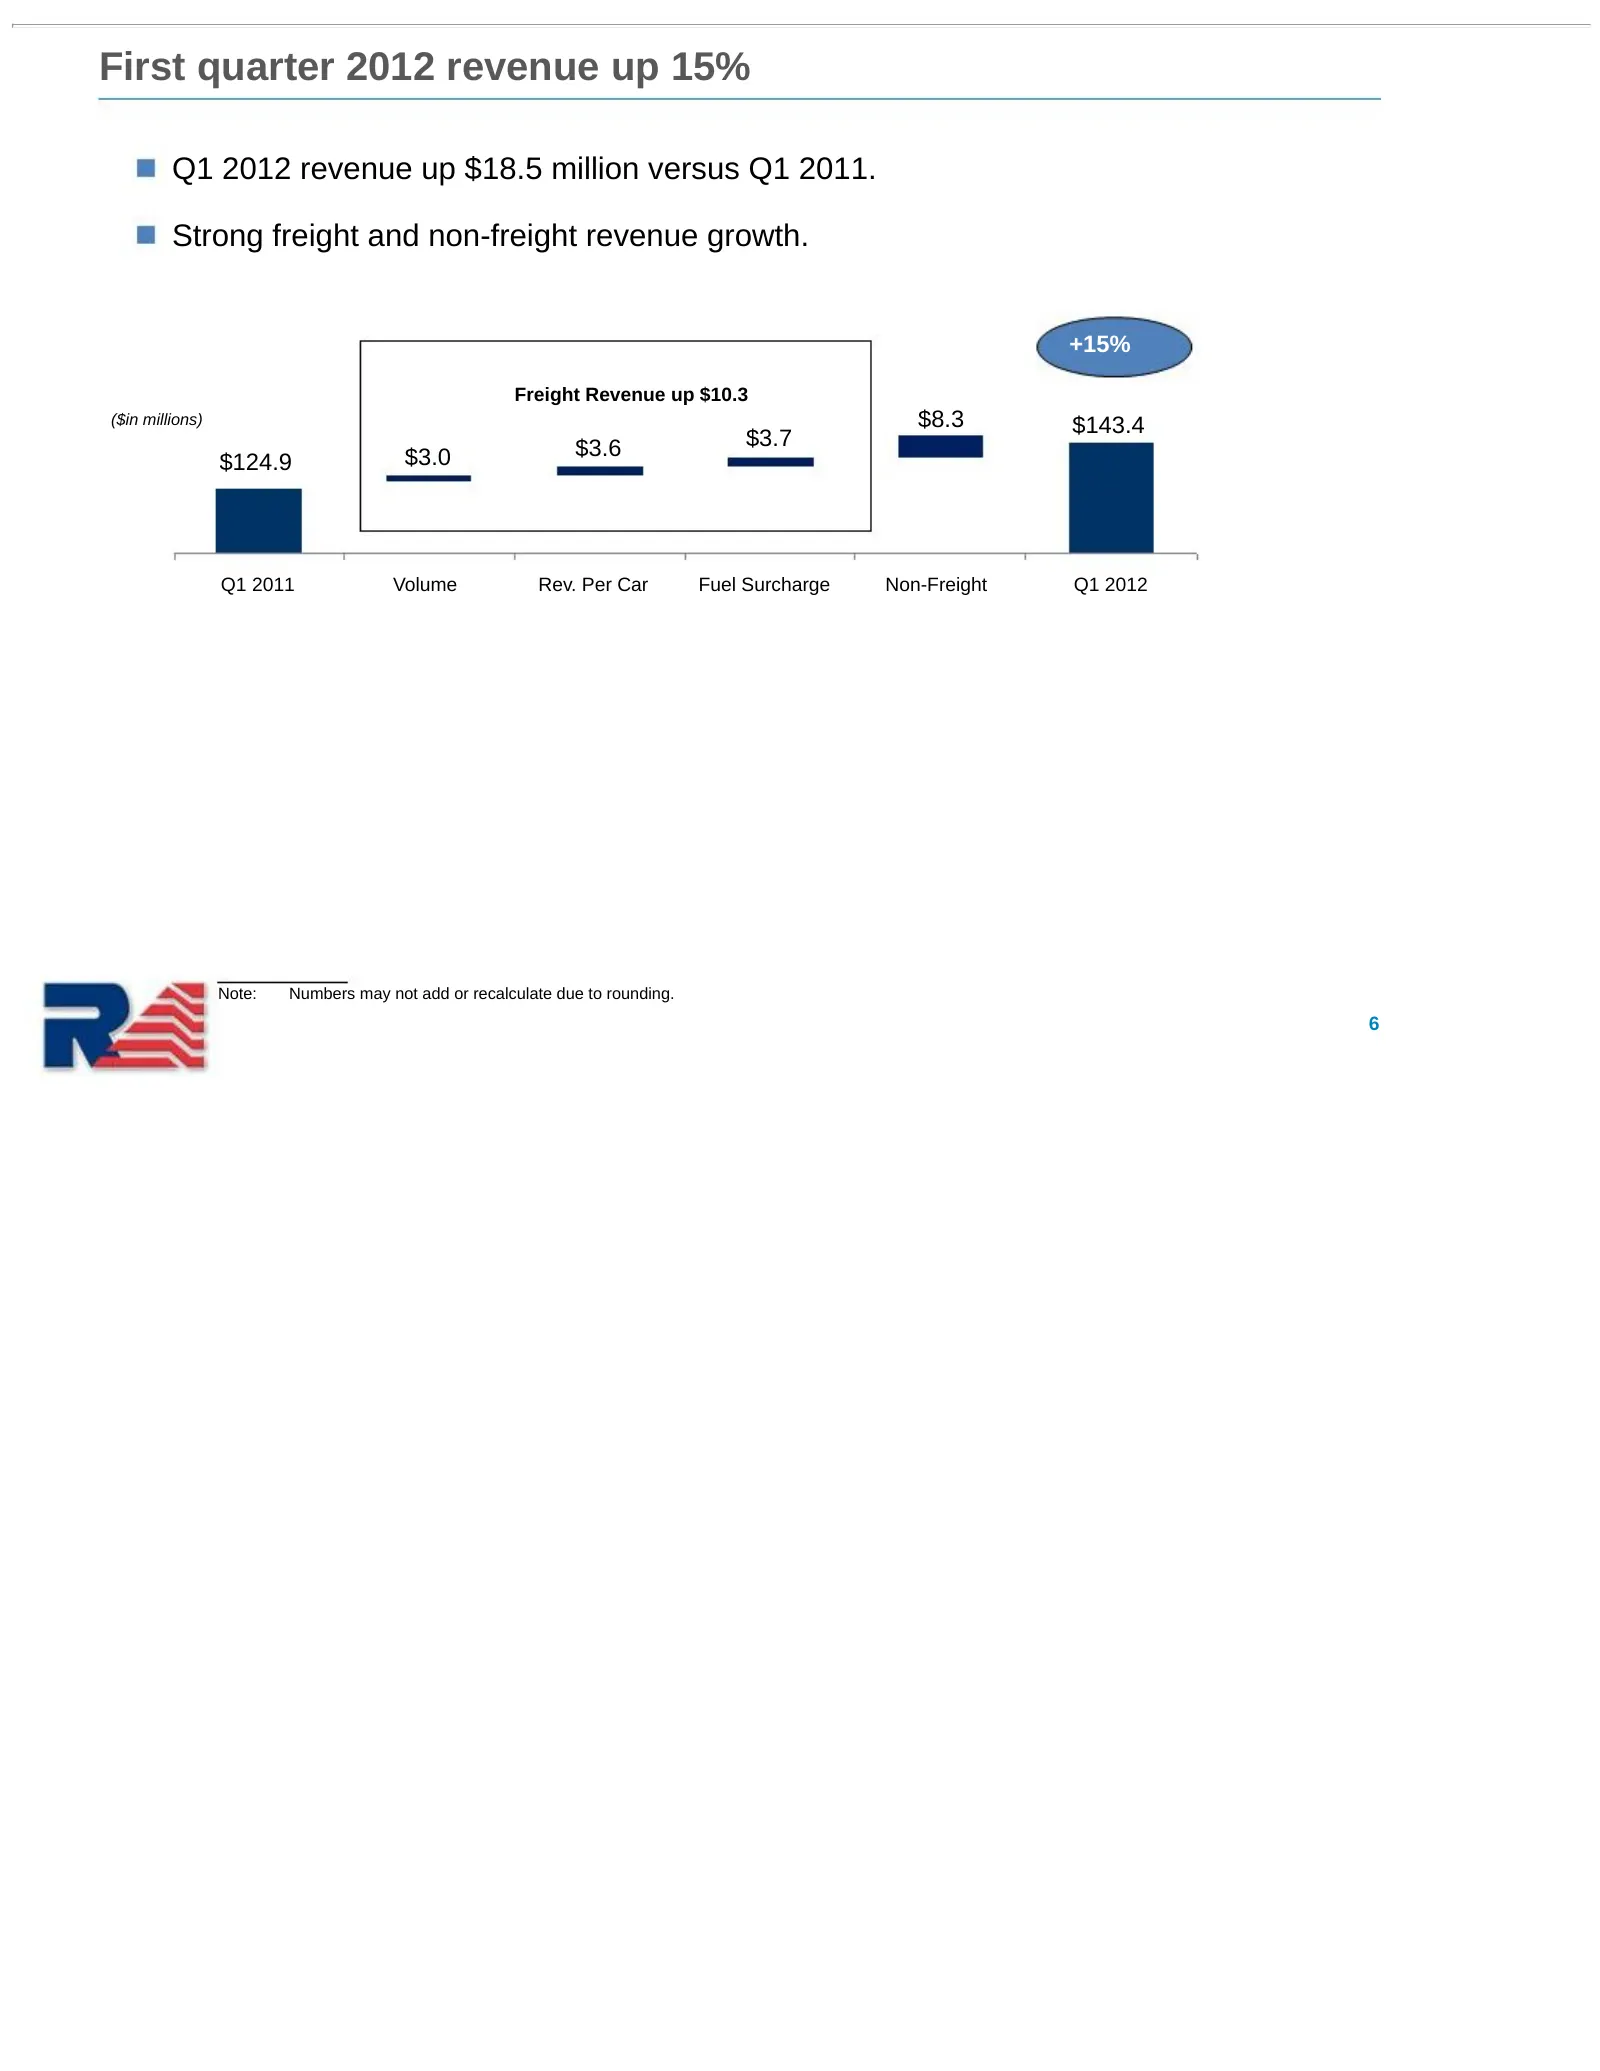
First quarter 2012 revenue up 15% Q1 2012 revenue up $18.5 million versus Q1 2011. Strong freight and non-freight revenue growth. +15% Freight Revenue up $10.3 ($in millions) $8.3 $143.4 $3.6 $3.7 $124.9 $3.0 Q1 2011 Volume Rev. Per Car Fuel Surcharge Non-Freight Q1 2012 Note: Numbers may not add or
Slide 7: First quarter 2012 carloads increased 3%, up 6% excluding coal
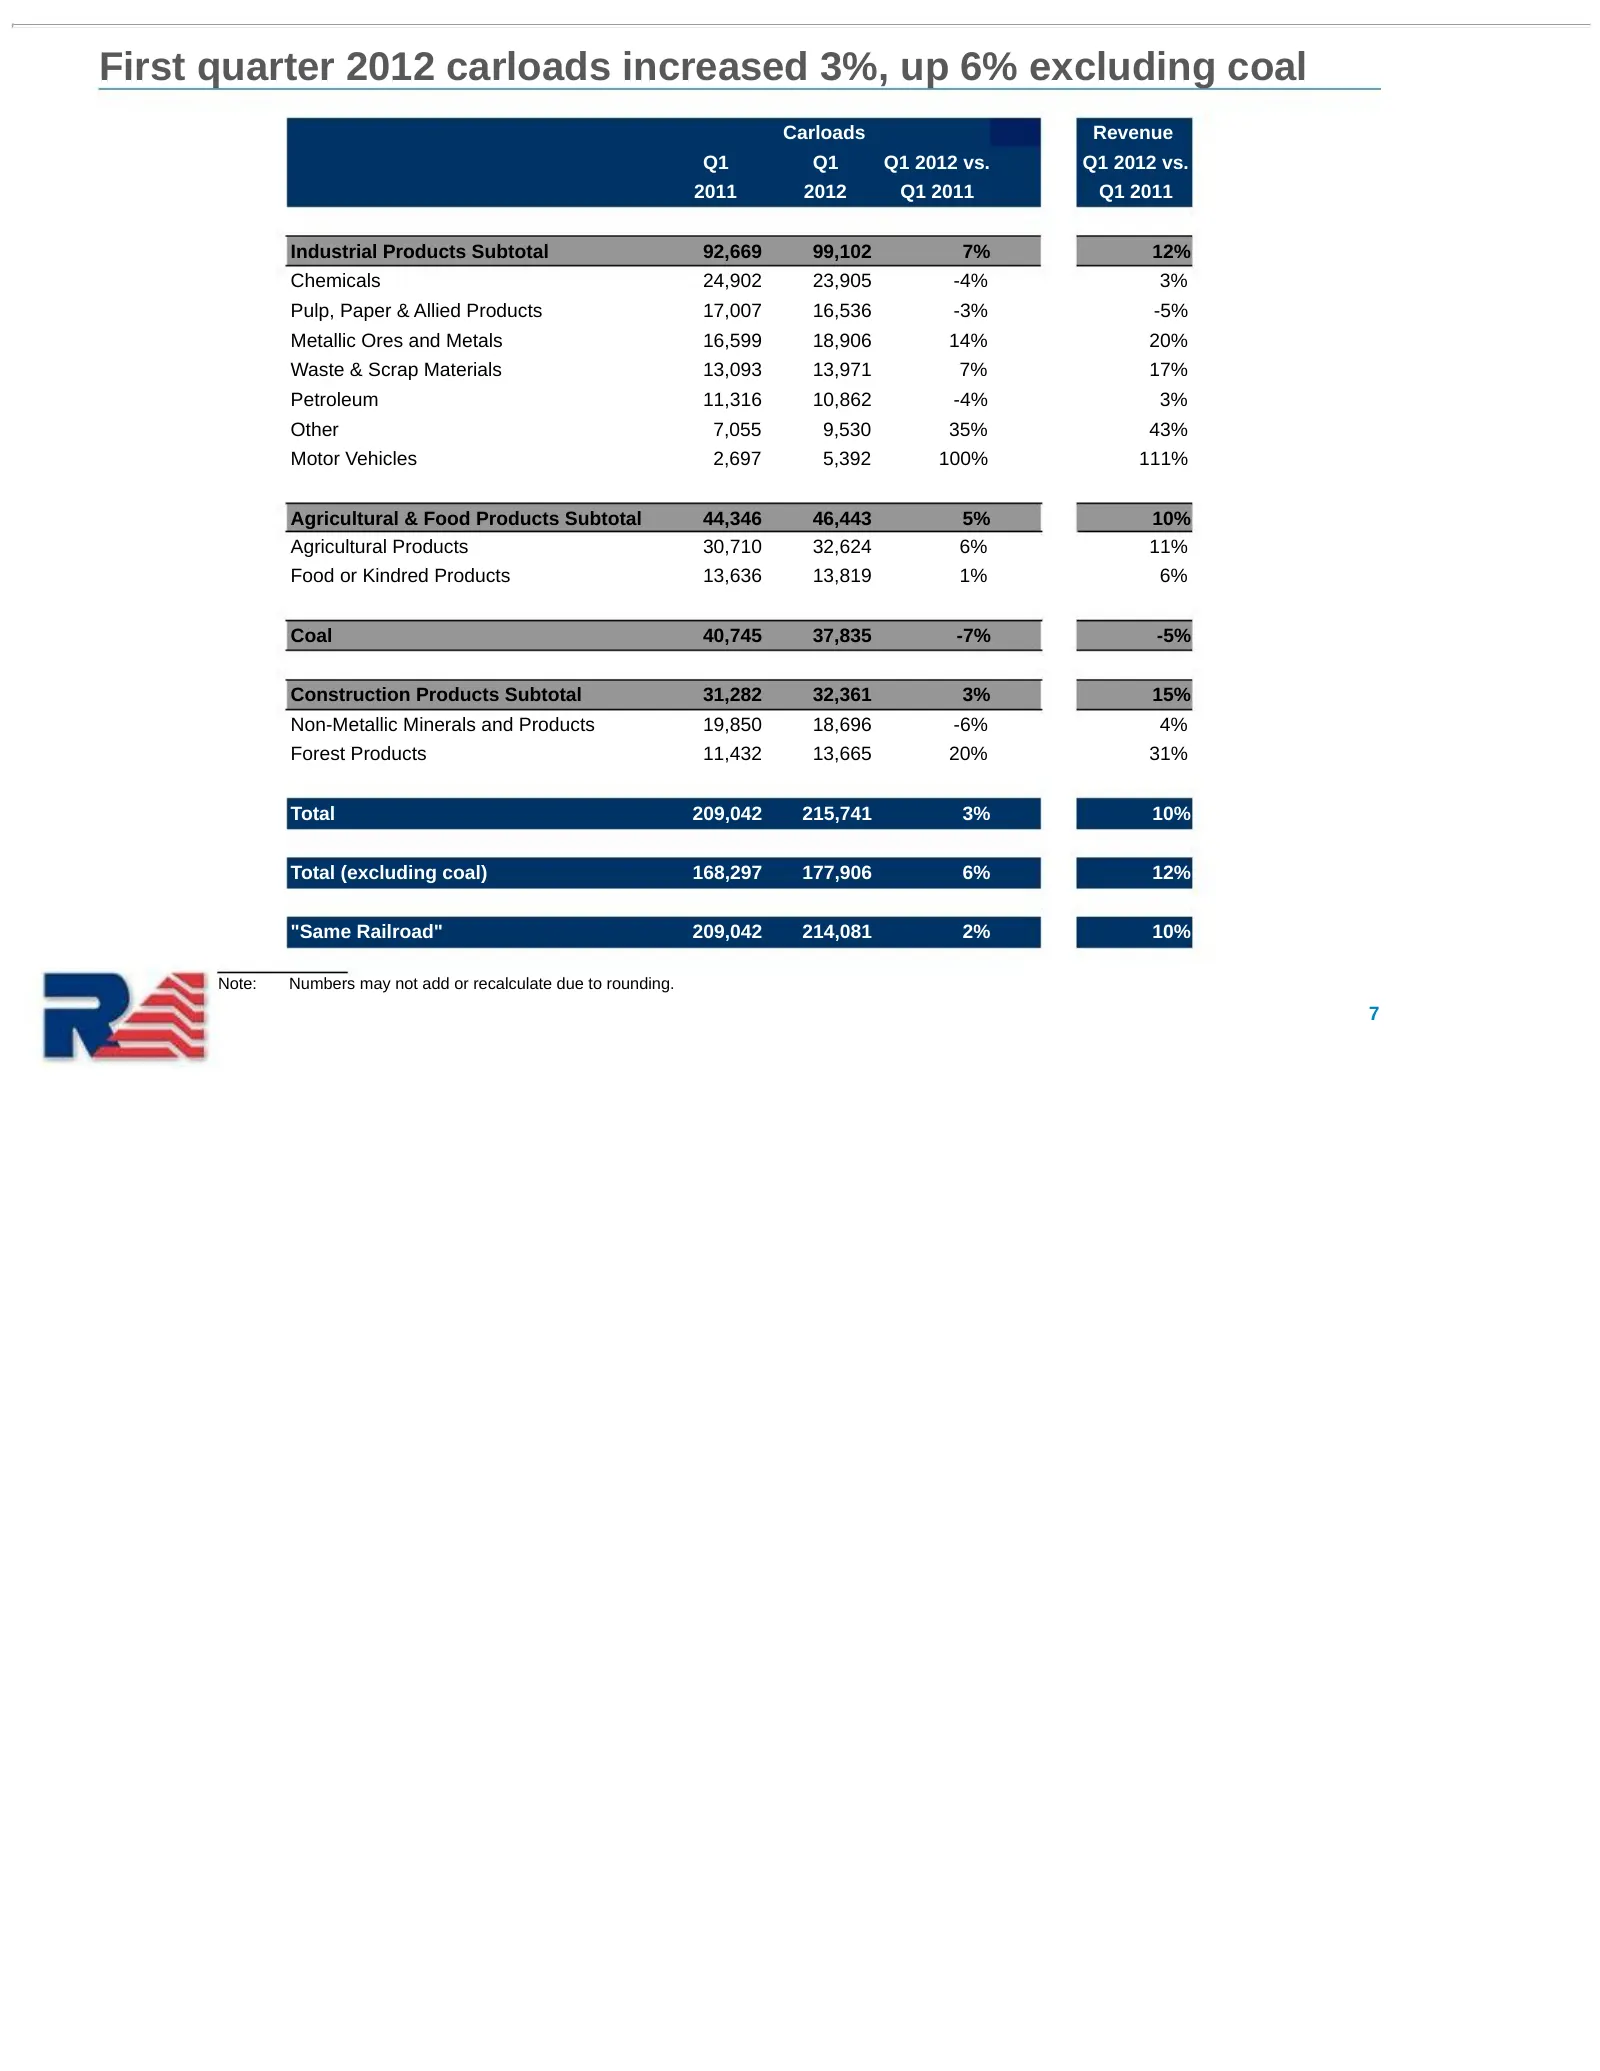
First quarter 2012 carloads increased 3%, up 6% excluding coal Carloads Revenue Q1 Q1 Q1 2012 vs. Q1 2012 vs. 2011 2012 Q1 2011 Q1 2011 Industrial Products Subtotal 92,669 99,102 7% 12% Chemicals 24,902 23,905 -4% 3% Pulp, Paper & Allied Products 17,007 16,536 -3% -5% Metallic Ores and Metals 16,599
Slide 8: First quarter 2012 average freight revenue per carload up 7%
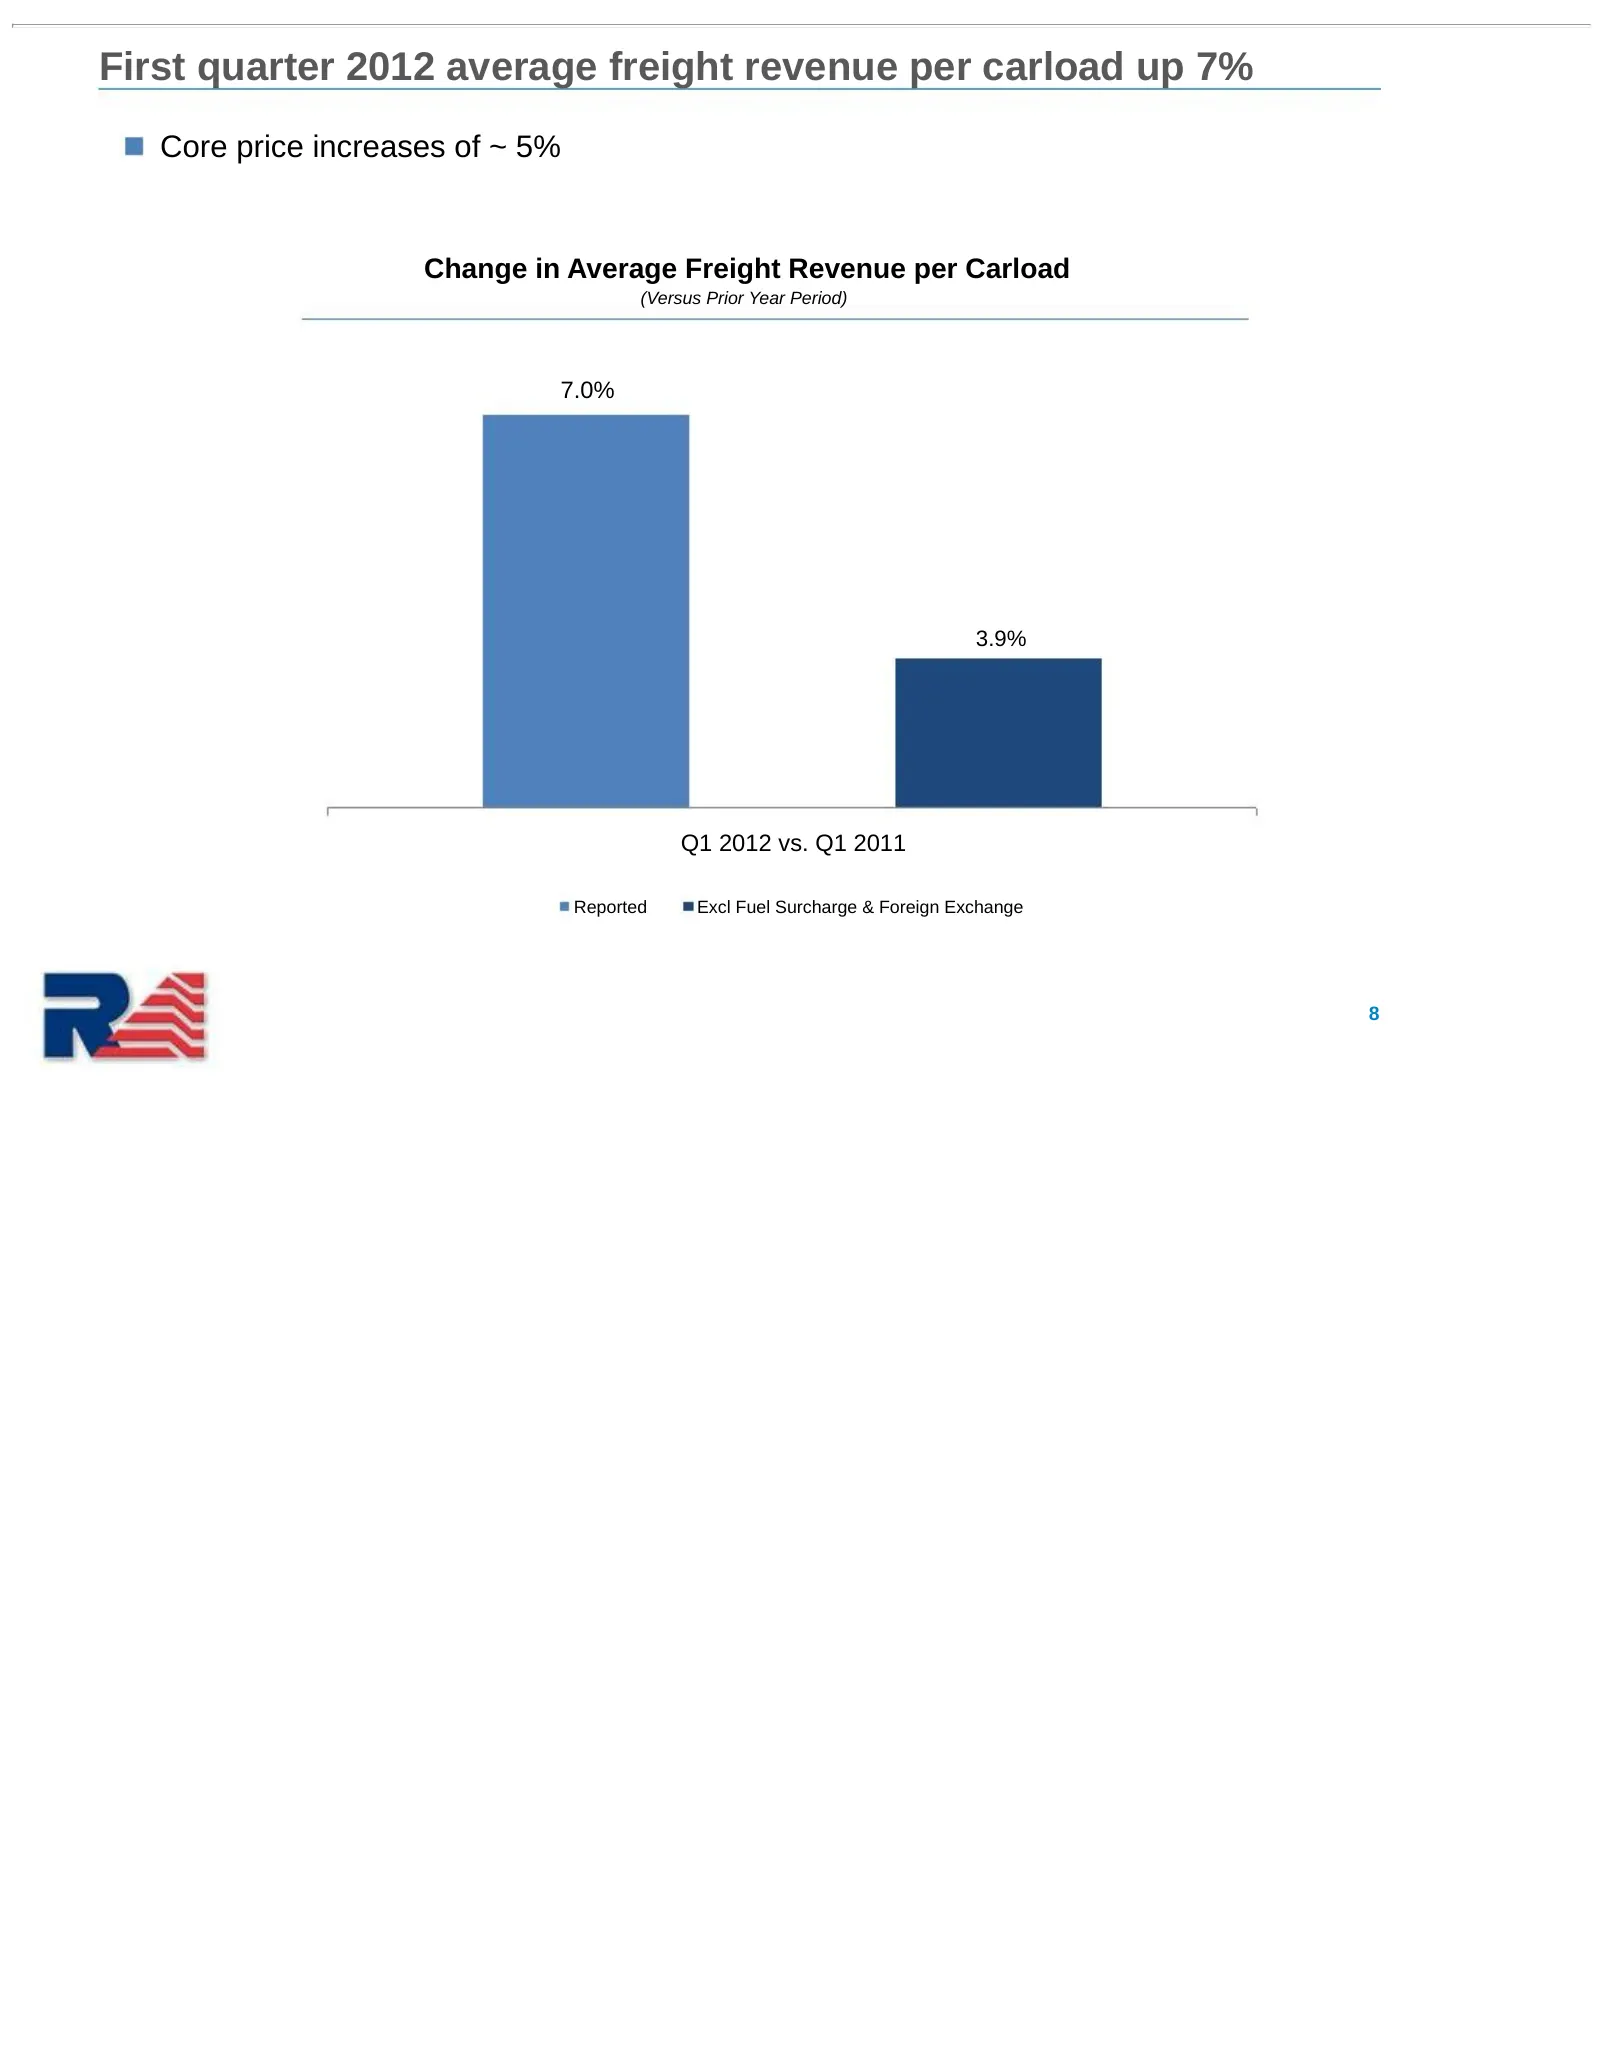
First quarter 2012 average freight revenue per carload up 7% Core price increases of ~ 5% Change in Average Freight Revenue per Carload (Versus Prior Year Period) 7.0% 3.9% Q1 2012 vs. Q1 2011 Reported Excl Fuel Surcharge & Foreign Exchange 8
Slide 9: First quarter non-freight revenue up 30%
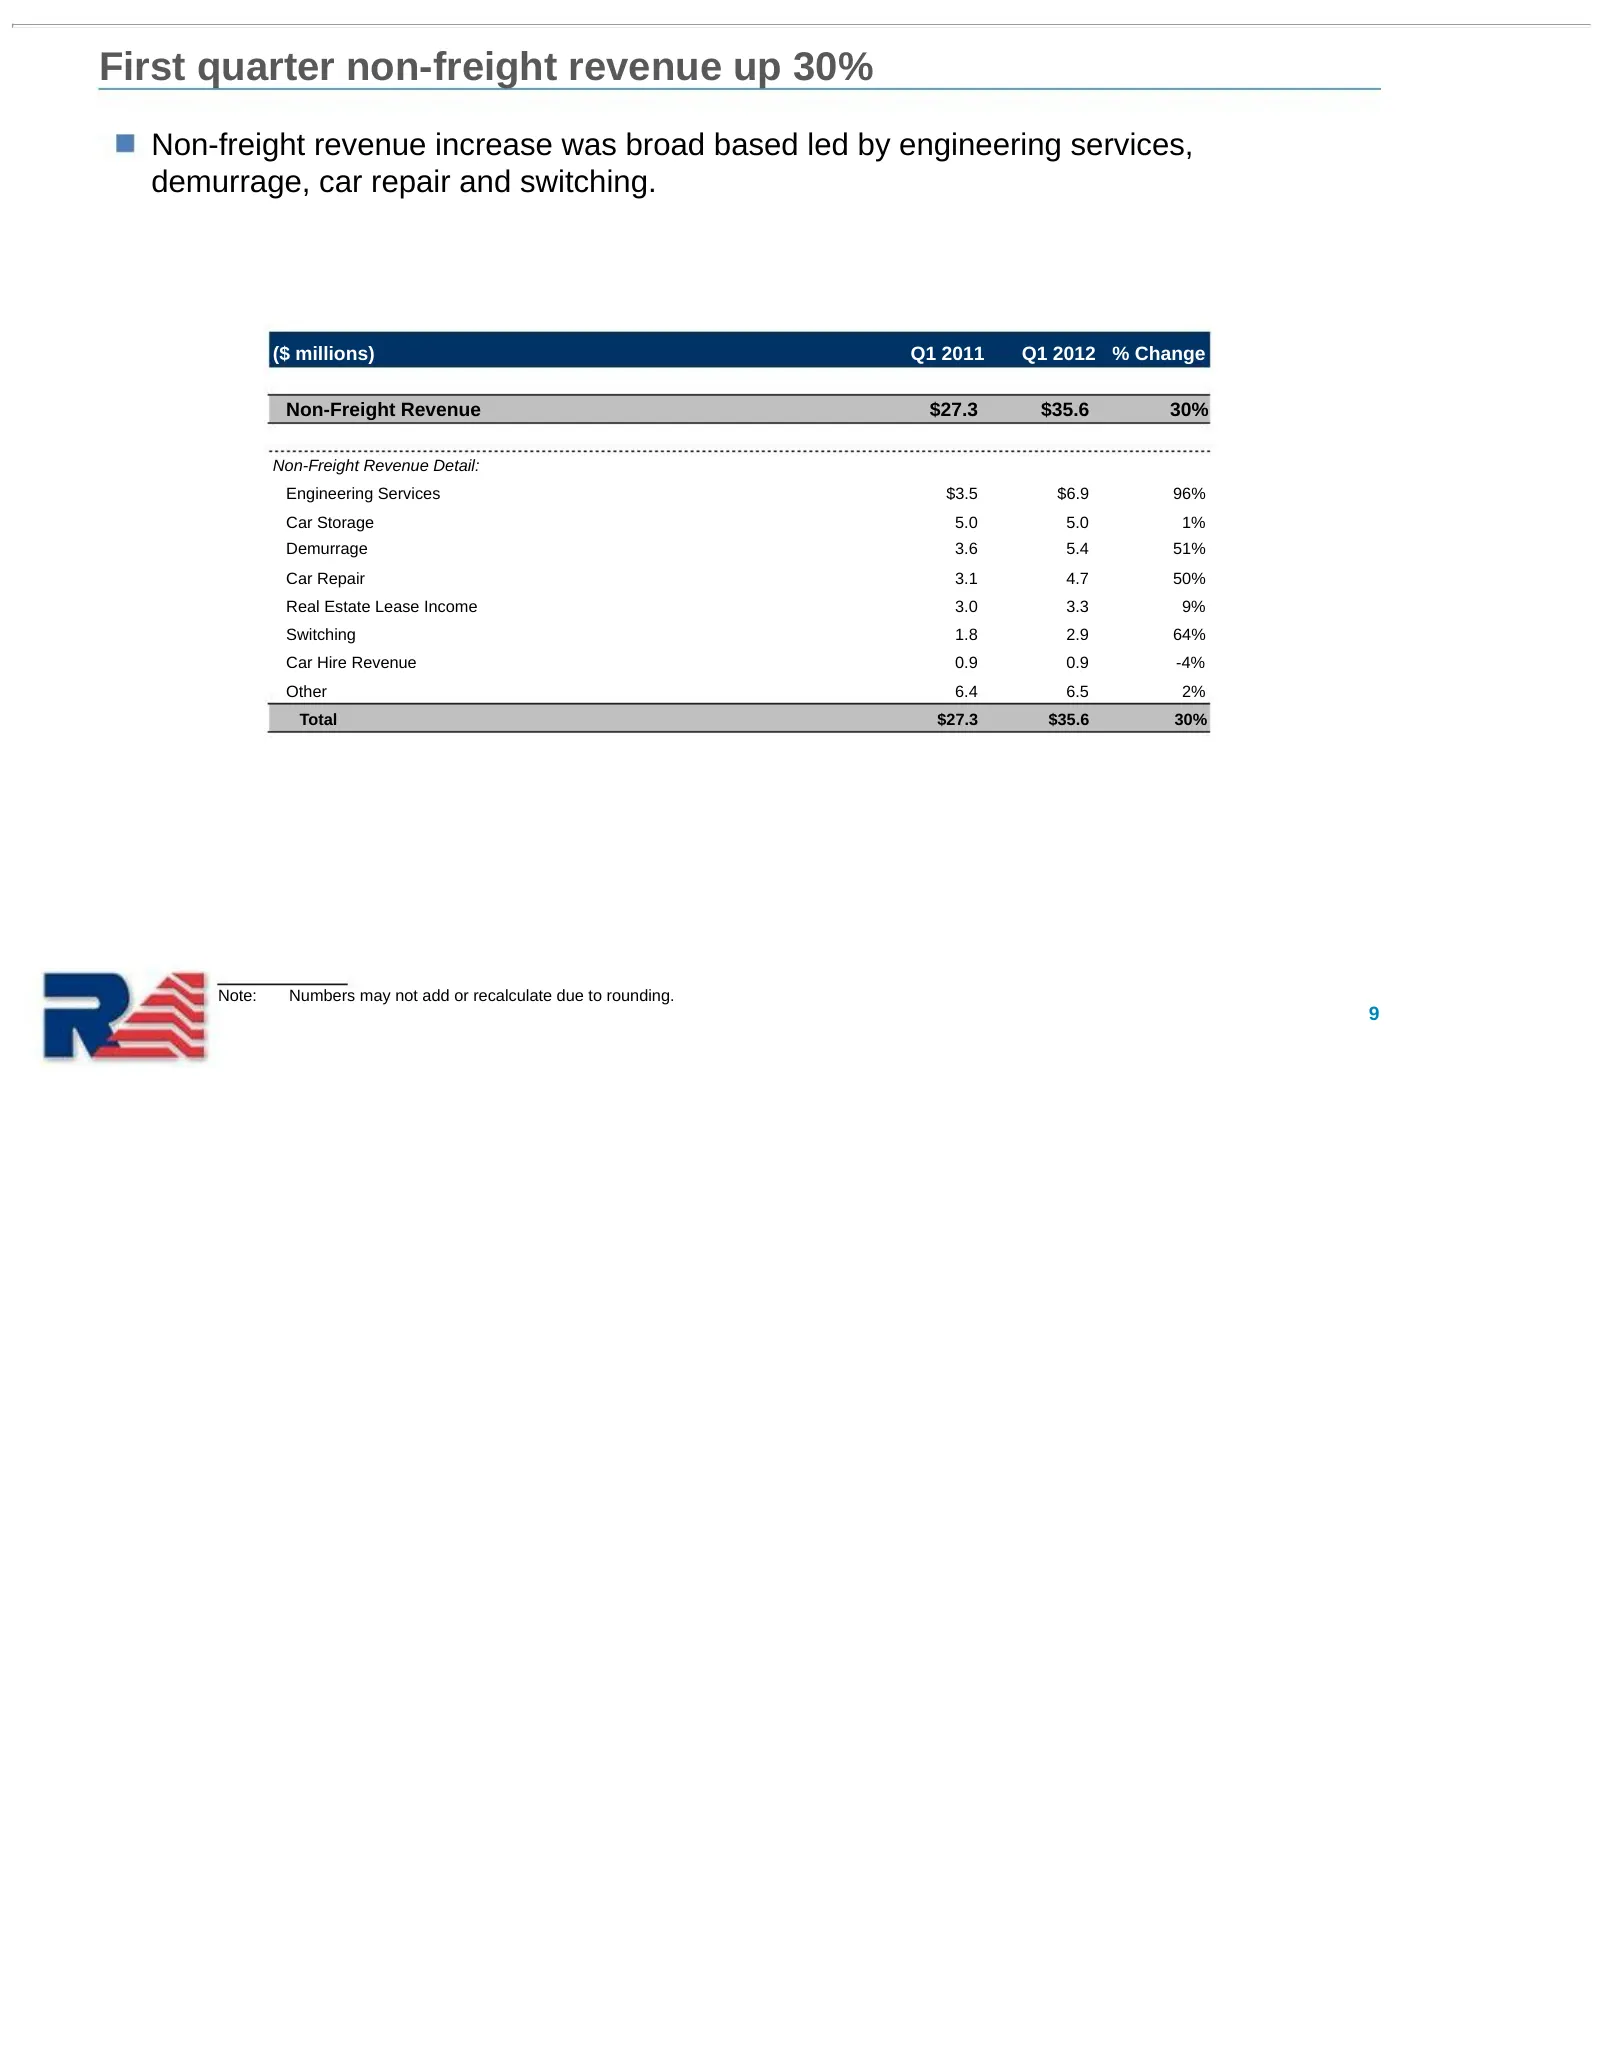
First quarter non-freight revenue up 30% Non-freight revenue increase was broad based led by engineering services, demurrage, car repair and switching. ($ millions) Q1 2011 Q1 2012 % Change Non-Freight Revenue $27.3 $35.6 30% Non-Freight Revenue Detail: Engineering Services $3.5 $6.9 96% Car Storage
Slide 10: 2012 Commercial Overview
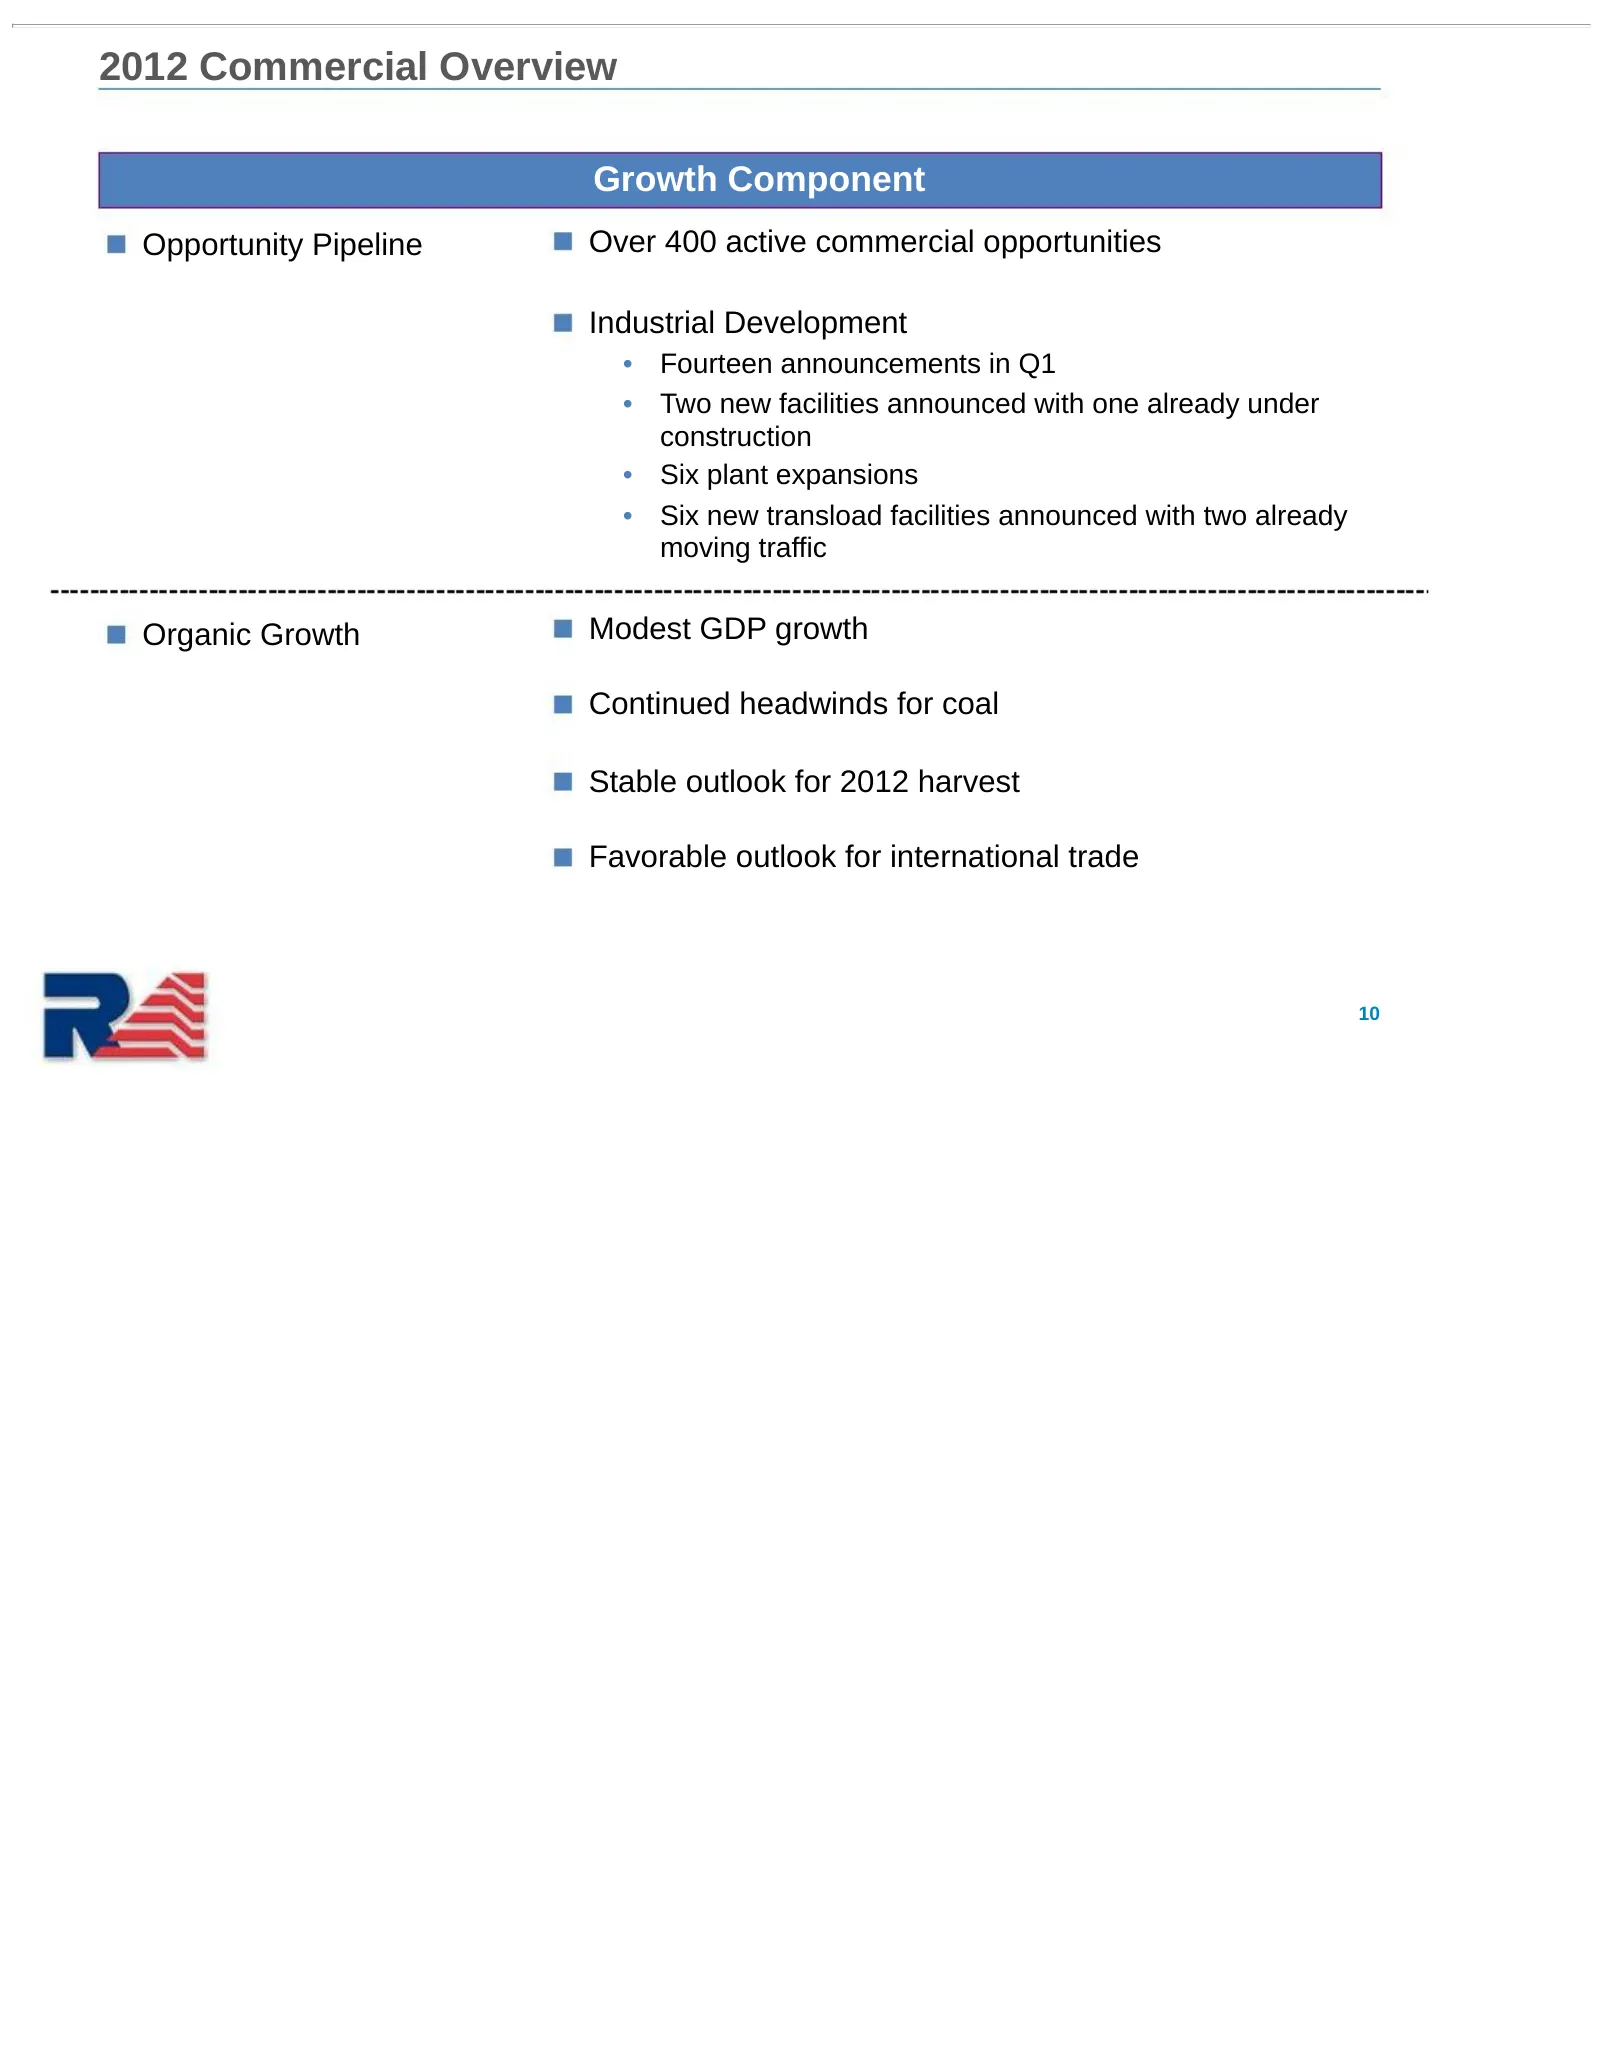
2012 Commercial Overview Growth Component Opportunity Pipeline Over 400 active commercial opportunities Industrial Development • Fourteen announcements in Q1 • Two new facilities announced with one already under construction • Six plant expansions • Six new transload facilities announced with two al
Slide 11: Operations Update
Operations Update 11
Slide 12: Continued focus on operating ratio improvement
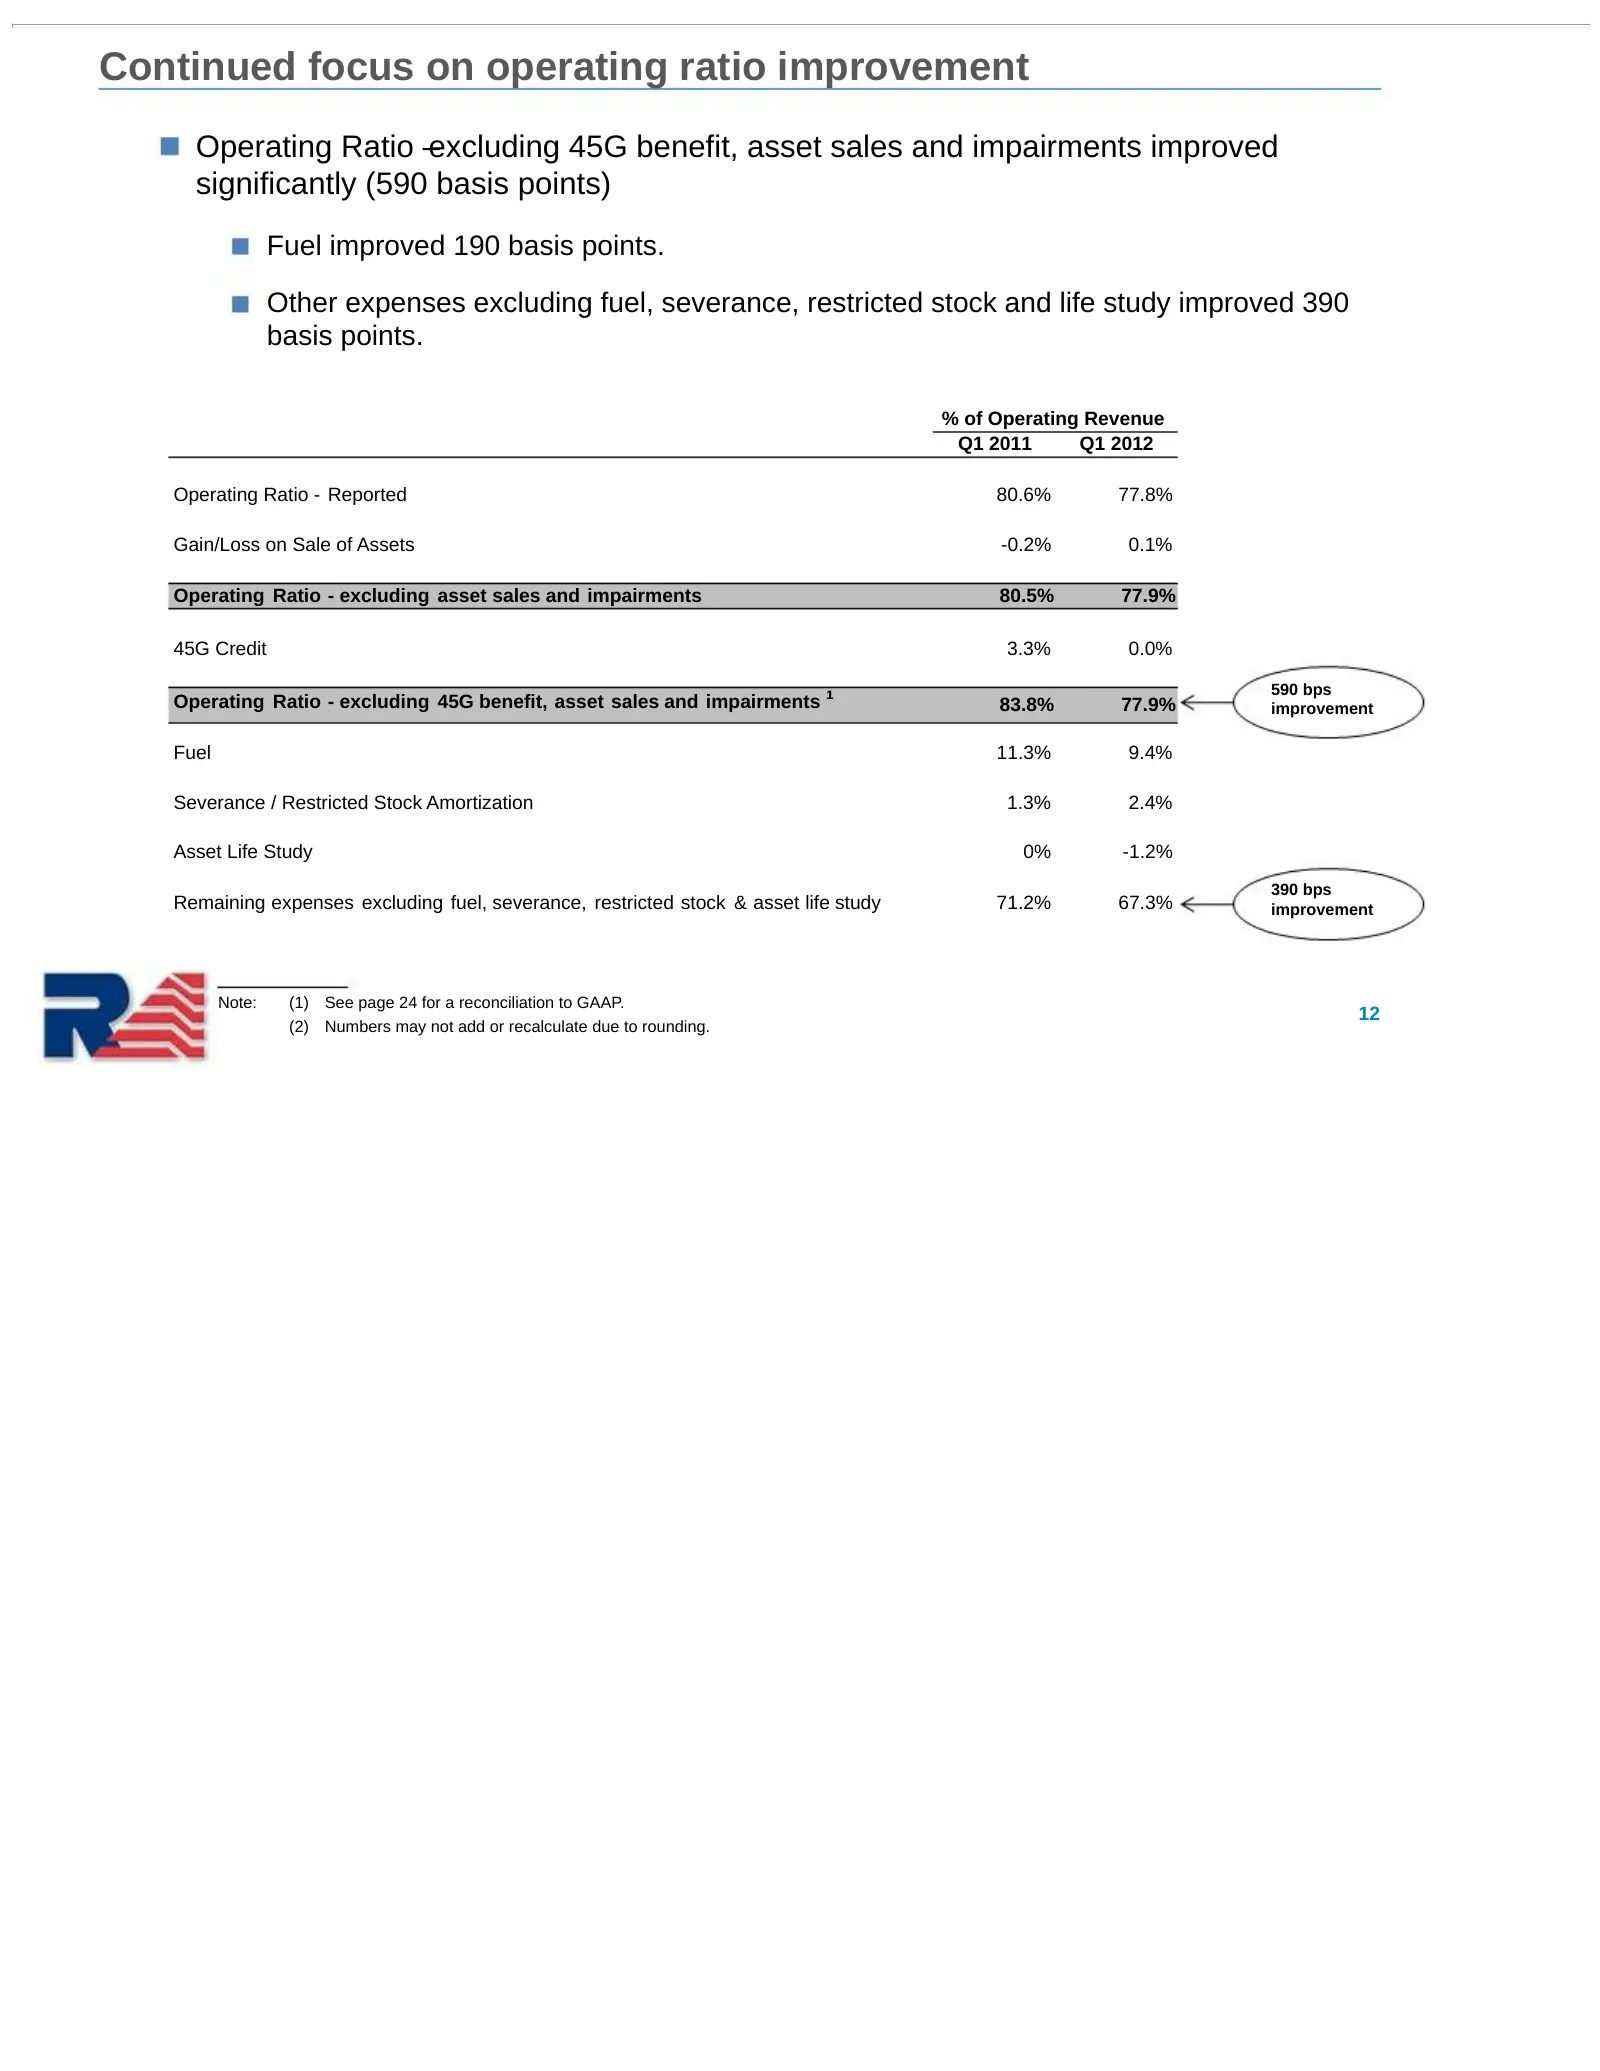
Continued focus on operating ratio improvement Operating Ratio –excluding 45G benefit, asset sales and impairments improved significantly (590 basis points) Fuel improved 190 basis points. Other expenses excluding fuel, severance, restricted stock and life study improved 390 basis points. % of Opera
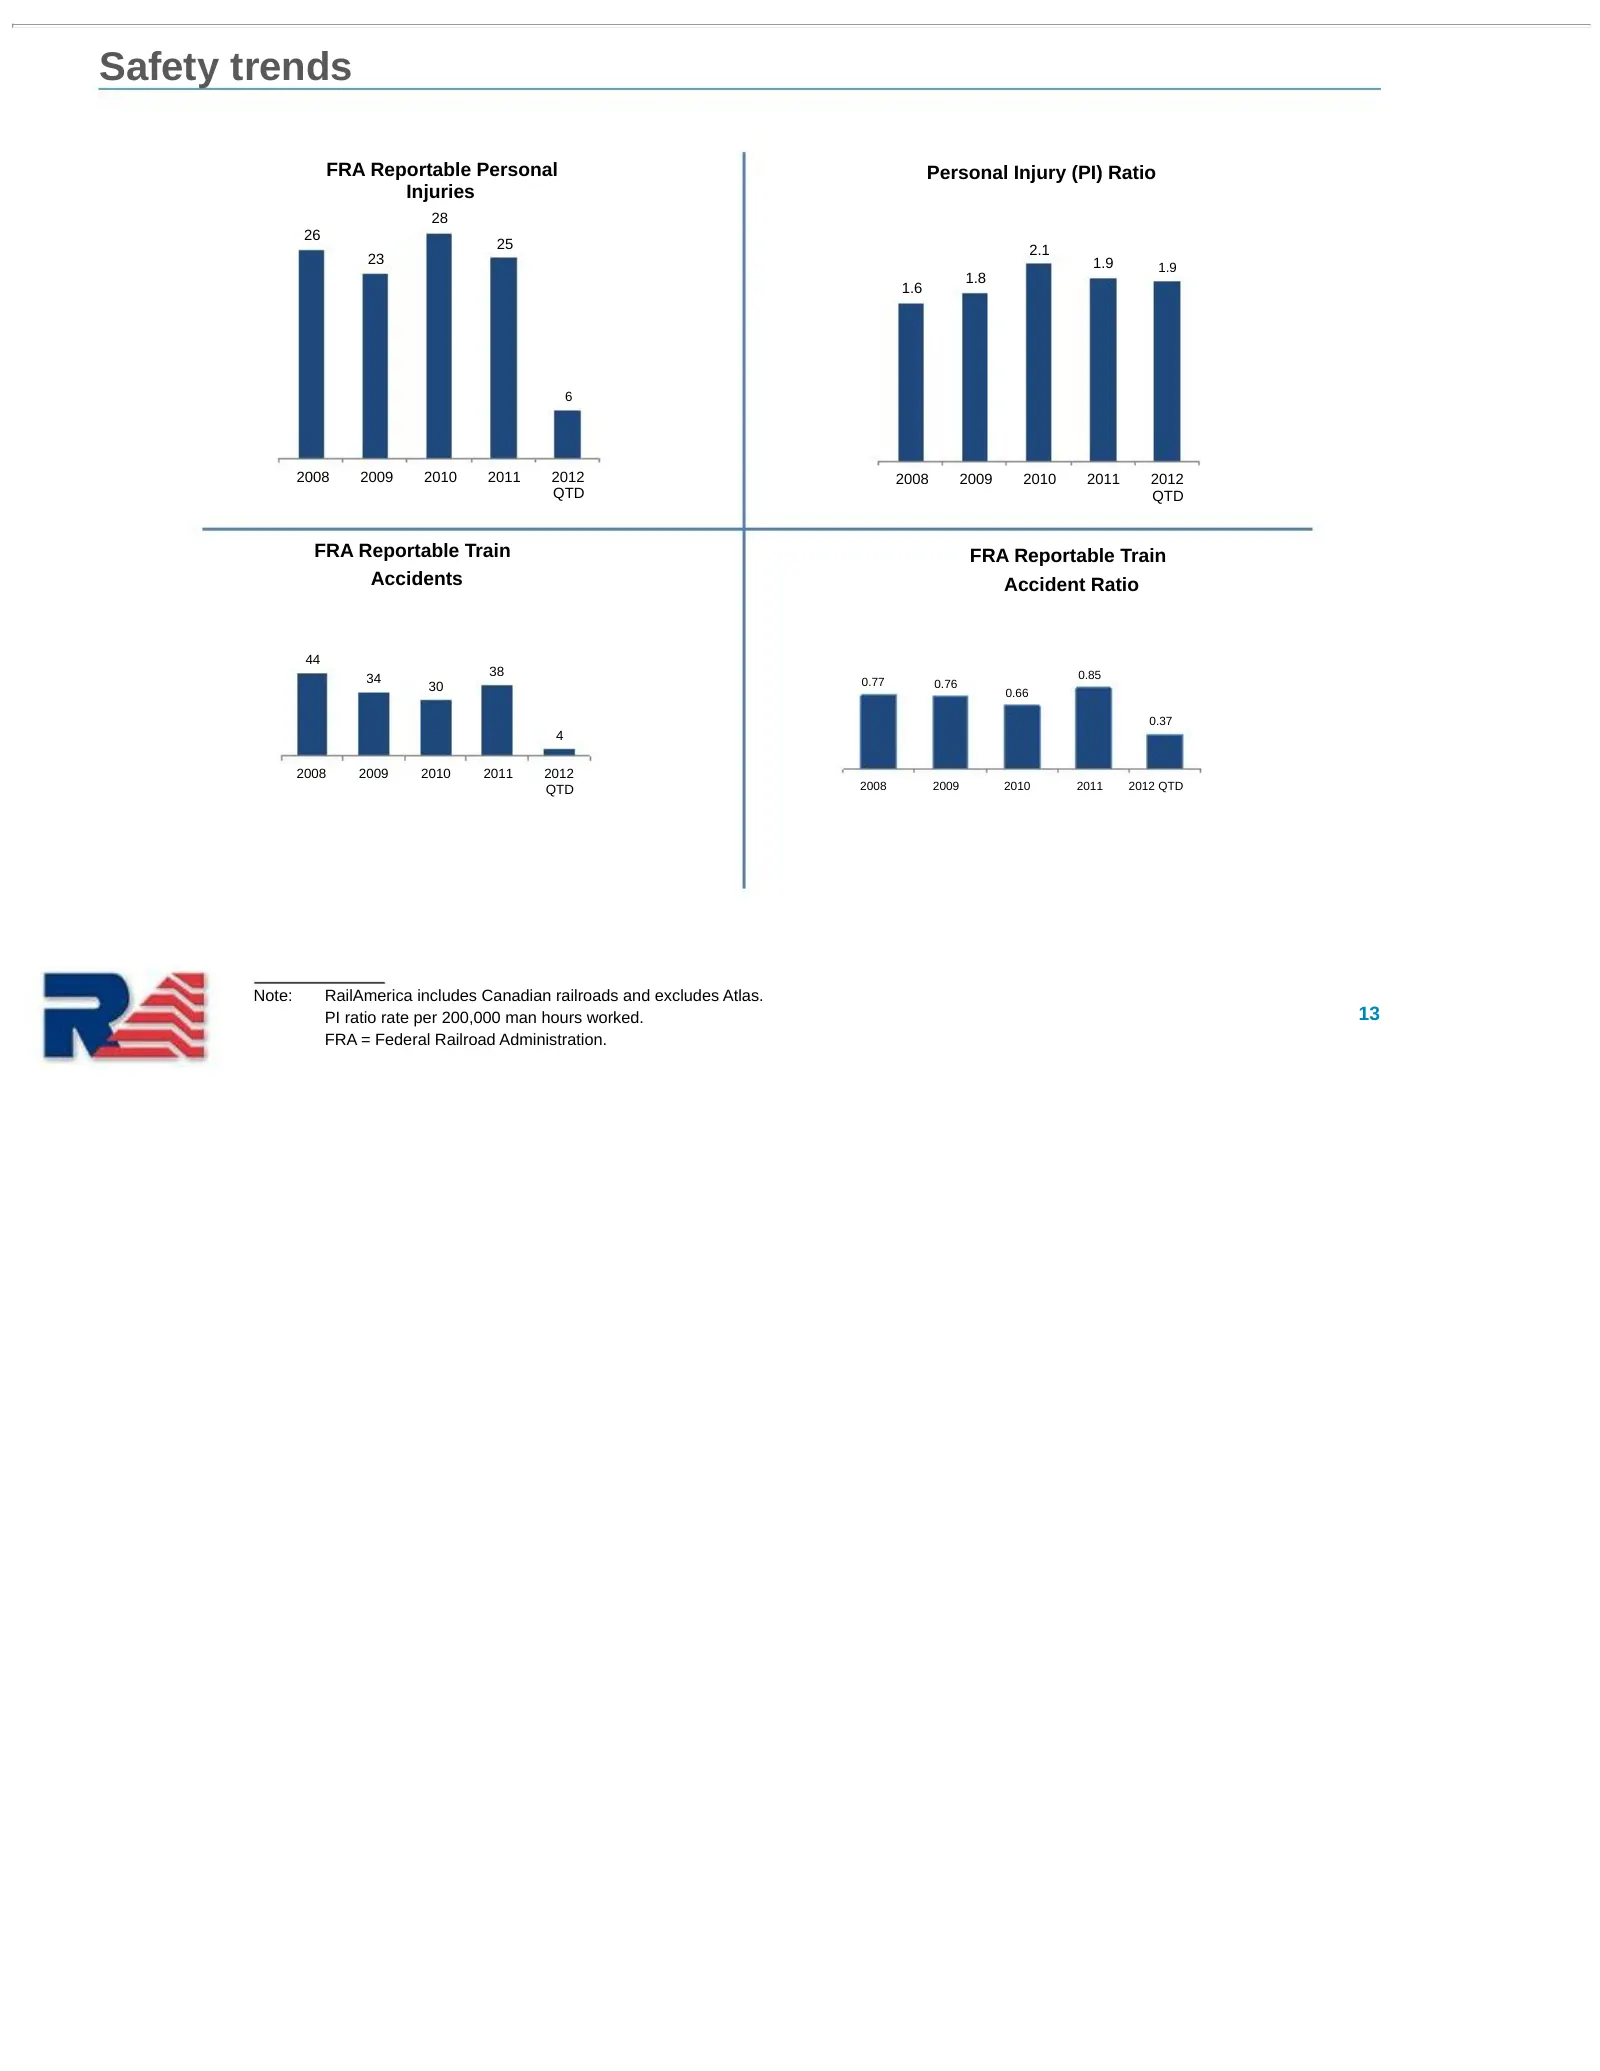
Slide 13: Safety trends
Safety trends FRA Reportable Personal Personal Injury (PI) Ratio Injuries 28 26 25 2.1 23 1.9 1.9 1.8 1.6 6 2008 2009 2010 2011 2012 2008 2009 2010 2011 2012 QTD QTD FRA Reportable Train FRA Reportable Train Accidents Accident Ratio 44 38 0.85 34 0.77 0.76 30 0.66 0.37 4 2008 2009 2010 2011 2012 QTD
Slide 14: Financial Update
Financial Update Clyde Preslar, Chief Financial Officer 14
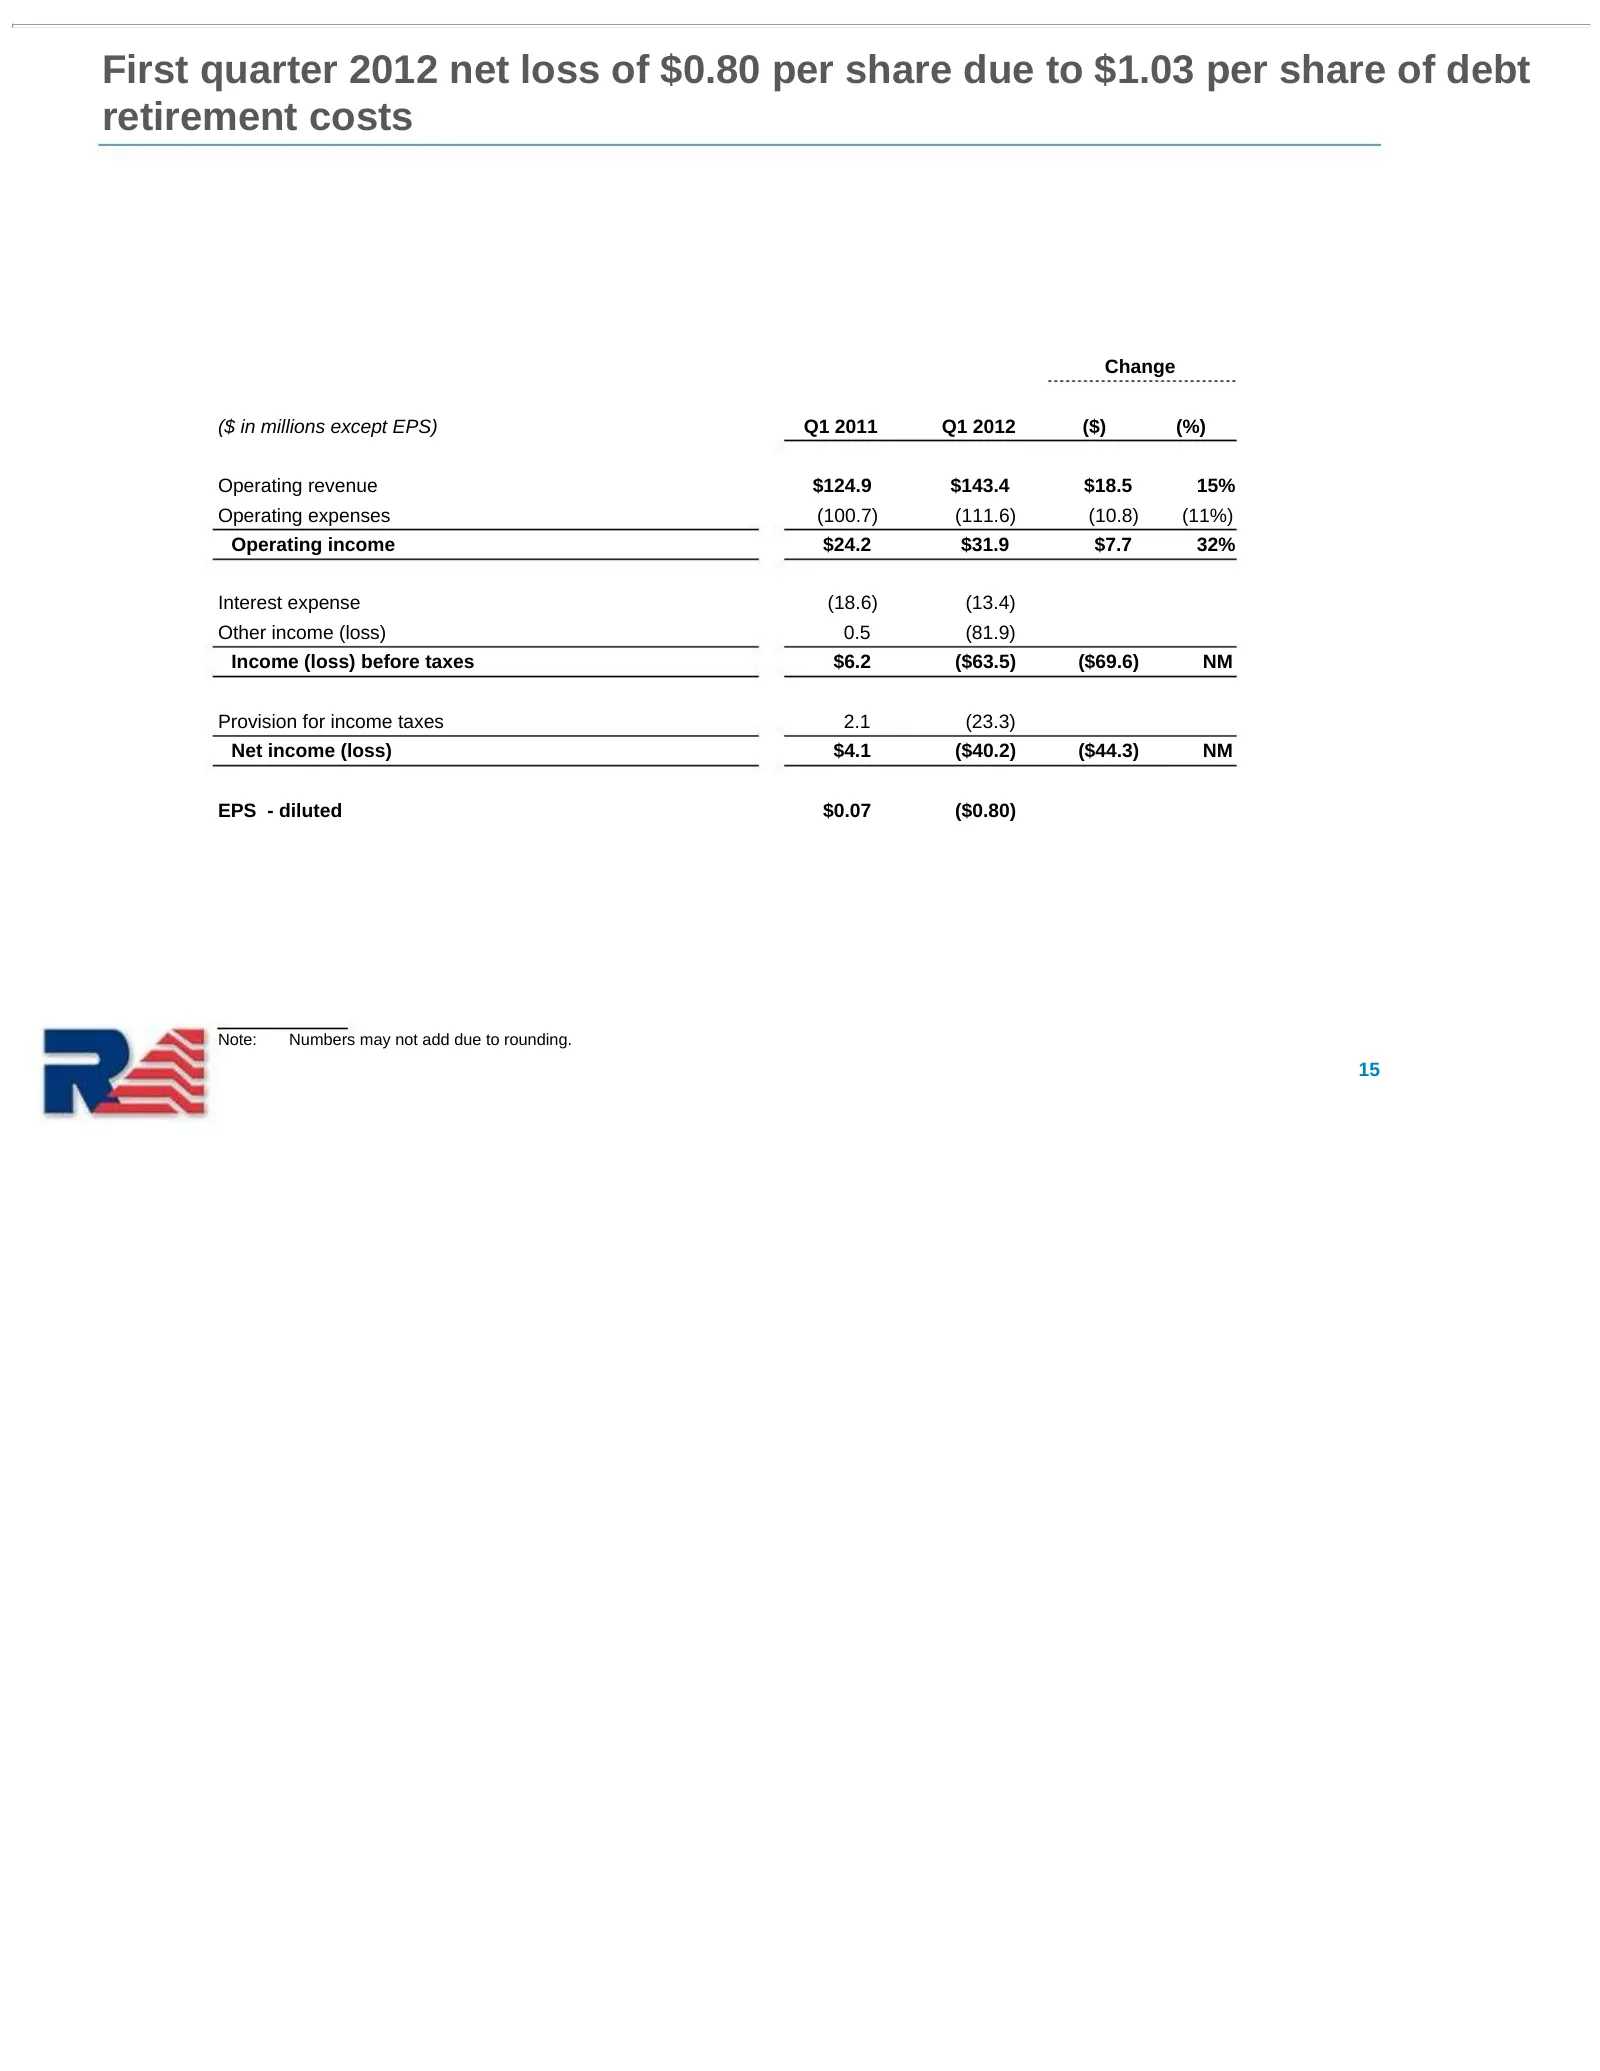
Slide 15: First quarter 2012 net loss of $0.80 per share due to debt retirement costs
First quarter 2012 net loss of $0.80 per share due to $1.03 per share of debt retirement costs Change ($ in millions except EPS) Q1 2011 Q1 2012 ($) (%) Operating revenue $124.9 $143.4 $18.5 15% Operating expenses (100.7) (111.6) (10.8) (11%) Operating income $24.2 $31.9 $7.7 32% Interest expense (1
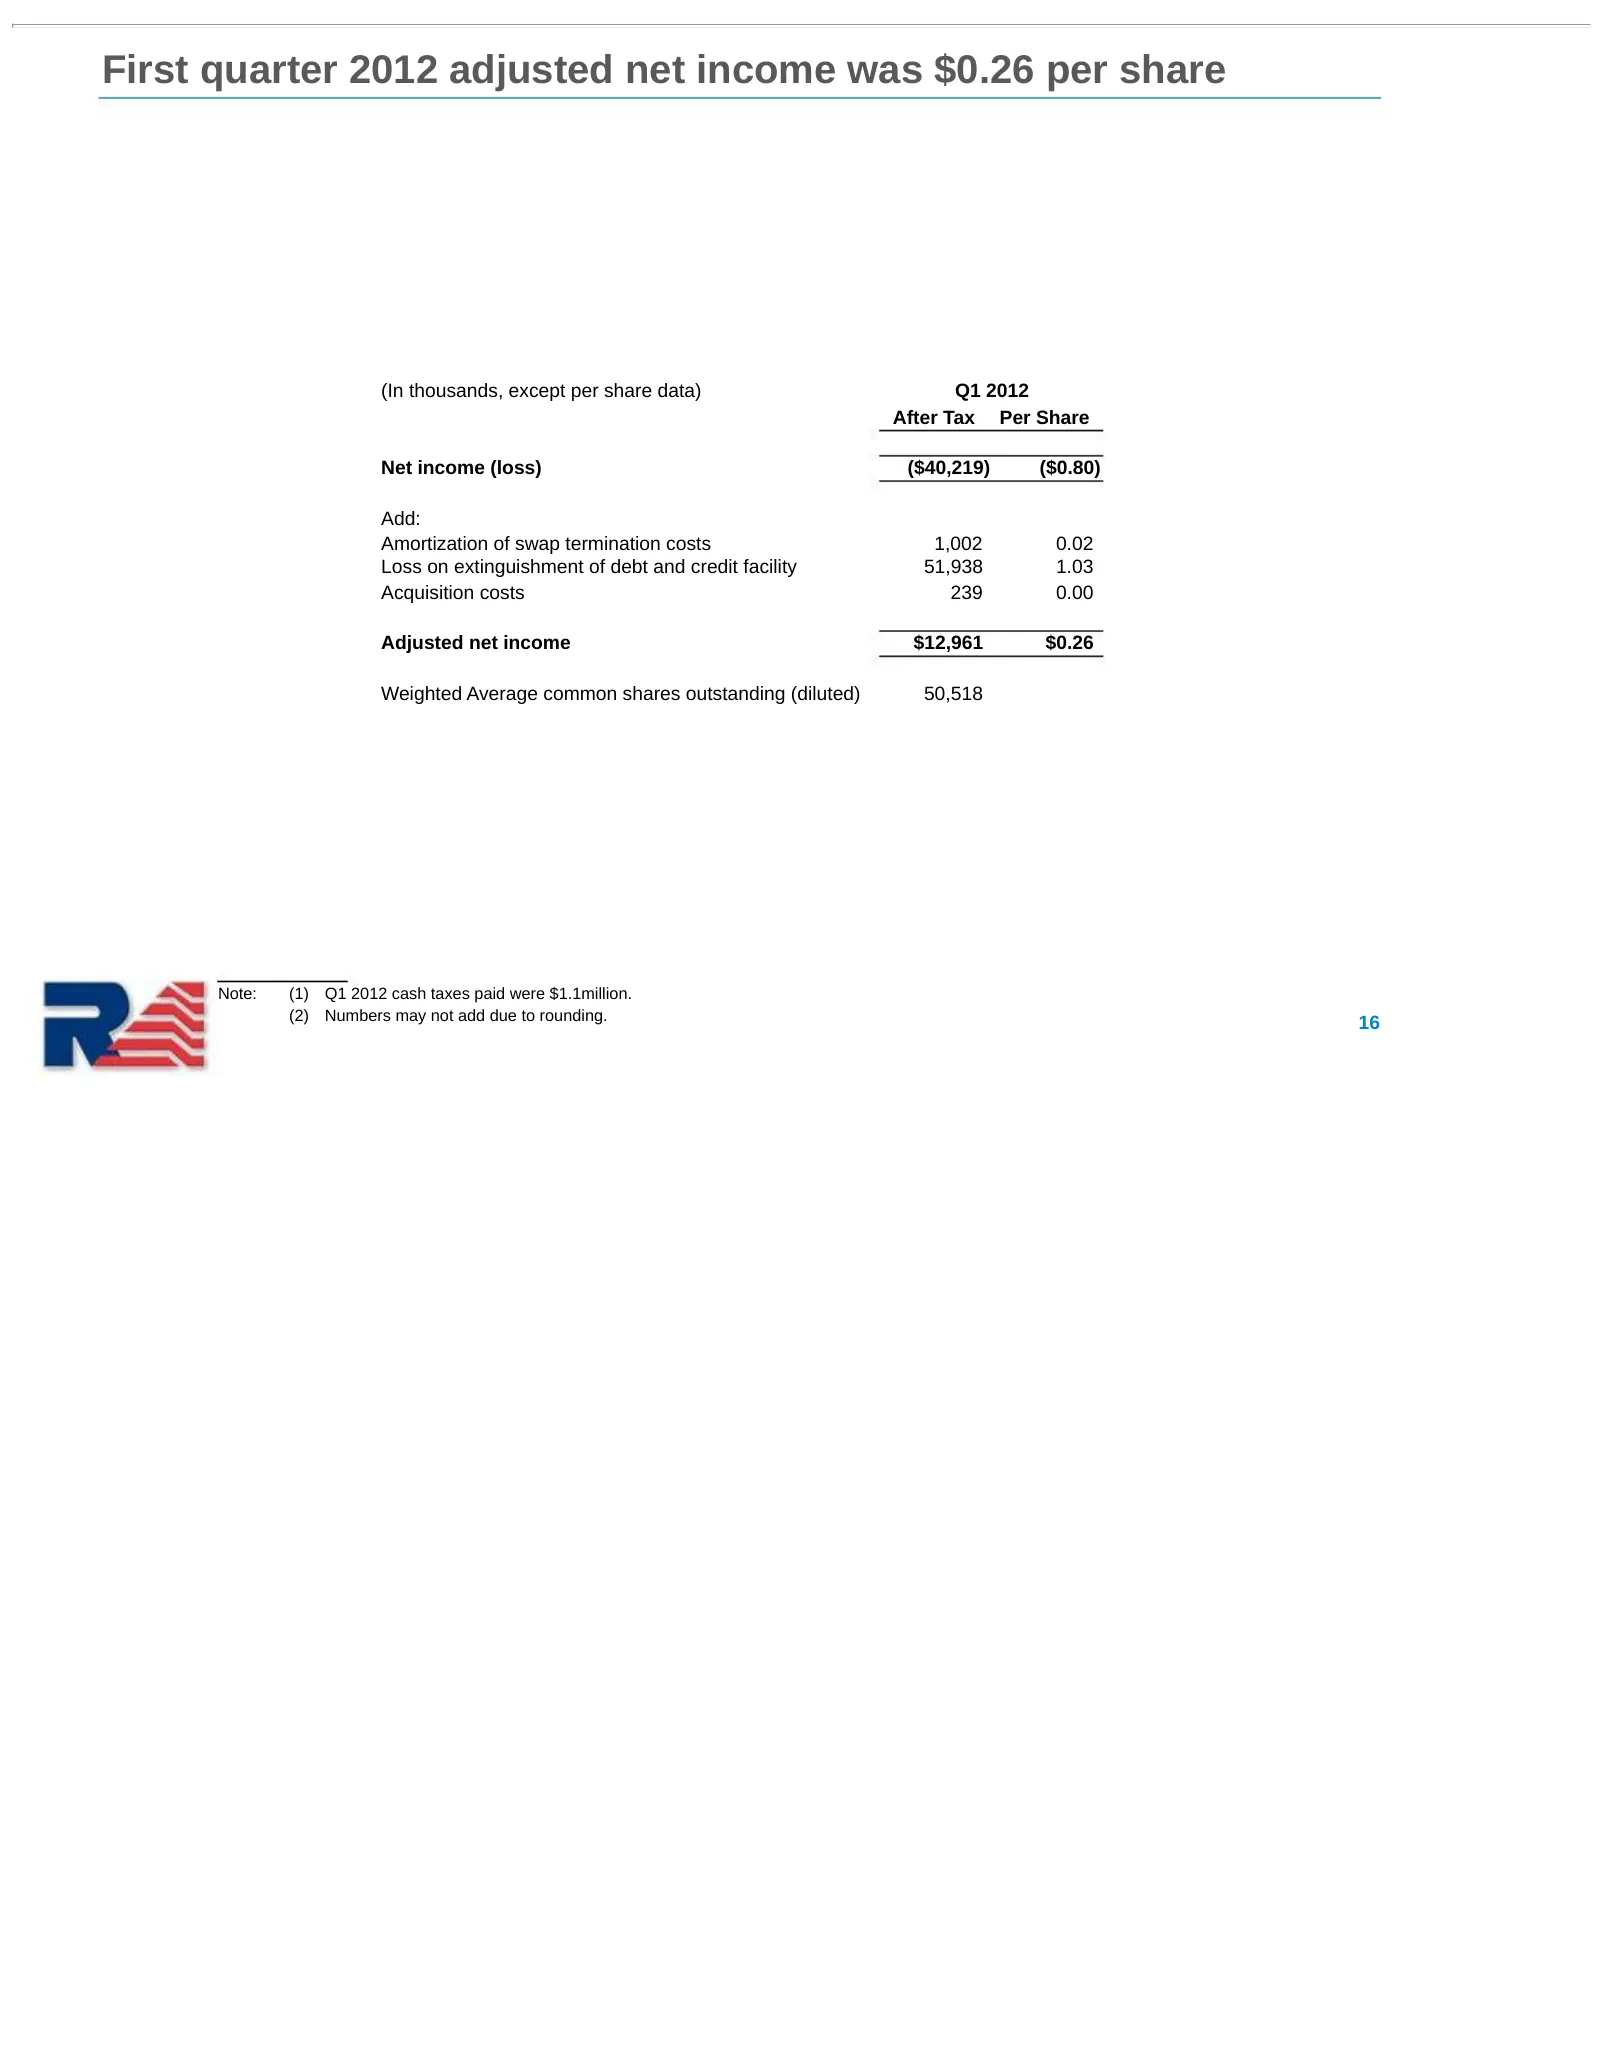
Slide 16: First quarter 2012 adjusted net income was $0.26 per share
First quarter 2012 adjusted net income was $0.26 per share (In thousands, except per share data) Q1 2012 After Tax Per Share Net income (loss) ($40,219) ($0.80) Add: Amortization of swap termination costs 1,002 0.02 Loss on extinguishment of debt and credit facility 51,938 1.03 Acquisition costs 239
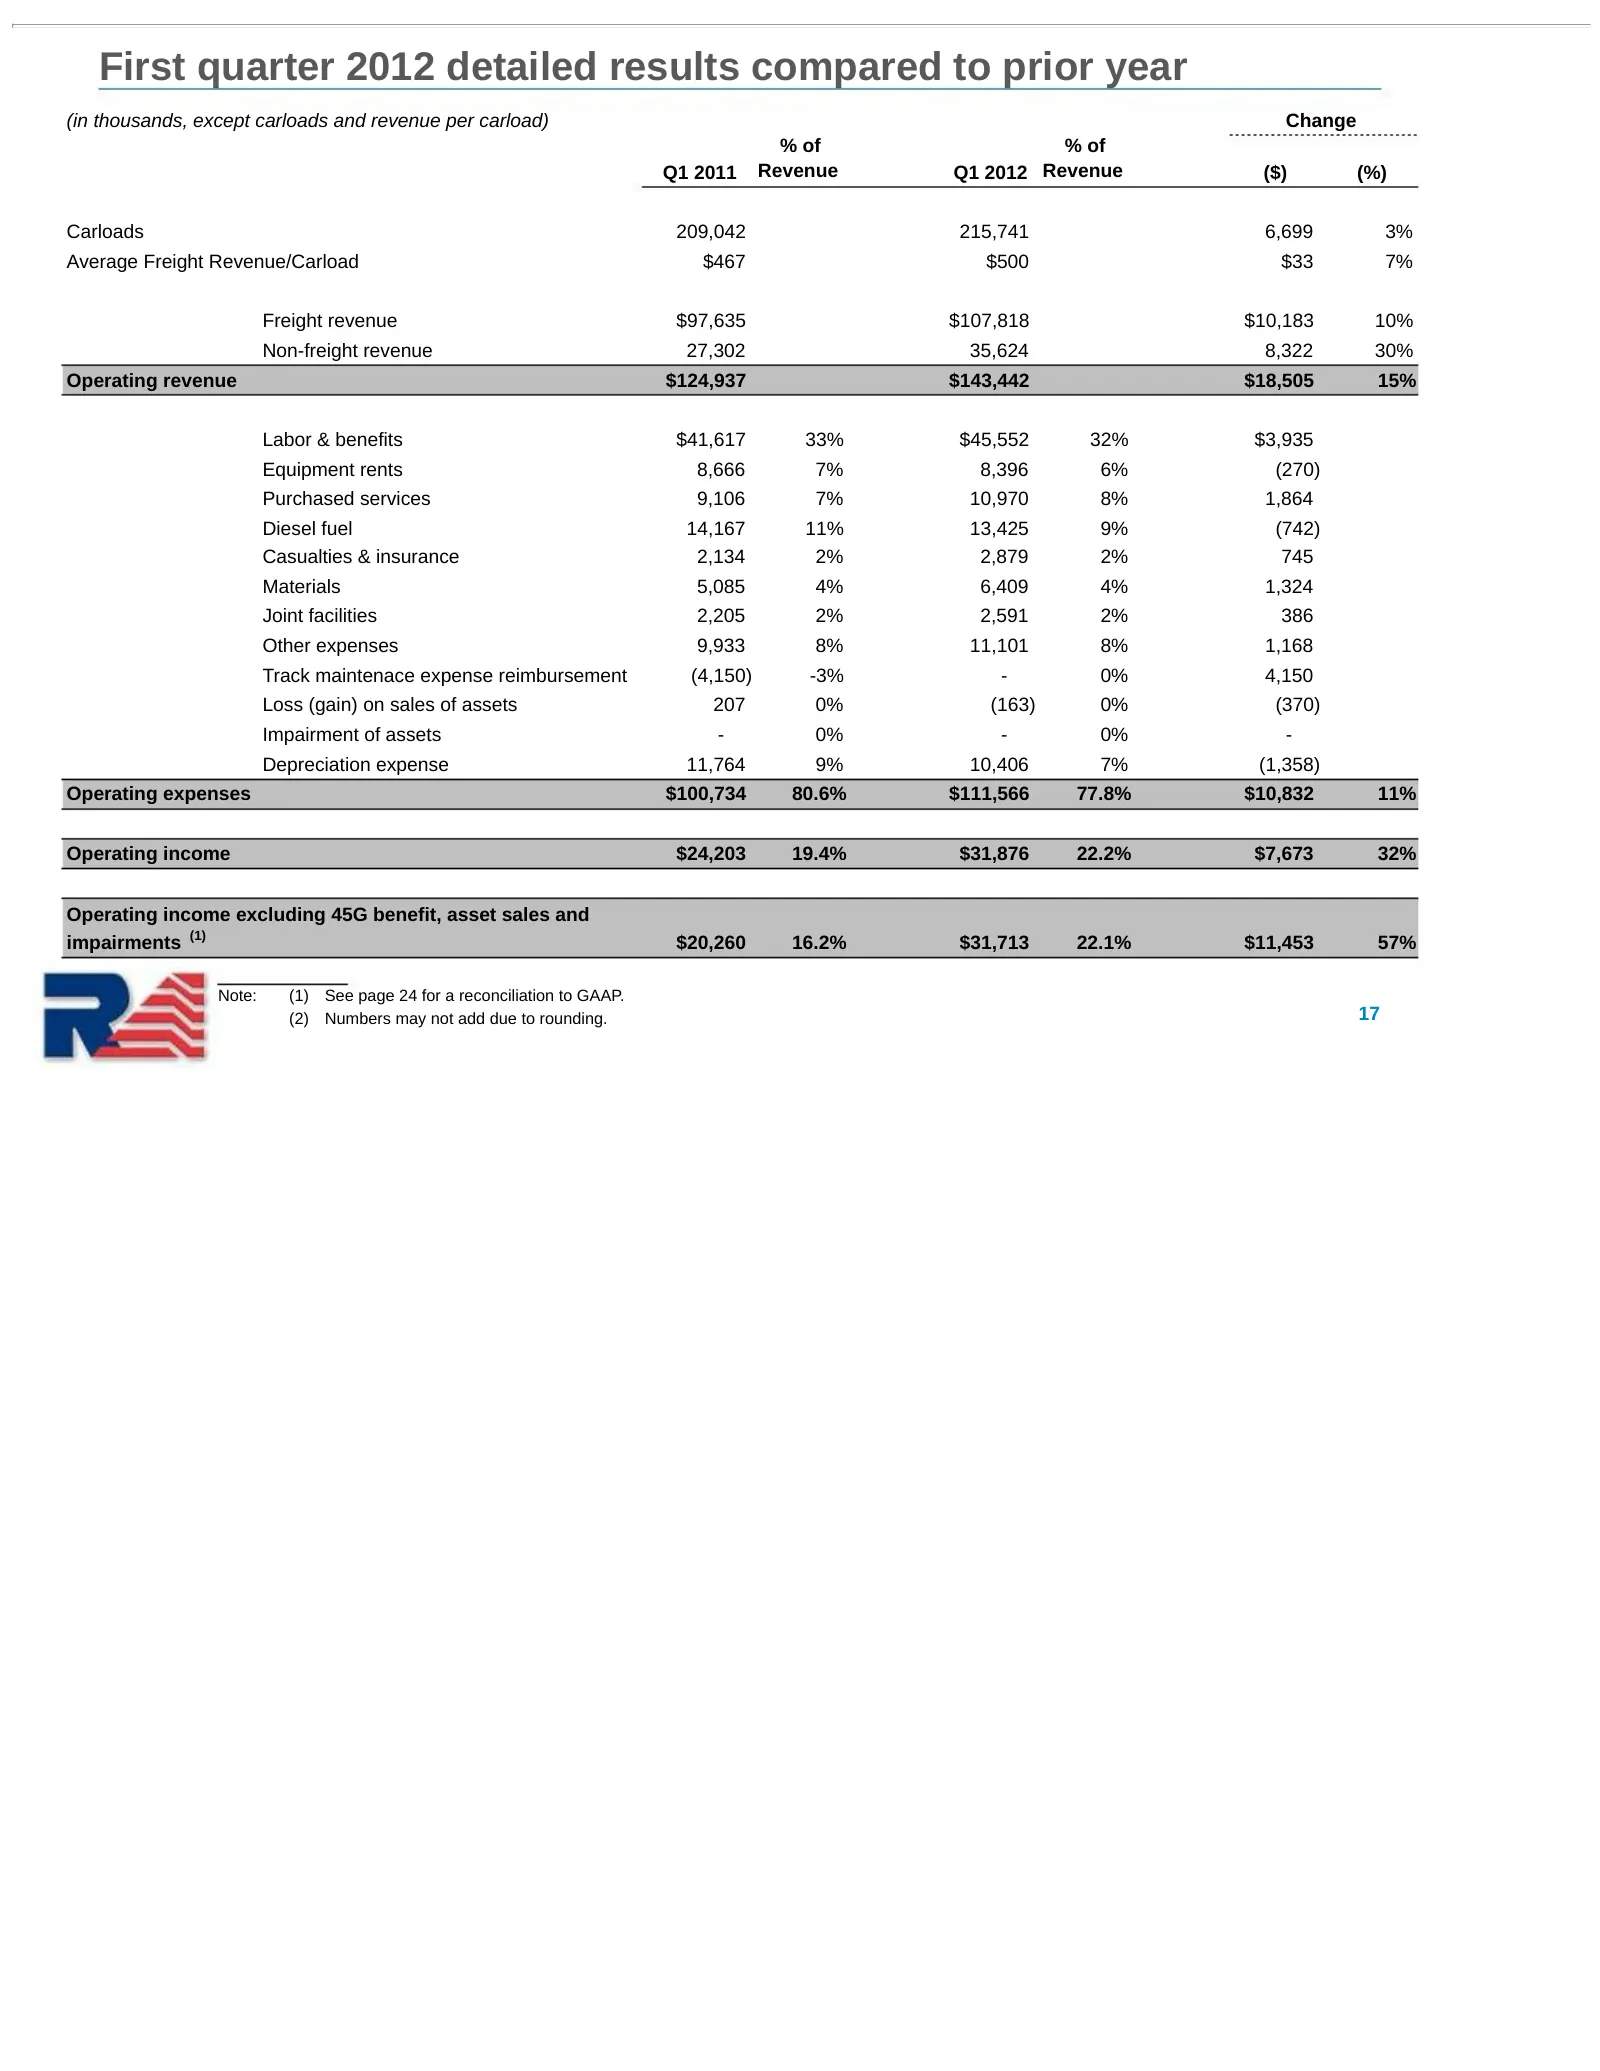
Slide 17: First quarter 2012 detailed results compared to prior year
First quarter 2012 detailed results compared to prior year (in thousands, except carloads and revenue per carload) Change % of % of Q1 2011 Revenue Q1 2012 Revenue ($) (%) Carloads 209,042 215,741 6,699 3% Average Freight Revenue/Carload $467 $500 $33 7% Freight revenue $97,635 $107,818 $10,183 10%
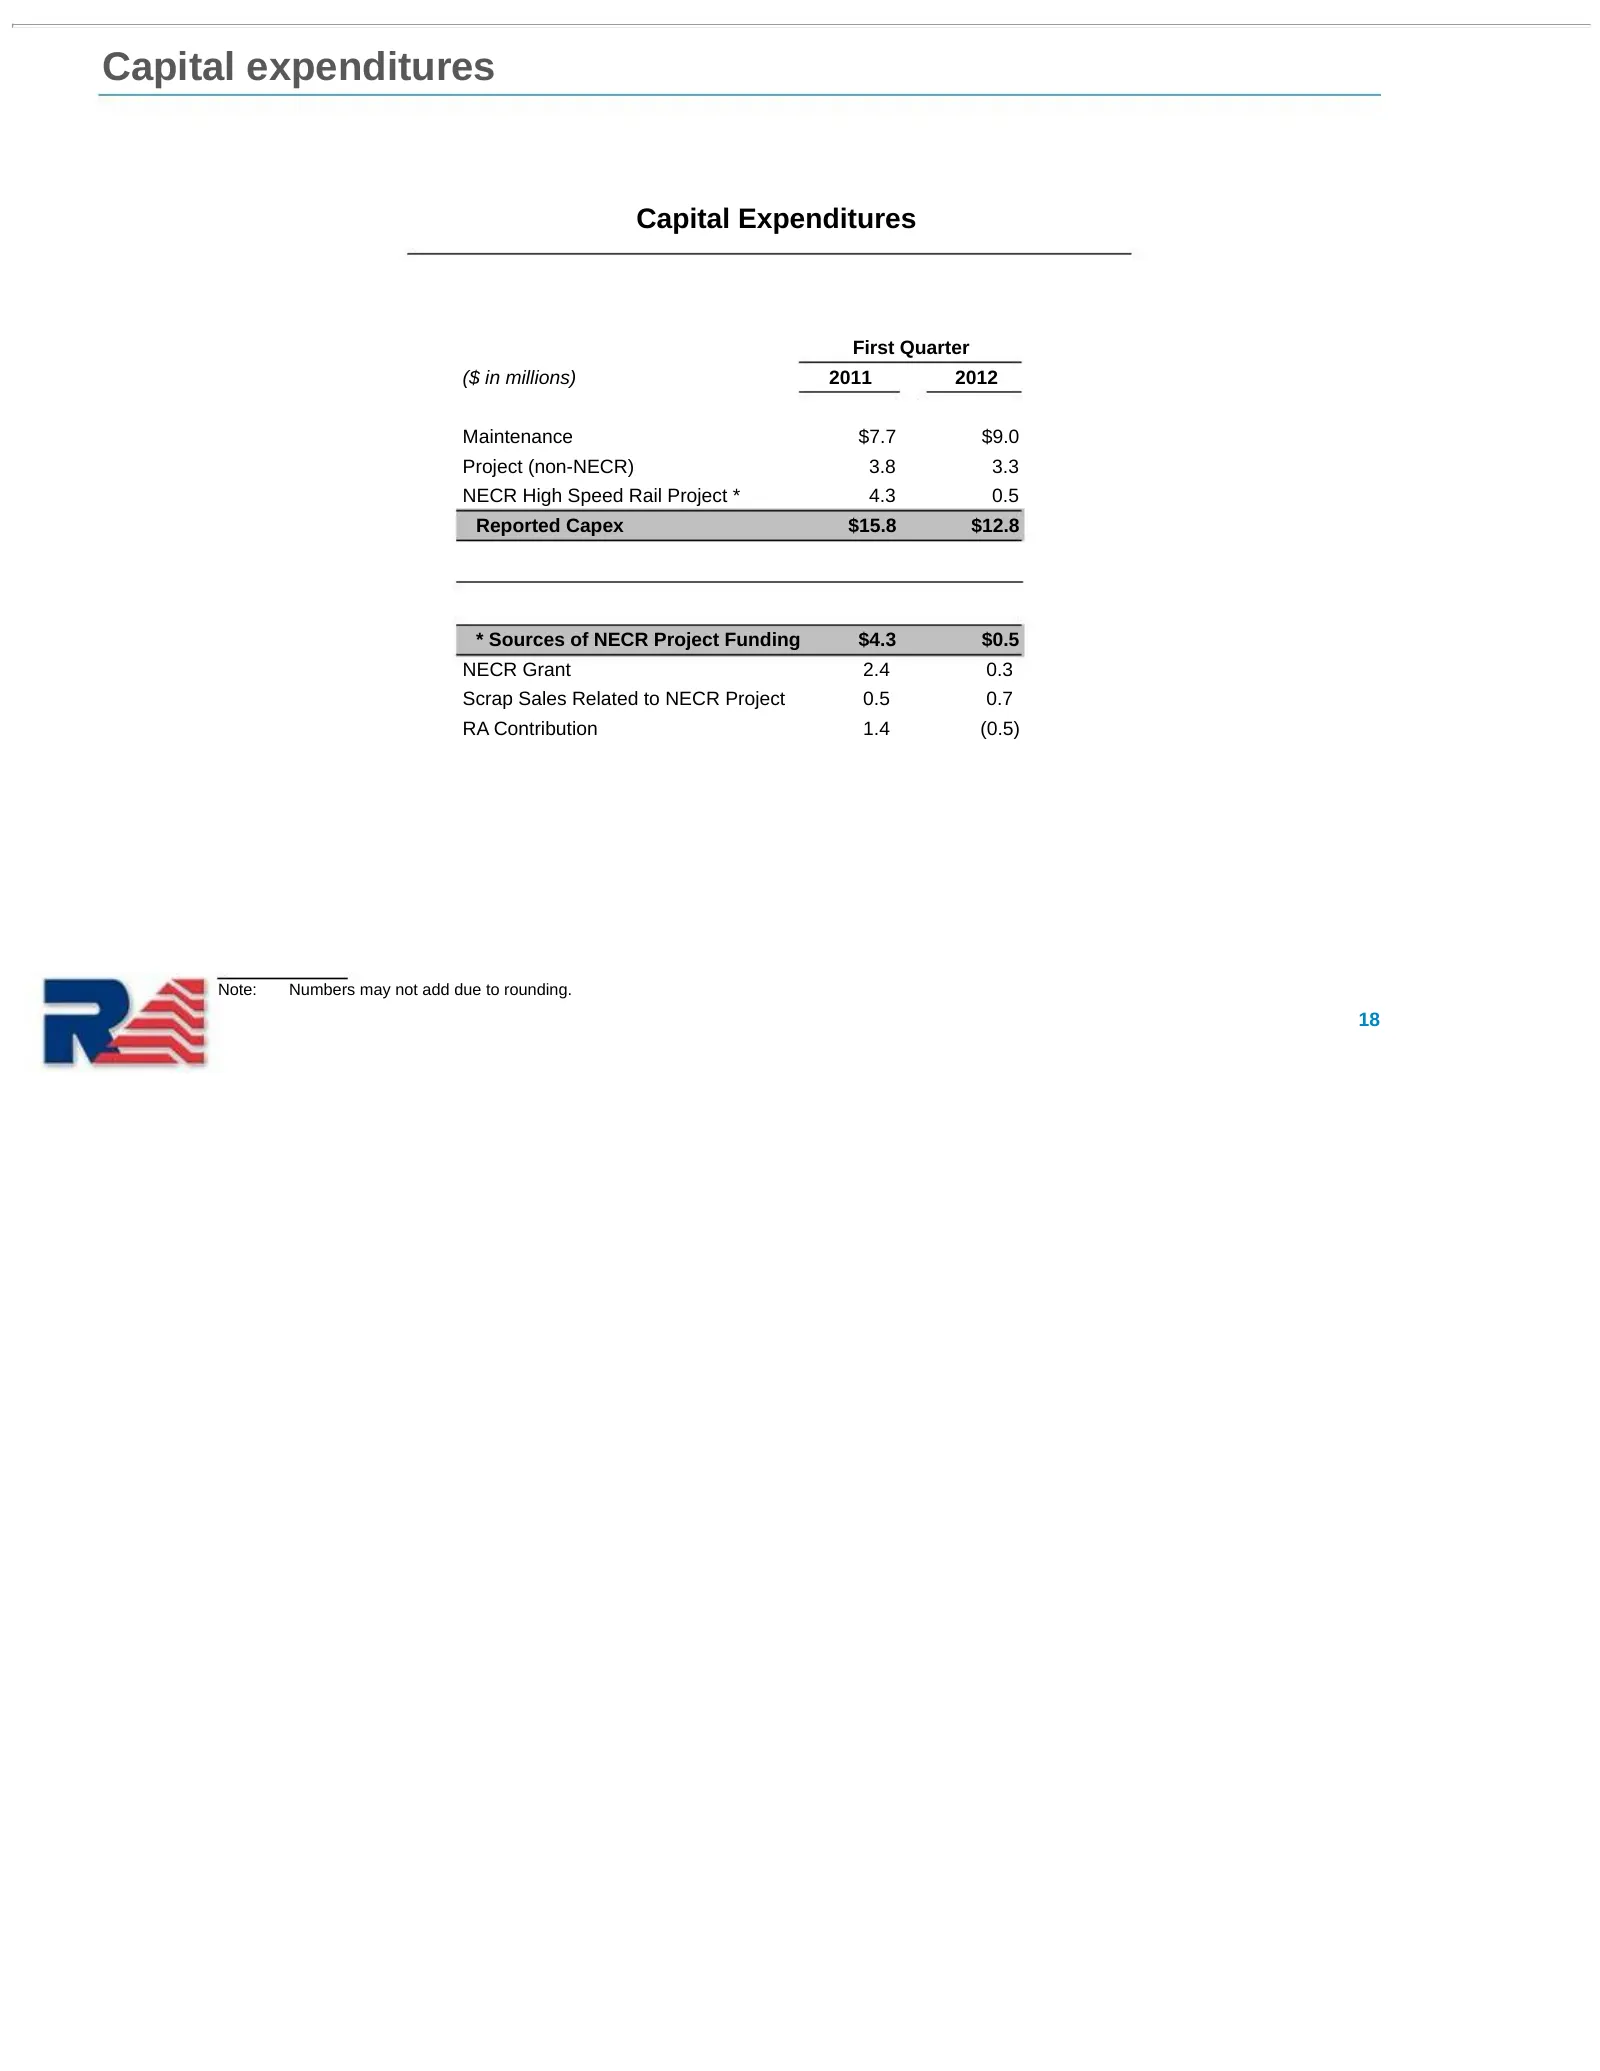
Slide 18: Capital expenditures
Capital expenditures Capital Expenditures First Quarter ($ in millions) 2011 2012 Maintenance $7.7 $9.0 Project (non-NECR) 3.8 3.3 NECR High Speed Rail Project * 4.3 0.5 Reported Capex $15.8 $12.8 * Sources of NECR Project Funding $4.3 $0.5 NECR Grant 2.4 0.3 Scrap Sales Related to NECR Project 0.5
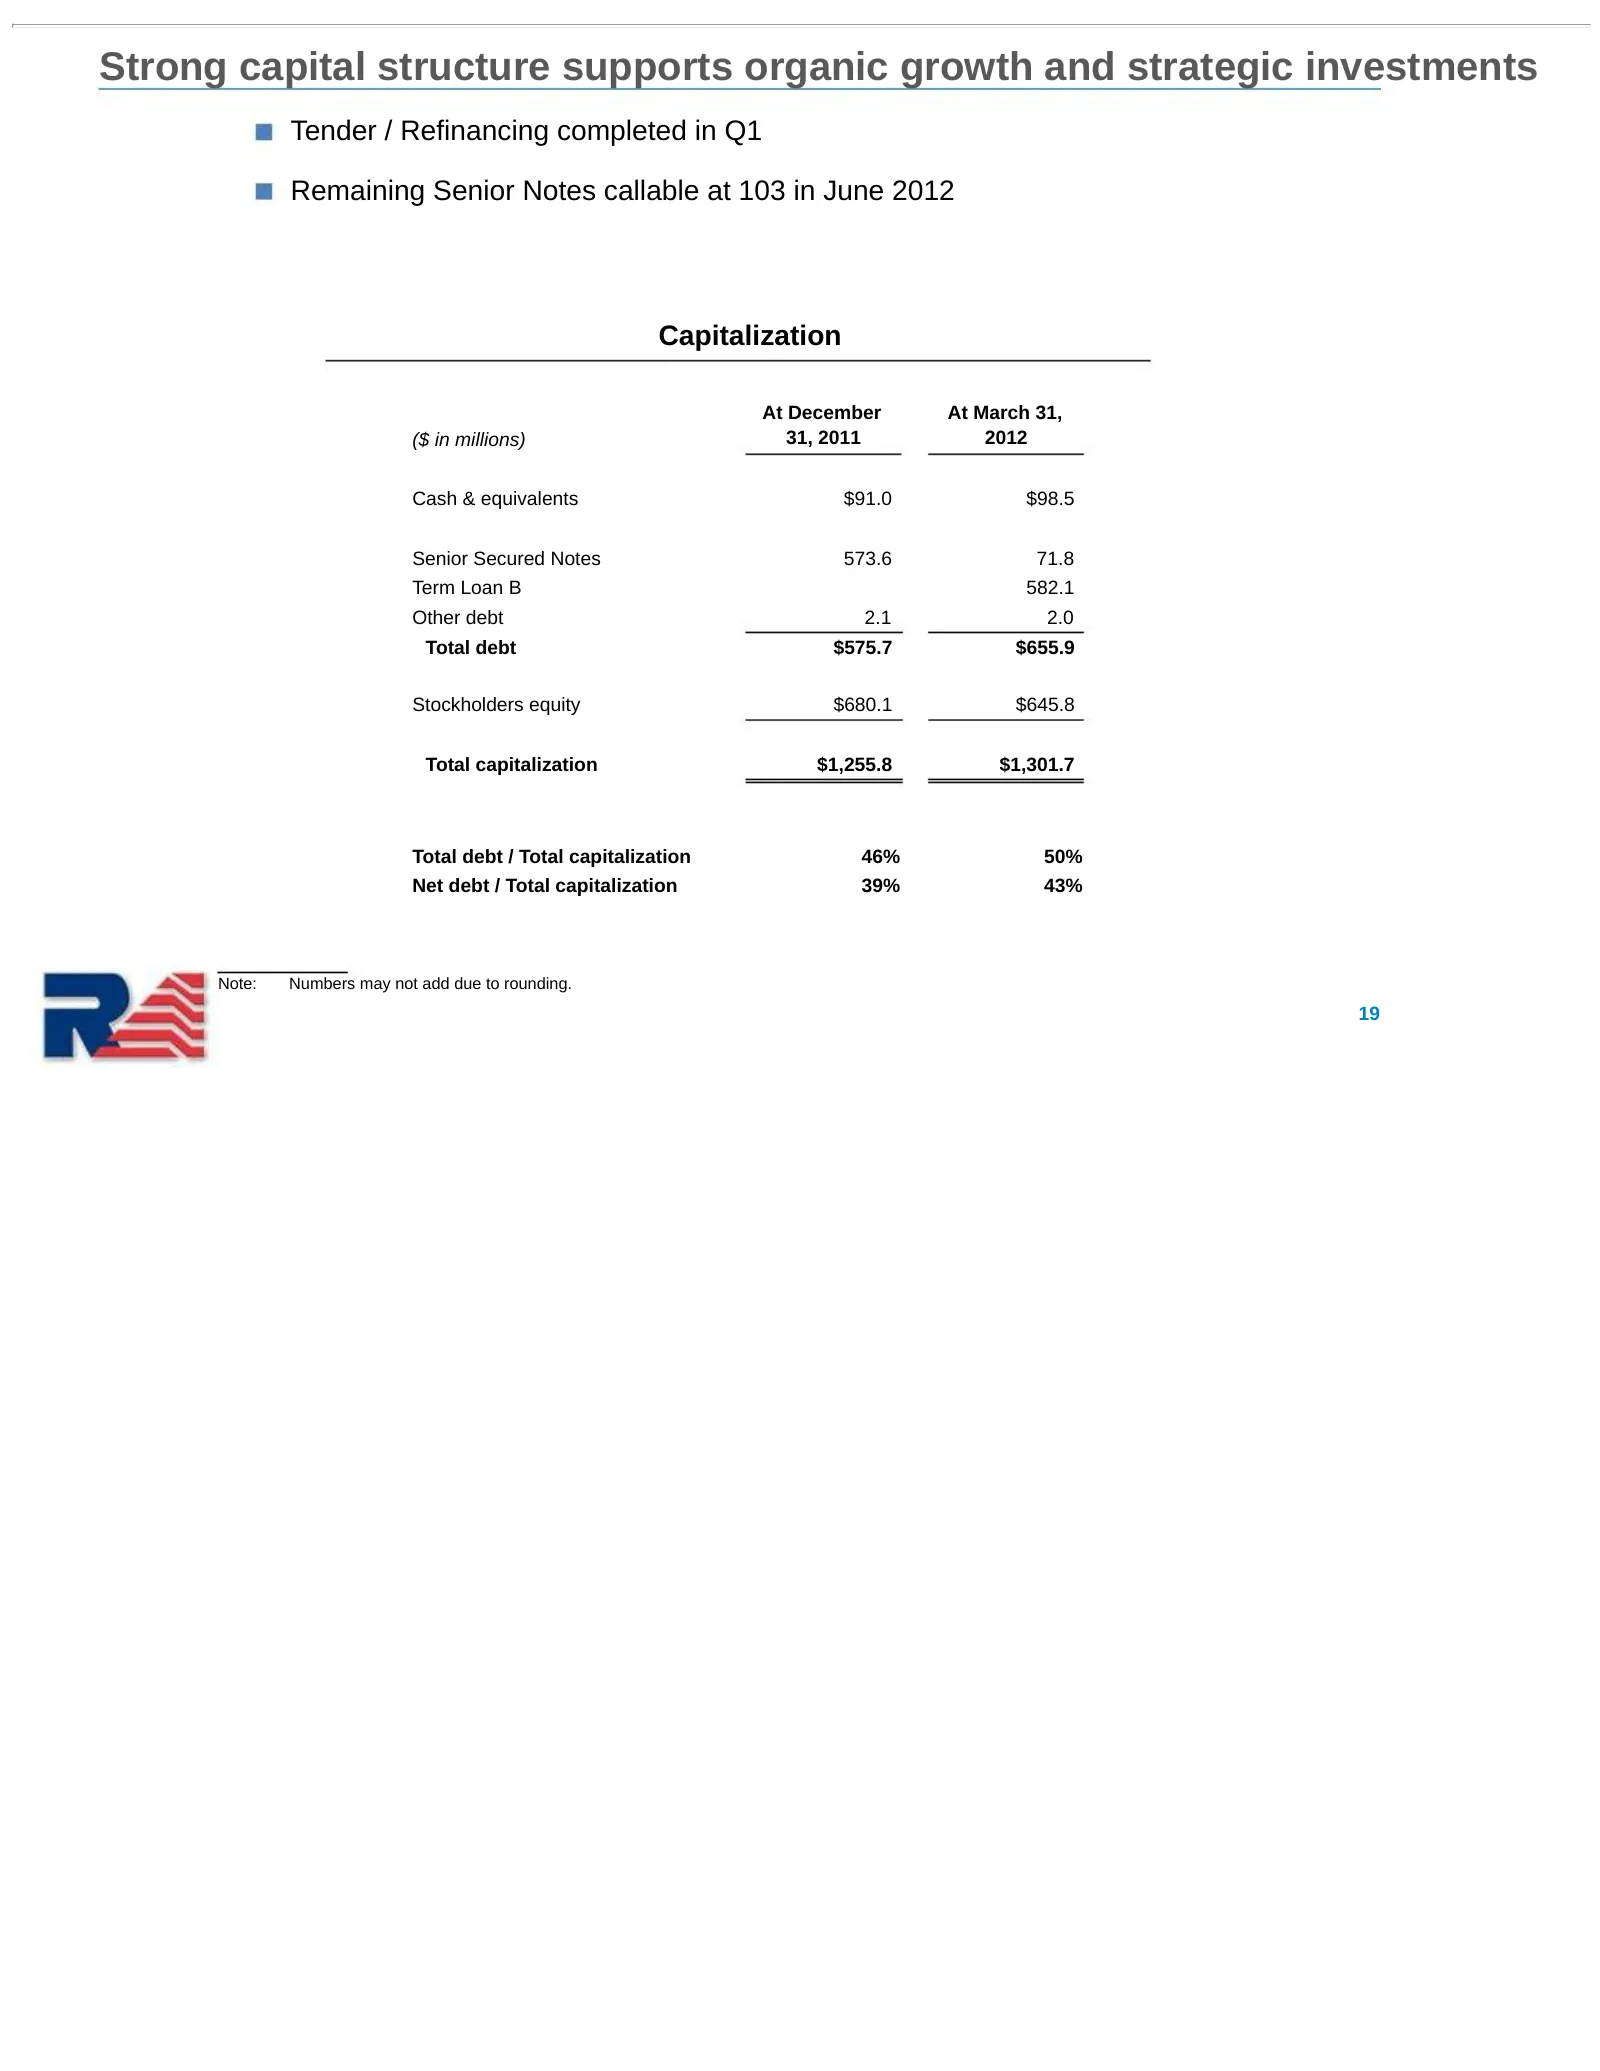
Slide 19: Strong capital structure supports organic growth and strategic investments
Strong capital structure supports organic growth and strategic investments Tender / Refinancing completed in Q1 Remaining Senior Notes callable at 103 in June 2012 Capitalization At December At March 31, ($ in millions) 31, 2011 2012 Cash & equivalents $91.0 $98.5 Senior Secured Notes 573.6 71.8 Ter
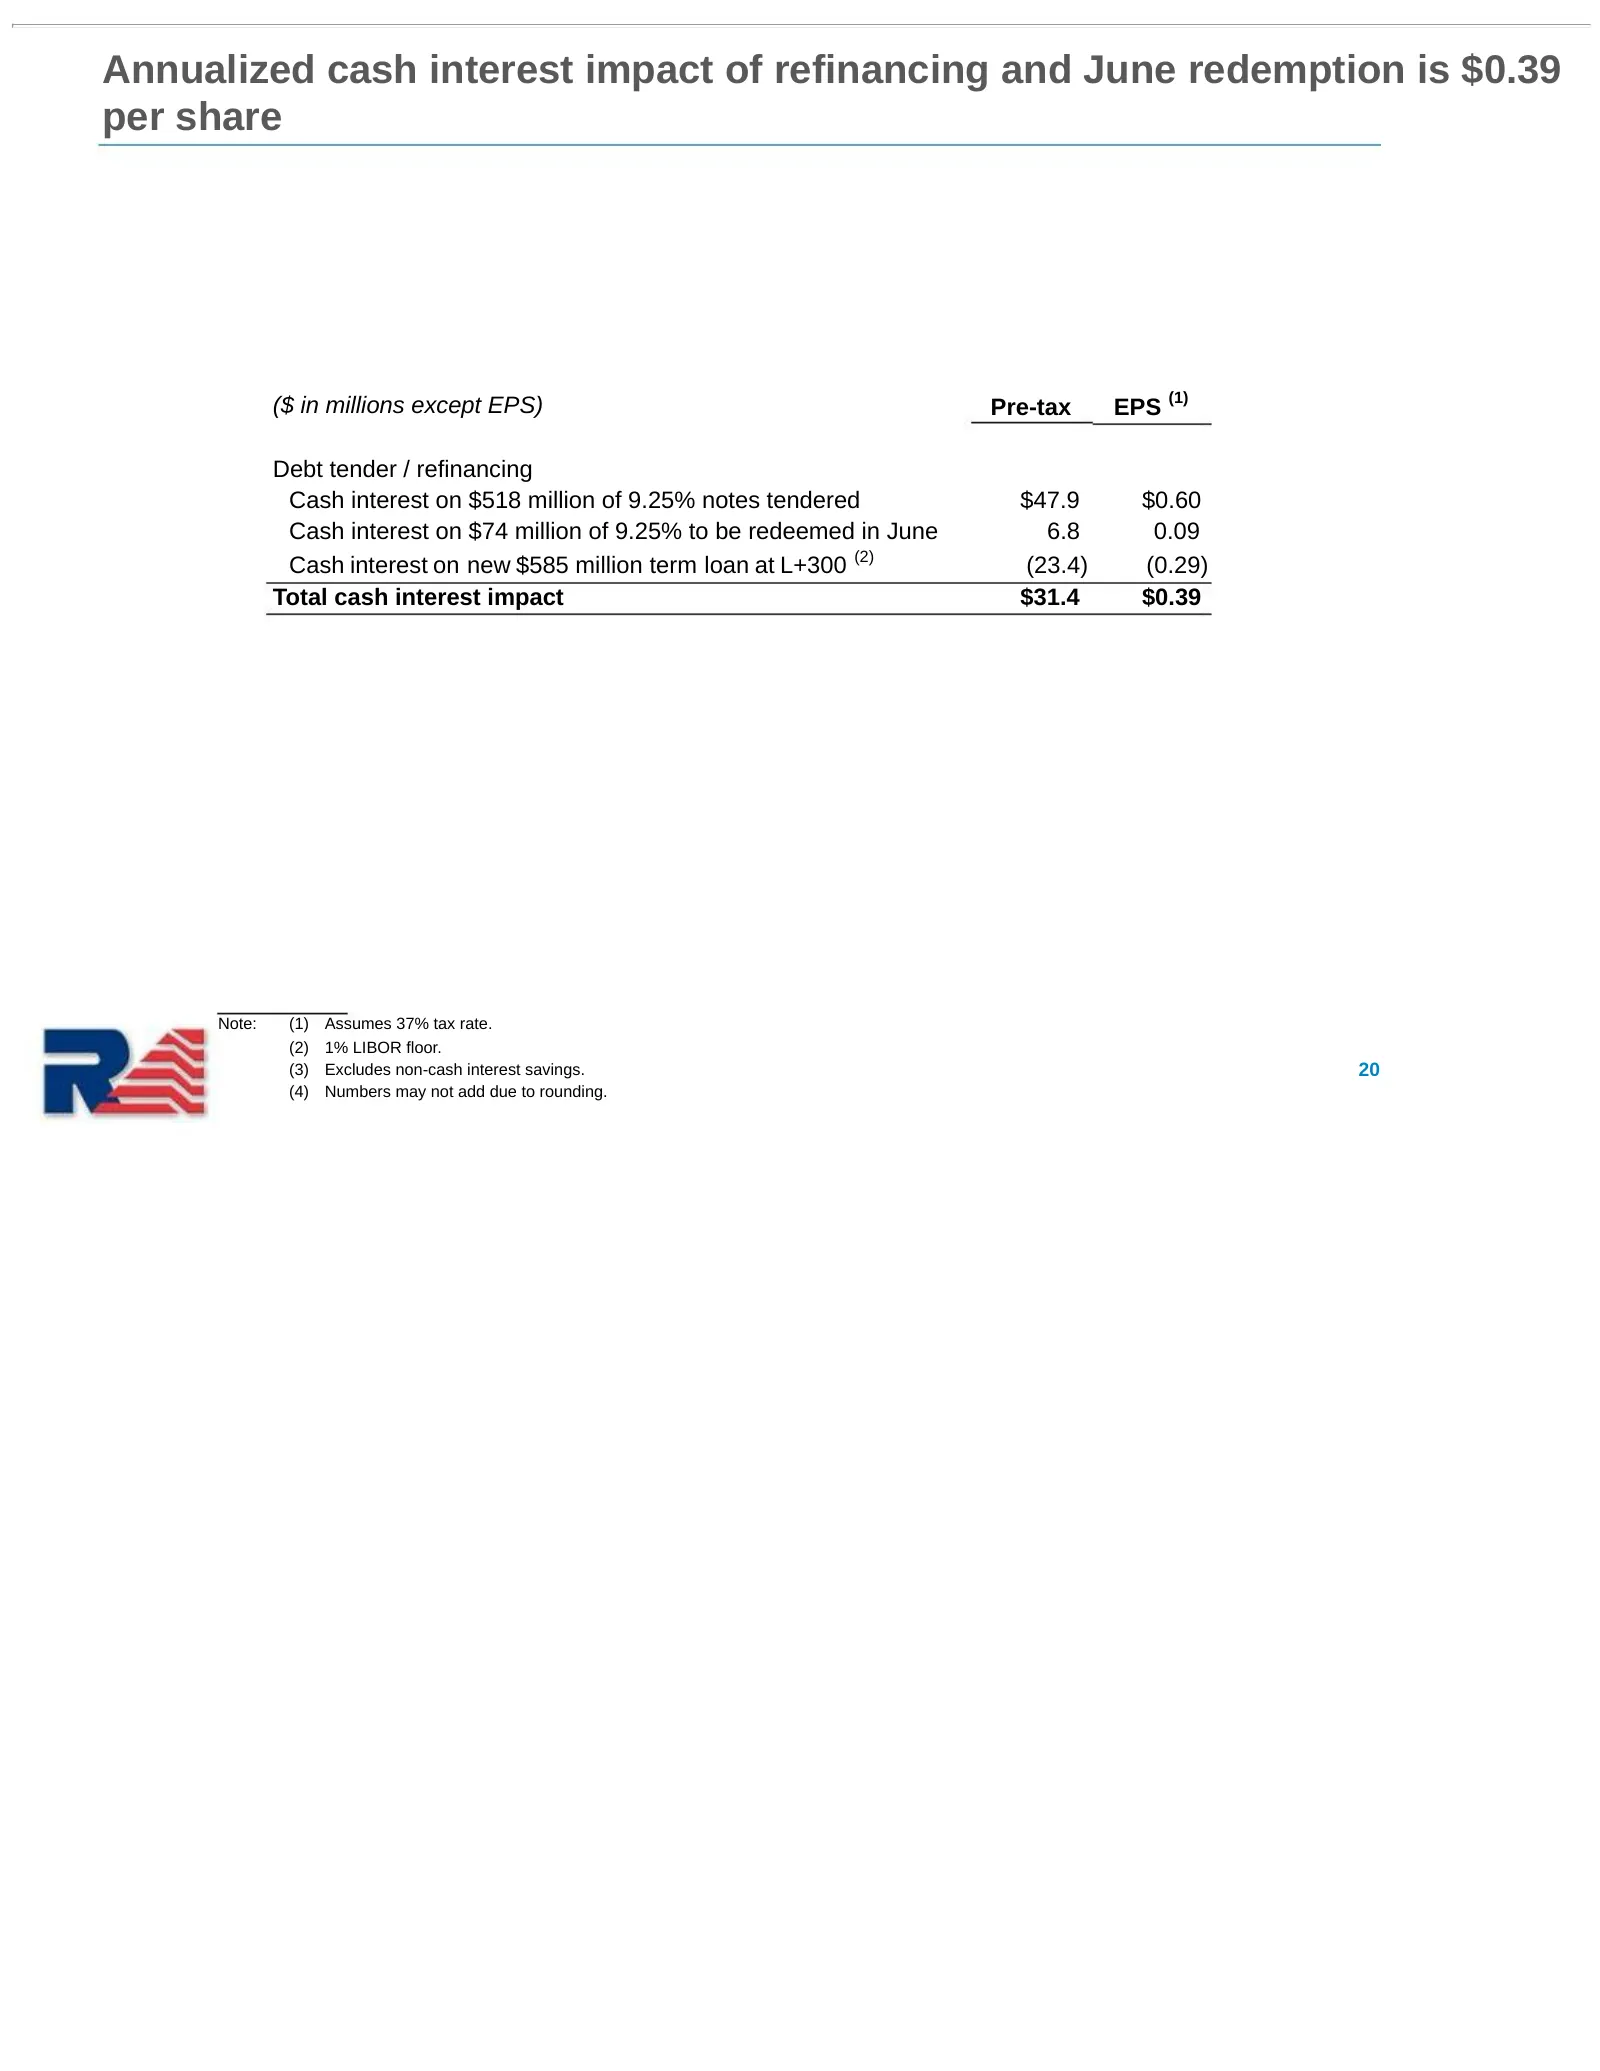
Slide 20: Annualized cash interest impact of refinancing and June redemption is $0.39 per share
Annualized cash interest impact of refinancing and June redemption is $0.39 per share ($ in millions except EPS) Pre-tax EPS (1) Debt tender / refinancing Cash interest on $518 million of 9.25% notes tendered $47.9 $0.60 Cash interest on $74 million of 9.25% to be redeemed in June 6.8 0.09 Cash inte
Slide 21: Q2 and Full Year Estimates
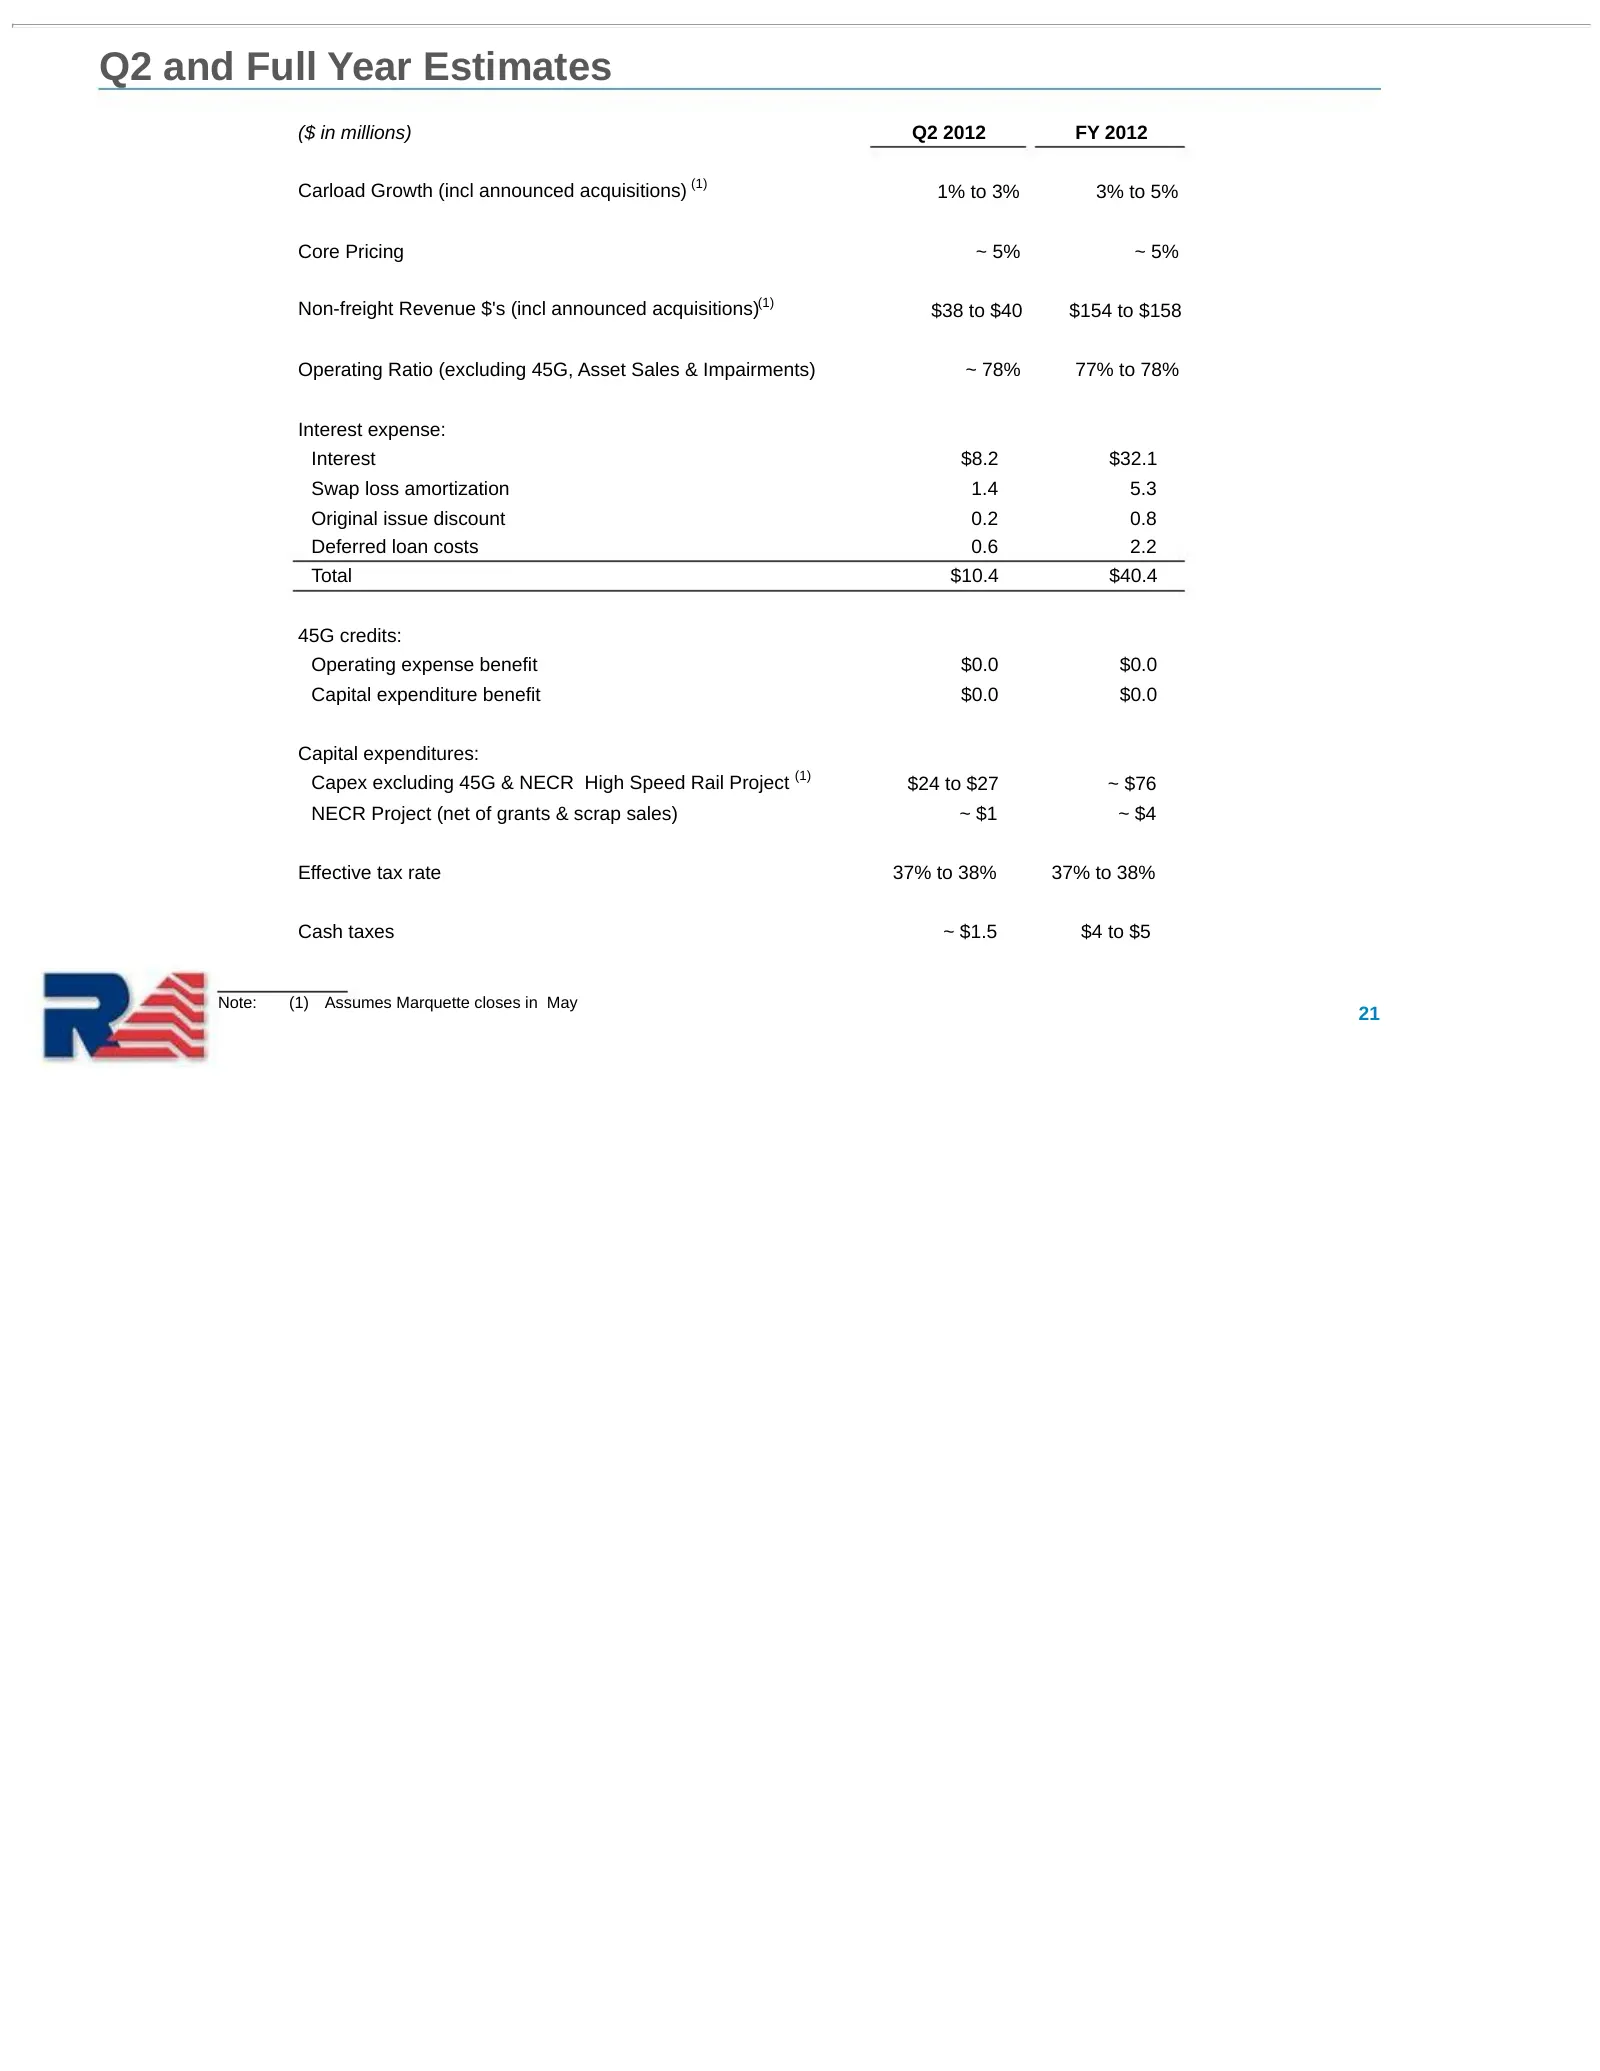
Q2 and Full Year Estimates ($ in millions) Q2 2012 FY 2012 Carload Growth (incl announced acquisitions) (1) 1% to 3% 3% to 5% Core Pricing ~ 5% ~ 5% Non-freight Revenue $'s (incl announced acquisitions)(1) $38 to $40 $154 to $158 Operating Ratio (excluding 45G, Asset Sales & Impairments) ~ 78% 77% t

Slide 22: 22
22
Slide 23: Appendix
Appendix 23
Slide 24: Operating Income and Operating Ratio Excluding 45G Benefit Reconciliation to GAAP
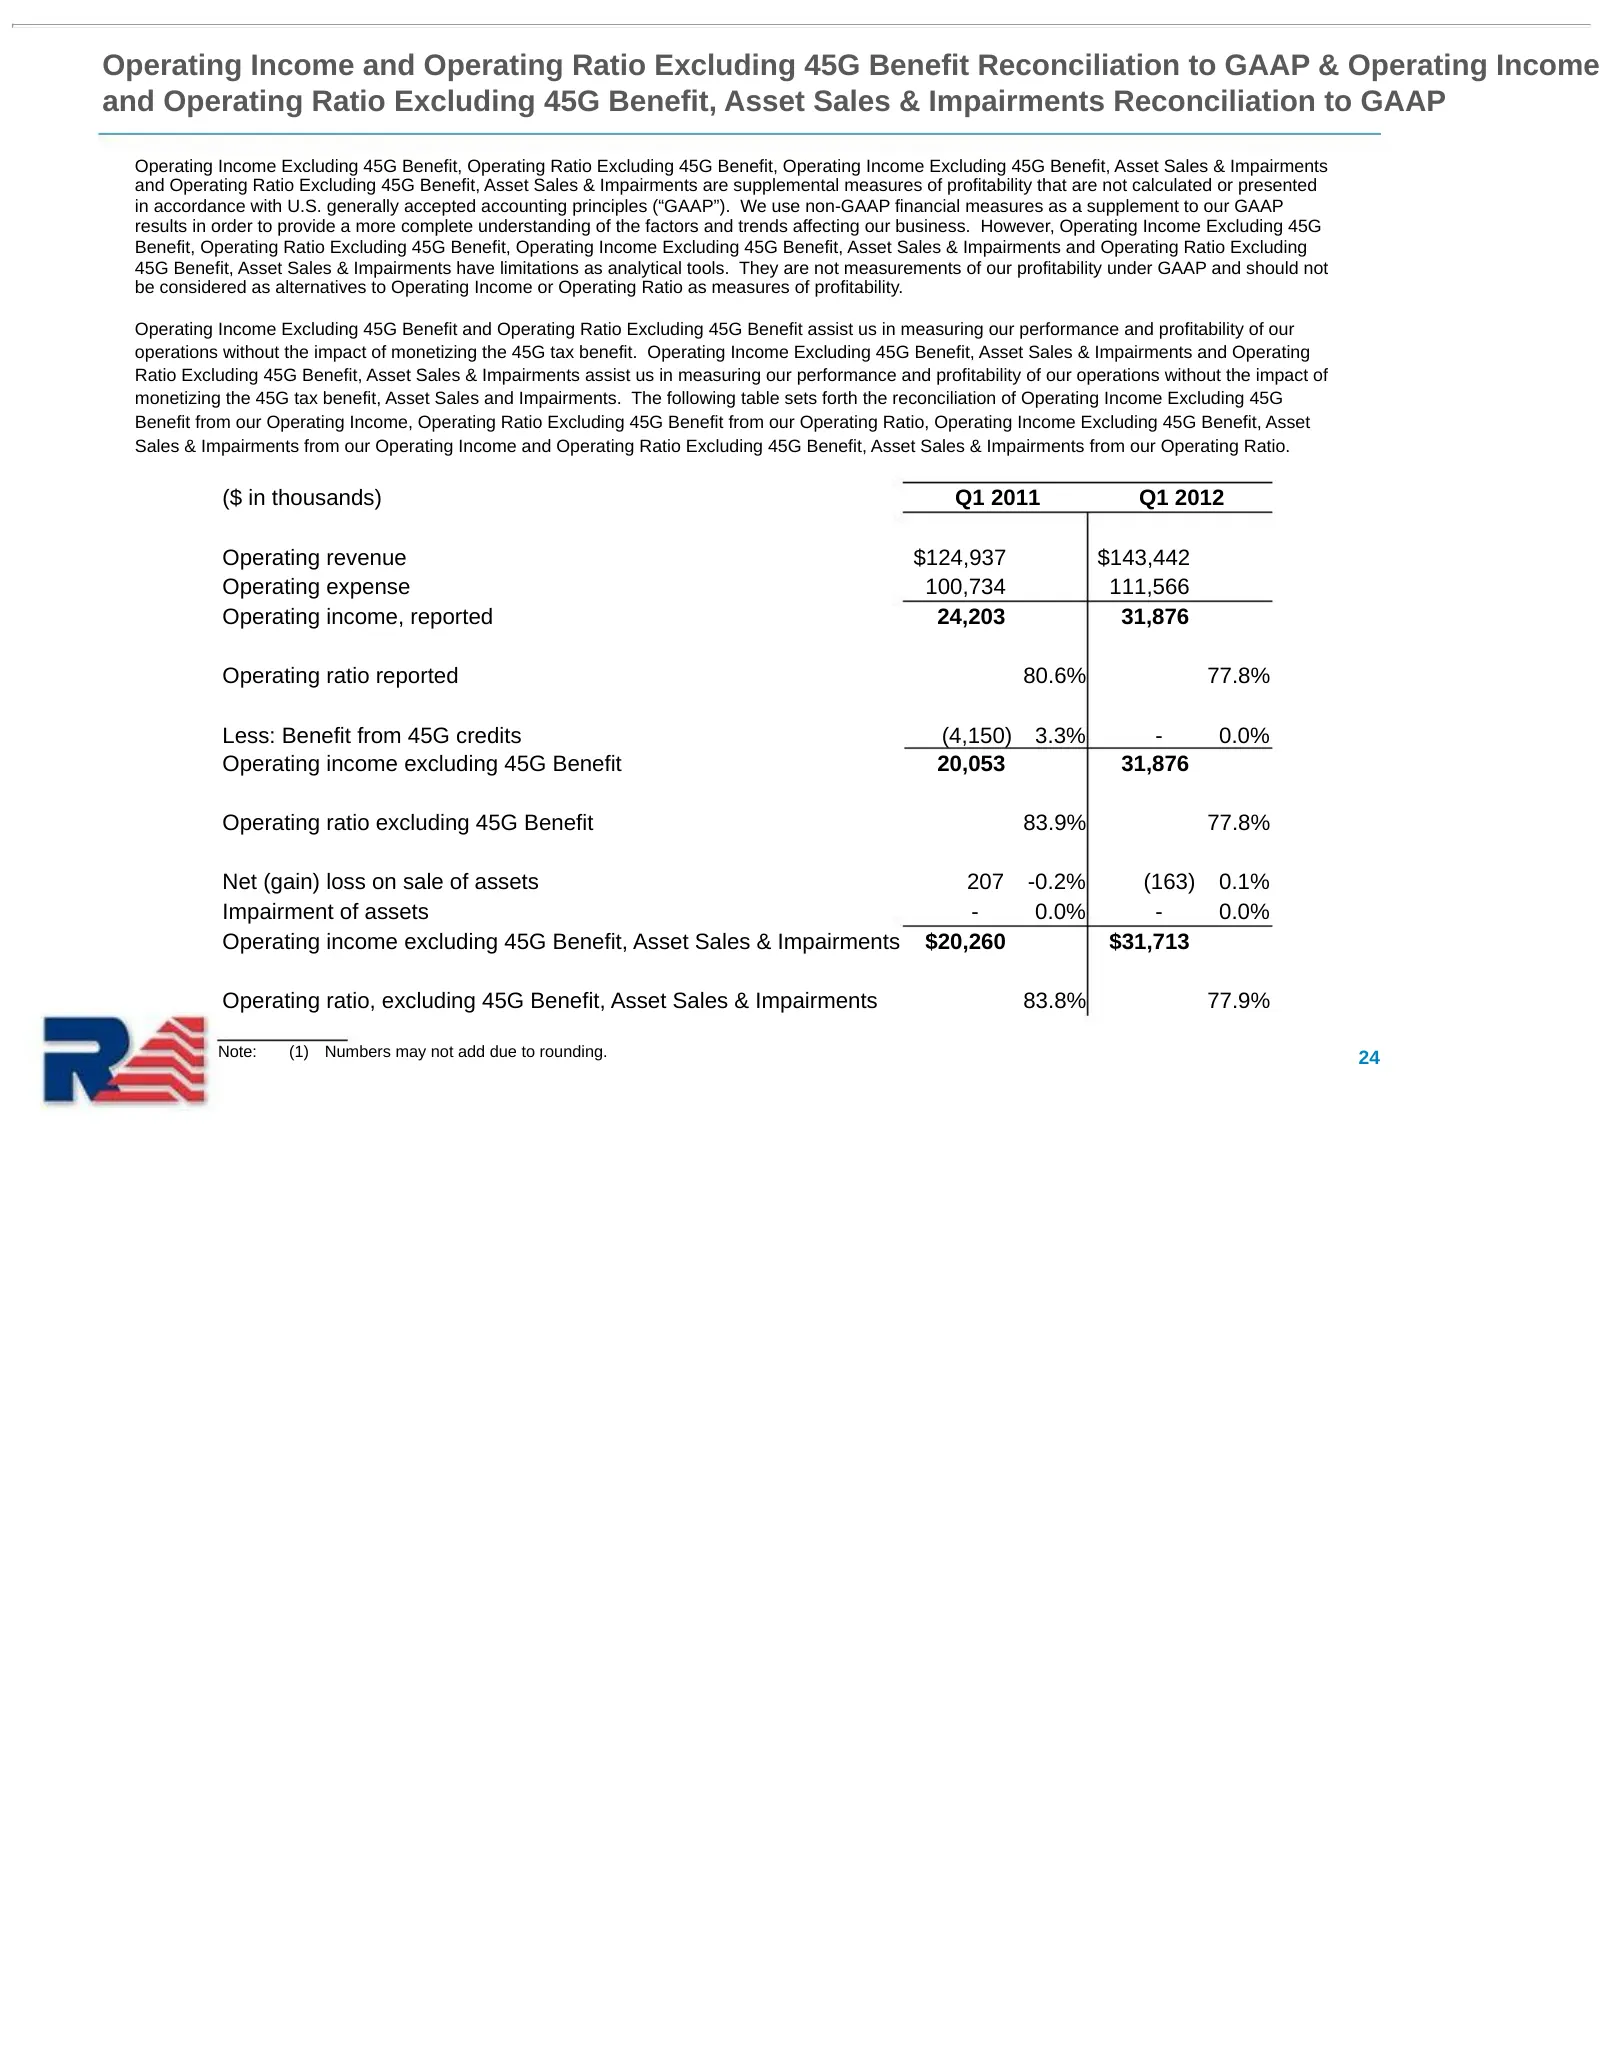
Operating Income and Operating Ratio Excluding 45G Benefit Reconciliation to GAAP & Operating Income and Operating Ratio Excluding 45G Benefit, Asset Sales & Impairments Reconciliation to GAAP Operating Income Excluding 45G Benefit, Operating Ratio Excluding 45G Benefit, Operating Income Excluding 4
Slide 25: Adjusted income from continuing operations reconciliation to GAAP
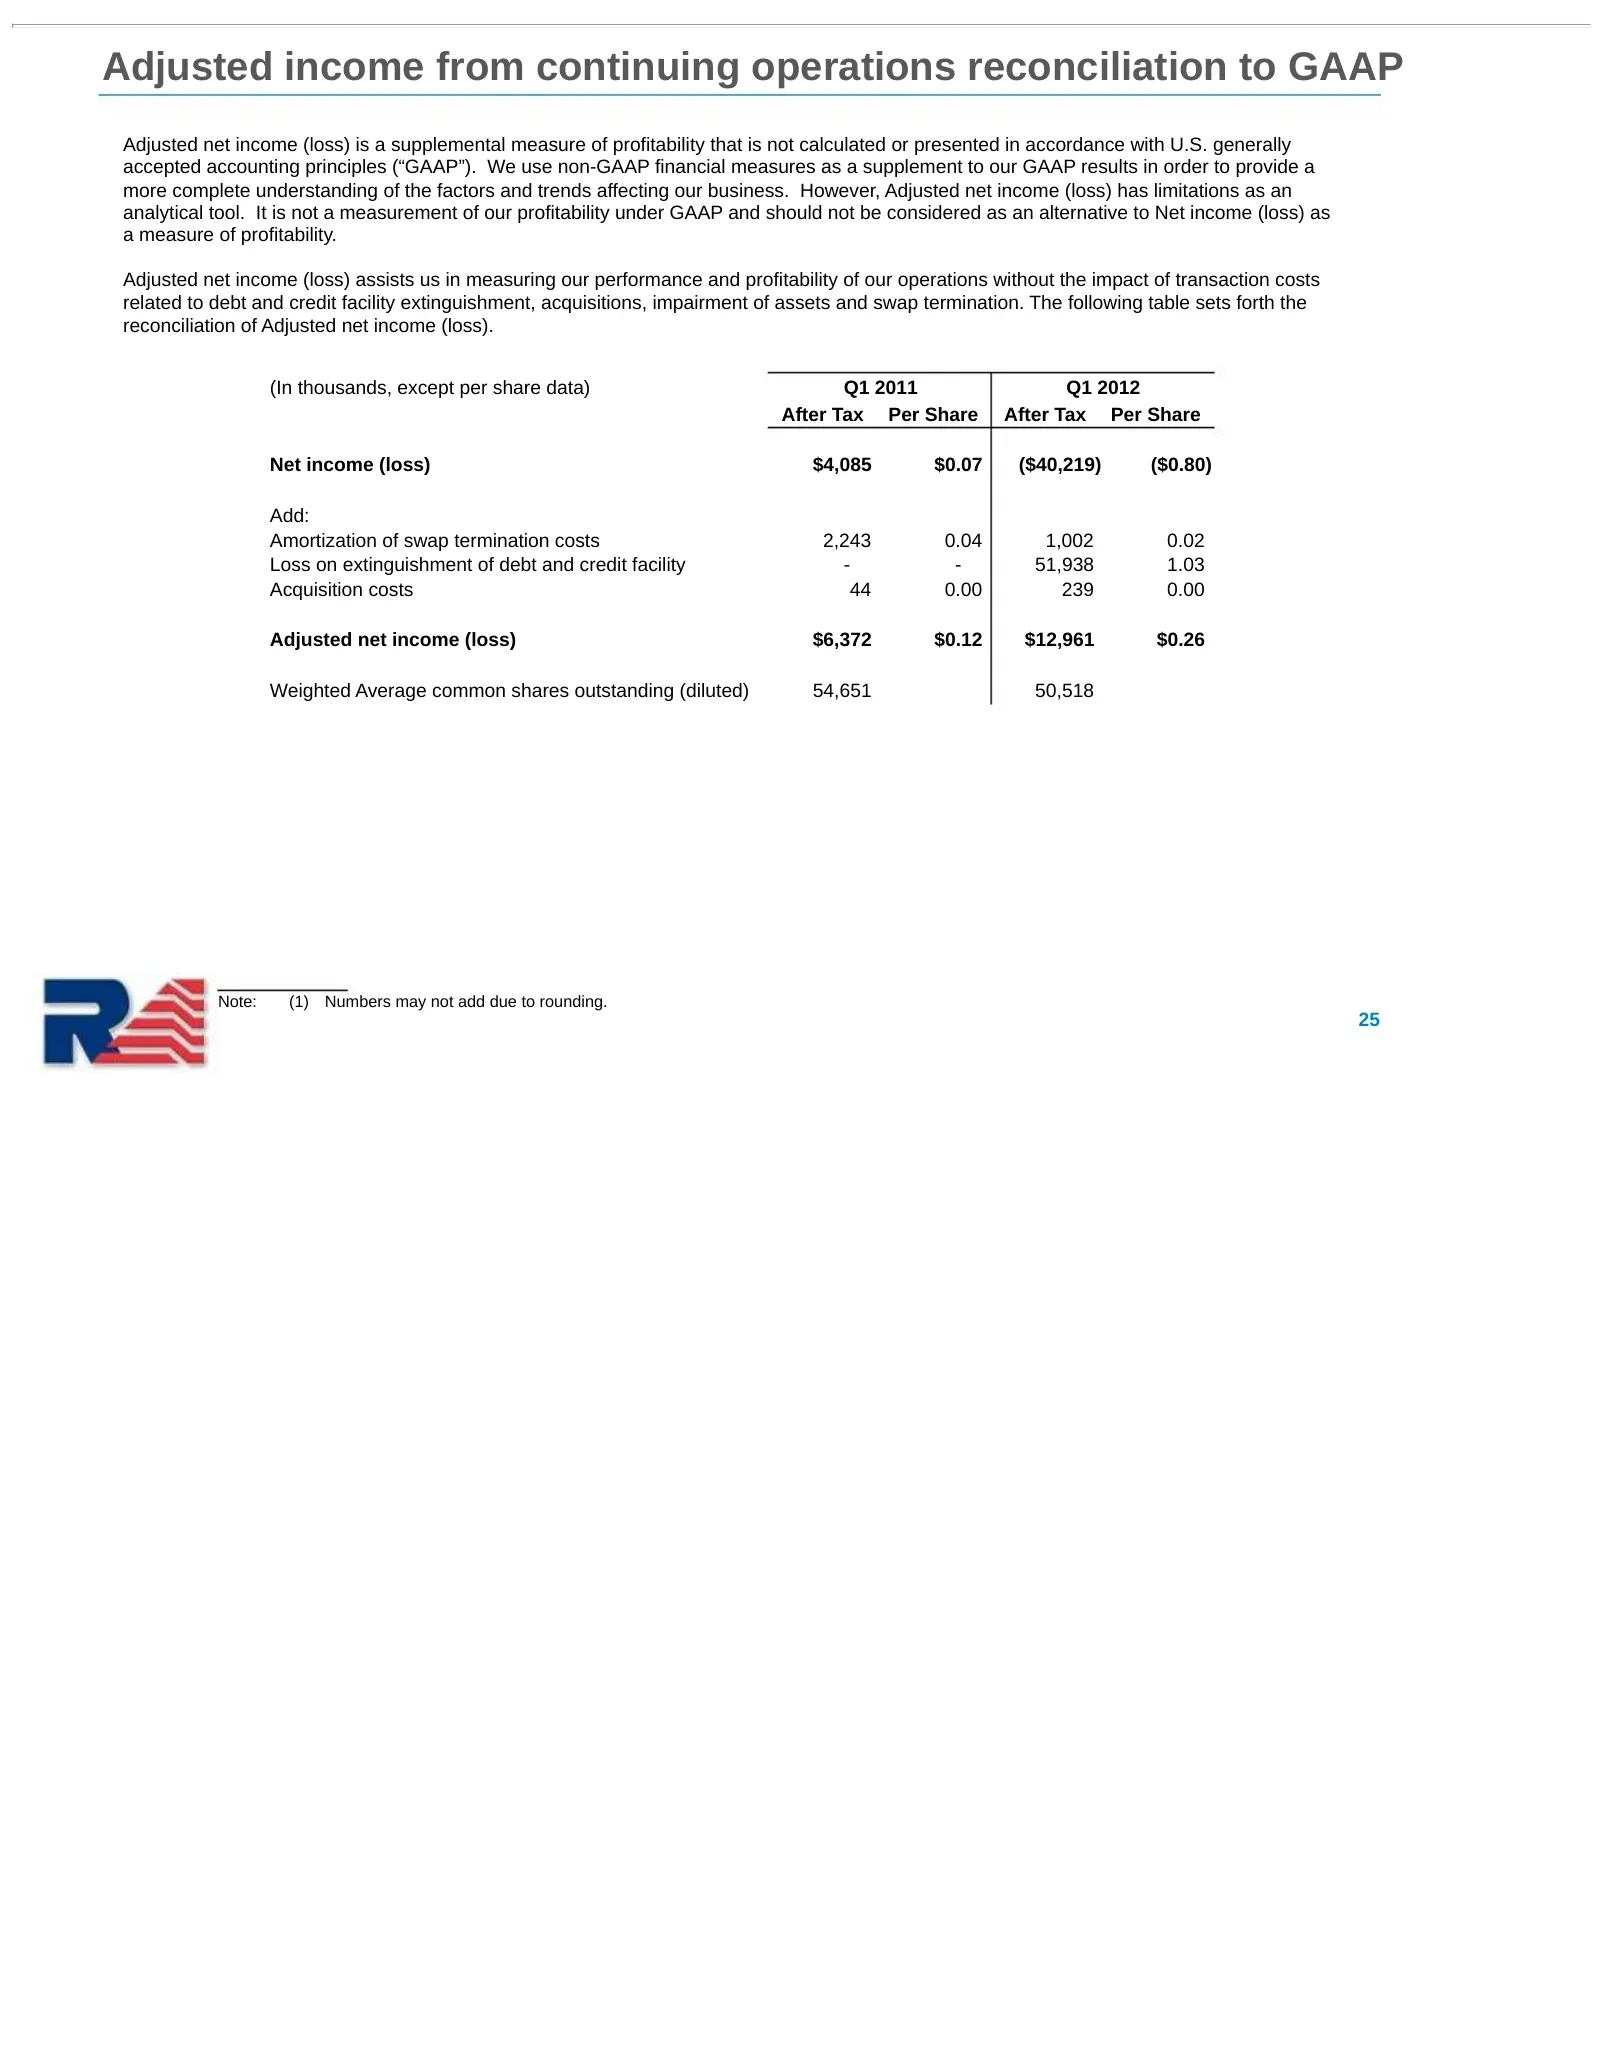
Adjusted income from continuing operations reconciliation to GAAP Adjusted net income (loss) is a supplemental measure of profitability that is not calculated or presented in accordance with U.S. generally accepted accounting principles (“GAAP”). We use non-GAAP financial measures as a supplement to
Slide 26: Adjusted EBITDA reconciliation to GAAP
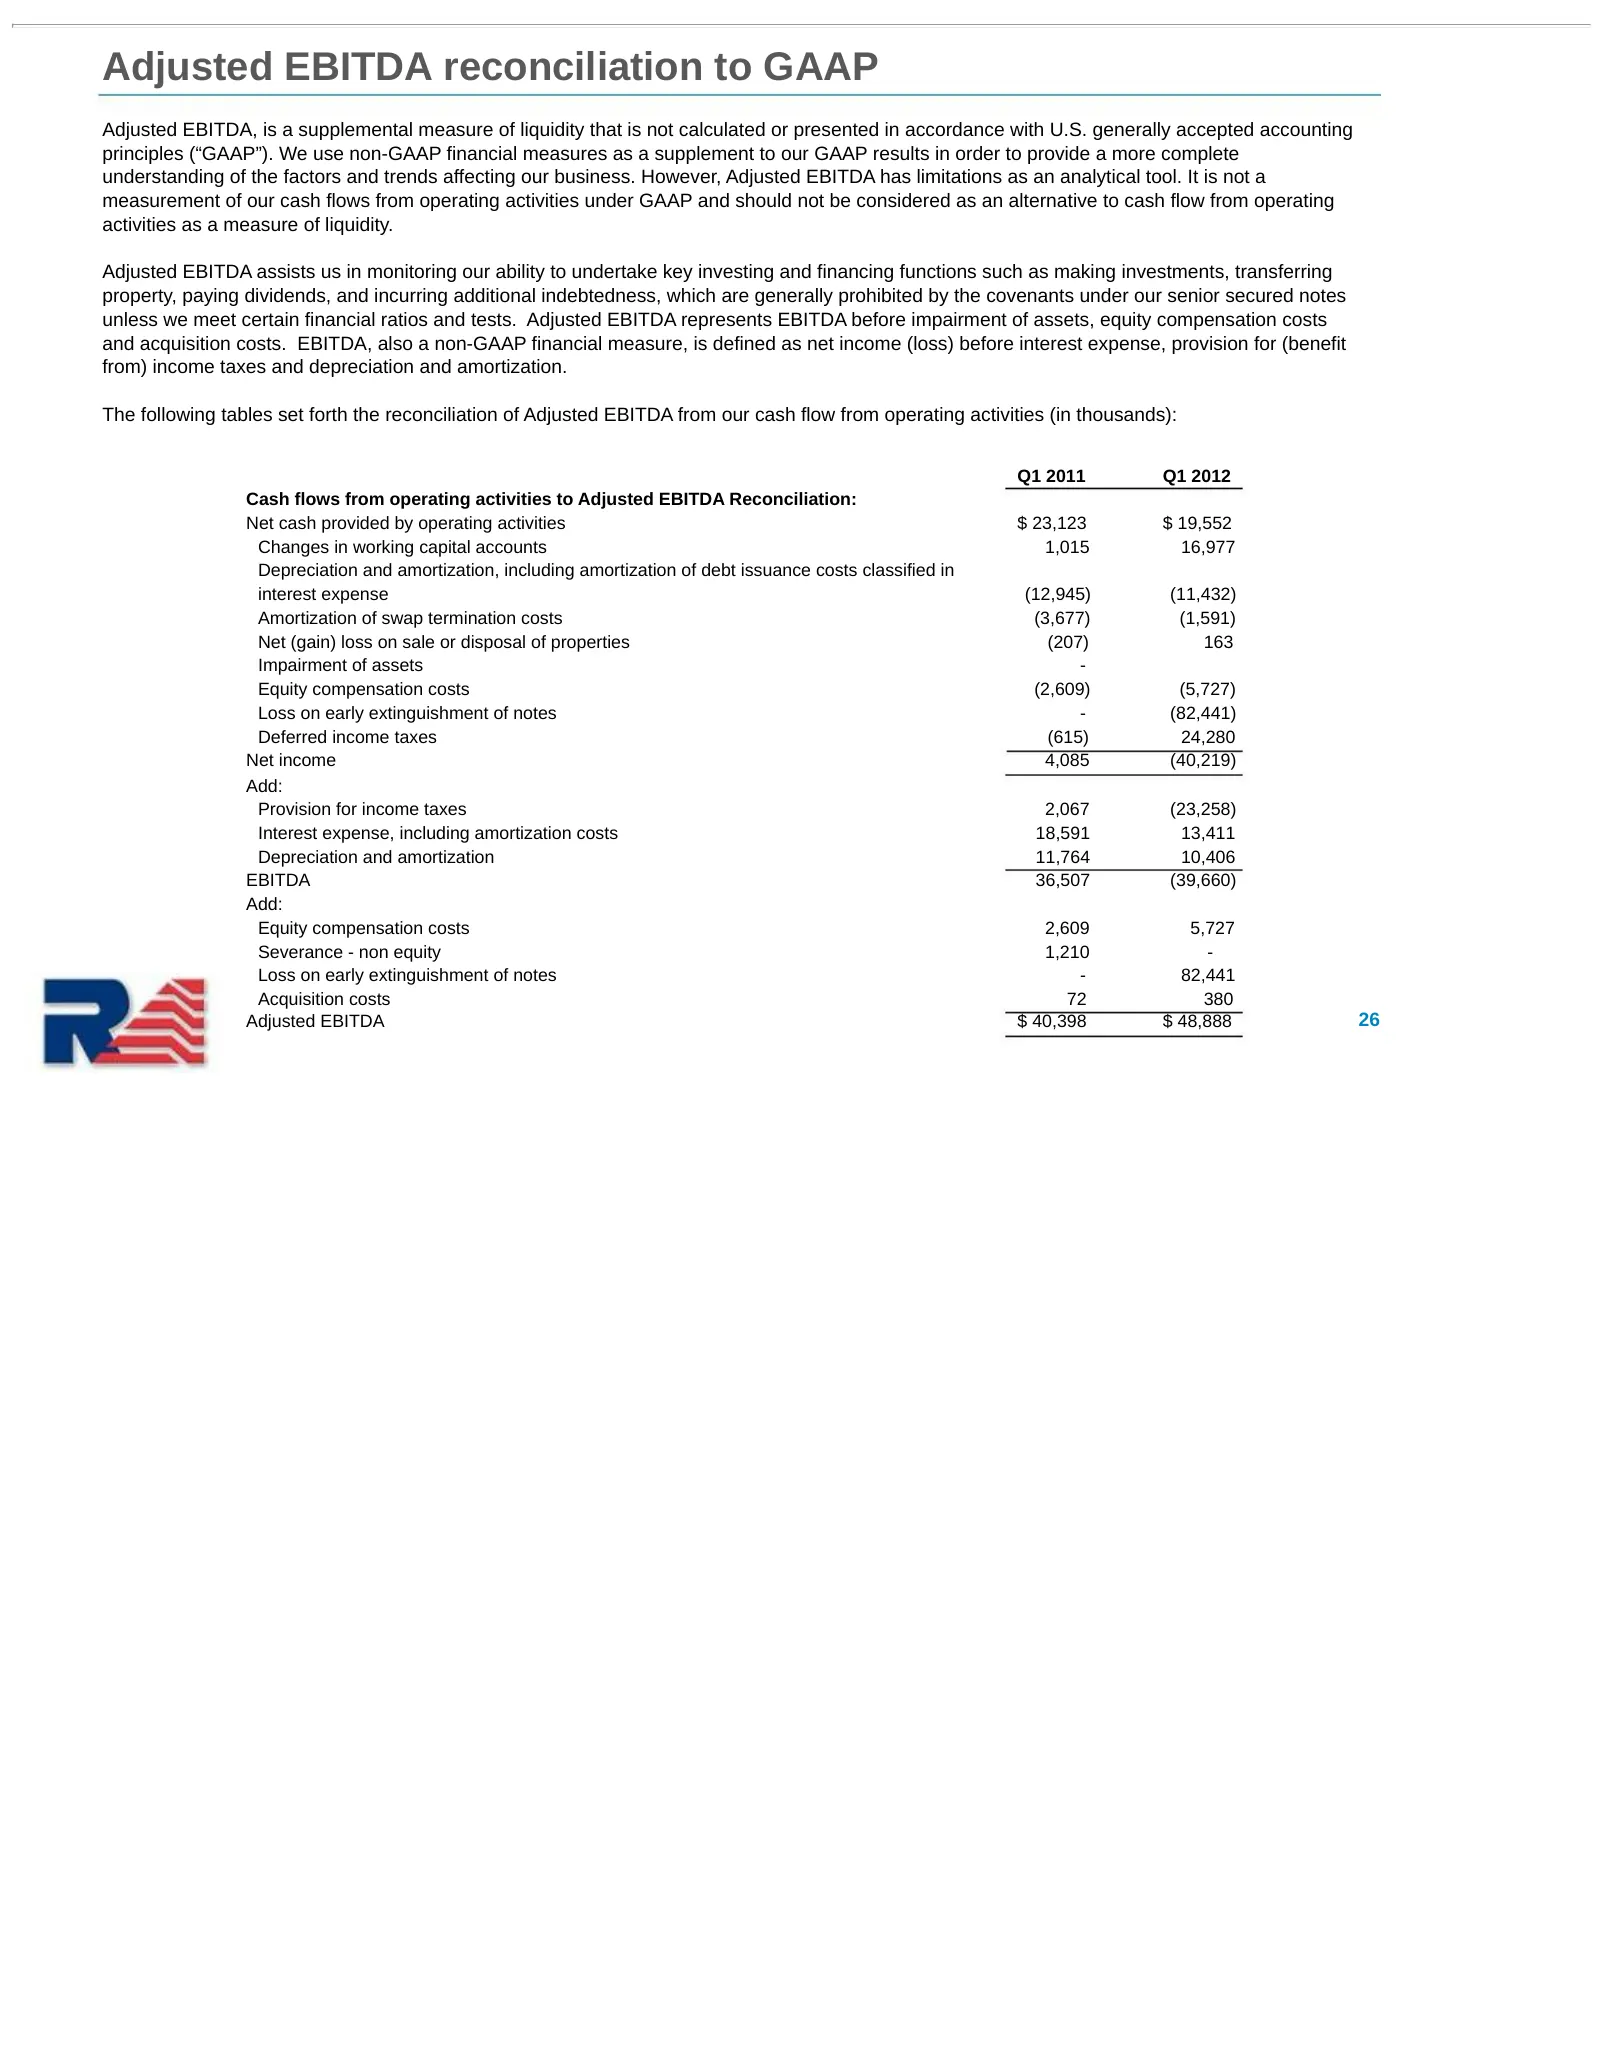
Adjusted EBITDA reconciliation to GAAP Adjusted EBITDA, is a supplemental measure of liquidity that is not calculated or presented in accordance with U.S. generally accepted accounting principles (“GAAP”). We use non-GAAP financial measures as a supplement to our GAAP results in order to provide a m
Slide 27: Estimated charges associated with expected June 2012 $74 million senior notes redemption
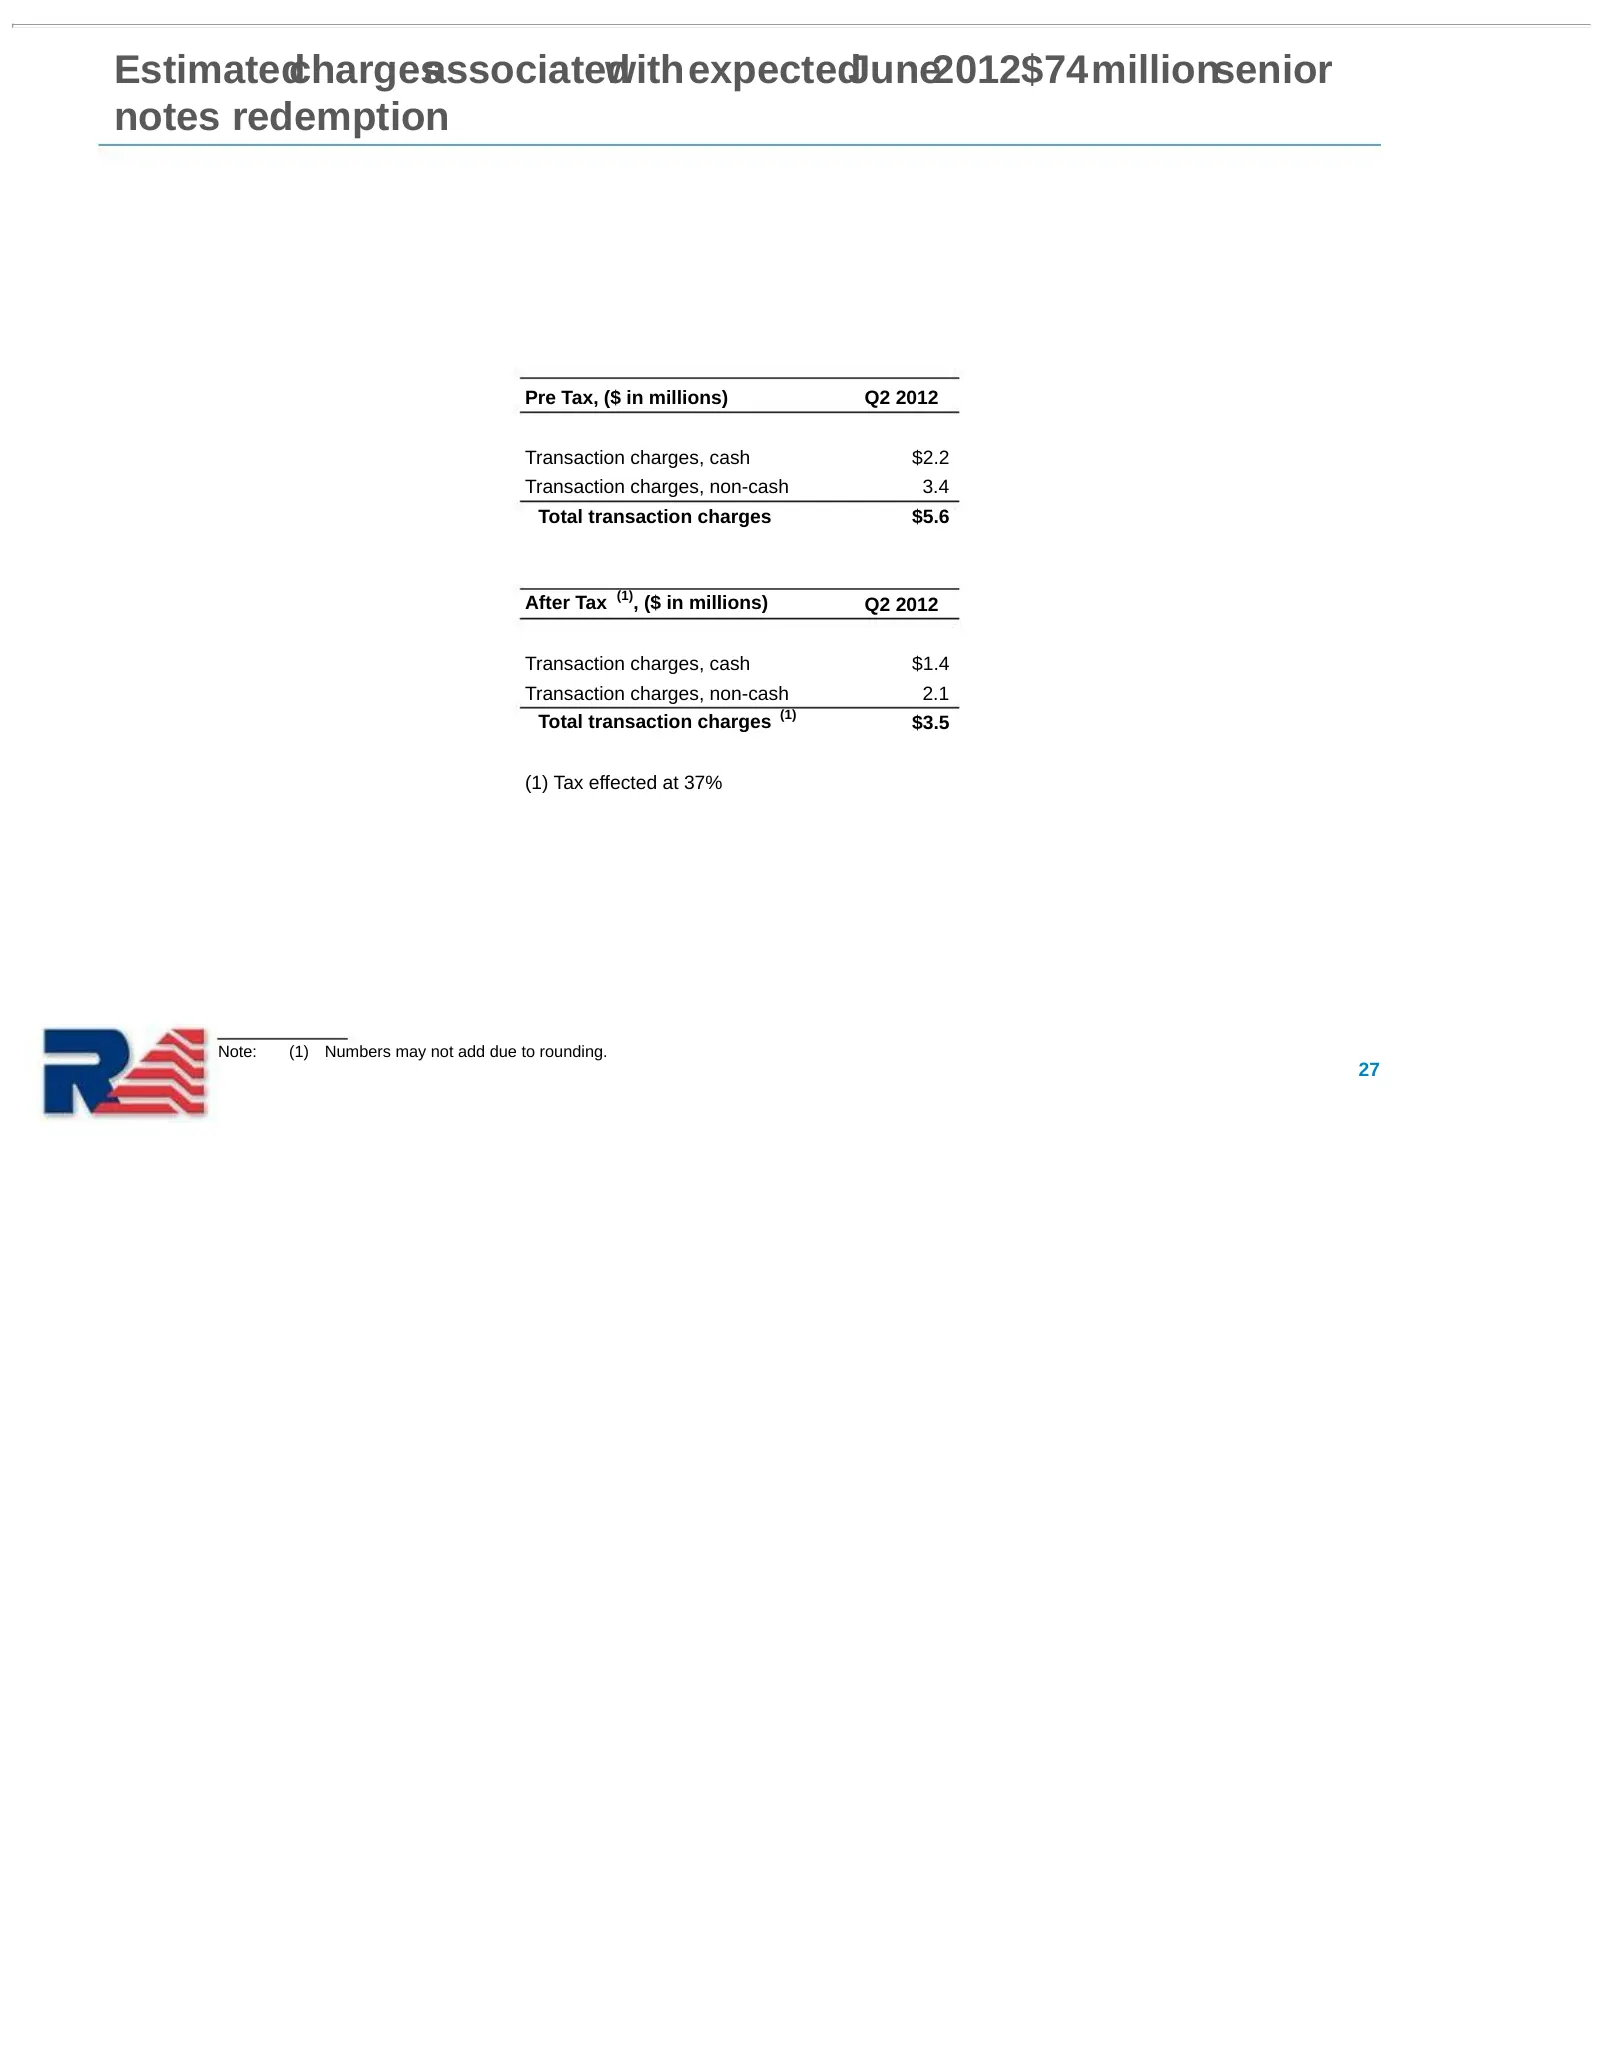
Estimatedchargesassociated withexpectedJune2012$74millionsenior notes redemption Pre Tax, ($ in millions) Q2 2012 Transaction charges, cash $2.2 Transaction charges, non-cash 3.4 Total transaction charges $5.6 After Tax (1), ($ in millions) Q2 2012 Transaction charges, cash $1.4 Transaction charges,
Slide 28: 45G tax credit
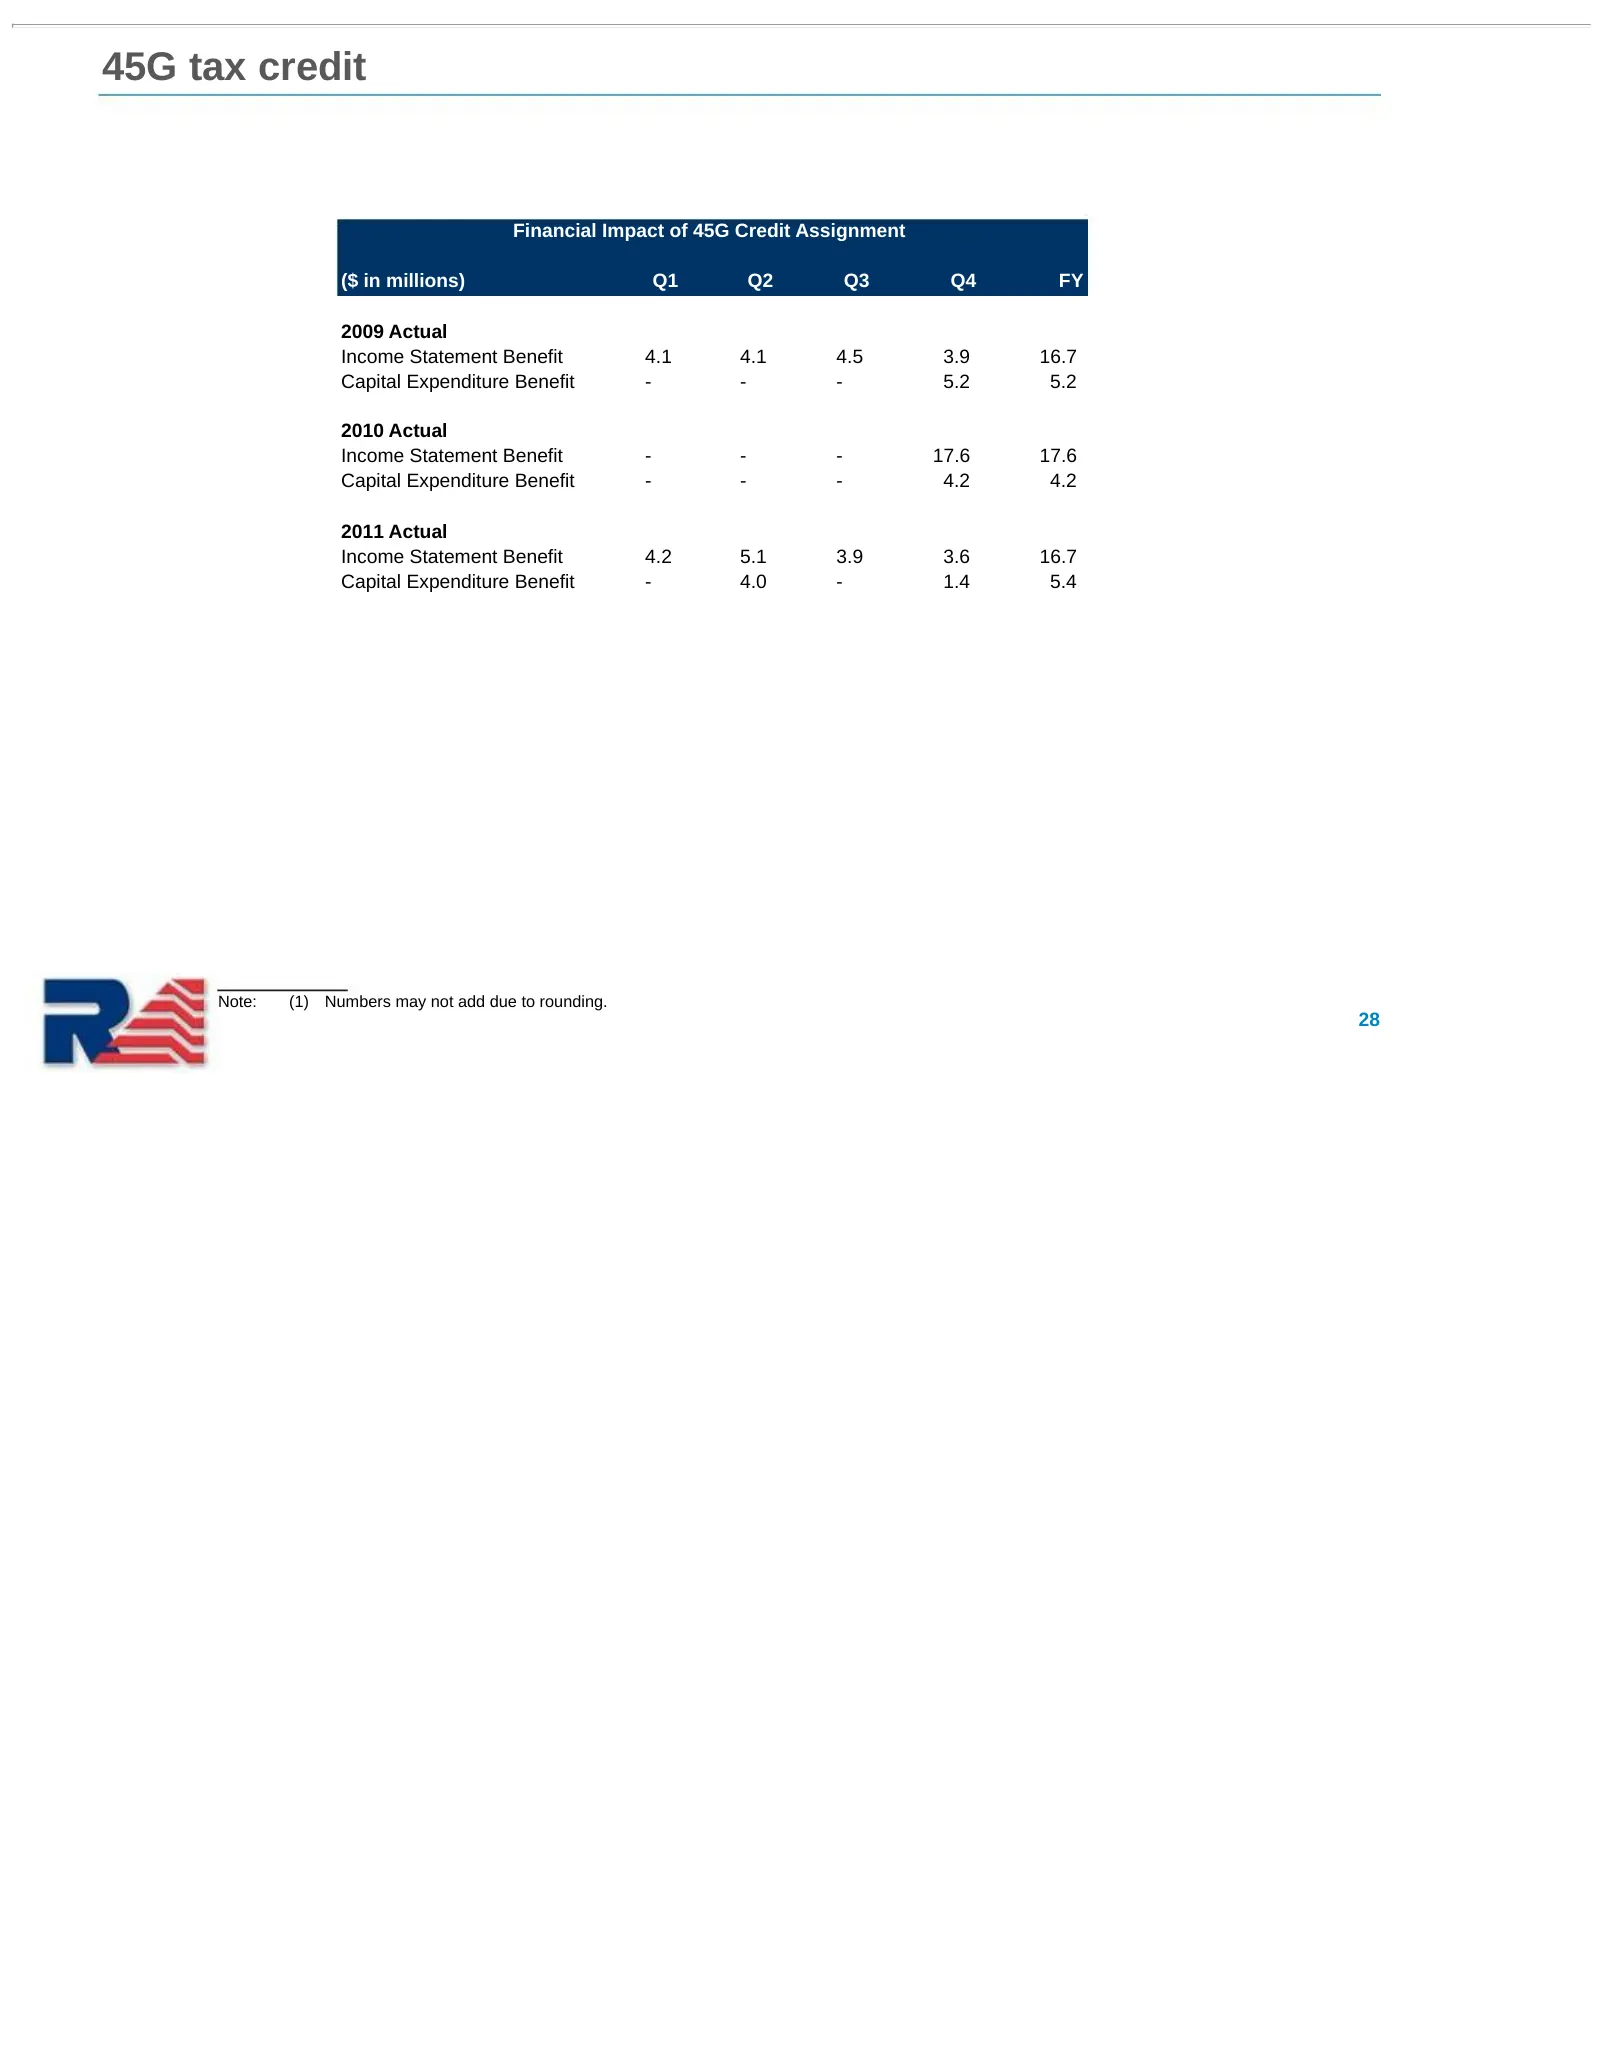
45G tax credit Financial Impact of 45G Credit Assignment ($ in millions) Q1 Q2 Q3 Q4 FY 2009 Actual Income Statement Benefit 4.1 4.1 4.5 3.9 16.7 Capital Expenditure Benefit - - - 5.2 5.2 2010 Actual Income Statement Benefit - - - 17.6 17.6 Capital Expenditure Benefit - - - 4.2 4.2 2011 Actual Incom
Slide 29: Swap amortization
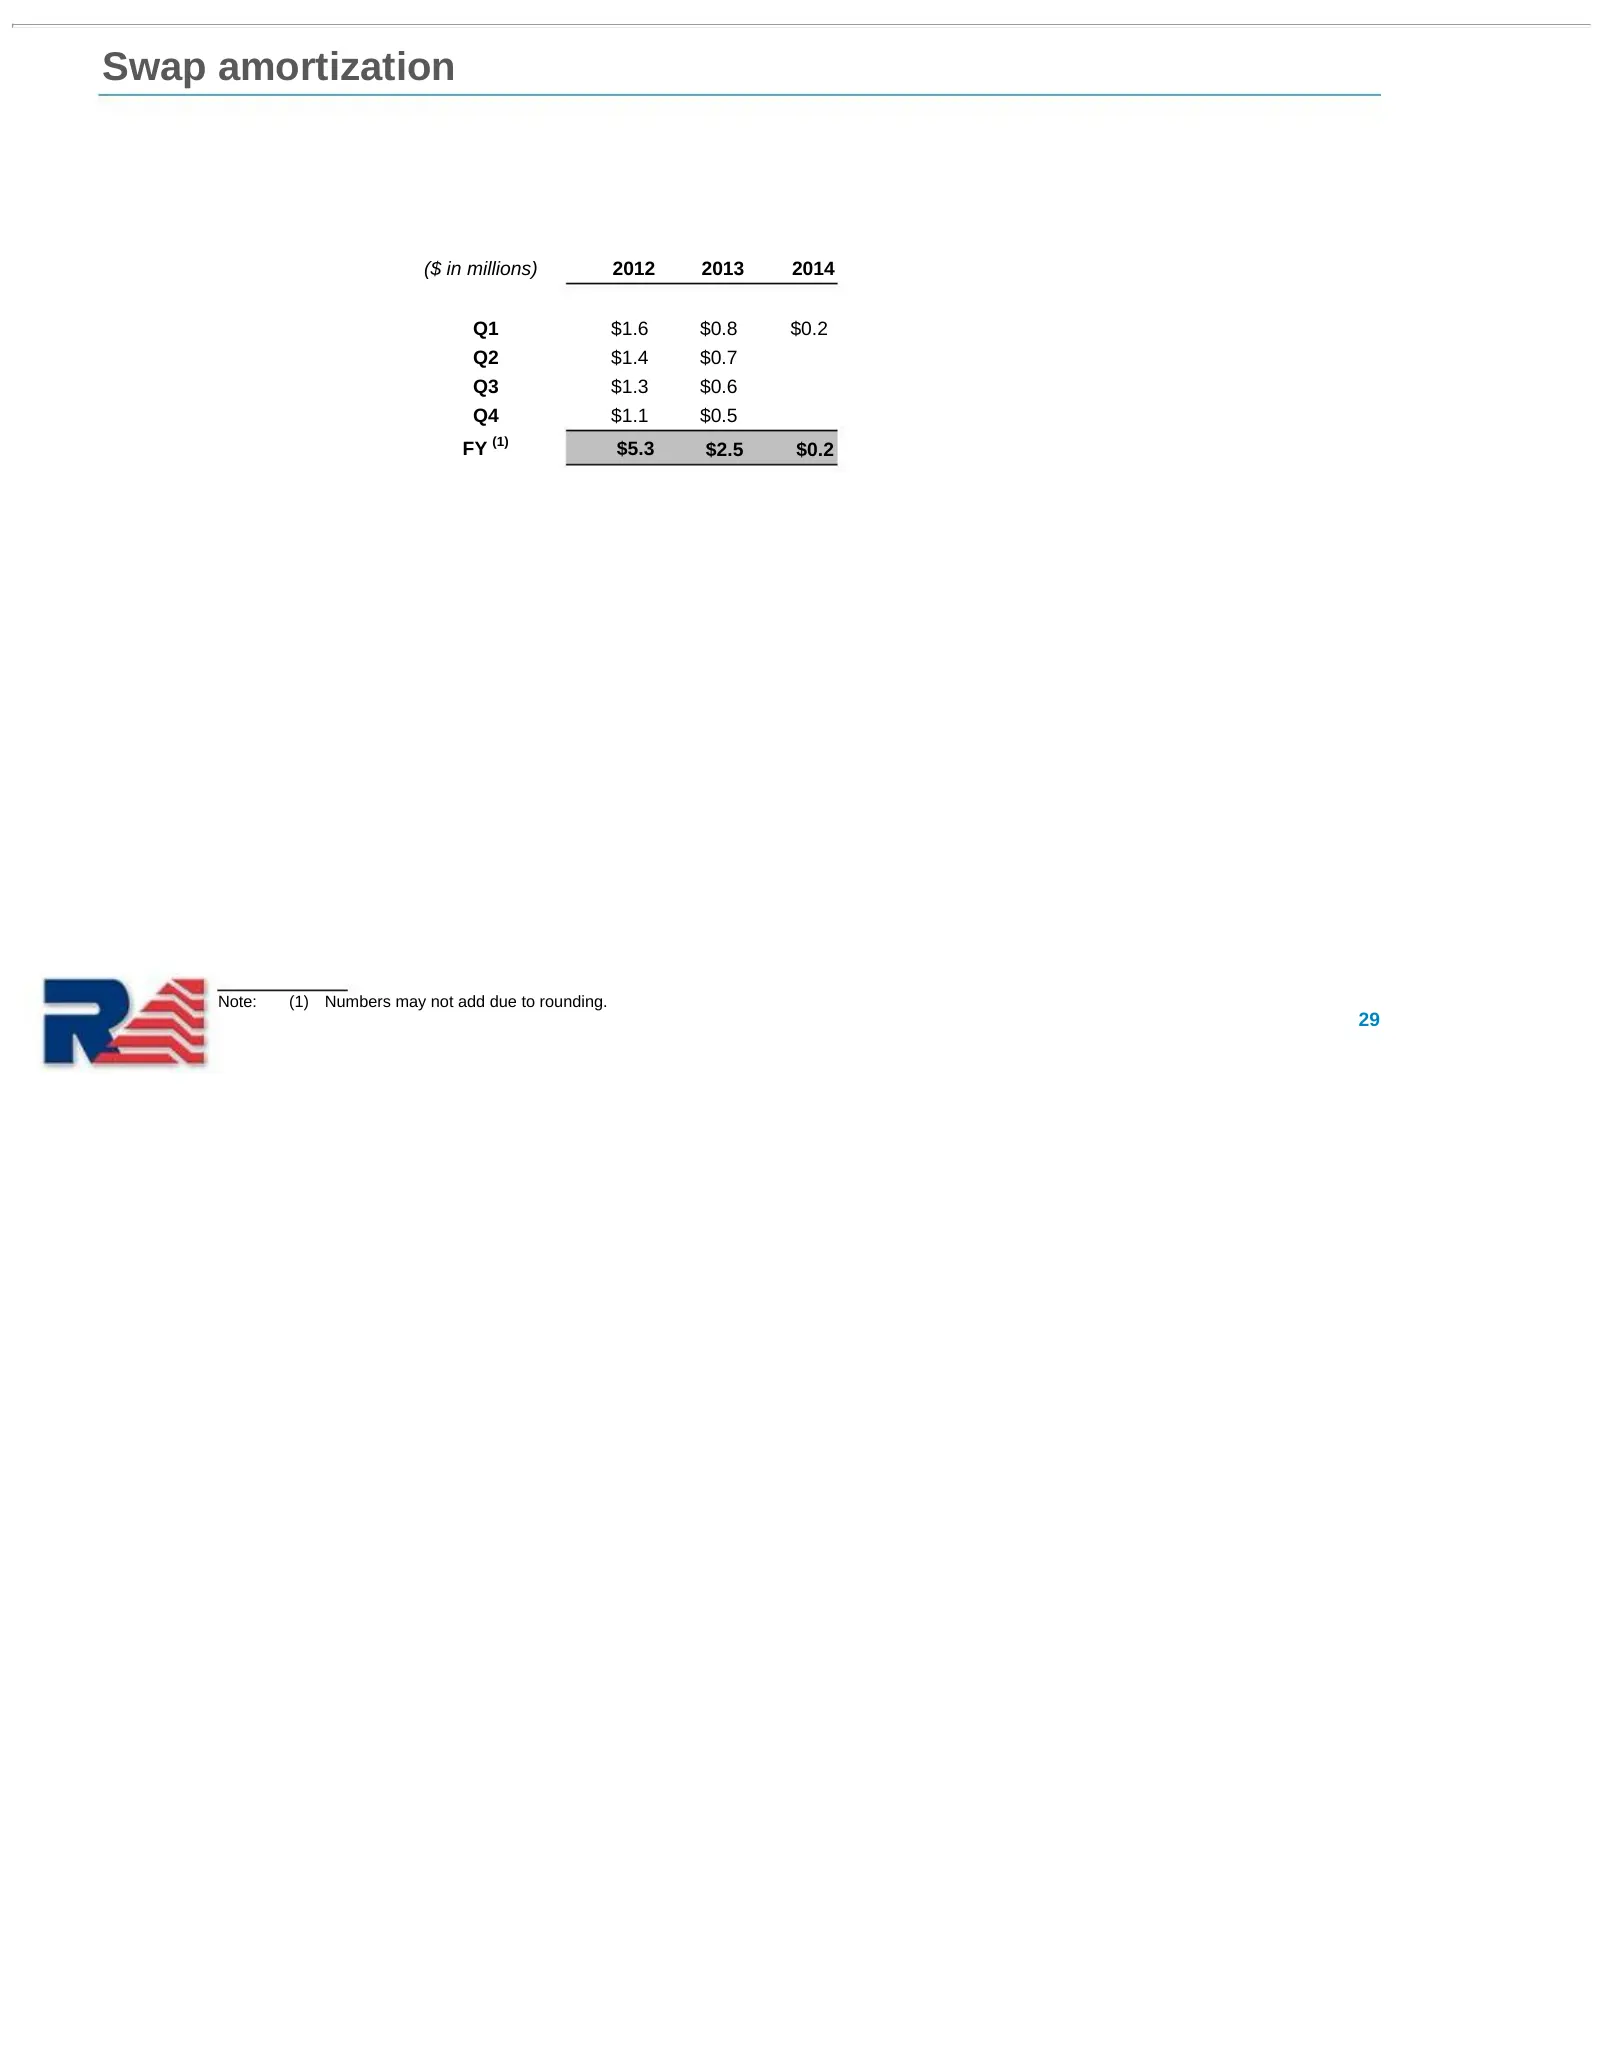
Swap amortization ($ in millions) 2012 2013 2014 Q1 $1.6 $0.8 $0.2 Q2 $1.4 $0.7 Q3 $1.3 $0.6 Q4 $1.1 $0.5 FY (1) $5.3 $2.5 $0.2 Note: (1) Numbers may not add due to rounding. 29
Source: SEC EDGAR · 8-K filed Apr 26, 2012
More decks from Railamerica Inc
 Q2 2012 Earnings Presentation25 slides · Jul 25, 2012
 Q4 2011 Earnings Presentation33 slides · Feb 9, 2012
 Q3 2011 Earnings Presentation28 slides · Oct 26, 2011
 Q2 2011 Earnings Presentation27 slides · Jul 28, 2011
 Q1 2011 Earnings Presentation28 slides · Apr 28, 2011
 Q4 2010 Earnings Presentation31 slides · Feb 24, 2011