STORE Capital — Investor Presentation (February 2015)
26 slides from STORE Capital's investor presentation, Feb 9, 2015
Slide 1: The Leader in Middle Market Real Estate Capital Solutions
The LEADER in Middle Market Real Estate Capital Solutions S|T|O|R|E CAPITAL
Slide 2: S|T|O|R|E Overview
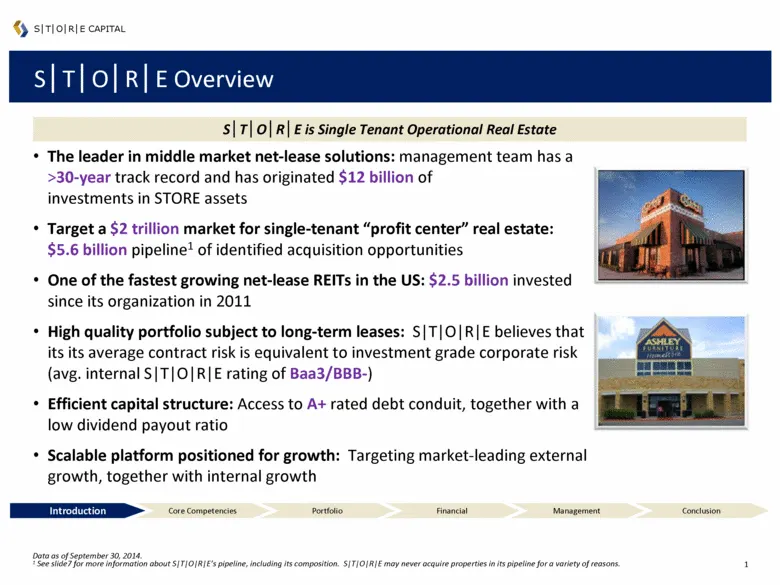
S|T|O|R|E Overview The leader in middle market net-lease solutions: management team has a >30-year track record and has originated $12 billion of investments in STORE assets Target a $2 trillion market for single-tenant “profit center” real estate: $5.6 billion pipeline1 of identified acquisition op
Slide 3: Target Market Exceeding $2 Trillion in Size
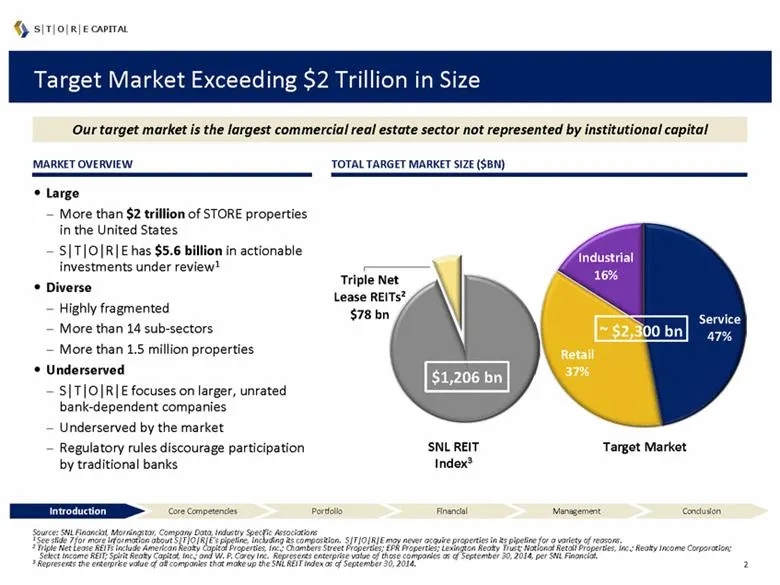
SNL REIT Index3 Target Market Exceeding $2 Trillion in Size Large More than $2 trillion of STORE properties in the United States S|T|O|R|E has $5.6 billion in actionable investments under review1 Diverse Highly fragmented More than 14 sub-sectors More than 1.5 million properties Underserved S|T|O|R|
Slide 4: Stable and Attractive Lease Rates
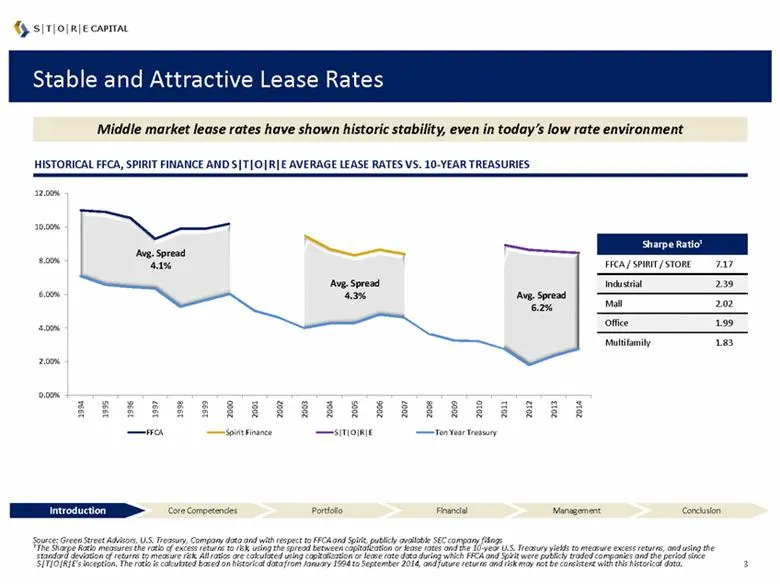
Stable and Attractive Lease Rates Middle market lease rates have shown historic stability, even in today’s low rate environment HISTORICAL FFCA, SPIRIT FINANCE AND S|T|O|R|E AVERAGE LEASE RATES VS. 10-YEAR TREASURIES Source: Green Street Advisors, U.S. Treasury, Company data and with respect to FFCA
Slide 5: Targeting Investment Value Creation Through Core Competencies
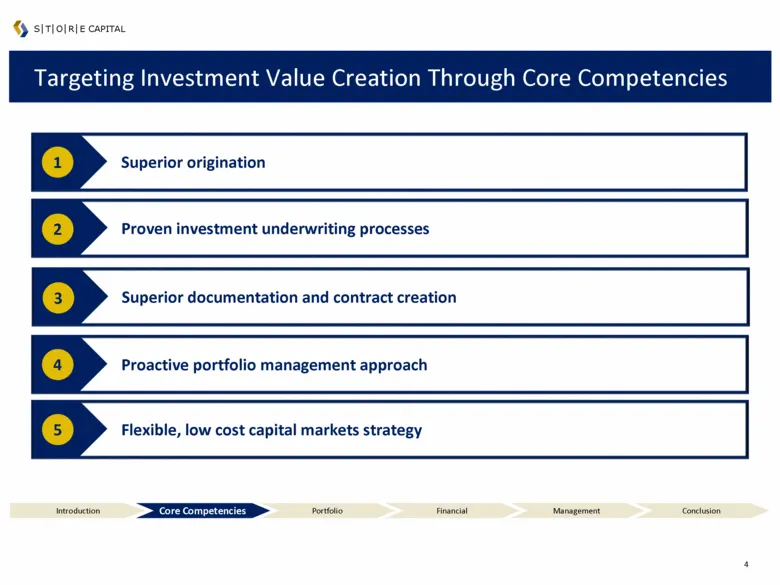
Targeting Investment Value Creation Through Core Competencies 2 4 5 1 S|T|O|R|E CAPITAL Introduction Core Competencies Portfolio Financial Management Conclusion 3 Superior origination Proven investment underwriting processes Superior documentation and contract creation Proactive portfolio manadement
Slide 6: Superior Direct Origination Platform
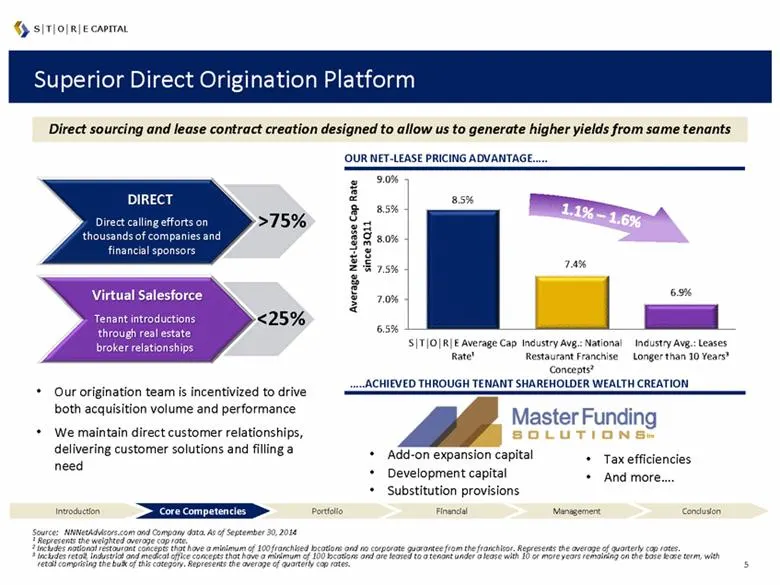
Superior Direct Origination Platform Our origination team is incentivized to drive both acquisition volume and performance We maintain direct customer relationships, delivering customer solutions and filling a need Direct sourcing and lease contract creation designed to allow us to generate higher y
Slide 7: The Broadest Sector Within the Target Market
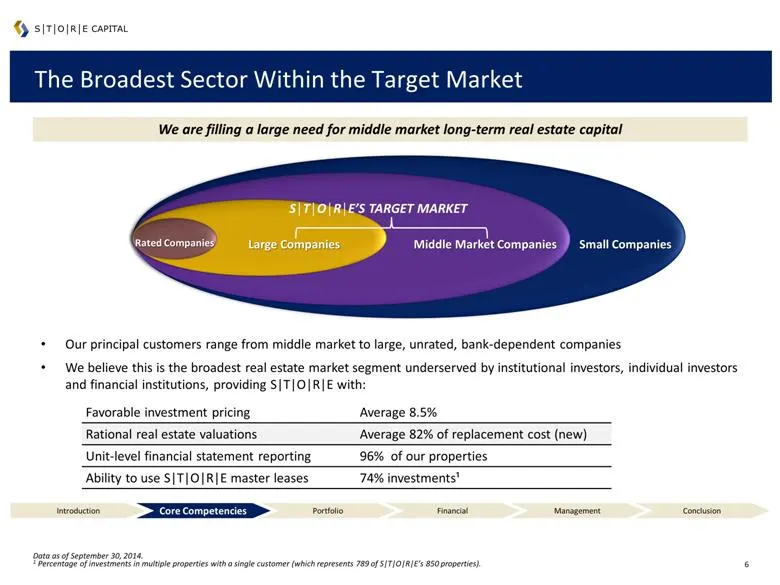
The Broadest Sector Within the Target Market We are filling a large need for middle market long-term real estate capital Middle Market Companies Large Companies Rated Companies Our principal customers range from middle market to large, unrated, bank-dependent companies We believe this is the broades
Slide 8: We have a $5.6 billion Pipeline of Potential Investments
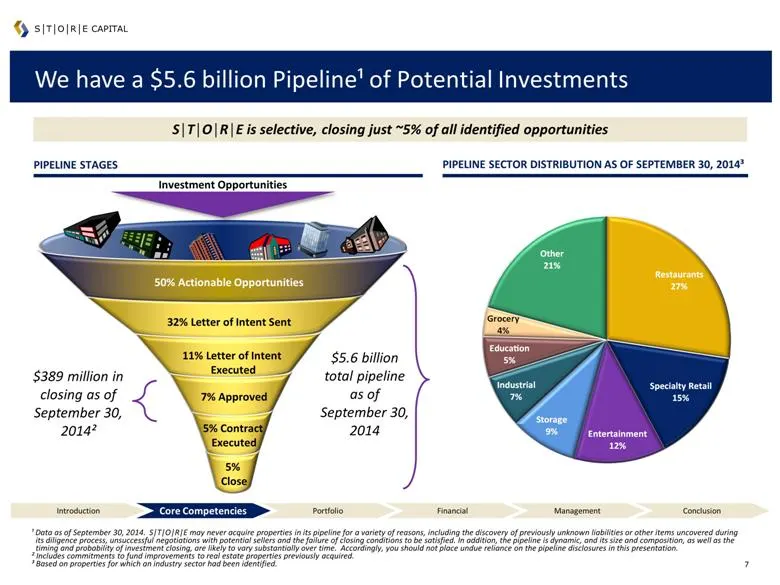
We have a $5.6 billion Pipeline¹ of Potential Investments ¹ Data as of September 30, 2014. S|T|O|R|E may never acquire properties in its pipeline for a variety of reasons, including the discovery of previously unknown liabilities or other items uncovered during its diligence process, unsuccessful ne
Slide 9: Time-Tested Underwriting Approach
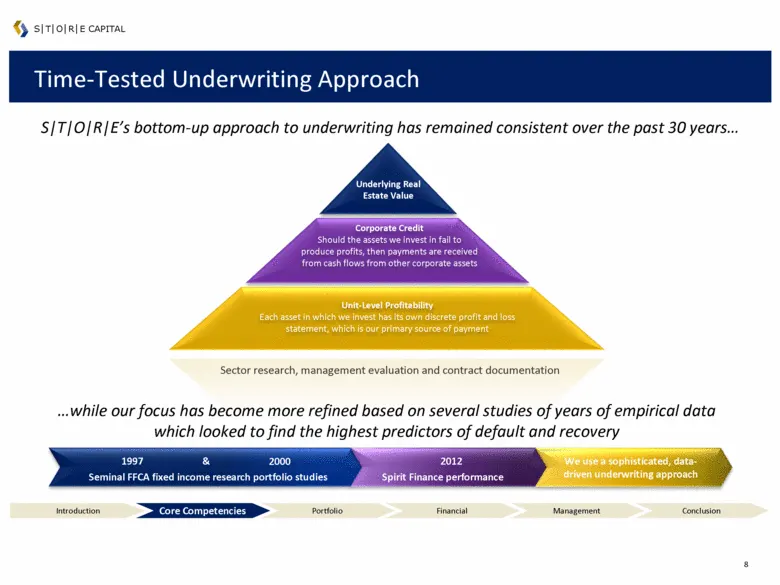
Time-Tested Underwriting Approach S|T|O|R|E’s bottom-up approach to underwriting has remained consistent over the past 30 years Unit-Level Profitability Each asset in which we invest has its own discrete profit and loss statement, which is our primary source of payment Corporate Credit Should the as
Slide 10: S|T|O|R|E Contracts vs. Investment Grade Tenant Leases
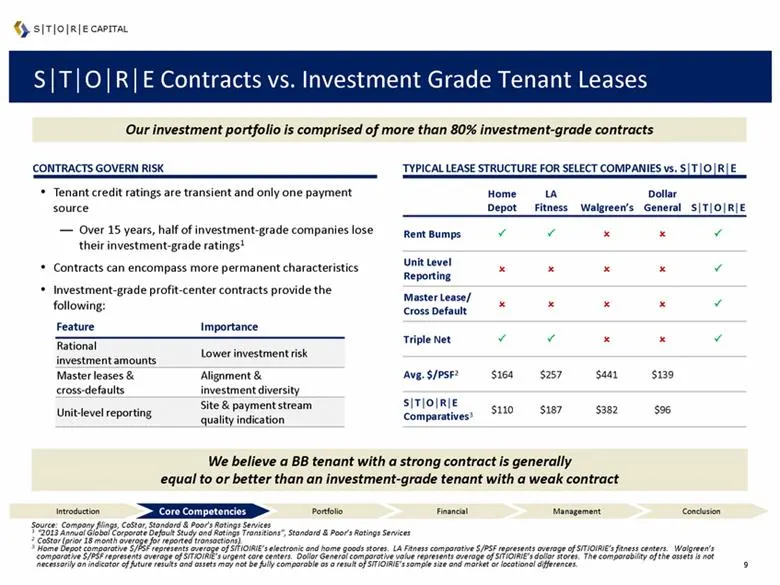
S|T|O|R|E Contracts vs. Investment Grade Tenant Leases S|T|O|R|E CAPITAL TYPICAL LEASE STRUCTURE FOR SELECT COMPANIES vs. S|T|O|R|E Tenant credit ratings are transient and only one payment source Over 15 years, half of investment-grade companies lose their investment-grade ratings1 Contracts can enc
Slide 11: Proprietary and Intensive Credit Monitoring System
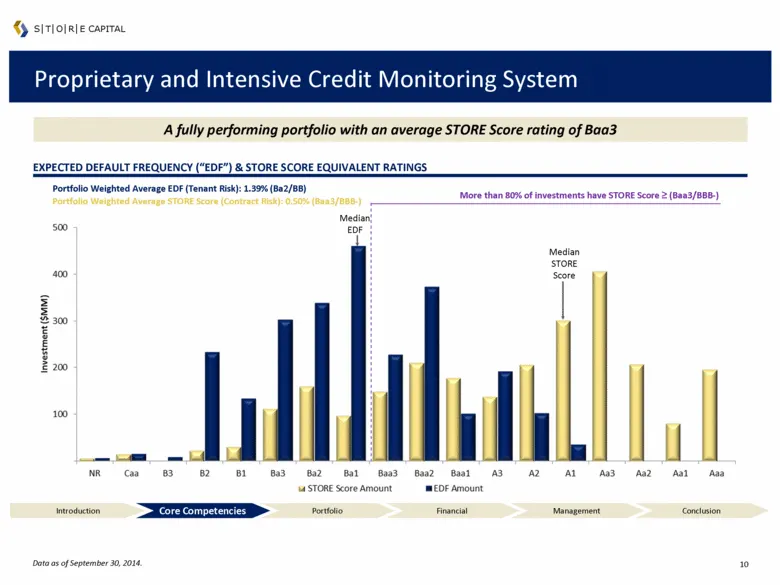
Proprietary and Intensive Credit Monitoring System A fully performing portfolio with an average STORE Score rating of Baa3 EXPECTED DEFAULT FREQUENCY (“EDF”) & STORE SCORE EQUIVALENT RATINGS Data as of September 30, 2014. S|T|O|R|E CAPITAL Introduction Core Competencies Portfolio Financial Managemen
Slide 12: Prudent Leverage Philosophy and Access to A+ Rated Borrowings
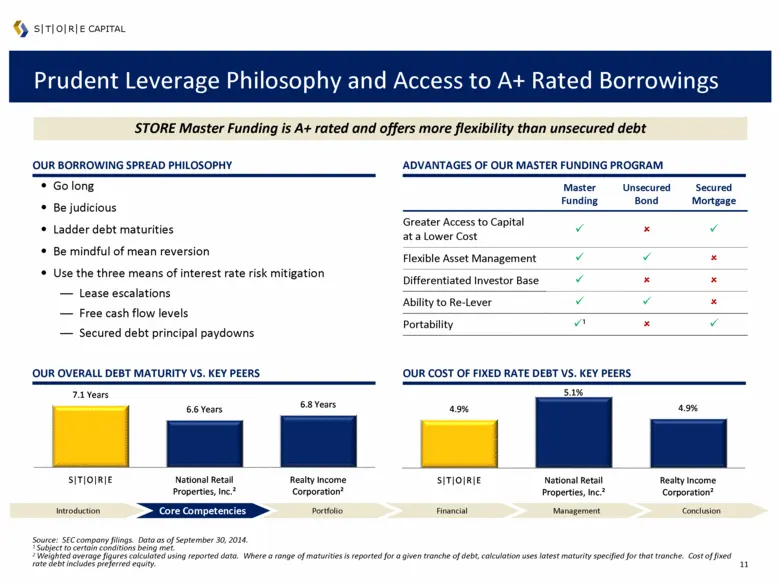
Master Funding Unsecured Bond Secured Mortgage Greater Access to Capital at a Lower Cost ü û ü Flexible Asset Management ü ü û Differentiated Investor Base ü û û Ability to Re-Lever ü ü û Portability ü¹ û ü Prudent Leverage Philosophy and Access to A+ Rated Borrowings Source: SEC company filings. Da
Slide 13: Flexible, Conservative Capital Structure
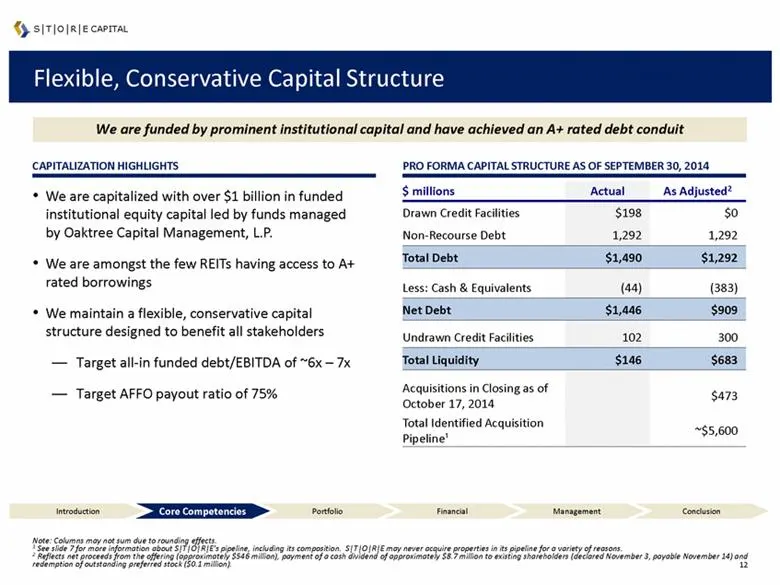
Flexible, Conservative Capital Structure CAPITALIZATION HIGHLIGHTS PRO FORMA CAPITAL STRUCTURE AS OF SEPTEMBER 30, 2014 We are capitalized with over $1 billion in funded institutional equity capital led by funds managed by Oaktree Capital Management, L.P. We are amongst the few REITs having access t
Slide 14: Our Portfolio
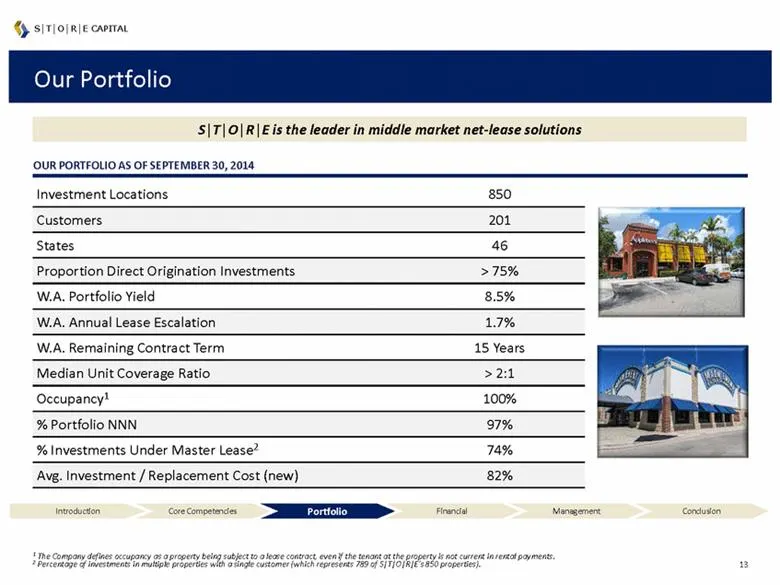
Our Portfolio S|T|O|R|E is the leader in middle market net-lease solutions S|T|O|R|E CAPITAL OUR PORTFOLIO AS OF SEPTEMBER 30, 2014 Investment Locations 850 Customers 201 States 46 Proportion Direct Origination Investments > 75% W.A. Portfolio Yield 8.5% W.A. Annual Lease Escalation 1.7% W.A. Remain
Slide 15: High Quality Portfolio
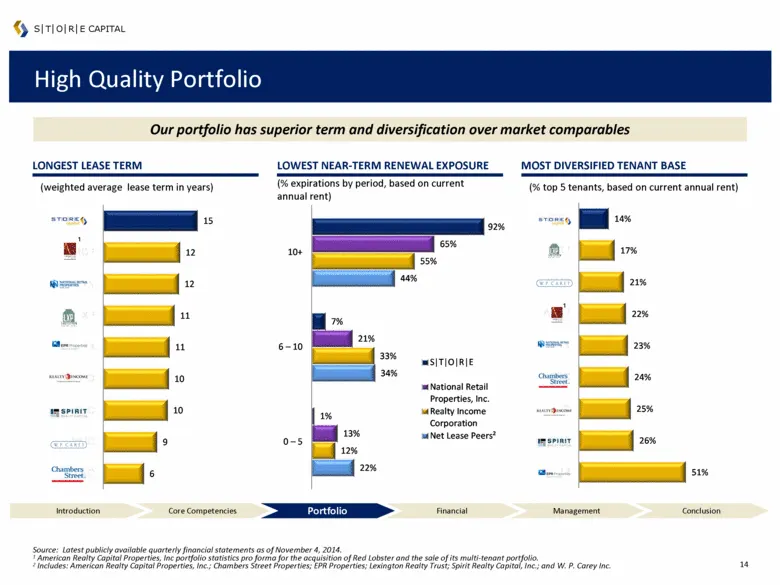
High Quality Portfolio MOST DIVERSIFIED TENANT BASE Source: Latest publicly available quarterly financial statements as of November 4, 2014. 1 American Realty Capital Properties, Inc portfolio statistics pro forma for the acquisition of Red Lobster and the sale of its multi-tenant portfolio. 2 Inclu
Slide 16: Diversified Across Geographies
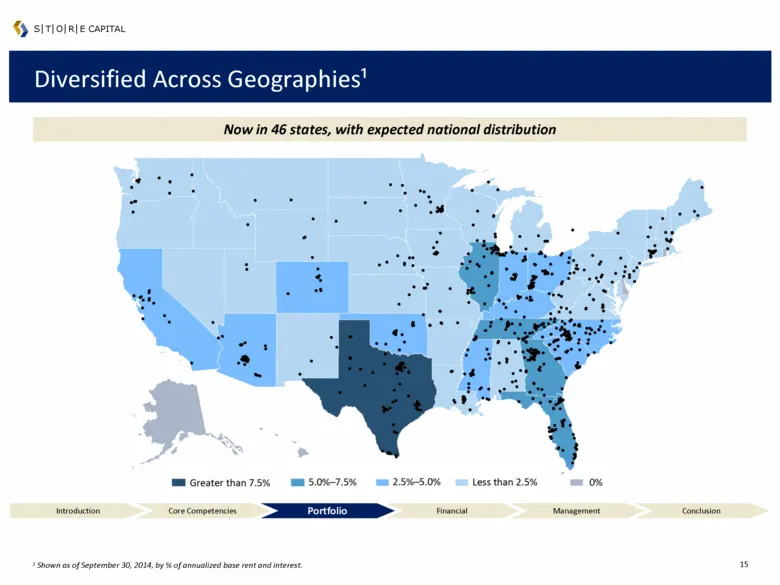
Diversified Across Geographies¹ Now in 46 states, with expected national distribution S|T|O|R|E CAPITAL 1 Shown as of September 30, 2014, by % of annualized base rent and interest. Introduction Core Competencies Portfolio Financial Management Conclusion
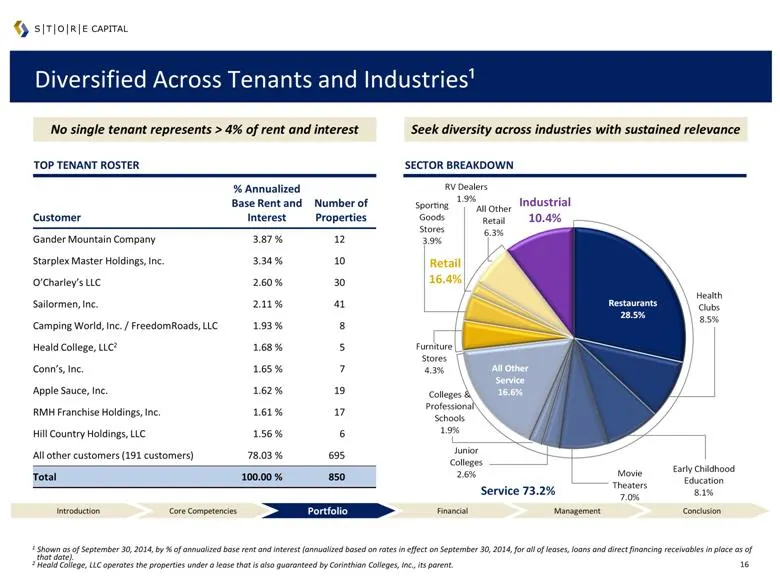
Slide 17: Diversified Across Tenants and Industries
Customer % Annualized Base Rent and Interest Number of Properties Gander Mountain Company 3.87 % 12 Starplex Master Holdings, Inc. 3.34 % 10 O’Charley’s LLC 2.60 % 30 Sailormen, Inc. 2.11 % 41 Camping World, Inc. / FreedomRoads, LLC 1.93 % 8 Heald College, LLC2 1.68 % 5 Conn’s, Inc. 1.65 % 7 Apple S
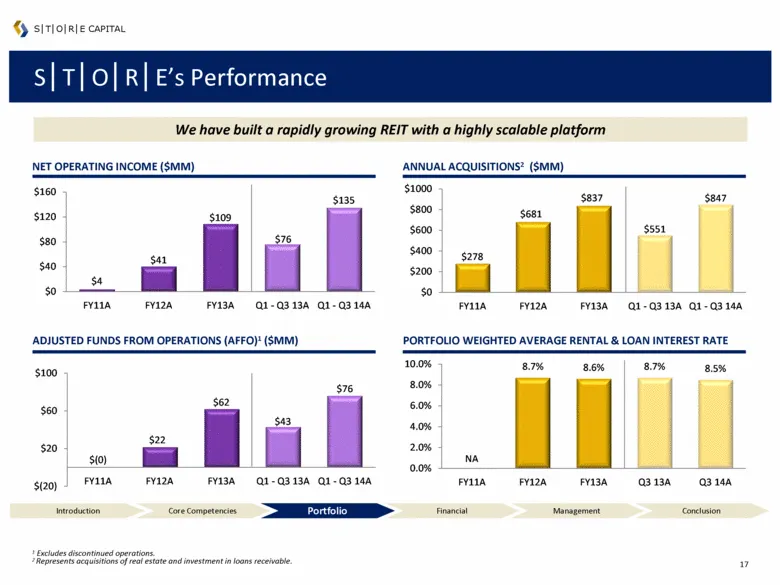
Slide 18: S|T|O|R|E's Performance
S|T|O|R|E’s Performance ADJUSTED FUNDS FROM OPERATIONS (AFFO)1 ($MM) PORTFOLIO WEIGHTED AVERAGE RENTAL & LOAN INTEREST RATE NET OPERATING INCOME ($MM) ANNUAL ACQUISITIONS2 ($MM) We have built a rapidly growing REIT with a highly scalable platform S|T|O|R|E CAPITAL 1 Excludes discontinued operations.
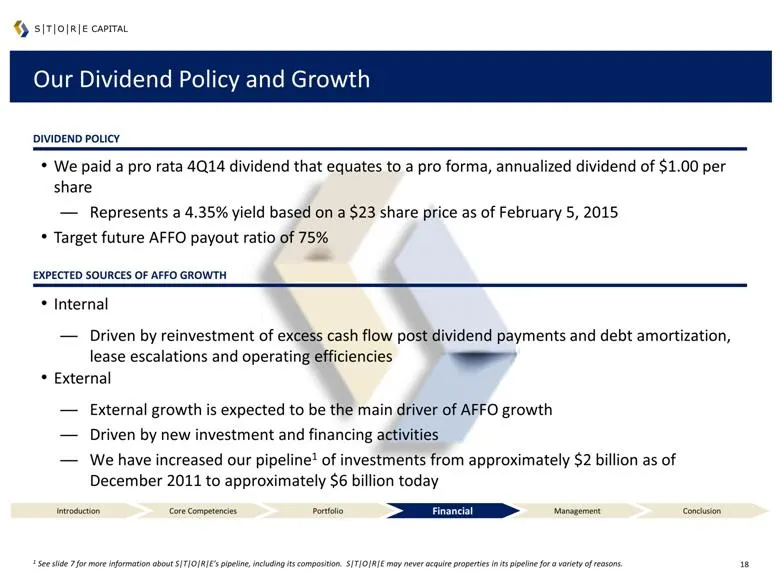
Slide 19: Our Dividend Policy and Growth
Our Dividend Policy and Growth DIVIDEND POLICY S|T|O|R|E CAPITAL We paid a pro rata 4Q14 dividend that equates to a pro forma, annualized dividend of $1.00 per share Represents a 4.35% yield based on a $23 share price as of February 5, 2015 Target future AFFO payout ratio of 75% EXPECTED SOURCES OF
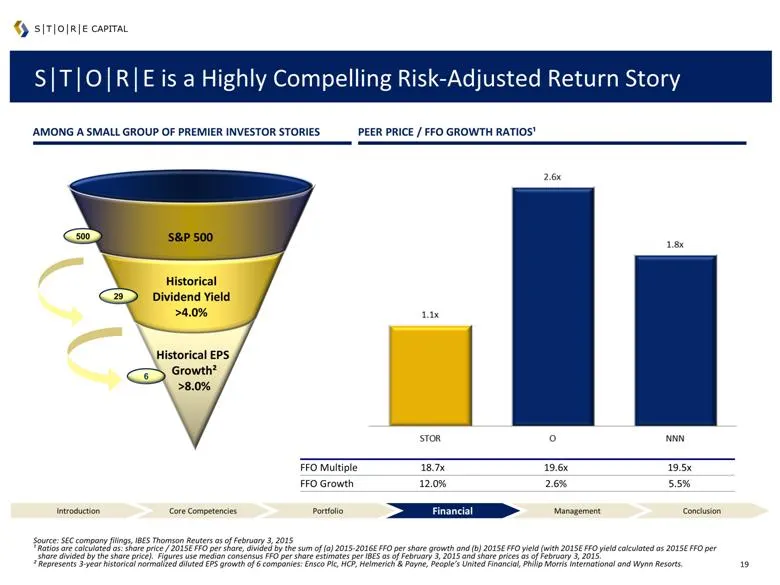
Slide 20: A Highly Compelling Risk-Adjusted Return Story
FFO Multiple 18.7x 19.6x 19.5x FFO Growth 12.0% 2.6% 5.5% Historical EPS Growth² >8.0% 6 29 Historical Dividend Yield >4.0% S|T|O|R|E is a Highly Compelling Risk-Adjusted Return Story S|T|O|R|E CAPITAL Source: SEC company filings, IBES Thomson Reuters as of February 3, 2015 ¹ Ratios are calculated a
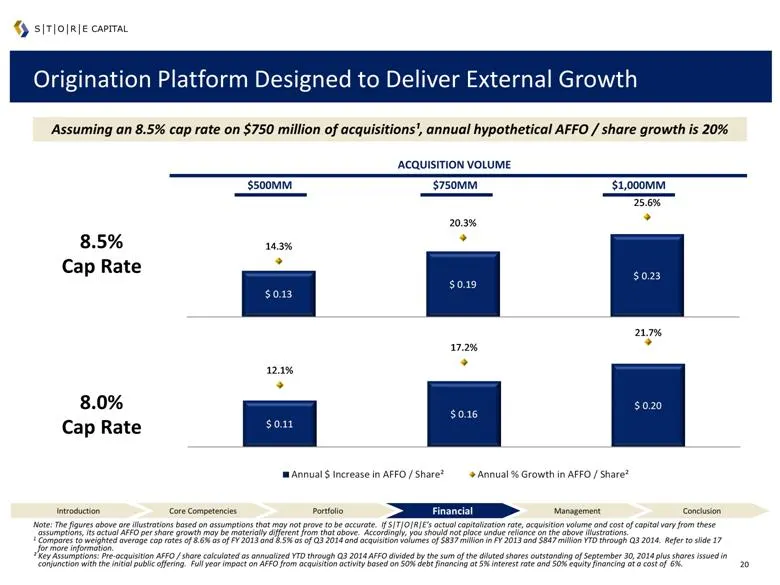
Slide 21: Illustrative AFFO per Share Growth
Note: The figures above are illustrations based on assumptions that may not prove to be accurate. If S|T|O|R|E’s actual capitalization rate, acquisition volume and cost of capital vary from these assumptions, its actual AFFO per share growth may be materially different from that above. Accordingly,
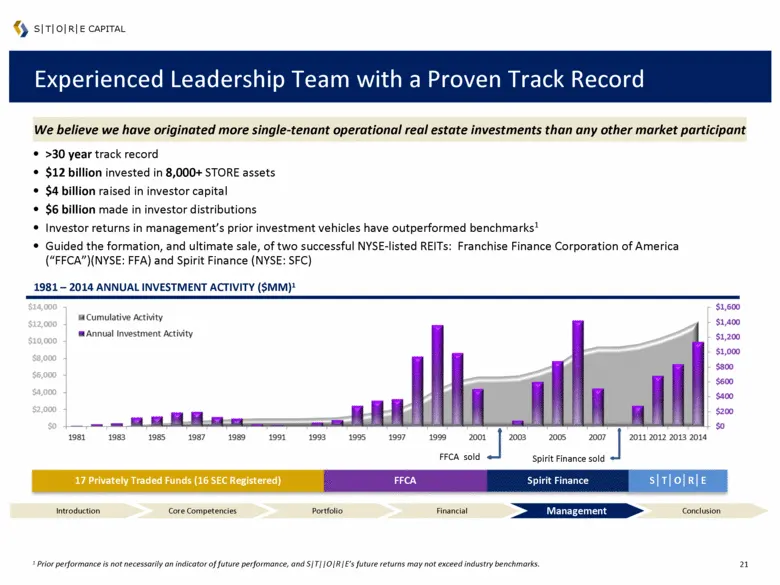
Slide 22: Experienced Leadership Team with a Proven Track Record
Experienced Leadership Team with a Proven Track Record >30 year track record $12 billion invested in 8,000+ STORE assets $4 billion raised in investor capital $6 billion made in investor distributions Investor returns in management’s prior investment vehicles have outperformed benchmarks1 Guided the
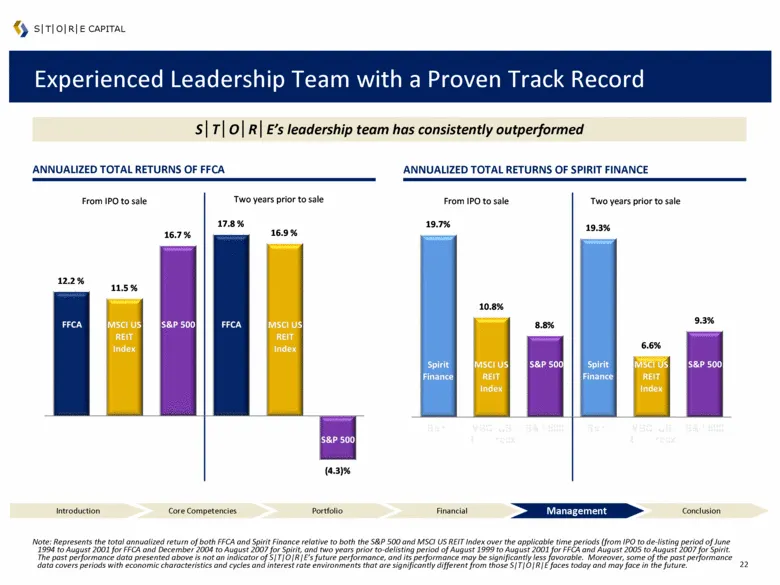
Slide 23: Experienced Leadership Team with a Proven Track Record
Experienced Leadership Team with a Proven Track Record ANNUALIZED TOTAL RETURNS OF SPIRIT FINANCE S|T|O|R|E’s leadership team has consistently outperformed ANNUALIZED TOTAL RETURNS OF FFCA S|T|O|R|E CAPITAL Note: Represents the total annualized return of both FFCA and Spirit Finance relative to both
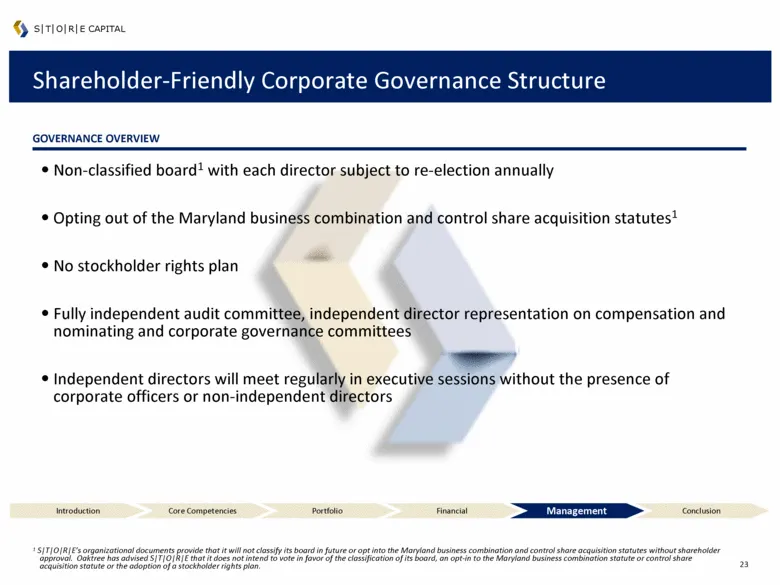
Slide 24: Shareholder-Friendly Corporate Governance Structure
Shareholder-Friendly Corporate Governance Structure GOVERNANCE OVERVIEW S|T|O|R|E CAPITAL Non-classified board1 with each director subject to re-election annually Opting out of the Maryland business combination and control share acquisition statutes1 No stockholder rights plan Fully independent audi
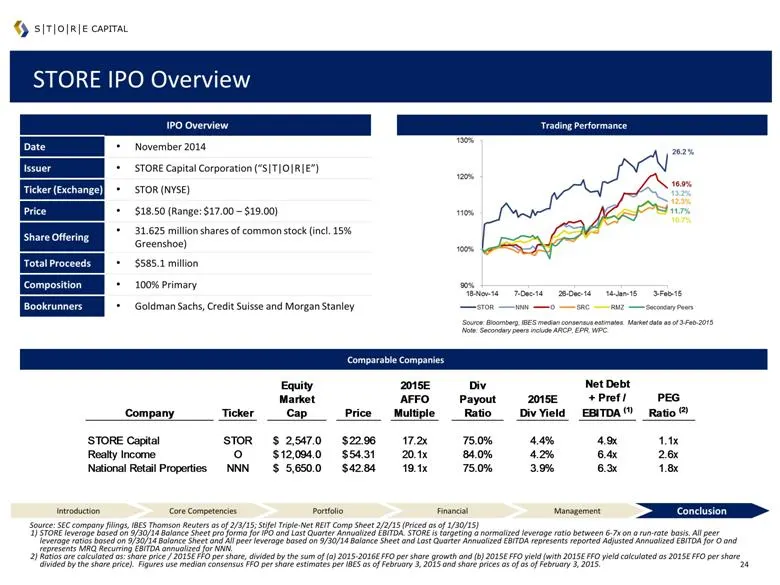
Slide 25: STORE IPO Overview
IPO Overview Date November 2014 Issuer STORE Capital Corporation (“S|T|O|R|E”) Ticker (Exchange) STOR (NYSE) Price $18.50 (Range: $17.00 – $19.00) Share Offering 31.625 million shares of common stock (incl. 15% Greenshoe) Total Proceeds $585.1 million Composition 100% Primary Bookrunners Goldman Sac
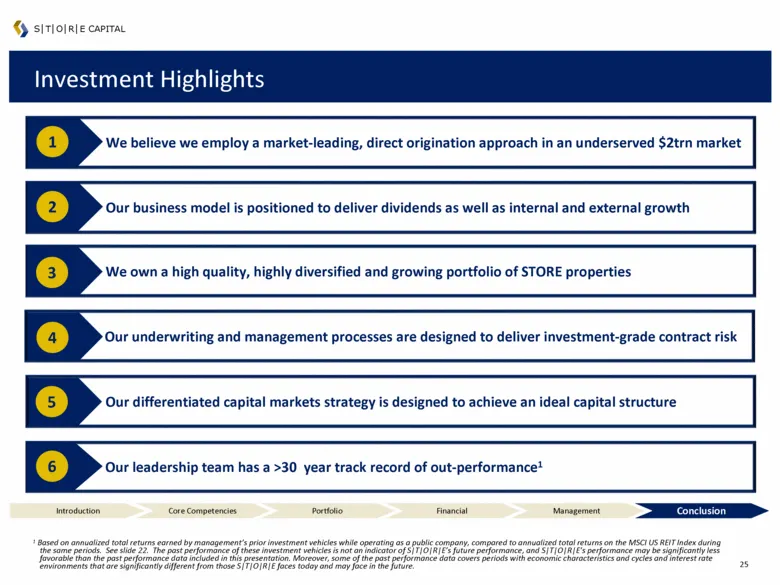
Slide 26: Investment Highlights
Investment Highlights 2 1 S|T|O|R|E CAPITAL 6 4 Our underwriting and management processes are designed to deliver investment-grade contract risk 5 Our differentiated capital markets strategy is designed to achieve an ideal capital structure 3 Introduction Core Competencies Portfolio Financial Manage
Source: SEC EDGAR · 8-K filed Feb 9, 2015
More decks from STORE Capital Corp
 Q2 2023 Earnings Presentation10 slides · Aug 4, 2023
 Q2 2022 Earnings Presentation26 slides · Aug 3, 2022
 Q2 2022 Earnings Presentation22 slides · Aug 3, 2022
 Q1 2022 Earnings Presentation26 slides · May 4, 2022
 Q1 2022 Earnings Presentation22 slides · May 4, 2022
 Q4 2021 Earnings Presentation33 slides · Feb 23, 2022