JCDecaux SE · EURONEXT:DEC
JCDecaux — H1 2014 Earnings Presentation
50 slides from JCDecaux's earnings presentation, Jul 31, 2014

Slide 1: H1 2014 Results
H1 2014 RESULTS July 31th, 2014

Slide 2: Business Overview
BUSINESS OVERVIEW Jean-Charles Decaux Chairman of the Board and Co-CEO
Slide 3: H1 2014 Results
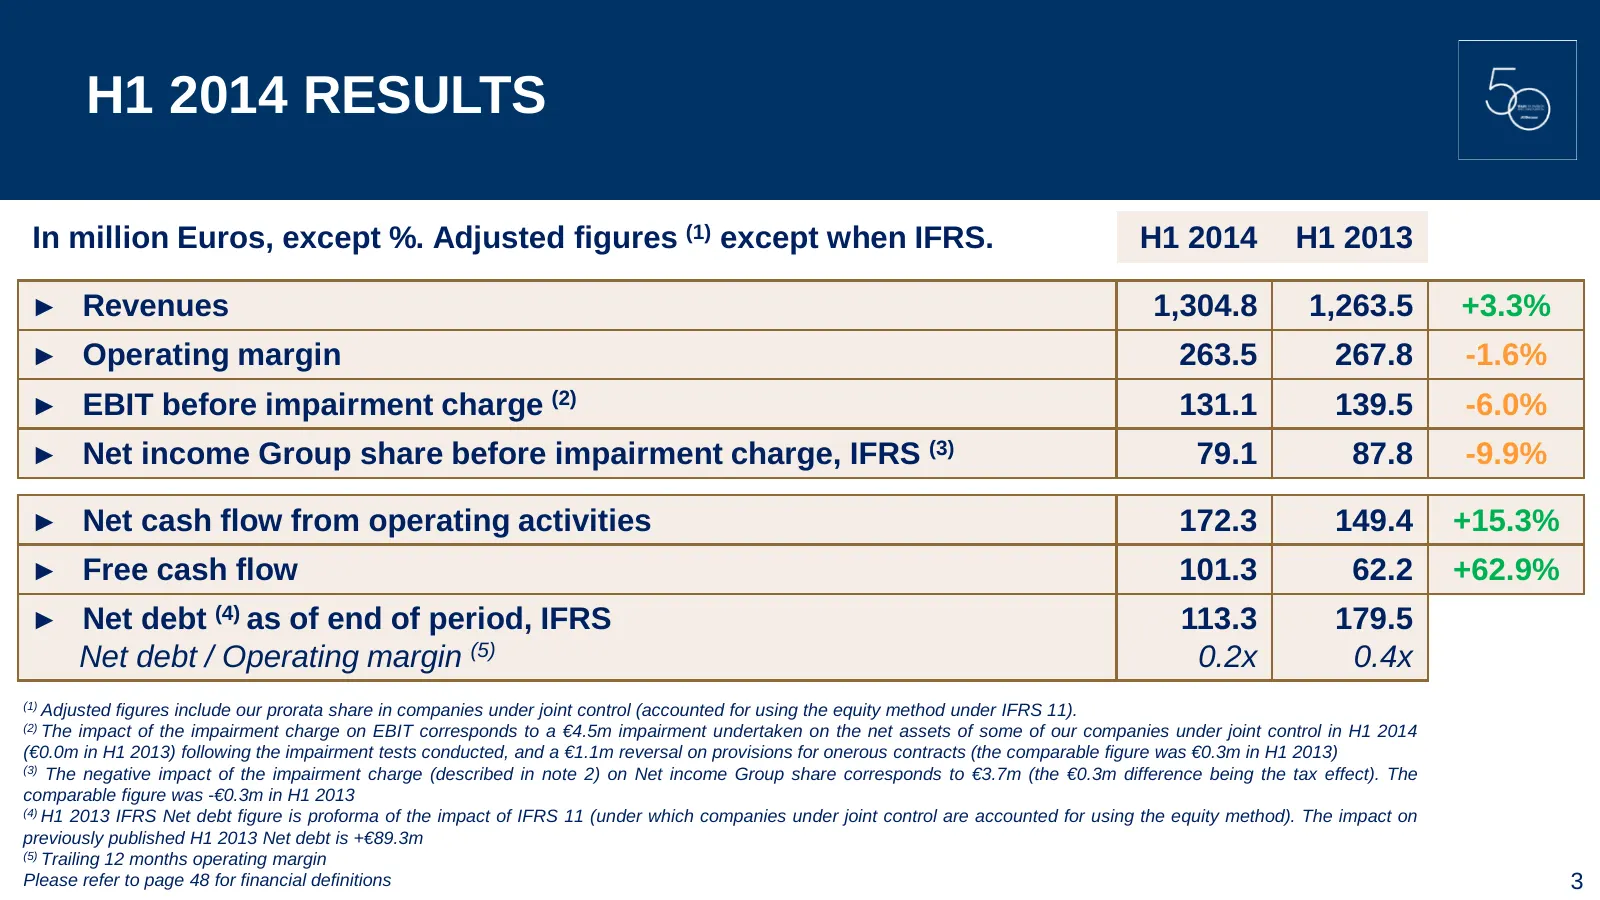
H1 2014 RESULTS In million Euros, except %. Adjusted figures (1) except when IFRS. H1 2014 H1 2013 ► Revenues 1,304.8 1,263.5 +3.3% ► Operating margin 263.5 267.8 -1.6% ► EBIT before impairment charge (2) 131.1 139.5 -6.0% ► Net income Group share before impairment charge, IFRS (3) 79.1 87.8 -9.9% ►
Slide 4: H1 2014 Adjusted Revenue Growth by Segment
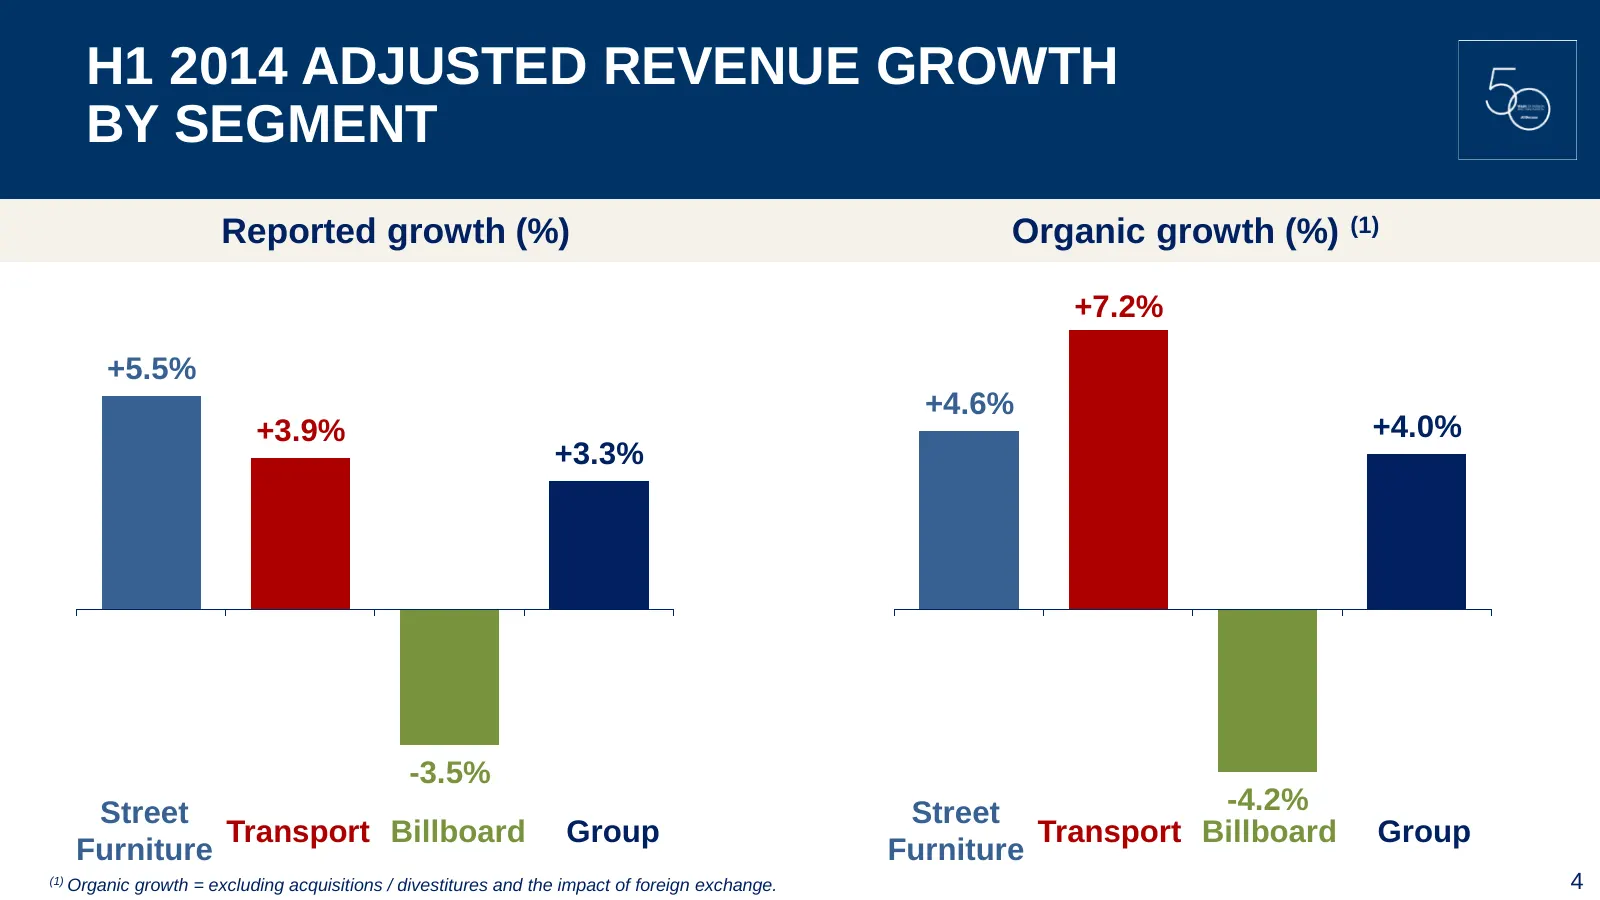
H1 2014 ADJUSTED REVENUE GROWTH BY SEGMENT Reported growth (%) Organic growth (%) (1) +7.2% +5.5% +4.6% +3.9% +4.0% +3.3% -3.5% Street Street -4.2% Transport Billboard Group Transport Billboard Group Furniture Furniture (1) Organic growth = excluding acquisitions / divestitures and the impact of for
Slide 5: H1 2014 Adjusted Revenue Growth by Region
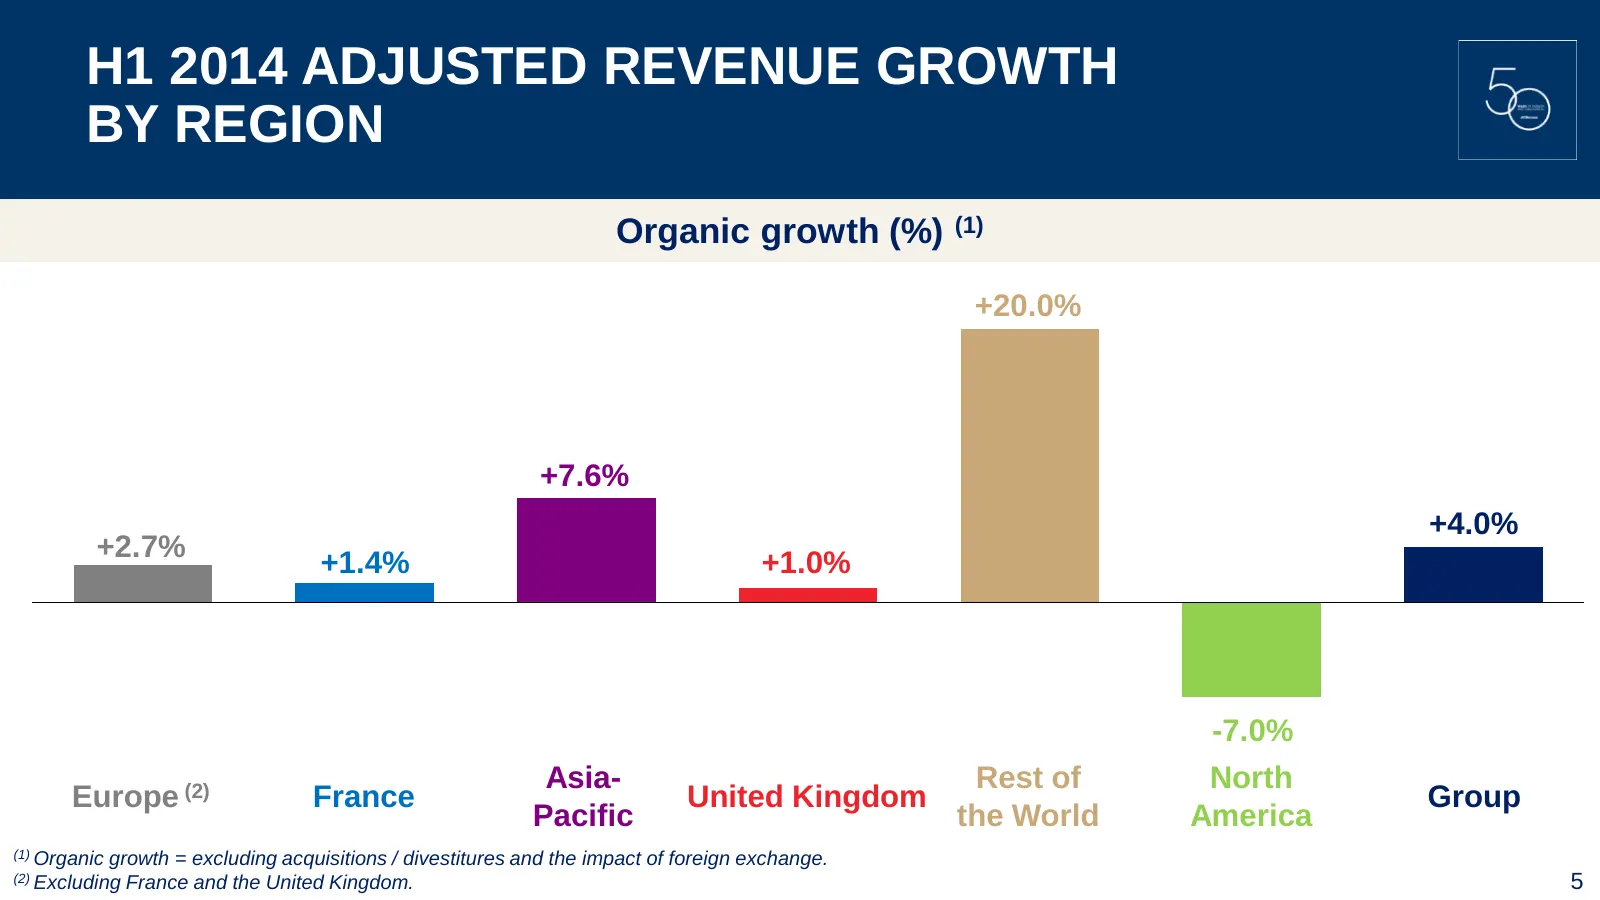
H1 2014 ADJUSTED REVENUE GROWTH BY REGION Organic growth (%) (1) +20.0% +7.6% +4.0% +2.7% +1.4% +1.0% -7.0% Asia- Rest of North Europe (2) France United Kingdom Group Pacific the World America (1) Organic growth = excluding acquisitions / divestitures and the impact of foreign exchange. (2) Excludin
Slide 6: H1 2014 Adjusted Revenue Breakdown
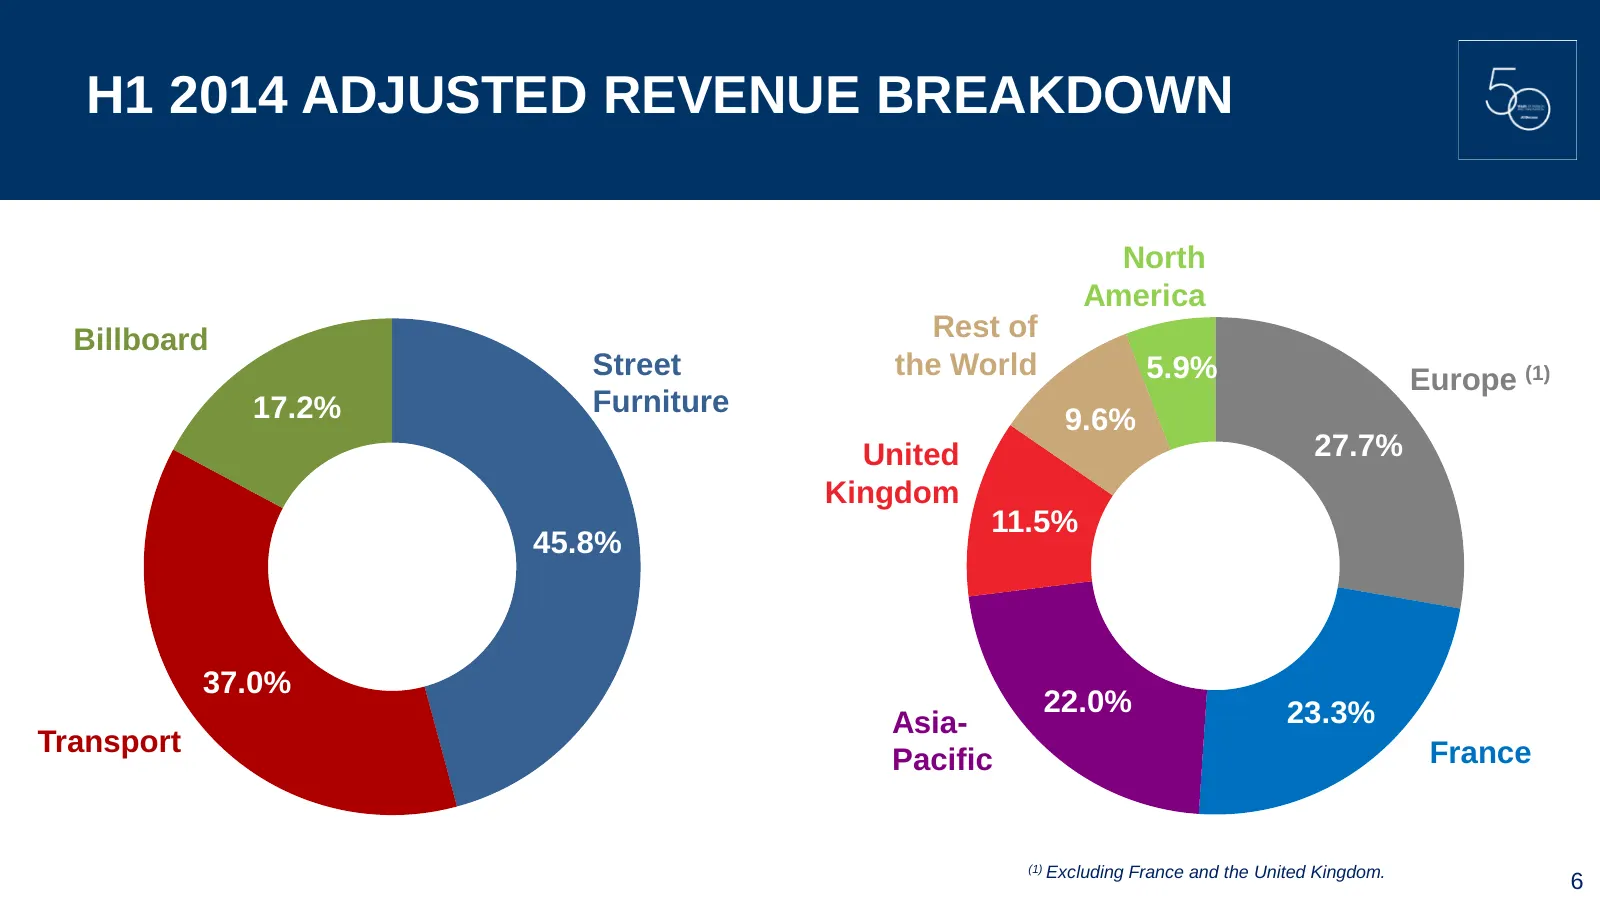
H1 2014 ADJUSTED REVENUE BREAKDOWN North America Billboard Rest of Street the World 5.9% Europe (1) 17.2% Furniture 9.6% United 27.7% Kingdom 11.5% 45.8% 37.0% 22.0% 23.3% Asia- Transport France Pacific (1) Excluding France and the United Kingdom. 6
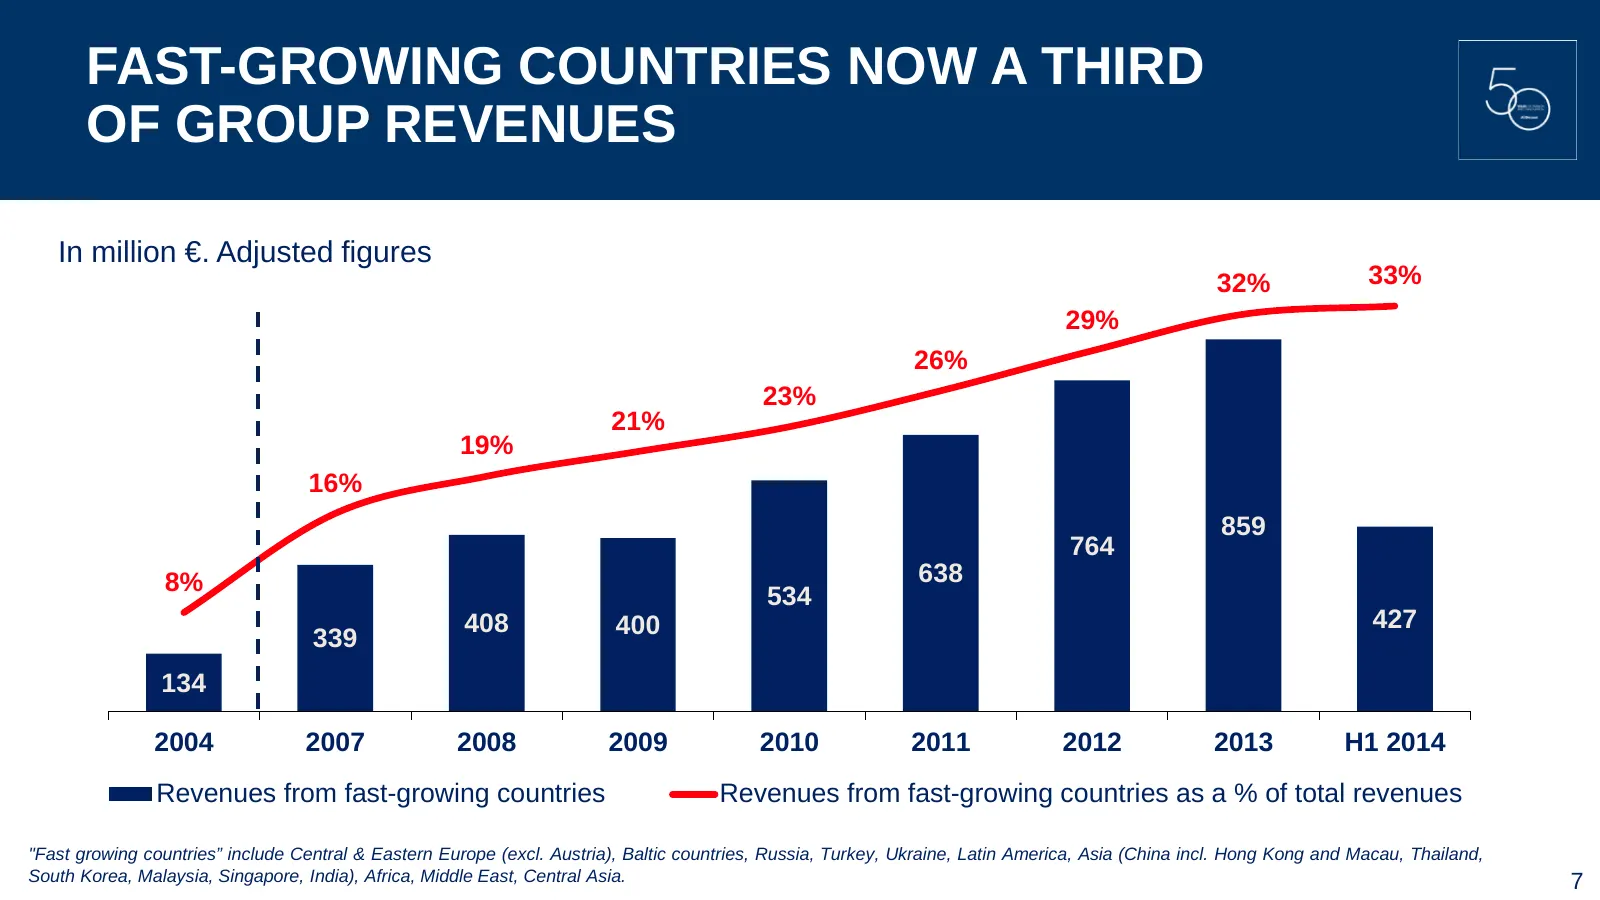
Slide 7: Fast-Growing Countries Now a Third of Group Revenues
FAST-GROWING COUNTRIES NOW A THIRD OF GROUP REVENUES In million €. Adjusted figures 32% 33% 29% 26% 23% 21% 19% 16% 859 764 8% 638 534 408 400 427 339 134 2004 2007 2008 2009 2010 2011 2012 2013 H1 2014 Revenues from fast-growing countries Revenues from fast-growing countries as a % of total revenue
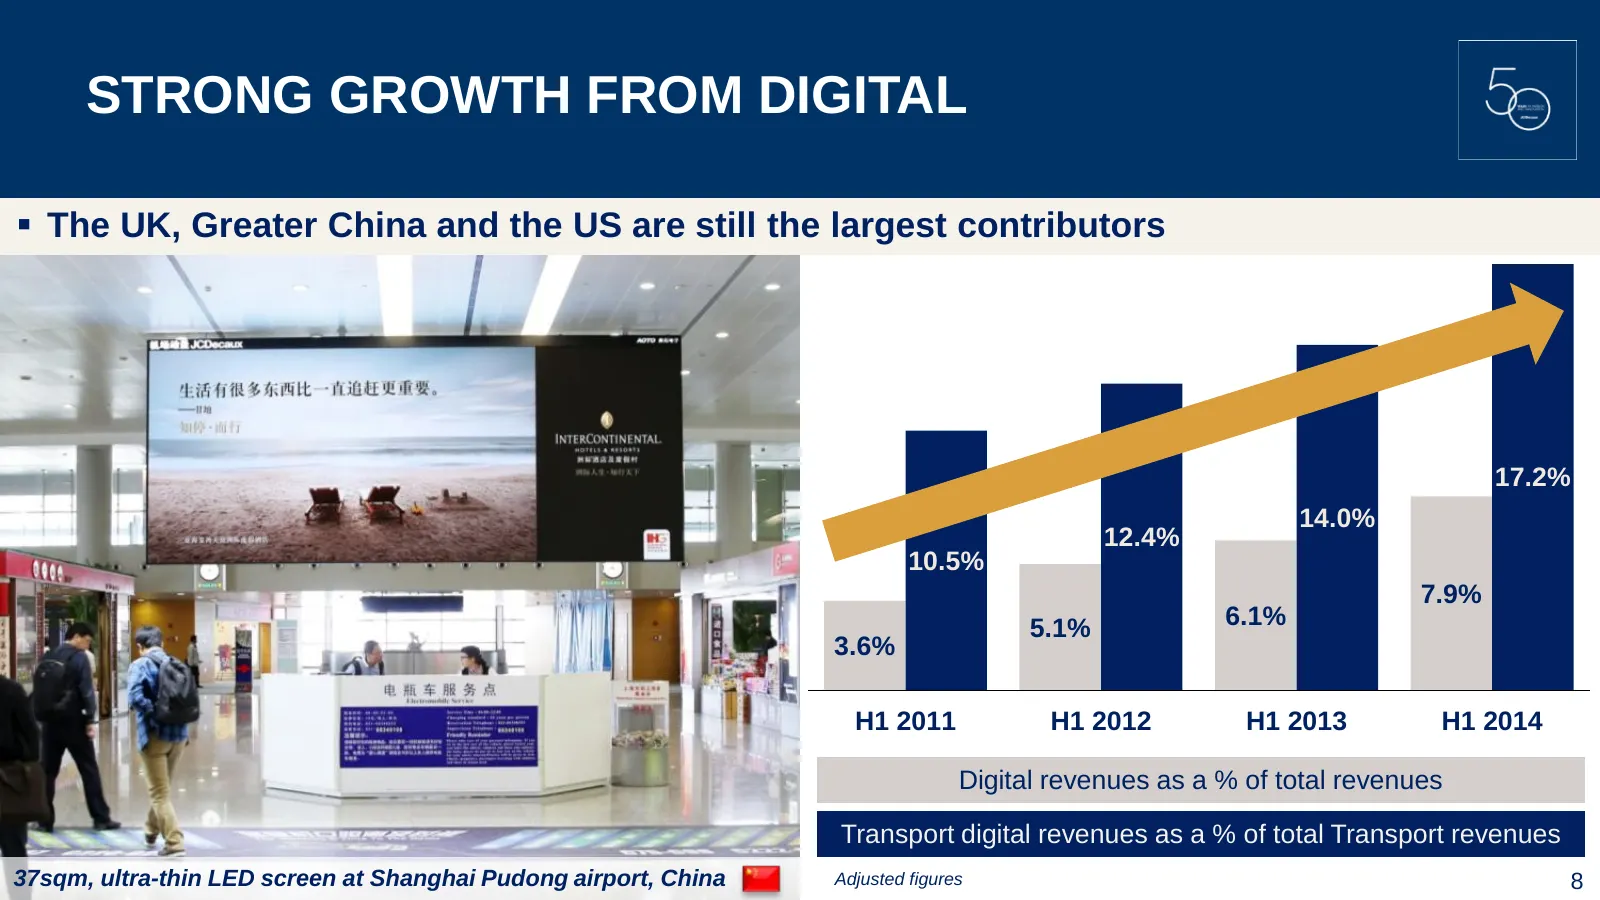
Slide 8: Strong Growth from Digital
STRONG GROWTH FROM DIGITAL The UK, Greater China and the US are still the largest contributors 17.2% 14.0% 12.4% 10.5% 7.9% 5.1% 6.1% 3.6% H1 2011 H1 2012 H1 2013 H1 2014 Digital revenues as a % of total revenues Transport digital revenues as a % of total Transport revenues 37sqm, ultra-thin LED s
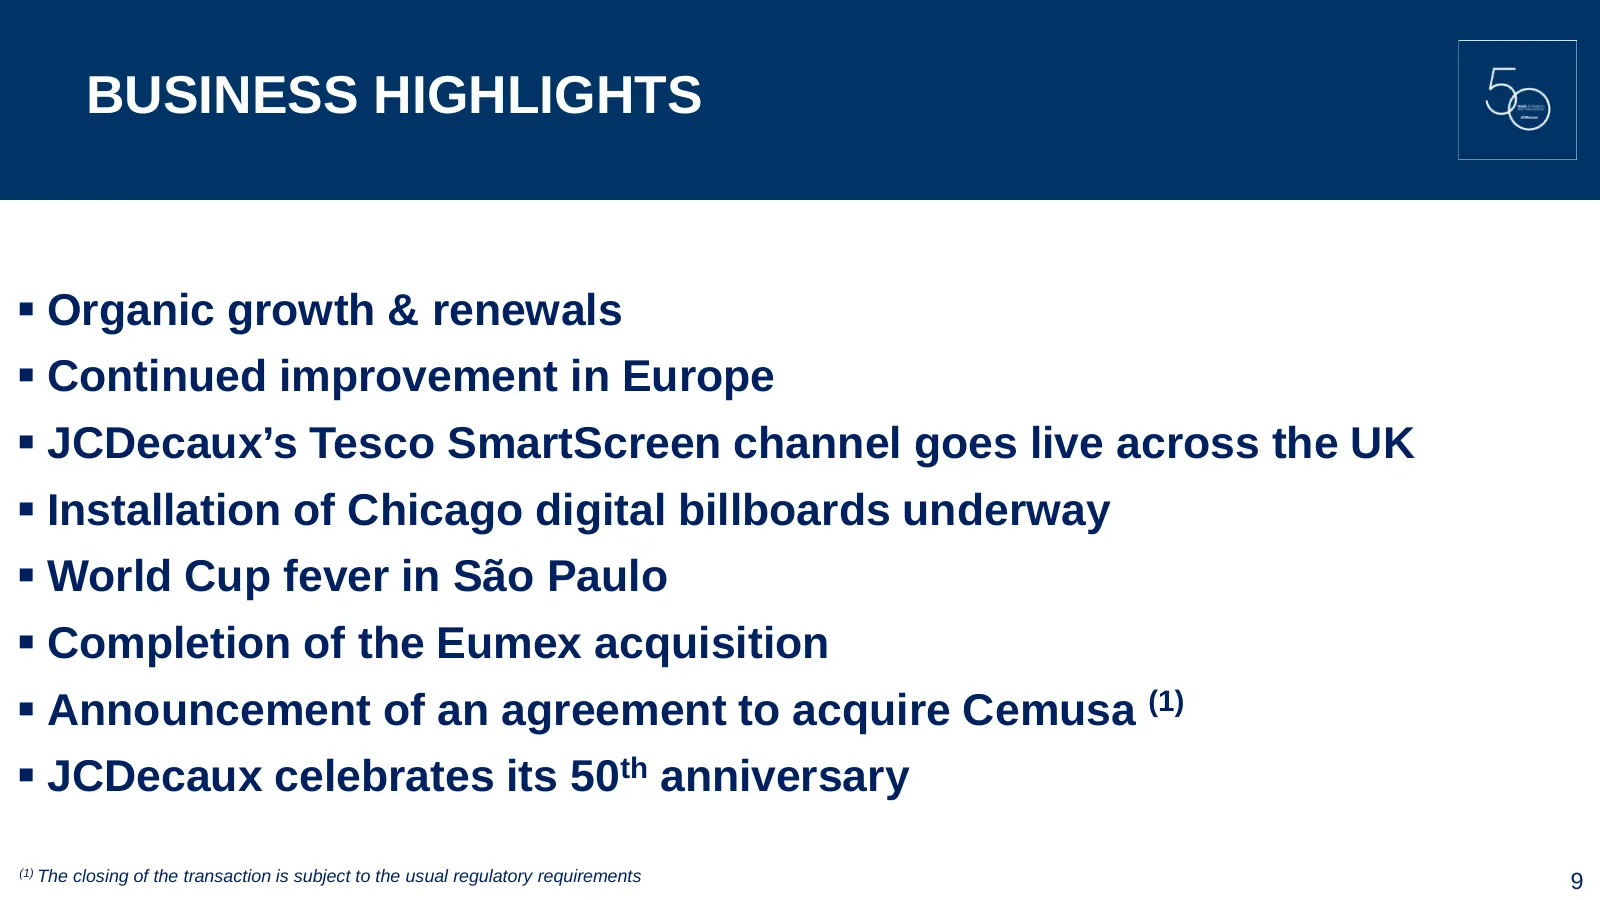
Slide 9: Business Highlights
BUSINESS HIGHLIGHTS Organic growth & renewals Continued improvement in Europe JCDecaux’s Tesco SmartScreen channel goes live across the UK Installation of Chicago digital billboards underway World Cup fever in São Paulo Completion of the Eumex acquisition Announcement of an agreement t
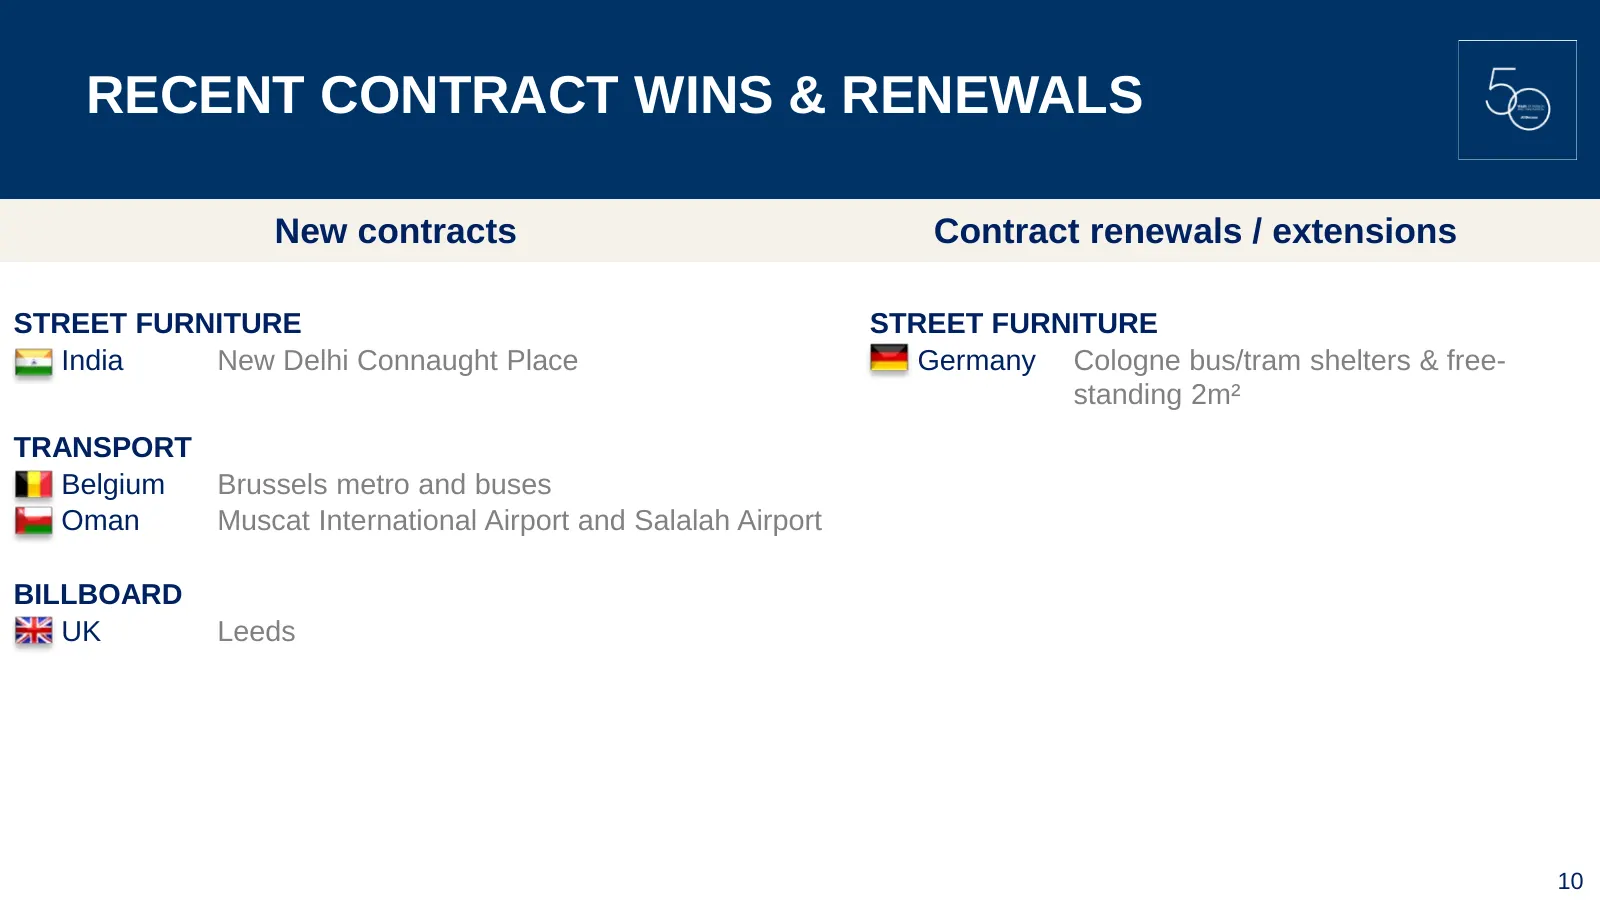
Slide 10: Recent Contract Wins & Renewals
RECENT CONTRACT WINS & RENEWALS New contracts Contract renewals / extensions STREET FURNITURE STREET FURNITURE India New Delhi Connaught Place Germany Cologne bus/tram shelters & free- standing 2m² TRANSPORT Belgium Brussels metro and buses Oman Muscat International Airport and Salalah Airport BILLB
Slide 11: Landmark Contract Renewal in Germany
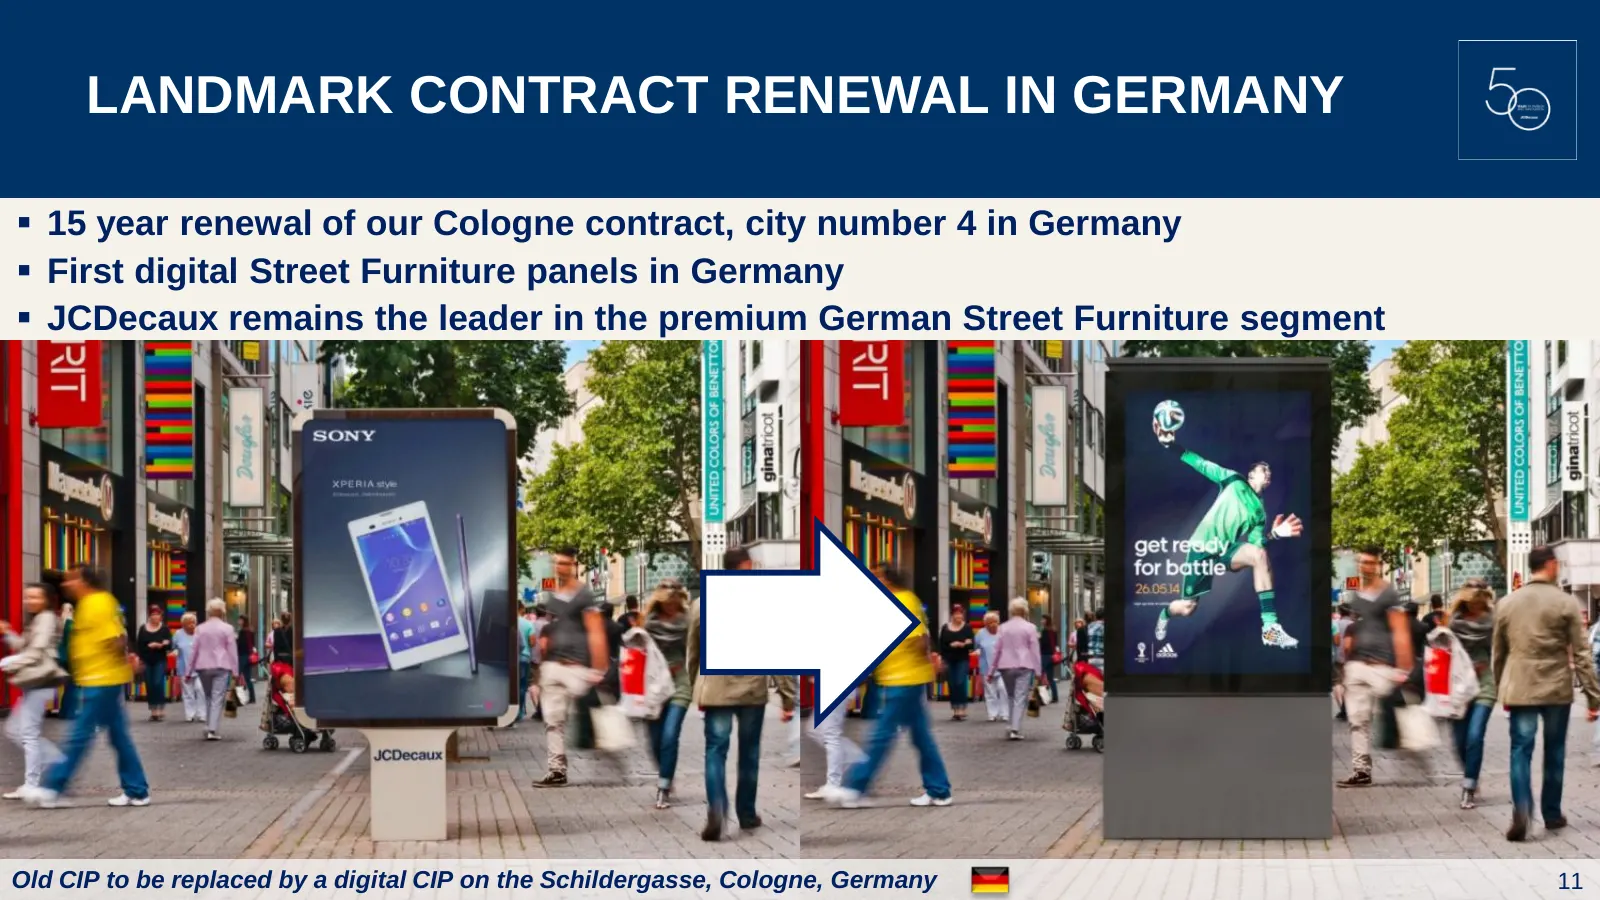
LANDMARK CONTRACT RENEWAL IN GERMANY 15 year renewal of our Cologne contract, city number 4 in Germany First digital Street Furniture panels in Germany JCDecaux remains the leader in the premium German Street Furniture segment Old CIP to be replaced by a digital CIP on the Schildergasse, Colog
Slide 12: Continued Improvement in Europe
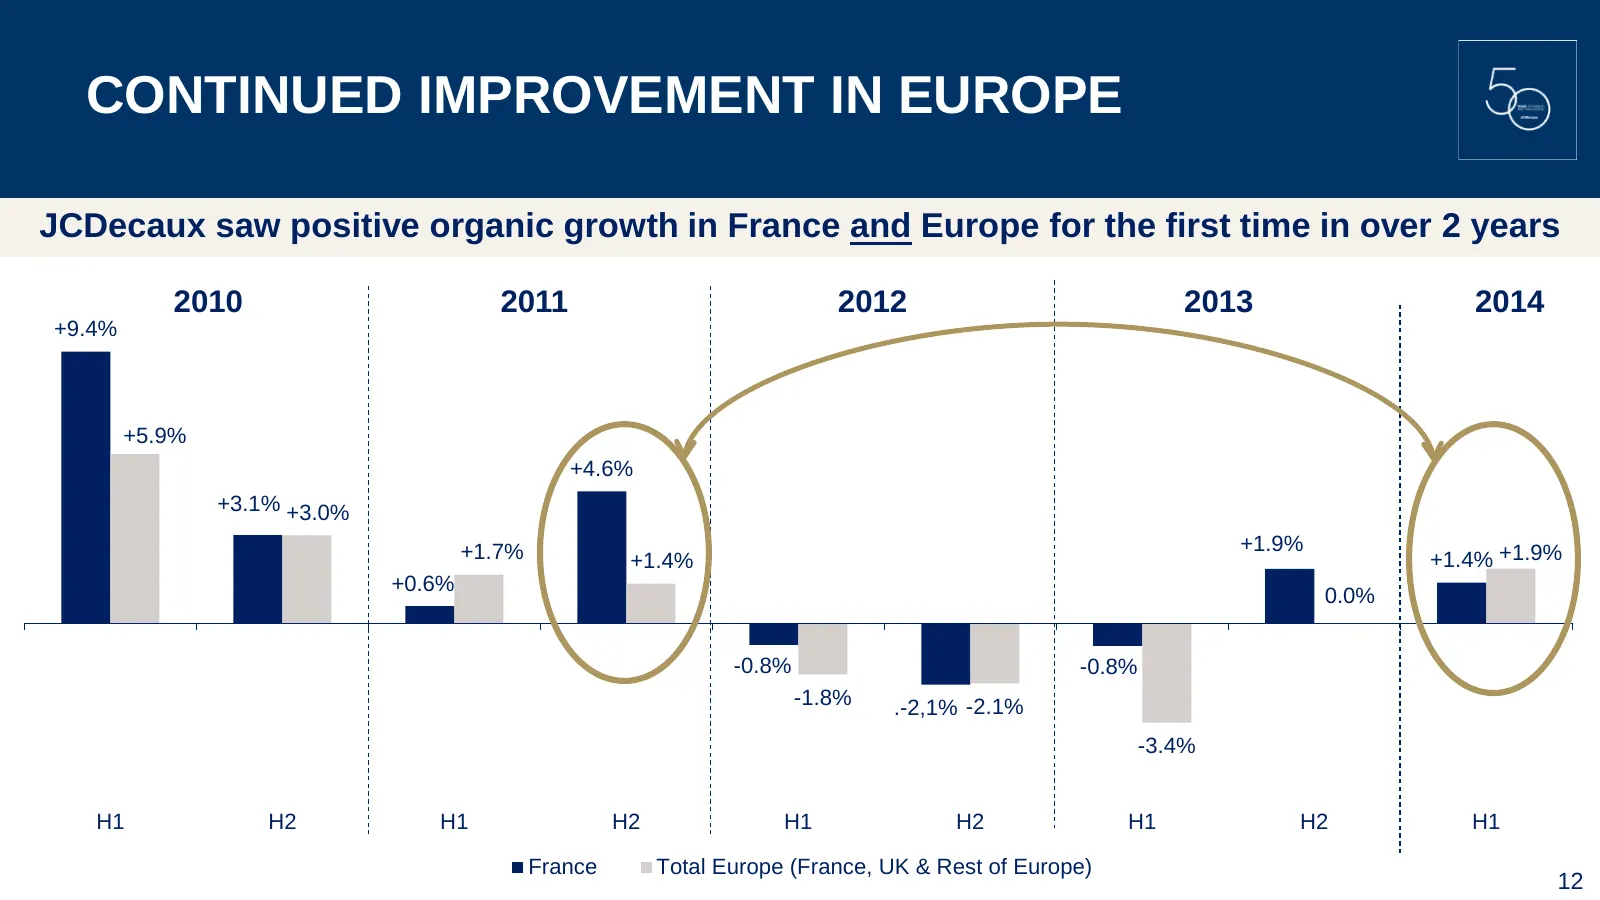
CONTINUED IMPROVEMENT IN EUROPE JCDecaux saw positive organic growth in France and Europe for the first time in over 2 years 2010 2011 2012 2013 2014 +9.4% +5.9% +4.6% +3.1% +3.0% +1.7% +1.9% +1.4% +1.4% +1.9% +0.6% 0.0% -0.8% -0.8% -1.8% .-2,1% -2.1% -3.4% H1 H2 H1 H2 H1 H2 H1 H2 H1 France Total Eu
Slide 13: Tesco SmartScreen Channel Goes Live Across the UK
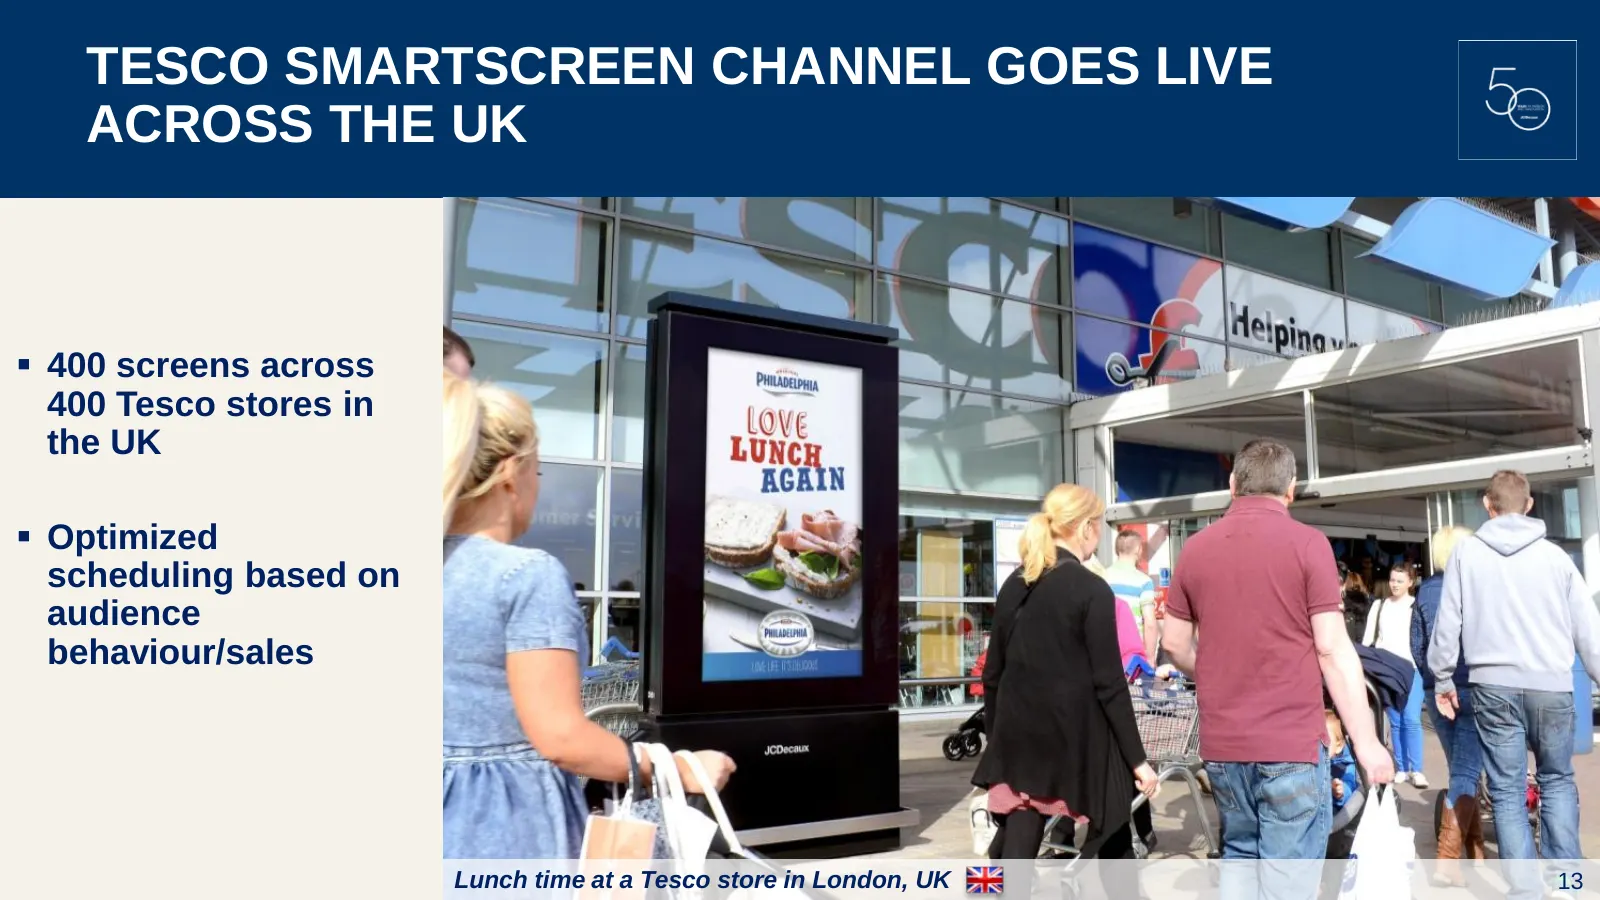
TESCO SMARTSCREEN CHANNEL GOES LIVE ACROSS THE UK 400 screens across 400 Tesco stores in the UK Optimized scheduling based on audience behaviour/sales Lunch time at a Tesco store in London, UK 13
Slide 14: Installation of Chicago Digital Billboards Underway
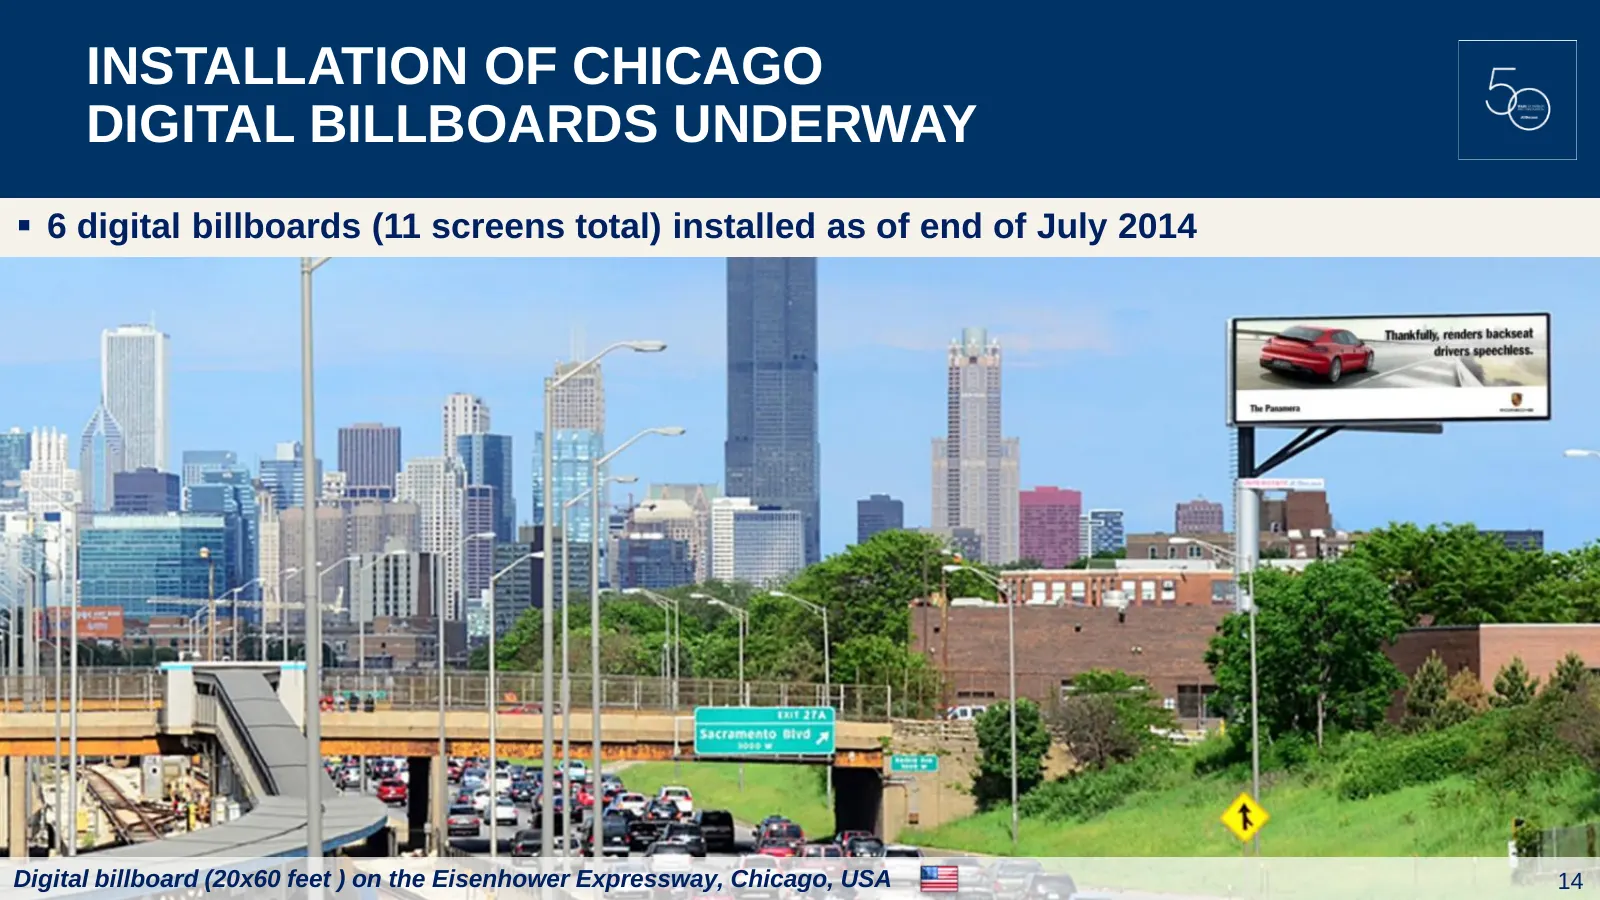
INSTALLATION OF CHICAGO DIGITAL BILLBOARDS UNDERWAY 6 digital billboards (11 screens total) installed as of end of July 2014 Digital billboard (20x60 feet ) on the Eisenhower Expressway, Chicago, USA 14

Slide 15: World Cup Fever in São Paulo
WORLD CUP FEVER IN SÃO PAULO Commercial success of the launch of our premium advertising network Public could follow live scores of the World Cup games on the clocks National team supporters sent messages to be displayed all over São Paulo via the web São Paulo, Brazil 15
Slide 16: JCDecaux Is the Number One Outdoor Advertising Company in LatAm
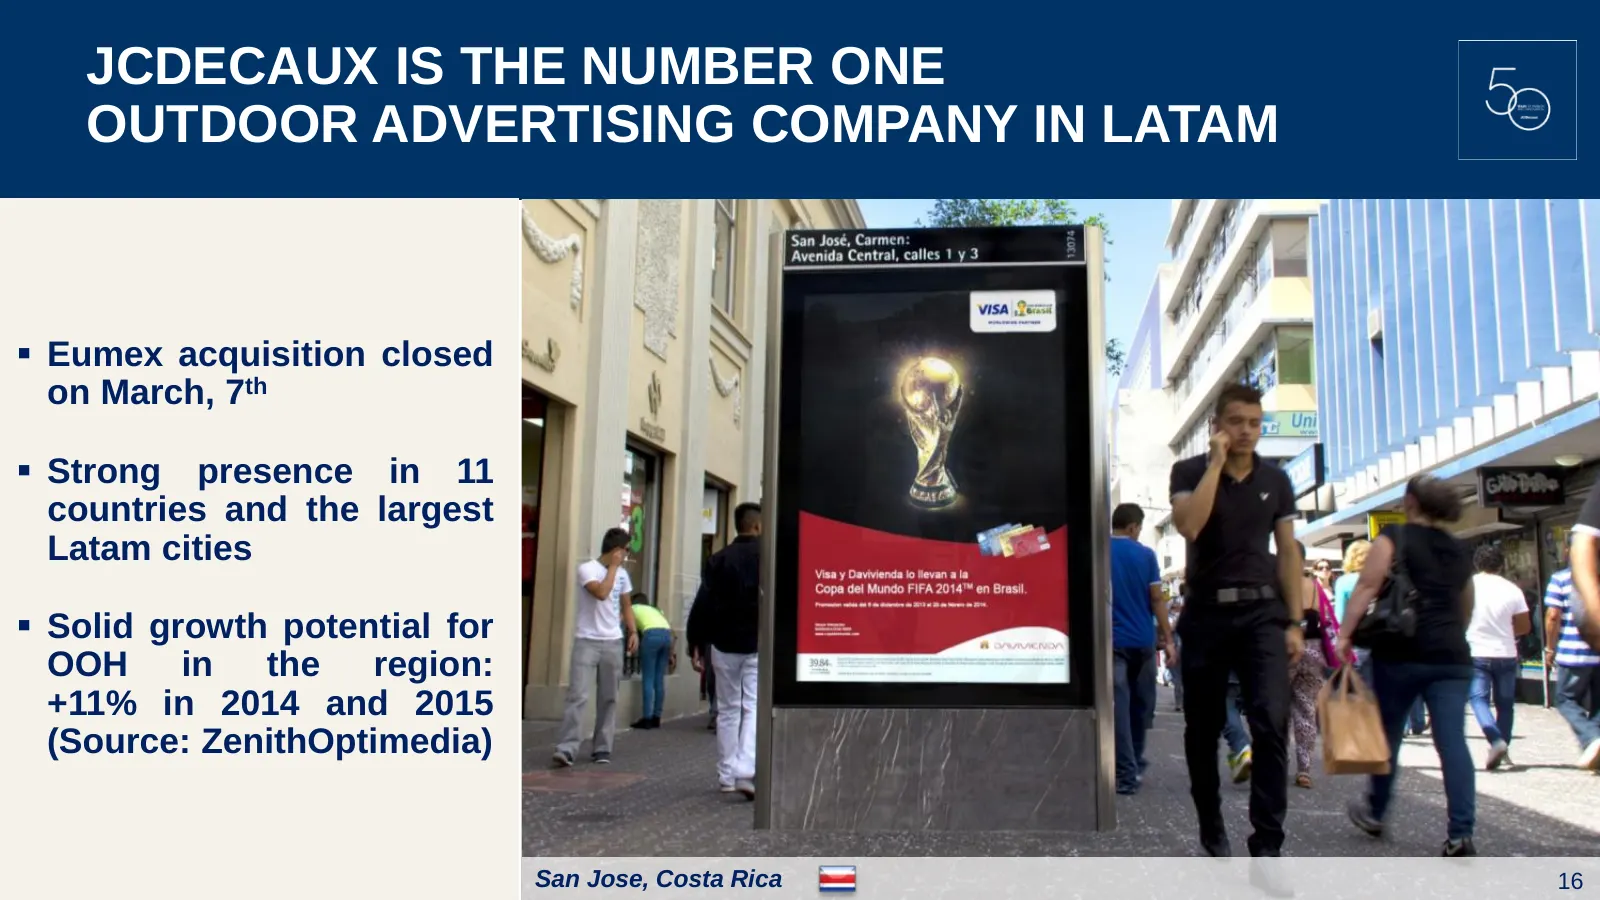
JCDECAUX IS THE NUMBER ONE OUTDOOR ADVERTISING COMPANY IN LATAM Eumex acquisition closed on March, 7th Strong presence in 11 countries and the largest Latam cities Solid growth potential for OOH in the region: +11% in 2014 and 2015 (Source: ZenithOptimedia) San Jose, Costa Rica 16
Slide 17: Cemusa Acquisition: Stronger Footprint in the Americas and Southern Europe
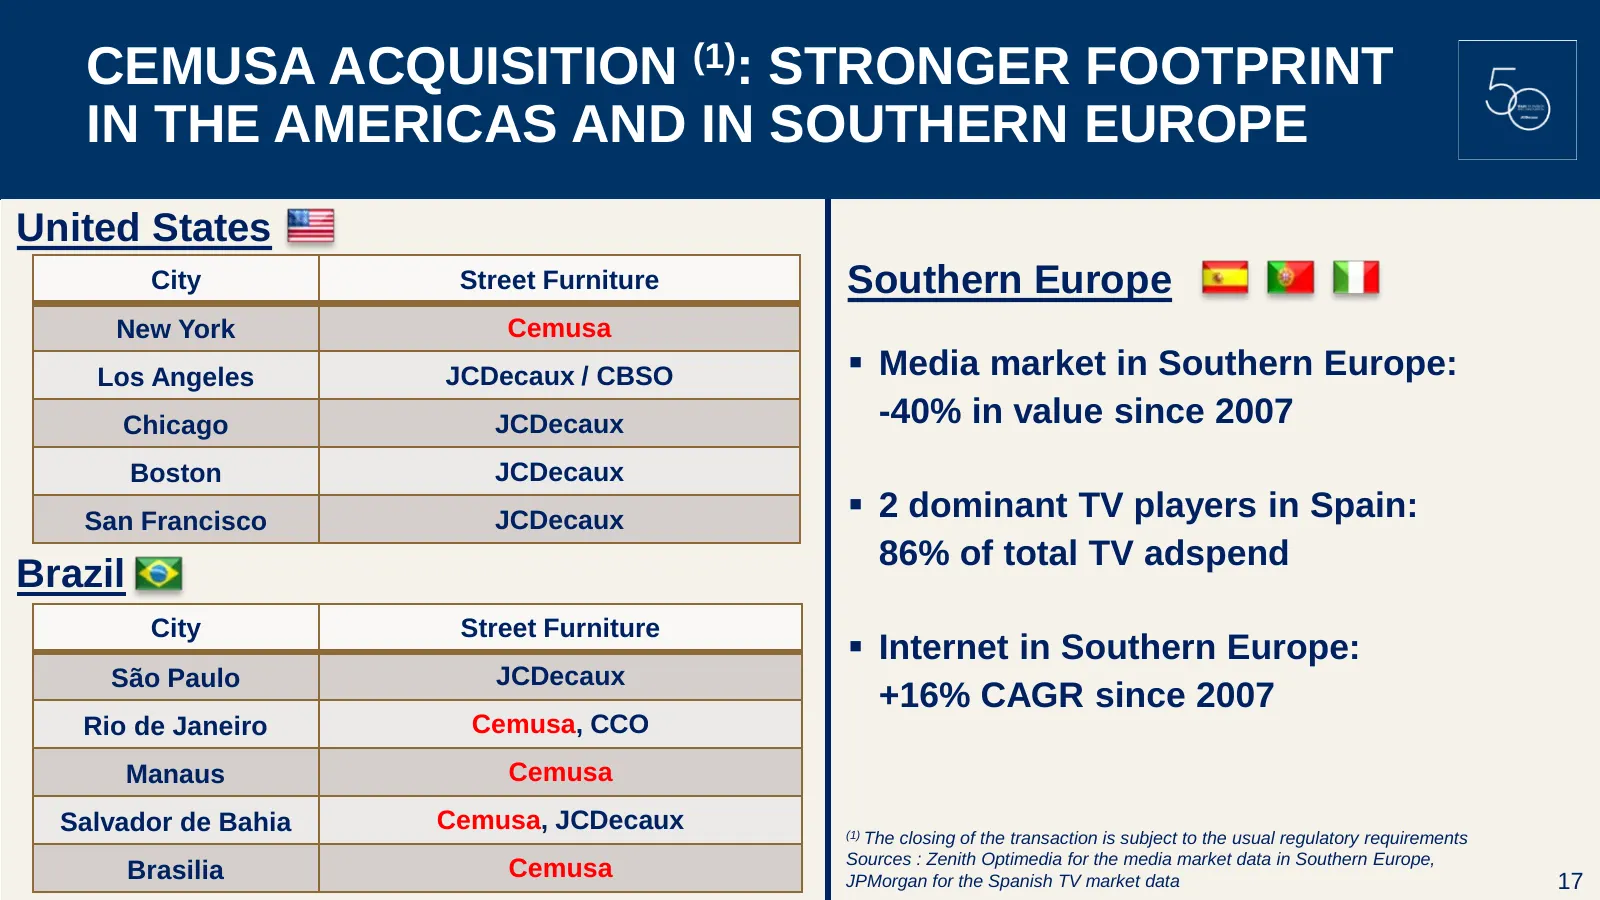
CEMUSA ACQUISITION (1): STRONGER FOOTPRINT IN THE AMERICAS AND IN SOUTHERN EUROPE United States City Street Furniture Southern Europe New York Cemusa Los Angeles JCDecaux / CBSO Media market in Southern Europe: Chicago JCDecaux -40% in value since 2007 Boston JCDecaux San Francisco JCDecaux 2 do
Slide 18: JCDecaux Celebrates Its 50th Anniversary
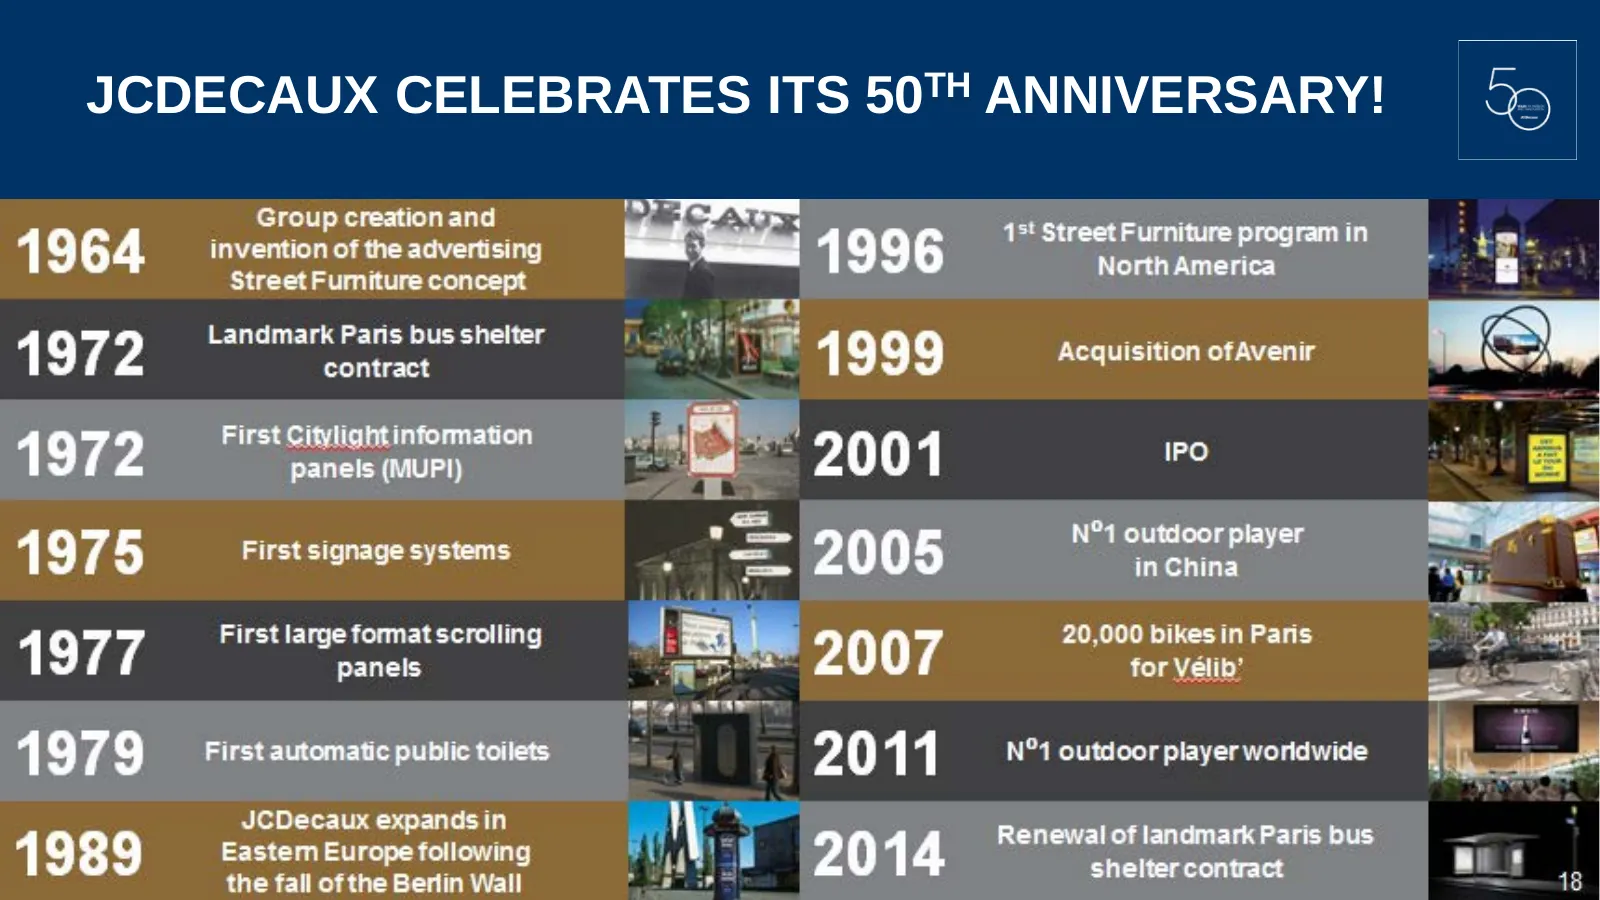
JCDECAUX CELEBRATES ITS 50TH ANNIVERSARY!

Slide 19: Financial Highlights
FINANCIAL HIGHLIGHTS Laurence Debroux Executive Vice-President, Finance & Administration
Slide 20: H1 2014 Results
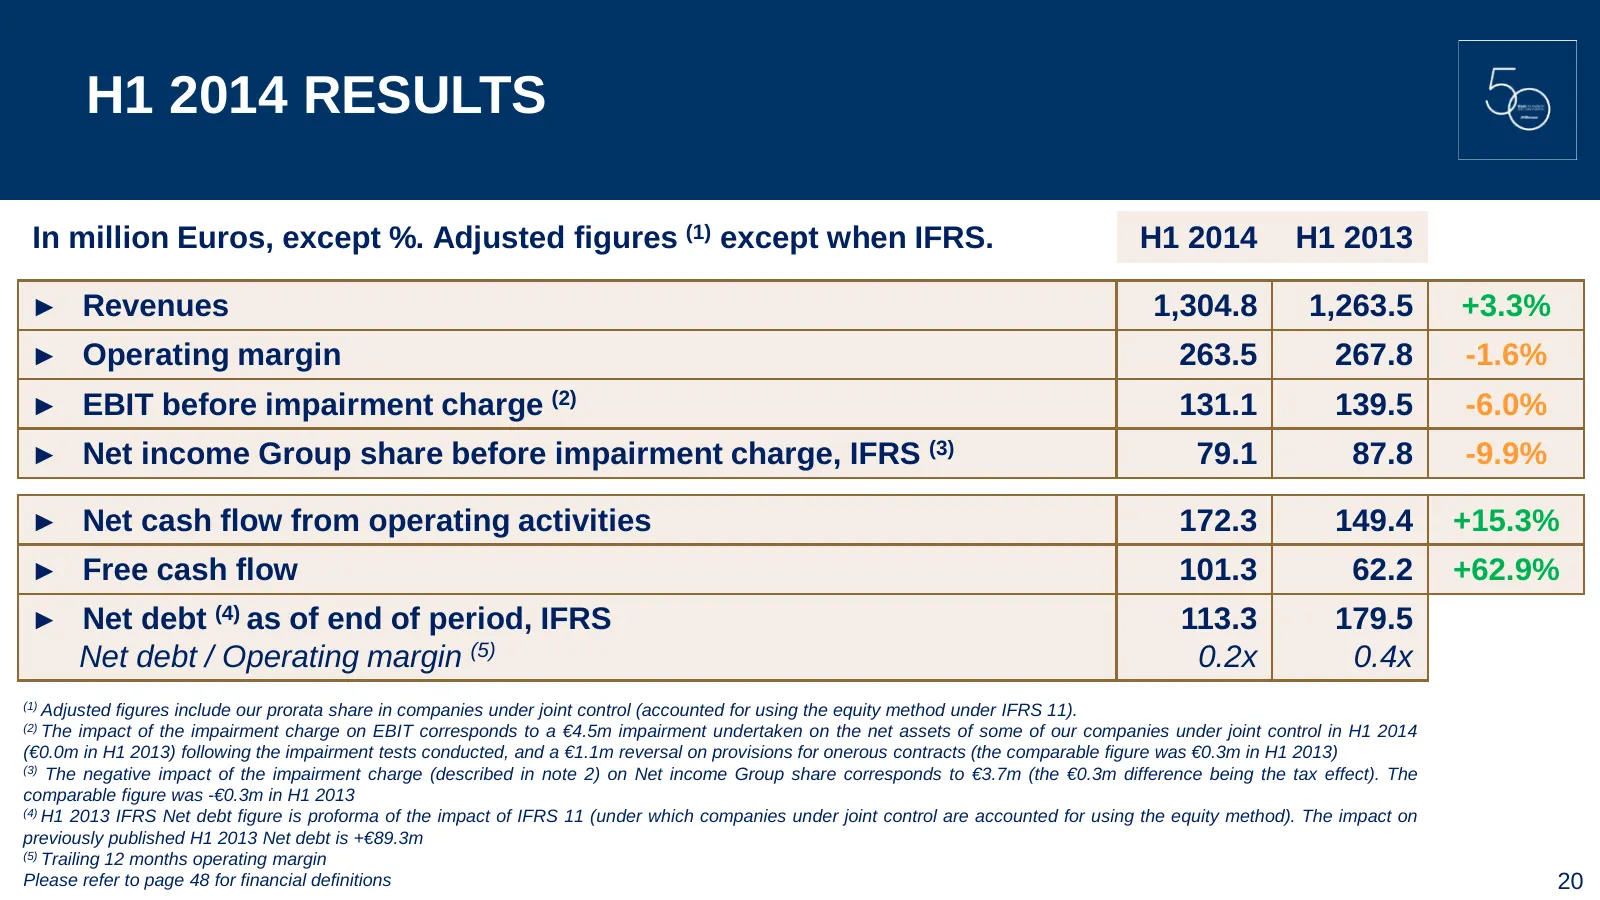
H1 2014 RESULTS In million Euros, except %. Adjusted figures (1) except when IFRS. H1 2014 H1 2013 ► Revenues 1,304.8 1,263.5 +3.3% ► Operating margin 263.5 267.8 -1.6% ► EBIT before impairment charge (2) 131.1 139.5 -6.0% ► Net income Group share before impairment charge, IFRS (3) 79.1 87.8 -9.9% ►
Slide 21: Analysis of Operating Margin
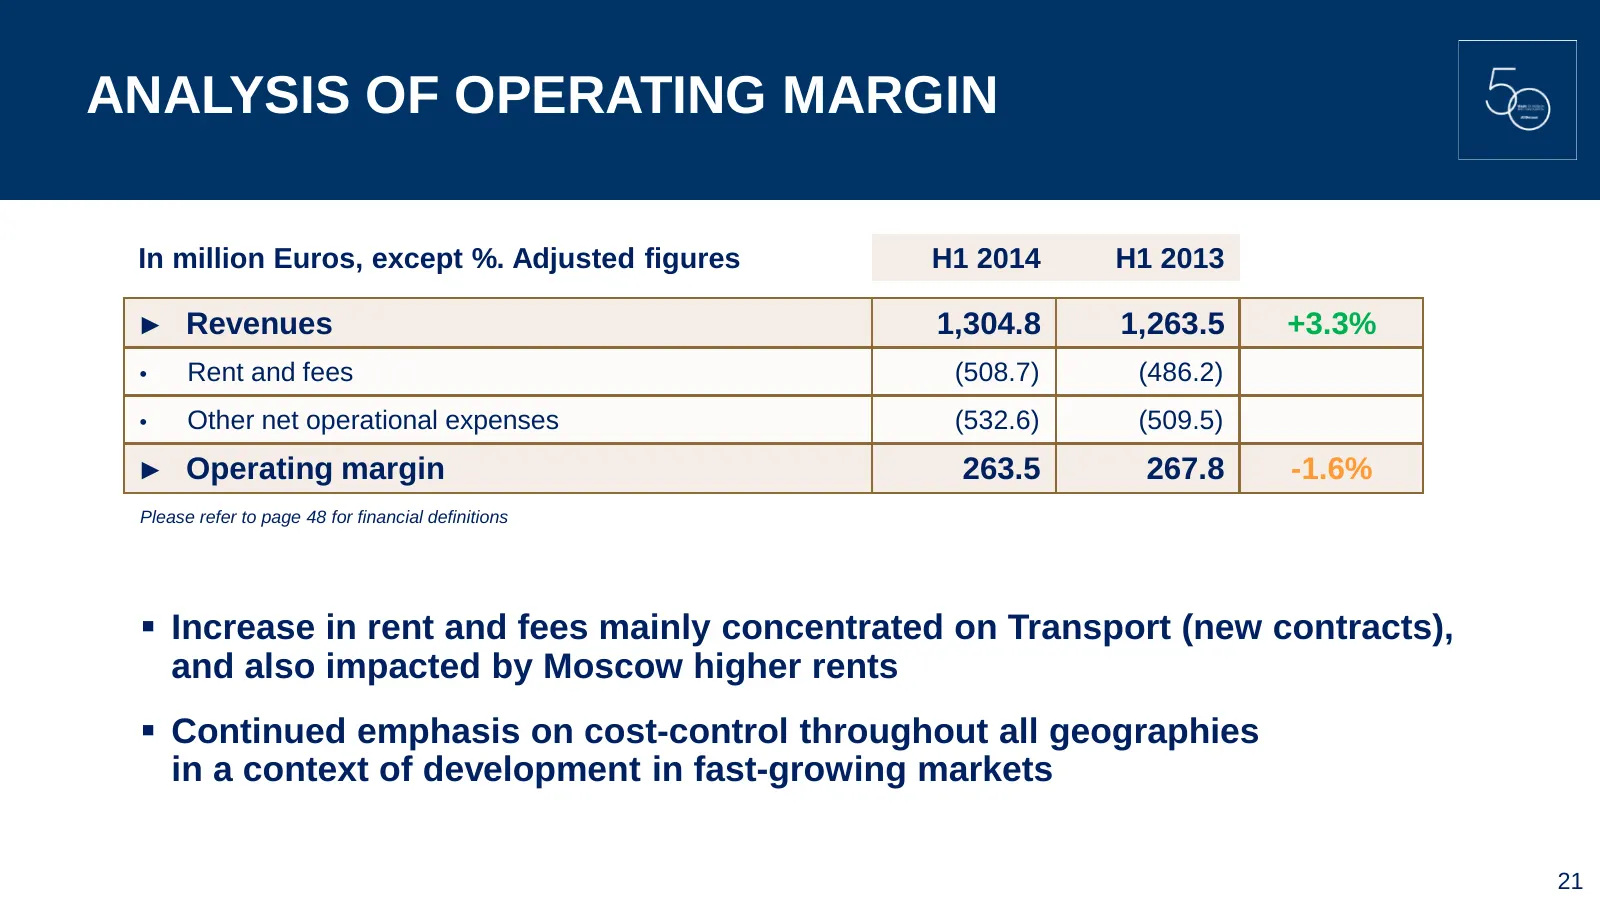
ANALYSIS OF OPERATING MARGIN In million Euros, except %. Adjusted figures H1 2014 H1 2013 ► Revenues 1,304.8 1,263.5 +3.3% • Rent and fees (508.7) (486.2) • Other net operational expenses (532.6) (509.5) ► Operating margin 263.5 267.8 -1.6% Please refer to page 48 for financial definitions Increas
Slide 22: Operating Margin to EBIT
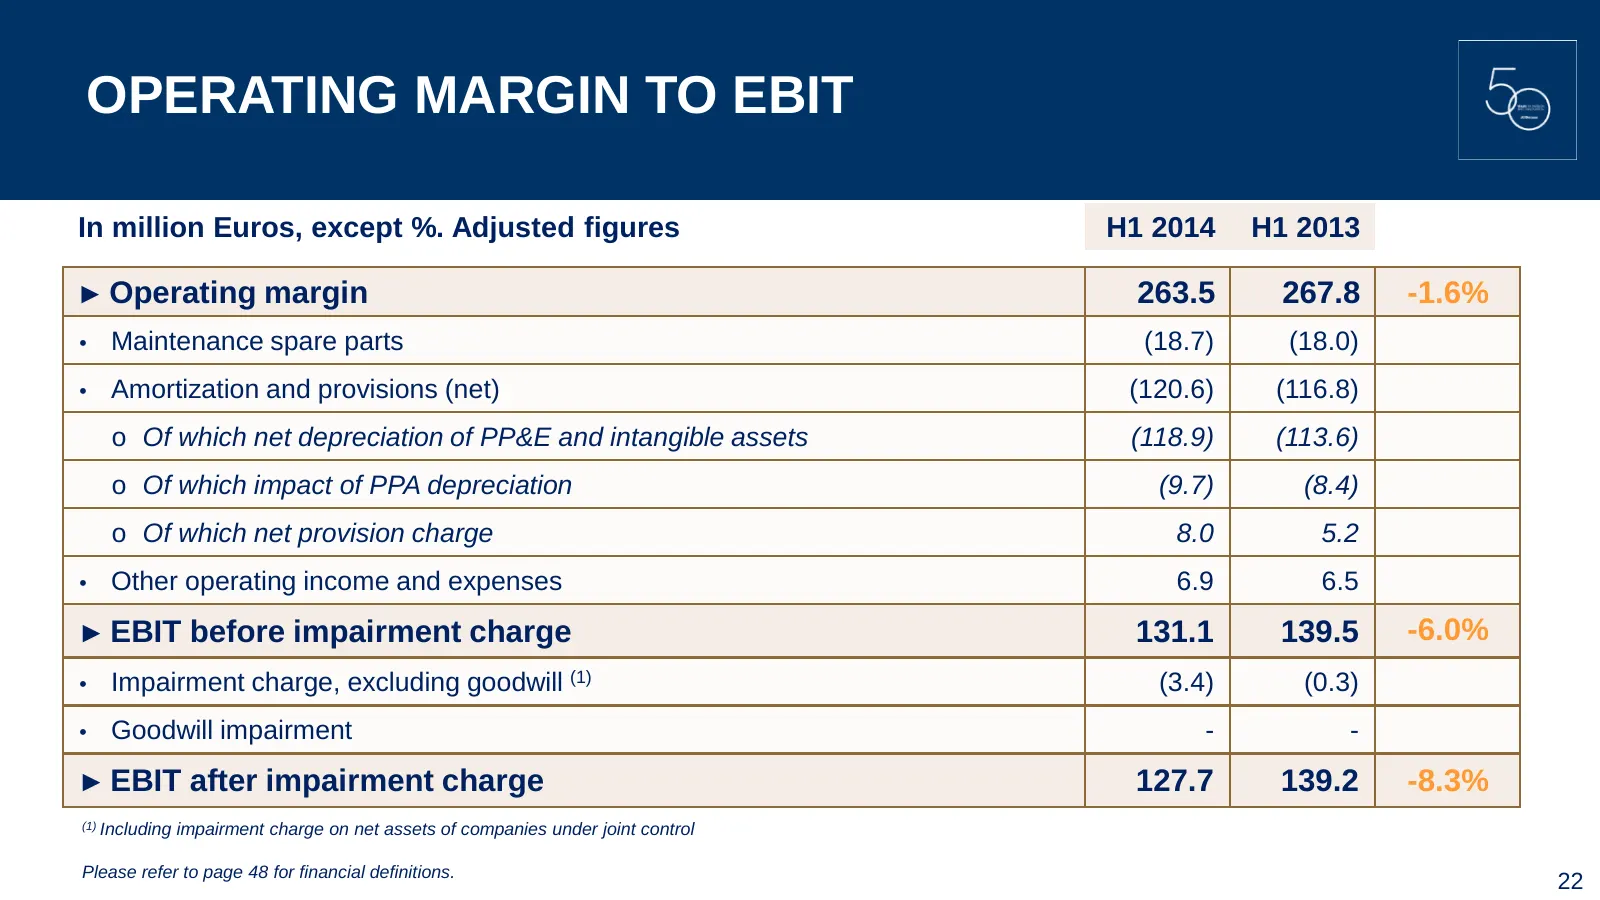
OPERATING MARGIN TO EBIT In million Euros, except %. Adjusted figures H1 2014 H1 2013 ► Operating margin 263.5 267.8 -1.6% • Maintenance spare parts (18.7) (18.0) • Amortization and provisions (net) (120.6) (116.8) o Of which net depreciation of PP&E and intangible assets (118.9) (113.6) o Of which
Slide 23: Margins by Segment
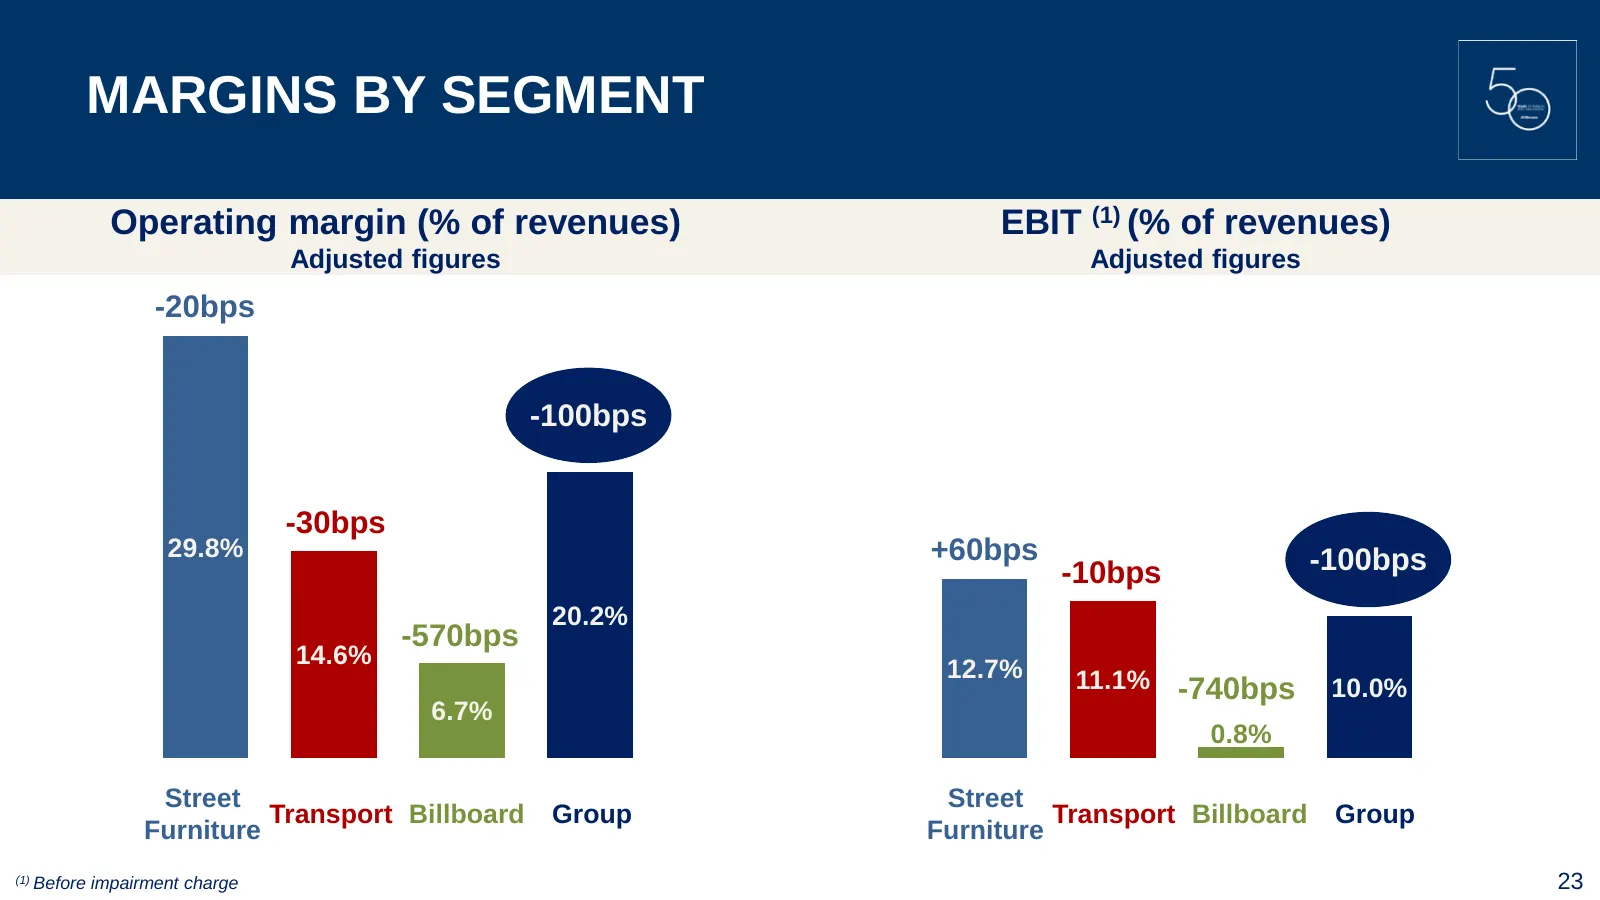
MARGINS BY SEGMENT Operating margin (% of revenues) EBIT (1) (% of revenues) Adjusted figures Adjusted figures -20bps -100bps -30bps 29.8% +60bps -10bps -100bps 20.2% -570bps 14.6% 12.7% 11.1% -740bps 10.0% 6.7% 0.8% Street Street Transport Billboard Group Transport Billboard Group Furniture Furnitu
Slide 24: EBIT to Net Income
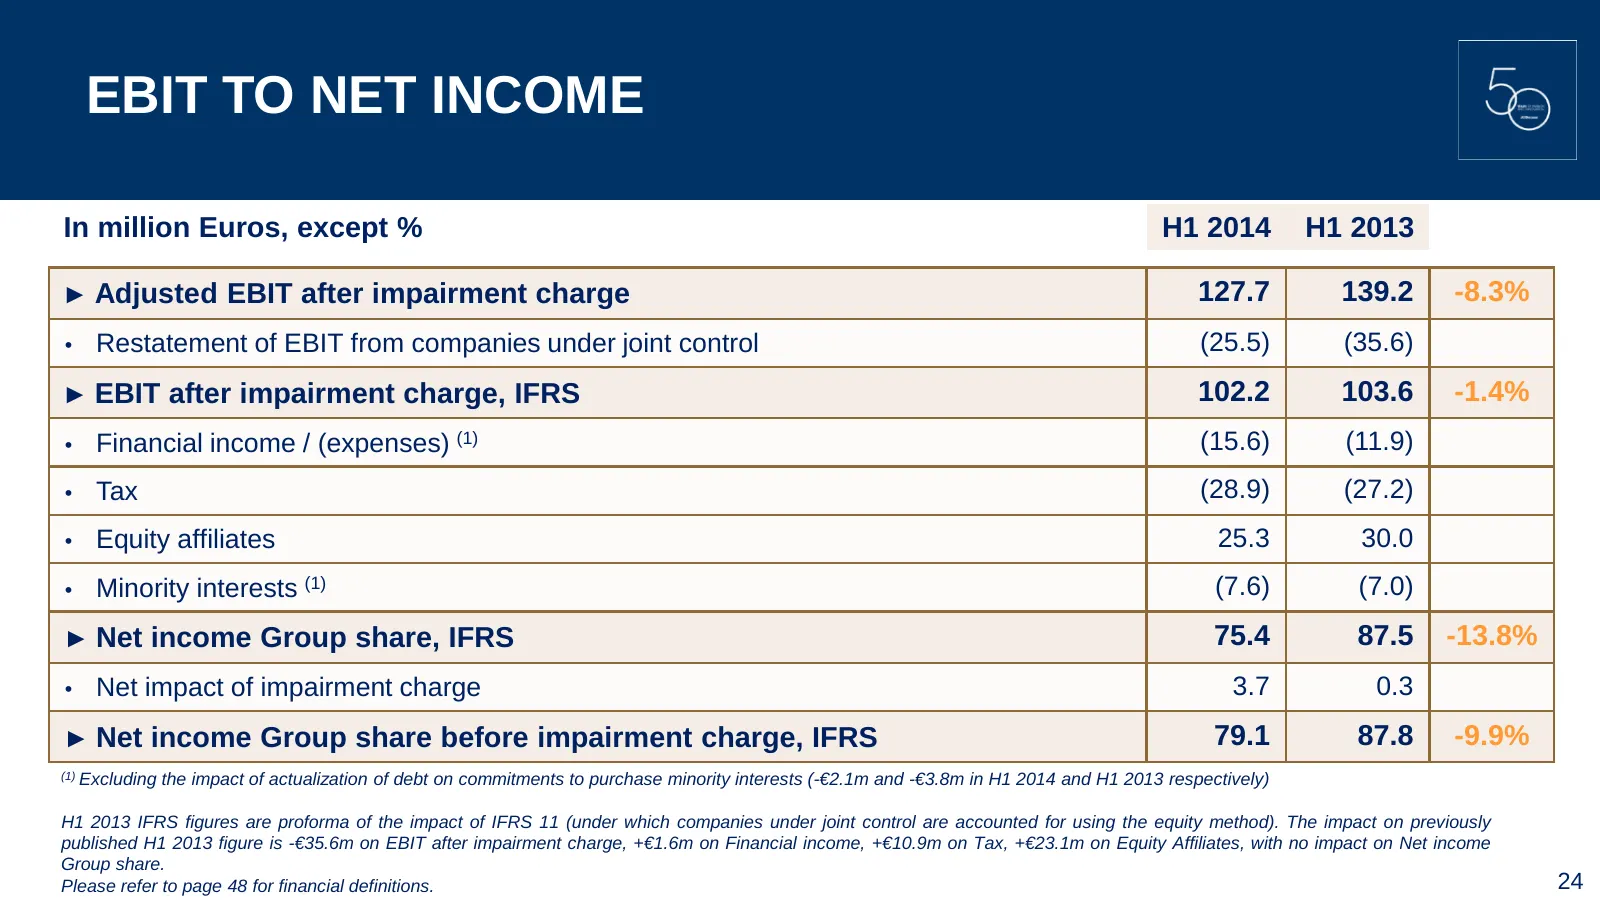
EBIT TO NET INCOME In million Euros, except % H1 2014 H1 2013 ► Adjusted EBIT after impairment charge 127.7 139.2 -8.3% • Restatement of EBIT from companies under joint control (25.5) (35.6) ► EBIT after impairment charge, IFRS 102.2 103.6 -1.4% • Financial income / (expenses) (1) (15.6) (11.9) • Ta
Slide 25: Cash Flow Statement
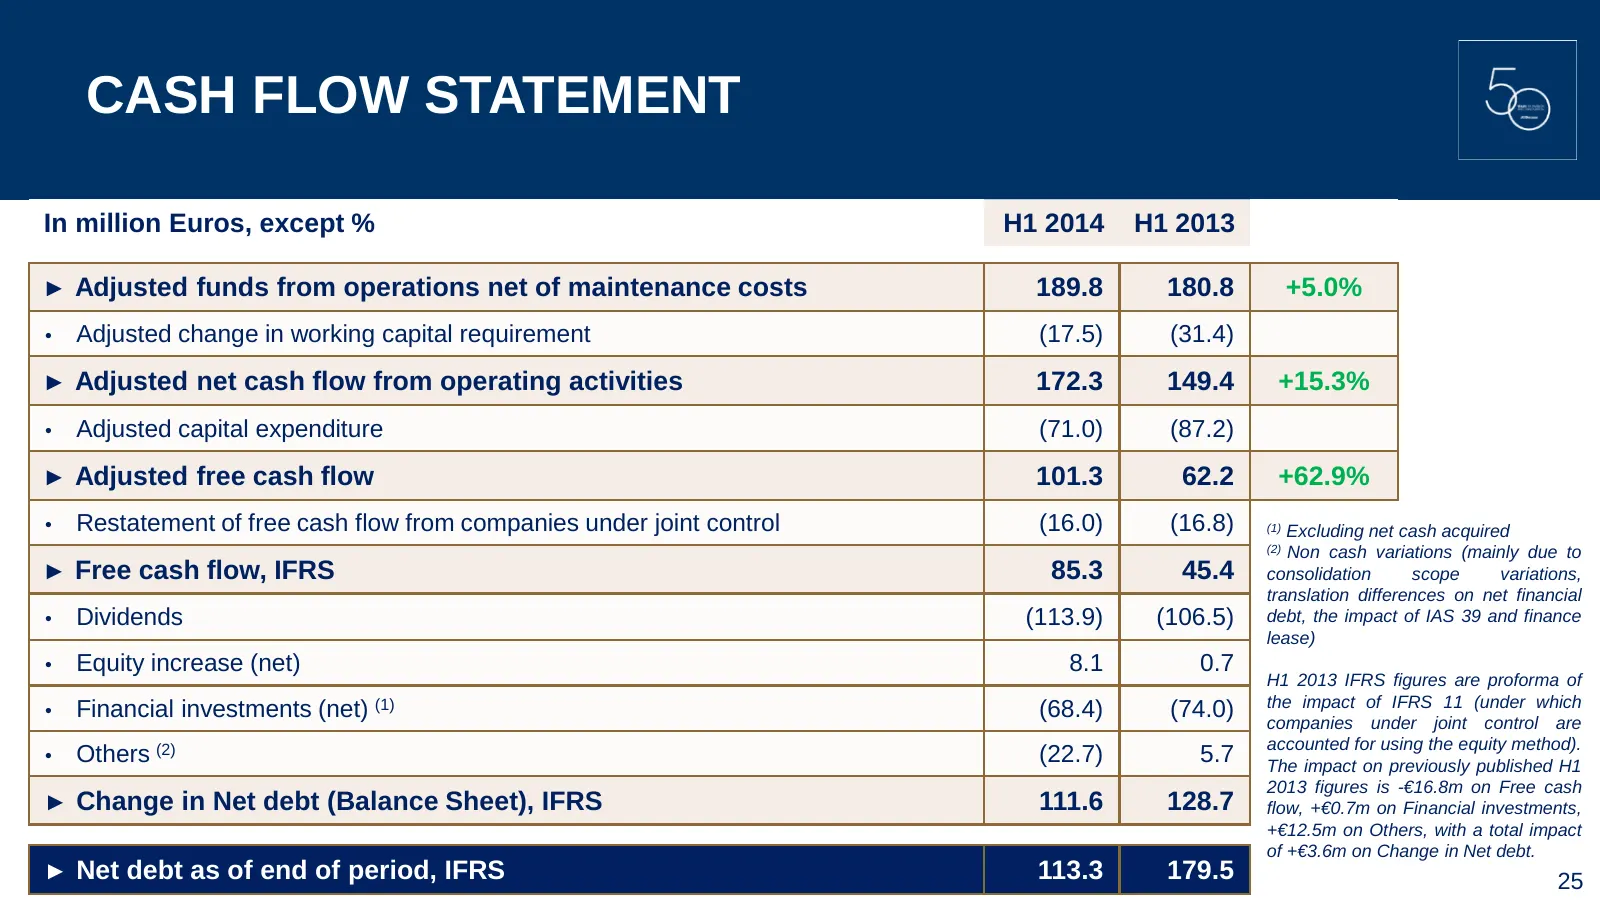
CASH FLOW STATEMENT In million Euros, except % H1 2014 H1 2013 ► Adjusted funds from operations net of maintenance costs 189.8 180.8 +5.0% • Adjusted change in working capital requirement (17.5) (31.4) ► Adjusted net cash flow from operating activities 172.3 149.4 +15.3% • Adjusted capital expenditu
Slide 26: Breakdown of Capex
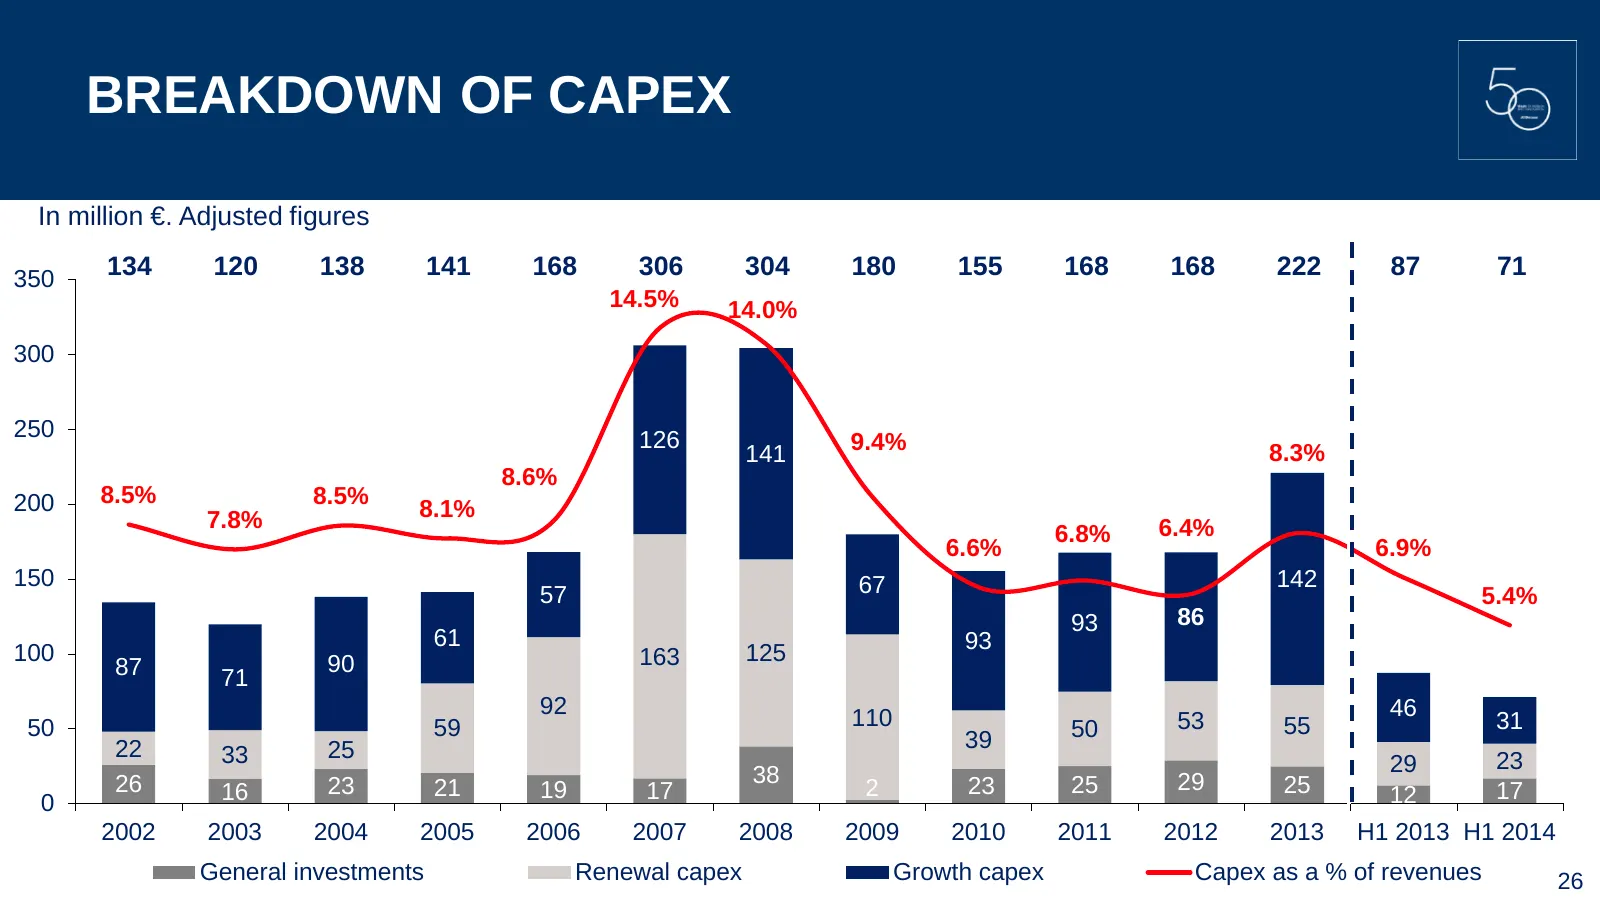
BREAKDOWN OF CAPEX In million €. Adjusted figures 350 134 120 138 141 168 306 304 180 155 168 168 222 87 71 14.5% 14.0% 300 250 126 141 9.4% 8.3% 8.6% 200 8.5% 8.5% 7.8% 8.1% 6.8% 6.4% 6.6% 6.9% 150 67 142 57 5.4% 93 86 61 93 100 90 163 125 87 71 92 110 46 50 59 50 53 55 31 22 25 39 33 29 23 26 23 3
Slide 27: H1 2014 Financial Highlights
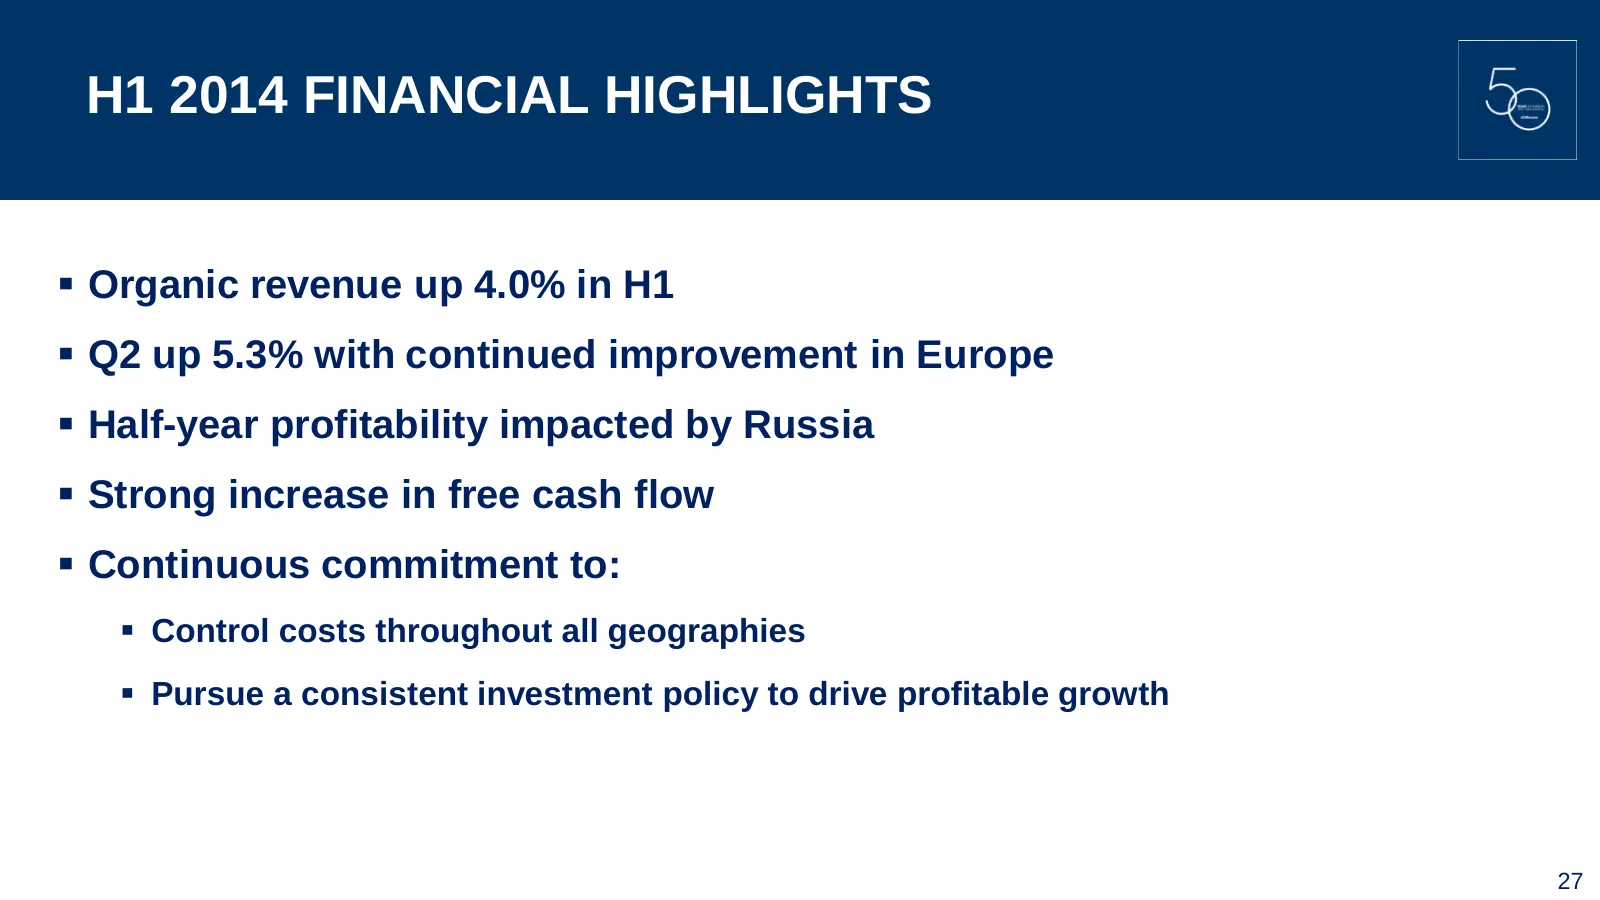
H1 2014 FINANCIAL HIGHLIGHTS Organic revenue up 4.0% in H1 Q2 up 5.3% with continued improvement in Europe Half-year profitability impacted by Russia Strong increase in free cash flow Continuous commitment to: Control costs throughout all geographies Pursue a consistent investment poli

Slide 28: Growth Strategy and Outlook
GROWTH STRATEGY AND OUTLOOK Jean-François Decaux Co-CEO
Slide 29: Urbanization Accelerates
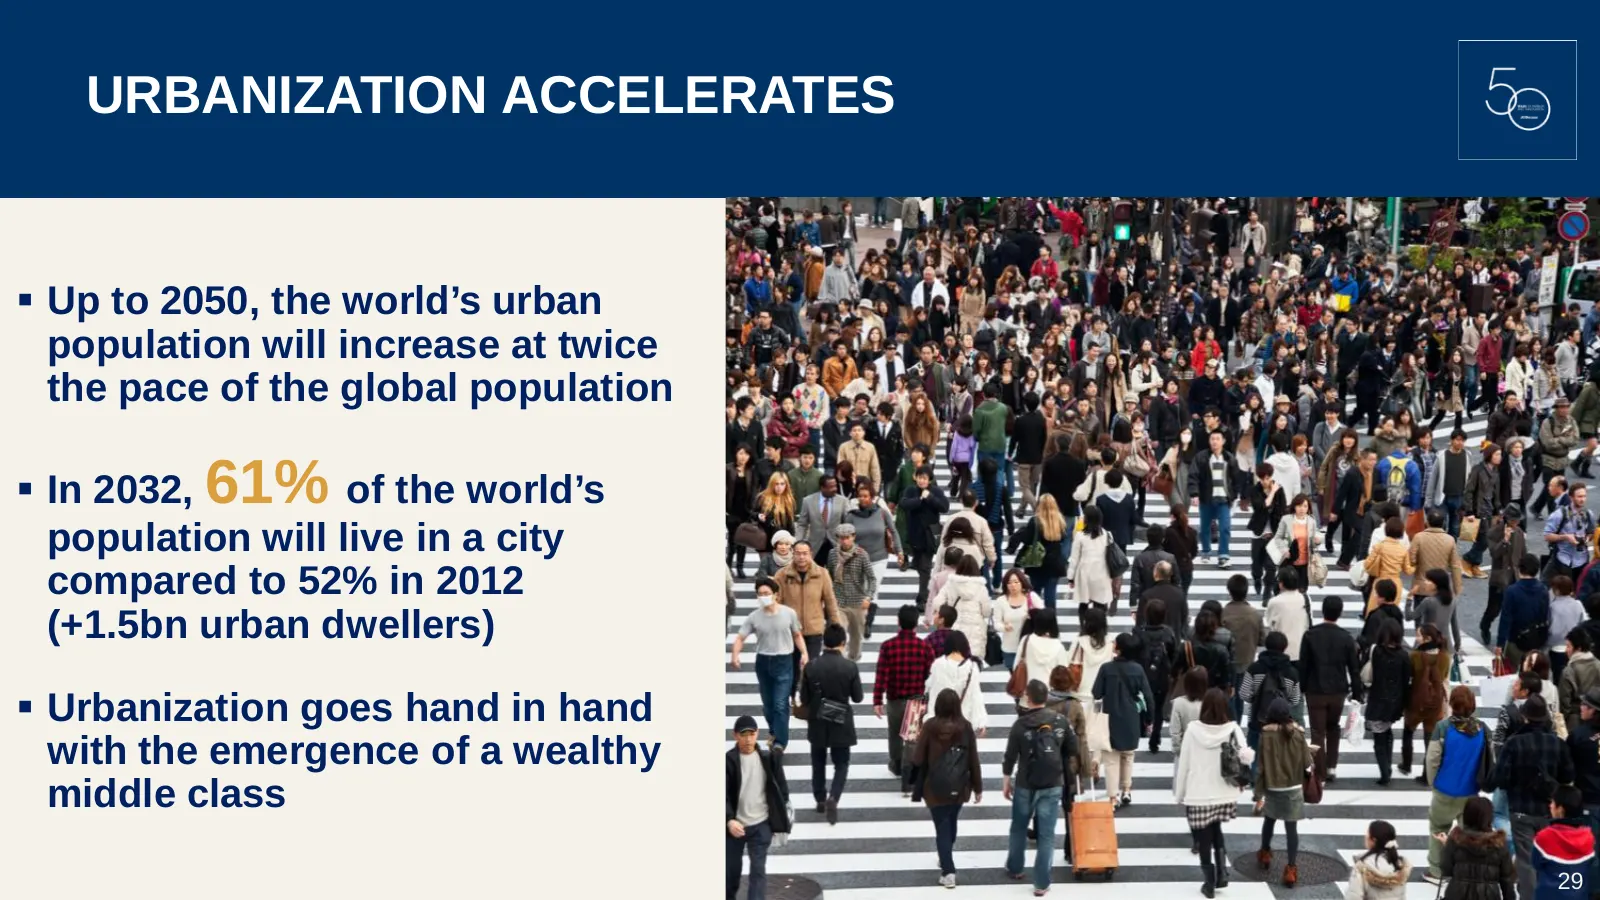
URBANIZATION ACCELERATES Up to 2050, the world’s urban population will increase at twice the pace of the global population In 2032, 61% of the world’s population will live in a city compared to 52% in 2012 (+1.5bn urban dwellers) Urbanization goes hand in hand with the emergence of a wealthy m
Slide 30: Consumer Buying Power Is Concentrated in Cities
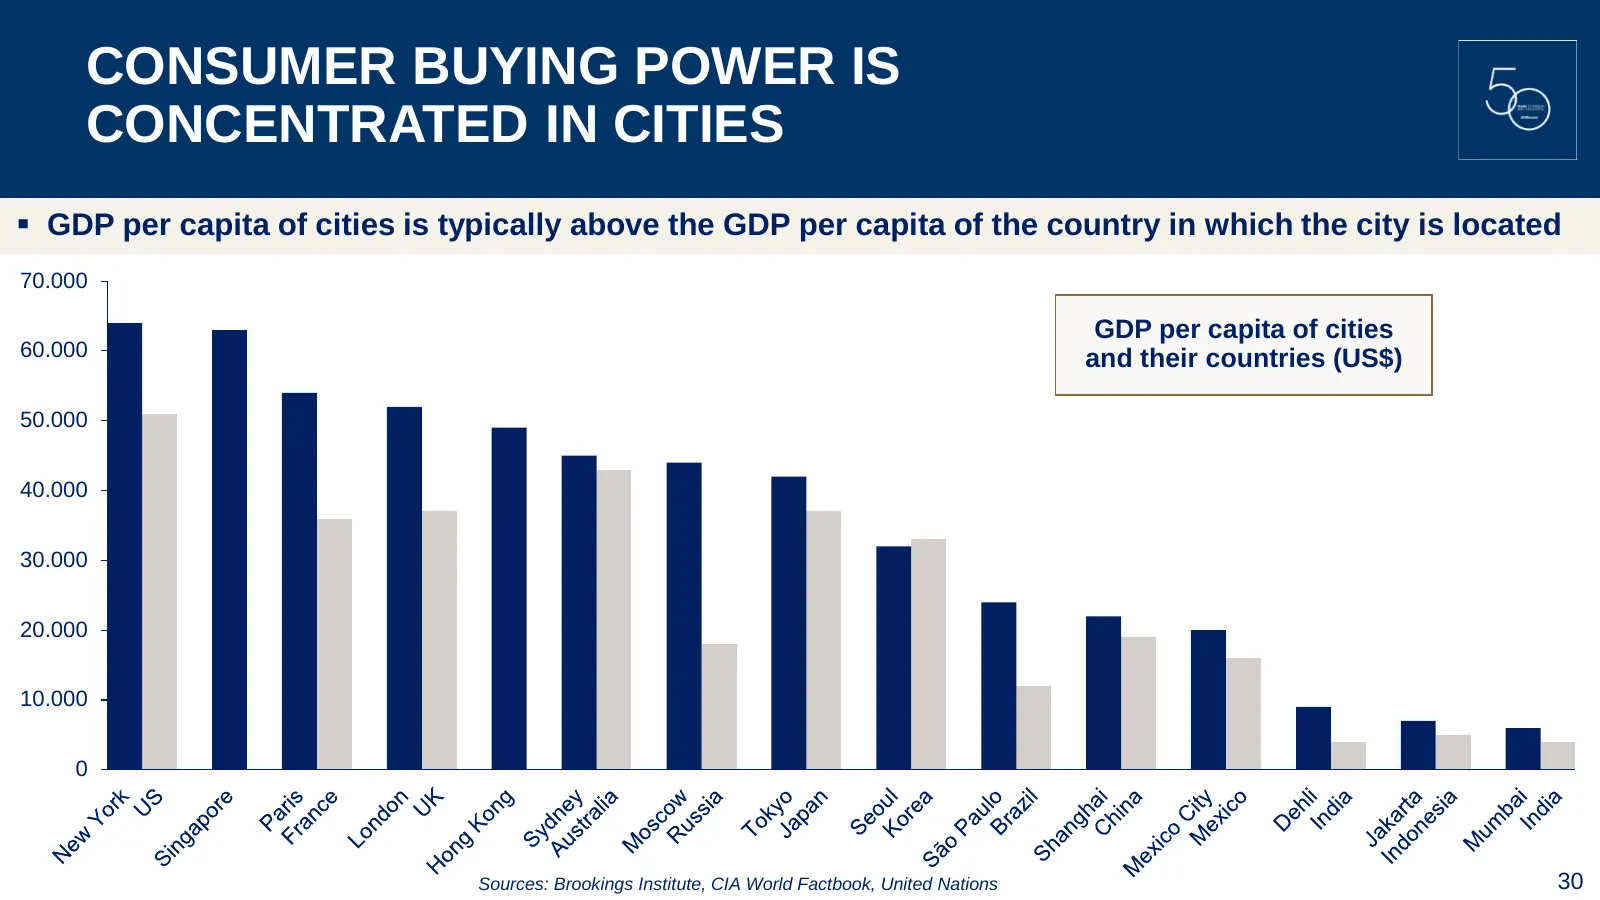
CONSUMER BUYING POWER IS CONCENTRATED IN CITIES GDP per capita of cities is typically above the GDP per capita of the country in which the city is located 70.000 GDP per capita of cities 60.000 and their countries (US$) 50.000 40.000 30.000 20.000 10.000 0 Sources: Brookings Institute, CIA World F
Slide 31: Emerging Economies Are Driving Global Economic Growth
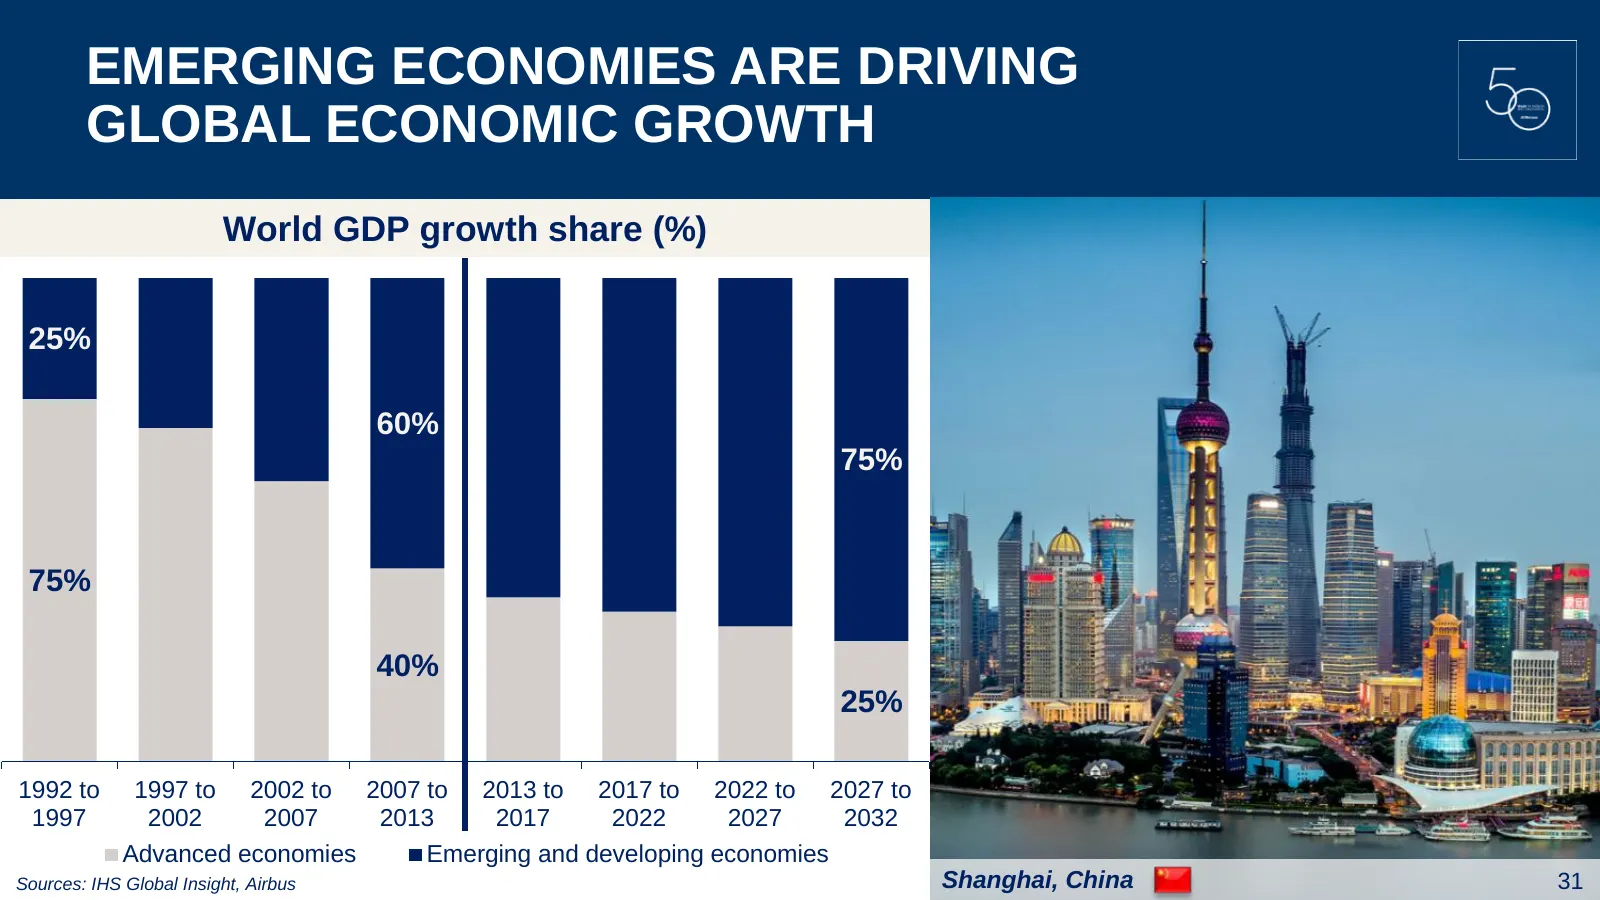
EMERGING ECONOMIES ARE DRIVING GLOBAL ECONOMIC GROWTH World GDP growth share (%) 25% 60% 75% 75% 40% 25% 1992 to 1997 to 2002 to 2007 to 2013 to 2017 to 2022 to 2027 to 1997 2002 2007 2013 2017 2022 2027 2032 Advanced economies Emerging and developing economies Sources: IHS Global Insight, Airbus Sh
Slide 32: Air Passenger Traffic Is Booming
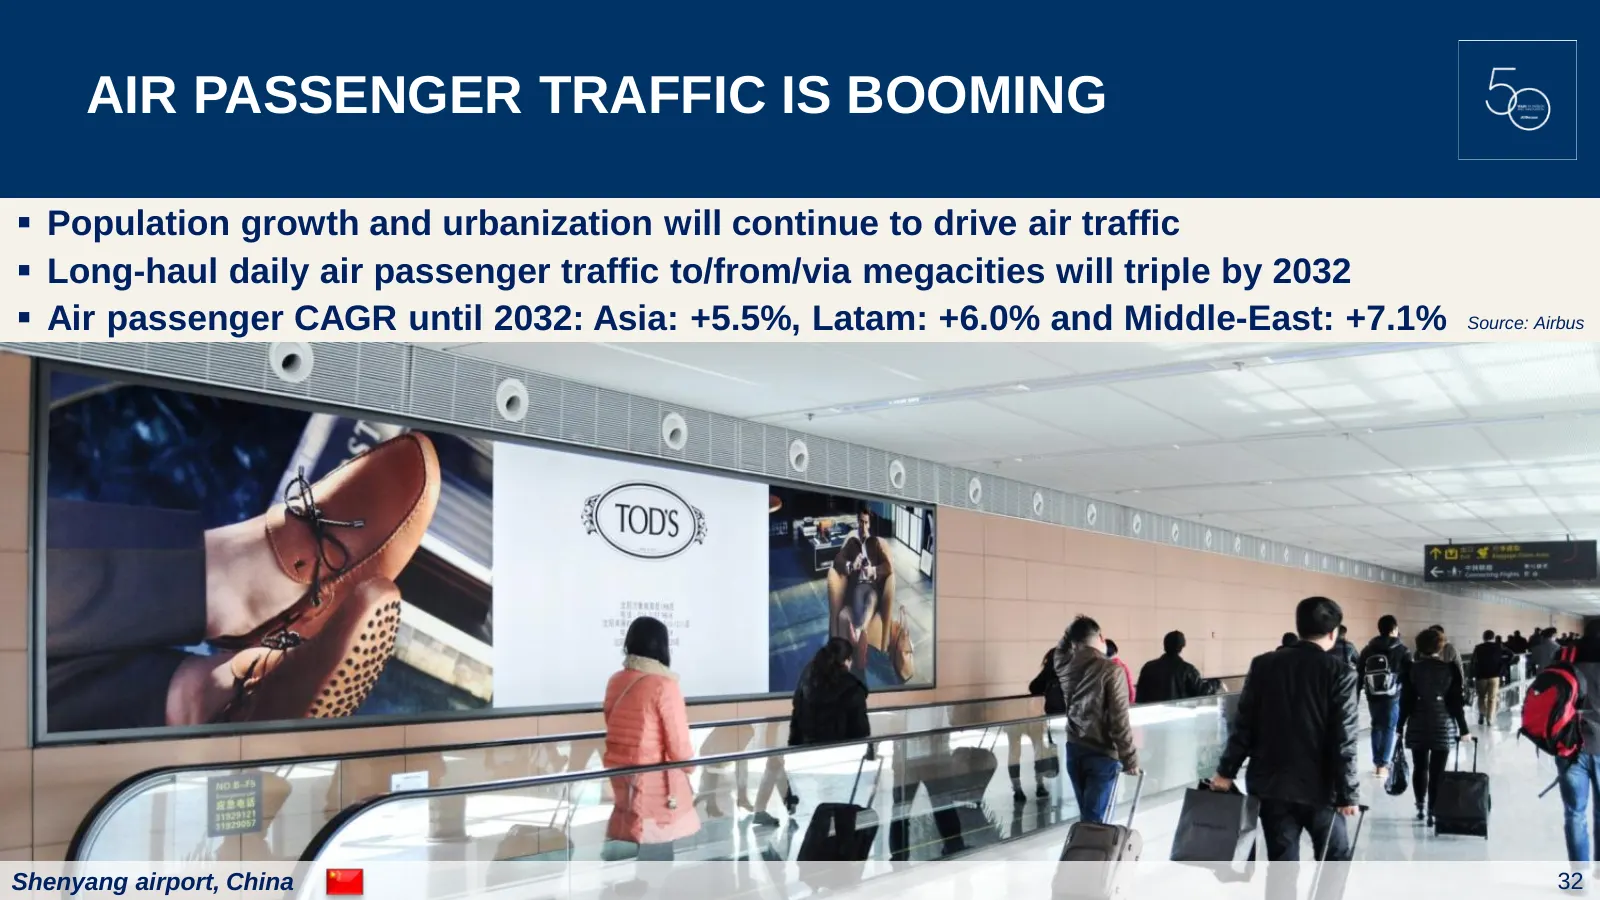
AIR PASSENGER TRAFFIC IS BOOMING Population growth and urbanization will continue to drive air traffic Long-haul daily air passenger traffic to/from/via megacities will triple by 2032 Air passenger CAGR until 2032: Asia: +5.5%, Latam: +6.0% and Middle-East: +7.1% Source: Airbus Shenyang airpor
Slide 33: A Unique Airport Expertise
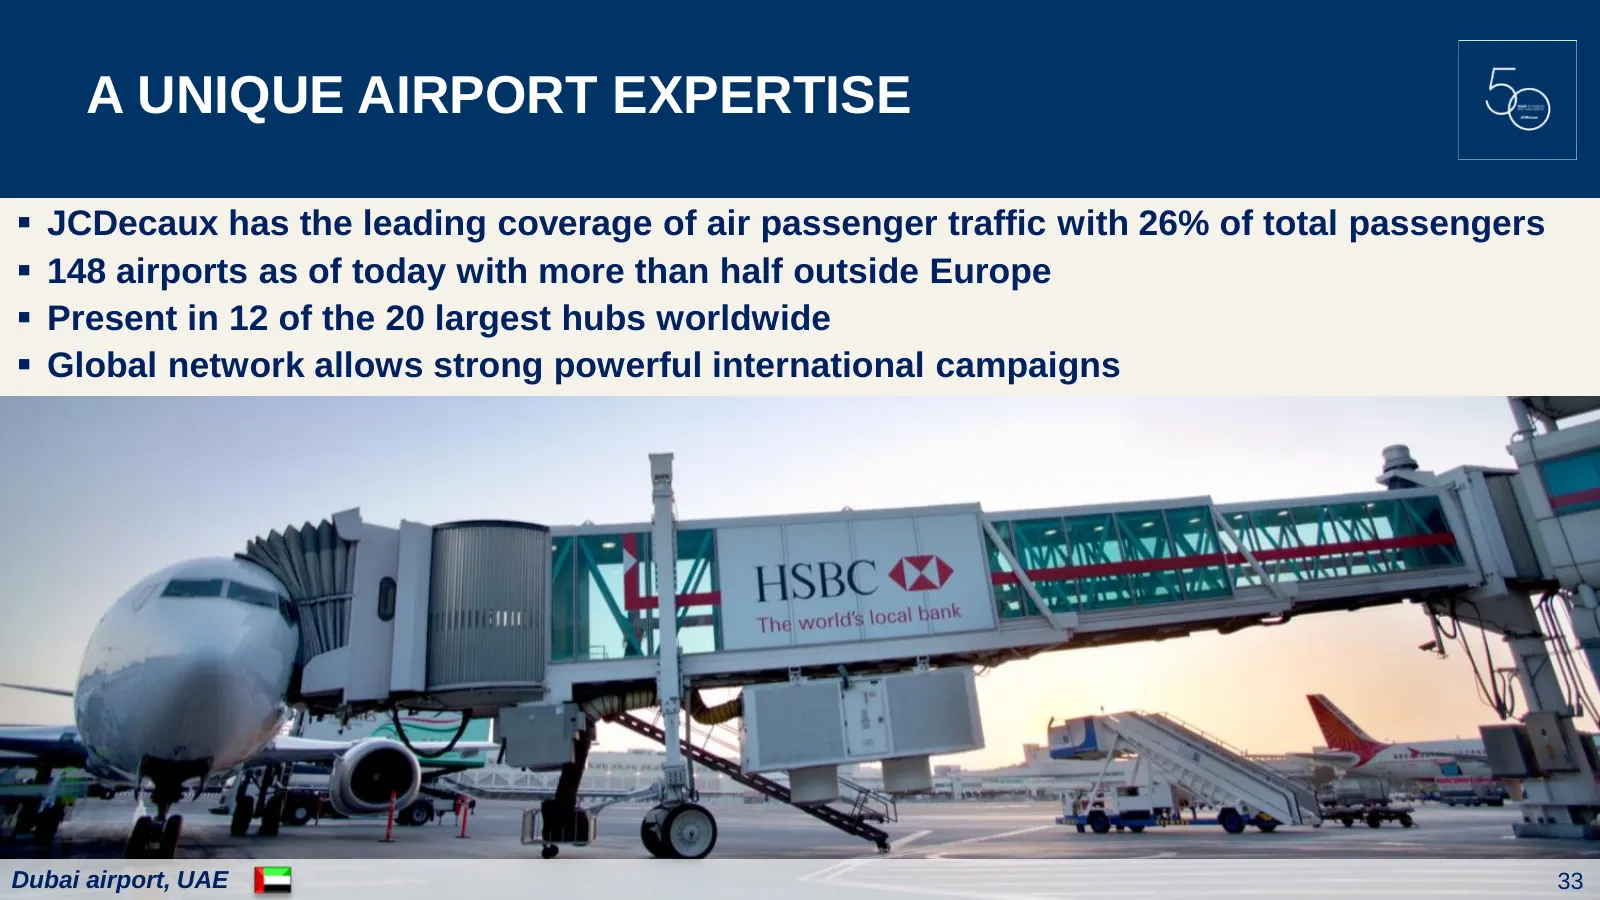
A UNIQUE AIRPORT EXPERTISE JCDecaux has the leading coverage of air passenger traffic with 26% of total passengers 148 airports as of today with more than half outside Europe Present in 12 of the 20 largest hubs worldwide Global network allows strong powerful international campaigns Dubai ai
Slide 34: A Strong Industry Positioning in Key Geographies
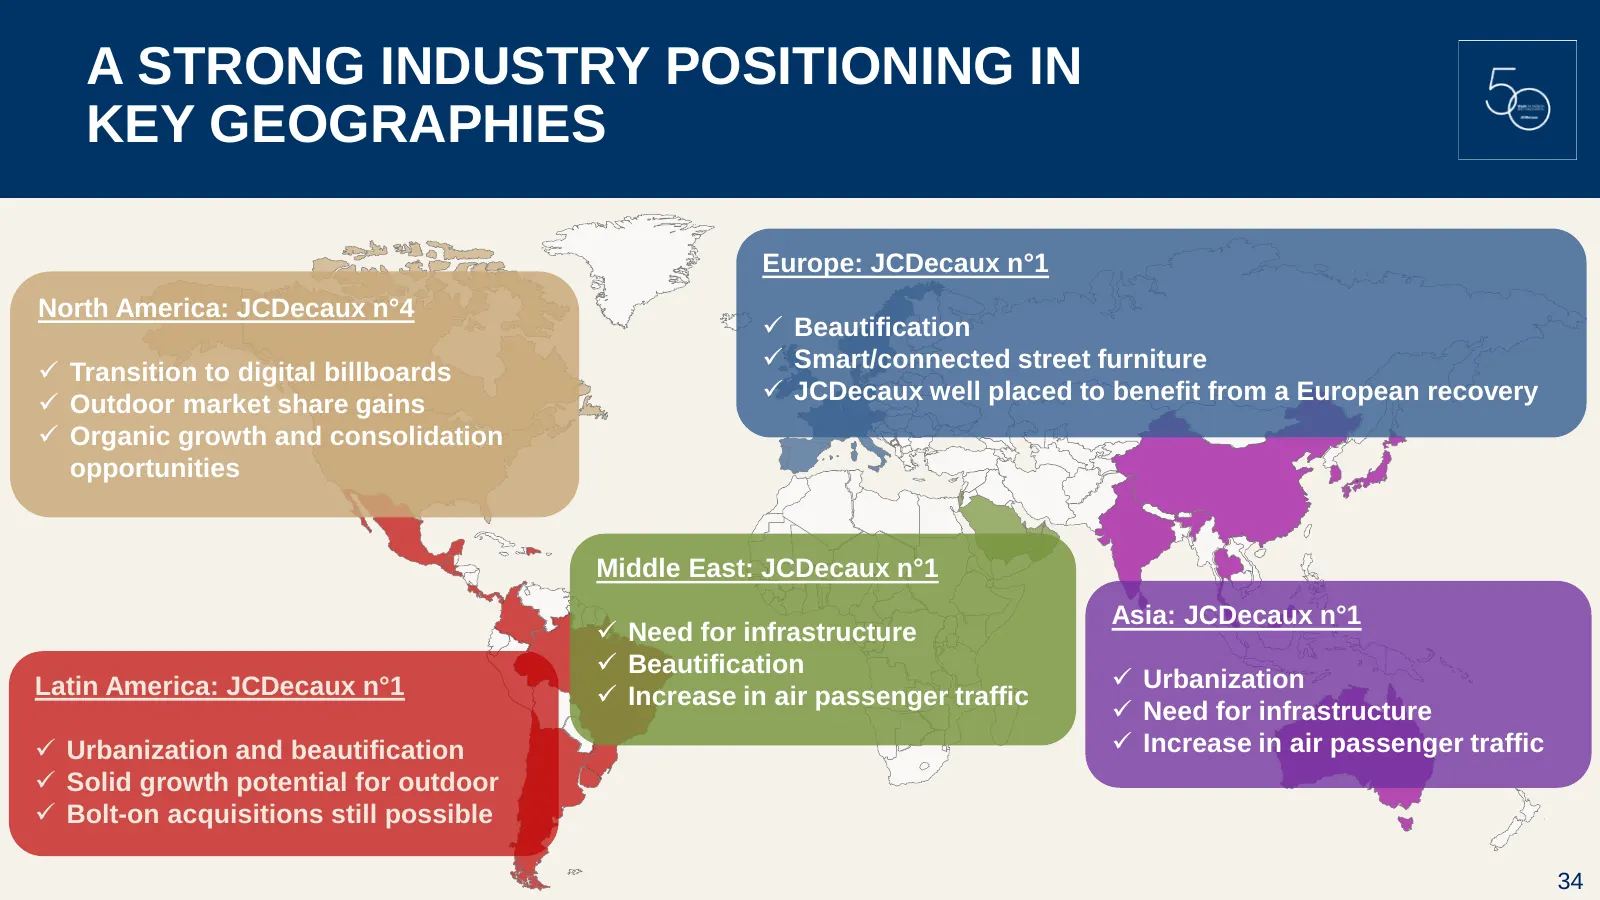
A STRONG INDUSTRY POSITIONING IN KEY GEOGRAPHIES Europe: JCDecaux n°1 North America: JCDecaux n°4 Beautification Transition to digital billboards Smart/connected street furniture Outdoor market share gains JCDecaux well placed to benefit from a European recovery Organic growth and consol
Slide 35: Buyers' Opinion: Outdoor Remains Attractive
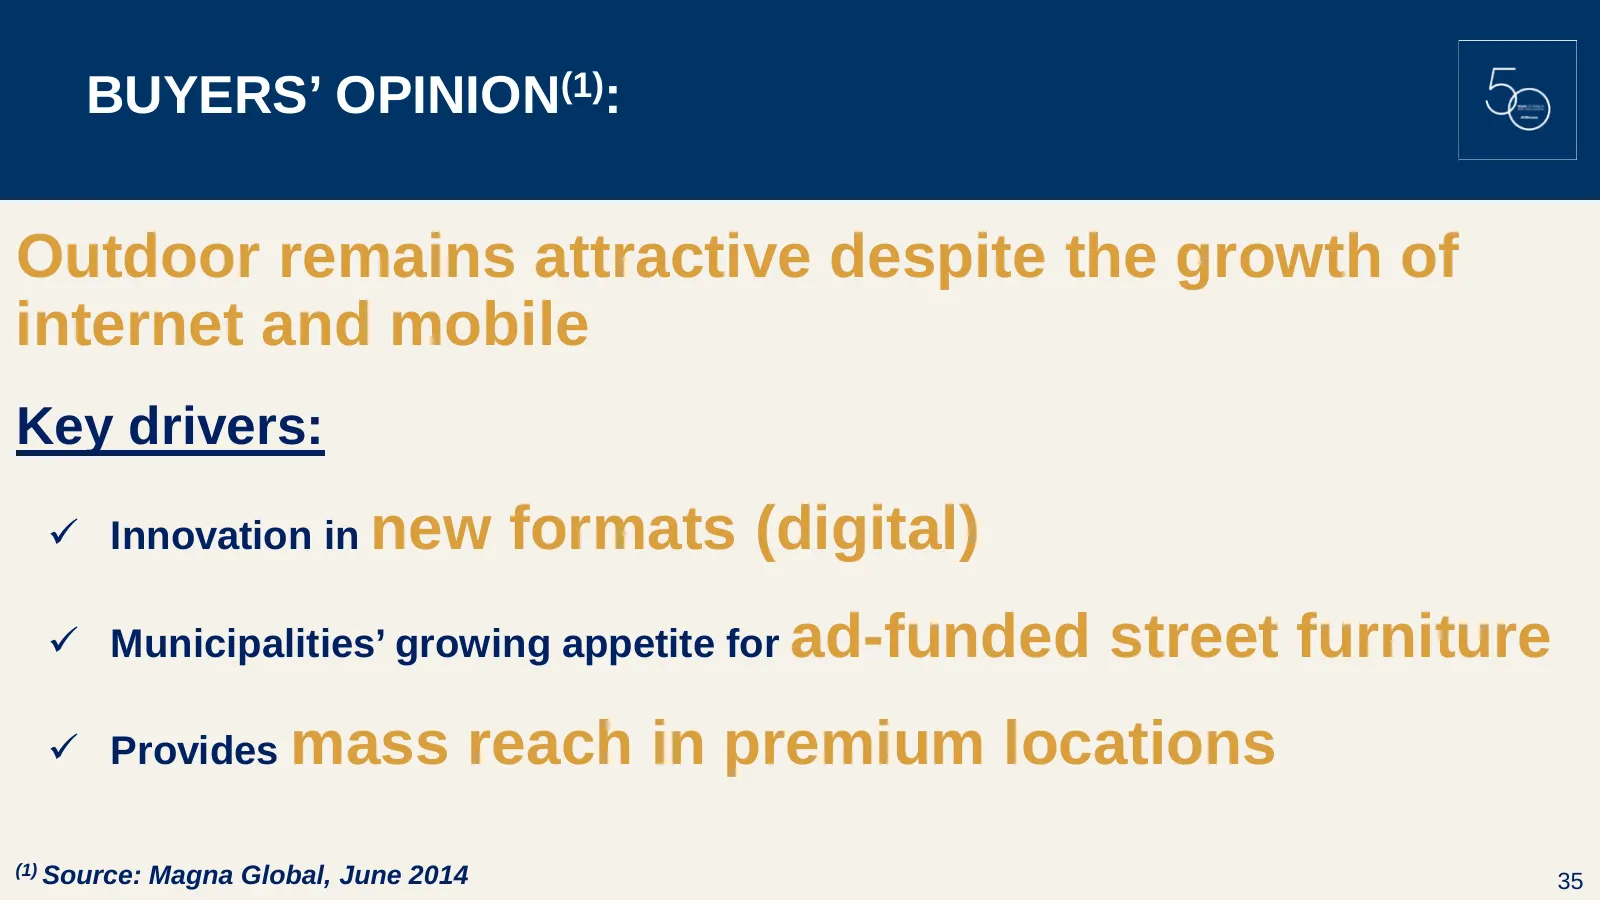
BUYERS’ OPINION(1): Outdoor remains attractive despite the growth of internet and mobile Key drivers: Innovation in new formats (digital) Municipalities’ growing appetite for ad-funded street furniture Provides mass reach in premium locations (1) Source: Magna Global, June 2014 35
Slide 36: Outdoor Adspend Is Bound to Increase
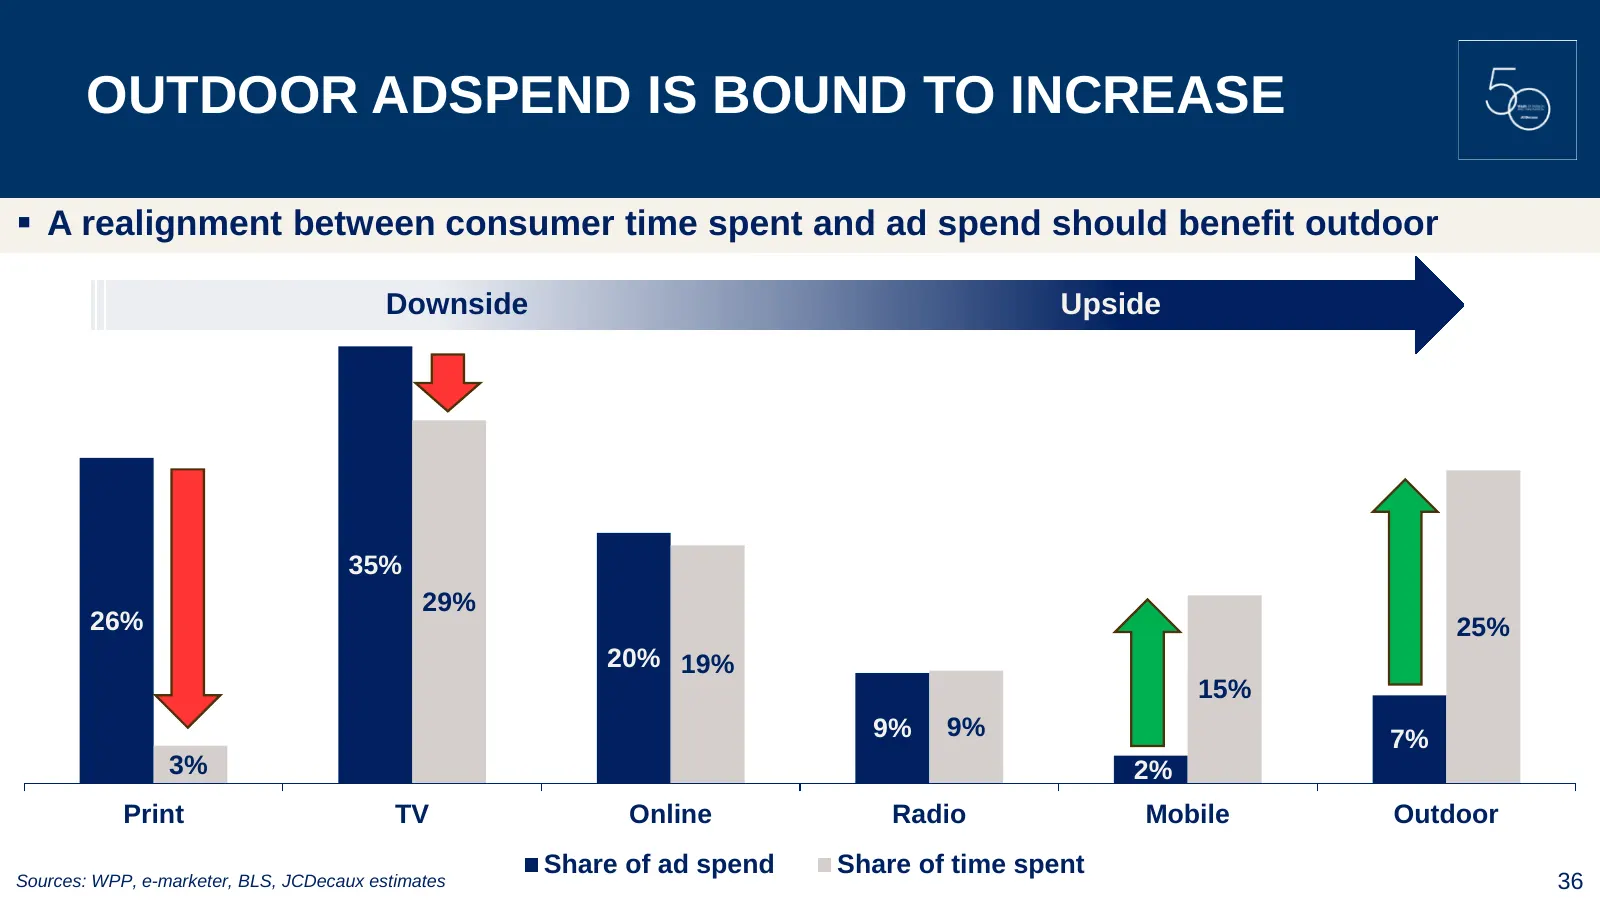
OUTDOOR ADSPEND IS BOUND TO INCREASE A realignment between consumer time spent and ad spend should benefit outdoor Downside Upside 35% 29% 26% 25% 20% 19% 15% 9% 9% 7% 3% 2% Print TV Online Radio Mobile Outdoor Share of ad spend Share of time spent Sources: WPP, e-marketer, BLS, JCDecaux estimates
Slide 37: Transport Continues to Lead Digital Transformation
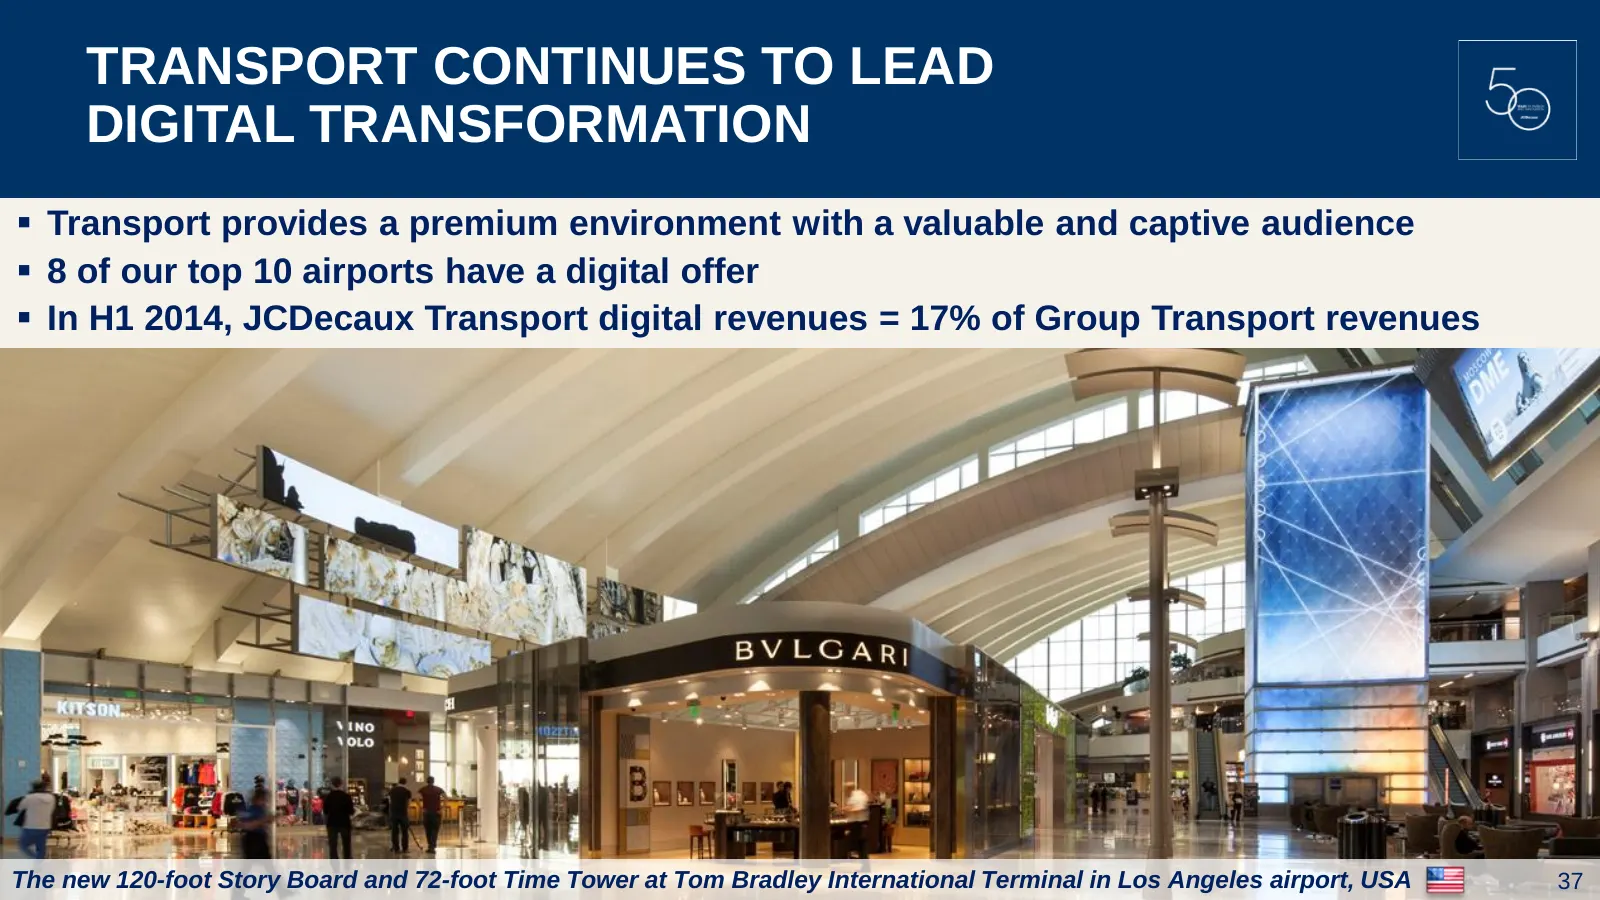
TRANSPORT CONTINUES TO LEAD DIGITAL TRANSFORMATION Transport provides a premium environment with a valuable and captive audience 8 of our top 10 airports have a digital offer In H1 2014, JCDecaux Transport digital revenues = 17% of Group Transport revenues The new 120-foot Story Board and 72-f
Slide 38: US: Digital Billboards on Public Properties?
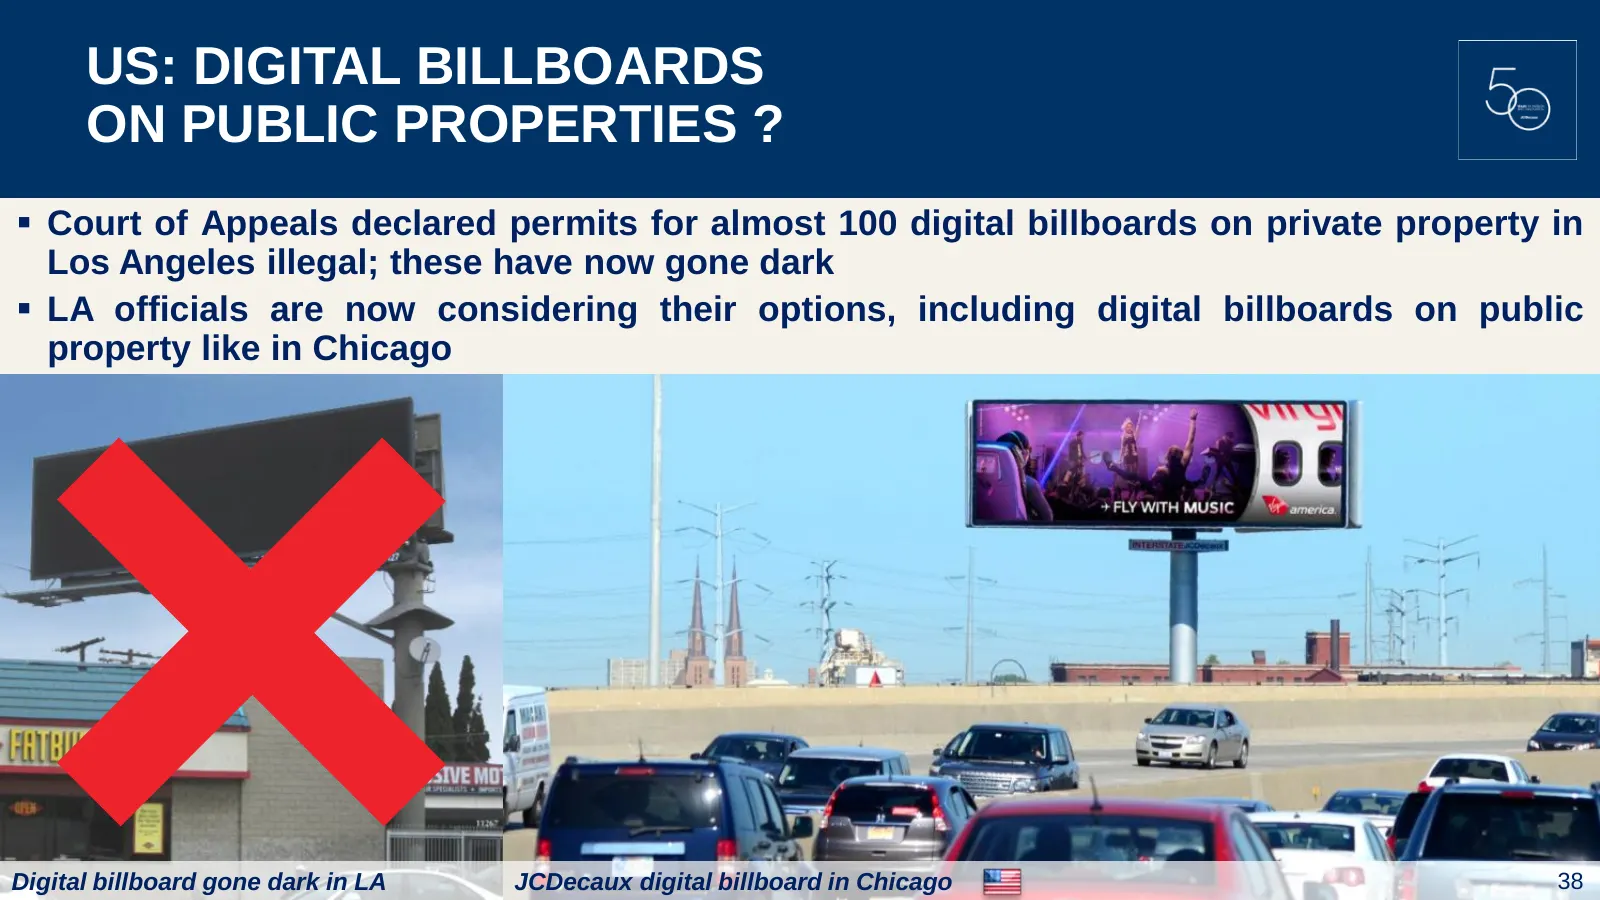
US: DIGITAL BILLBOARDS ON PUBLIC PROPERTIES ? Court of Appeals declared permits for almost 100 digital billboards on private property in Los Angeles illegal; these have now gone dark LA officials are now considering their options, including digital billboards on public property like in Chicago D
Slide 39: JCDecaux Has the Strongest Balance Sheet in the Industry
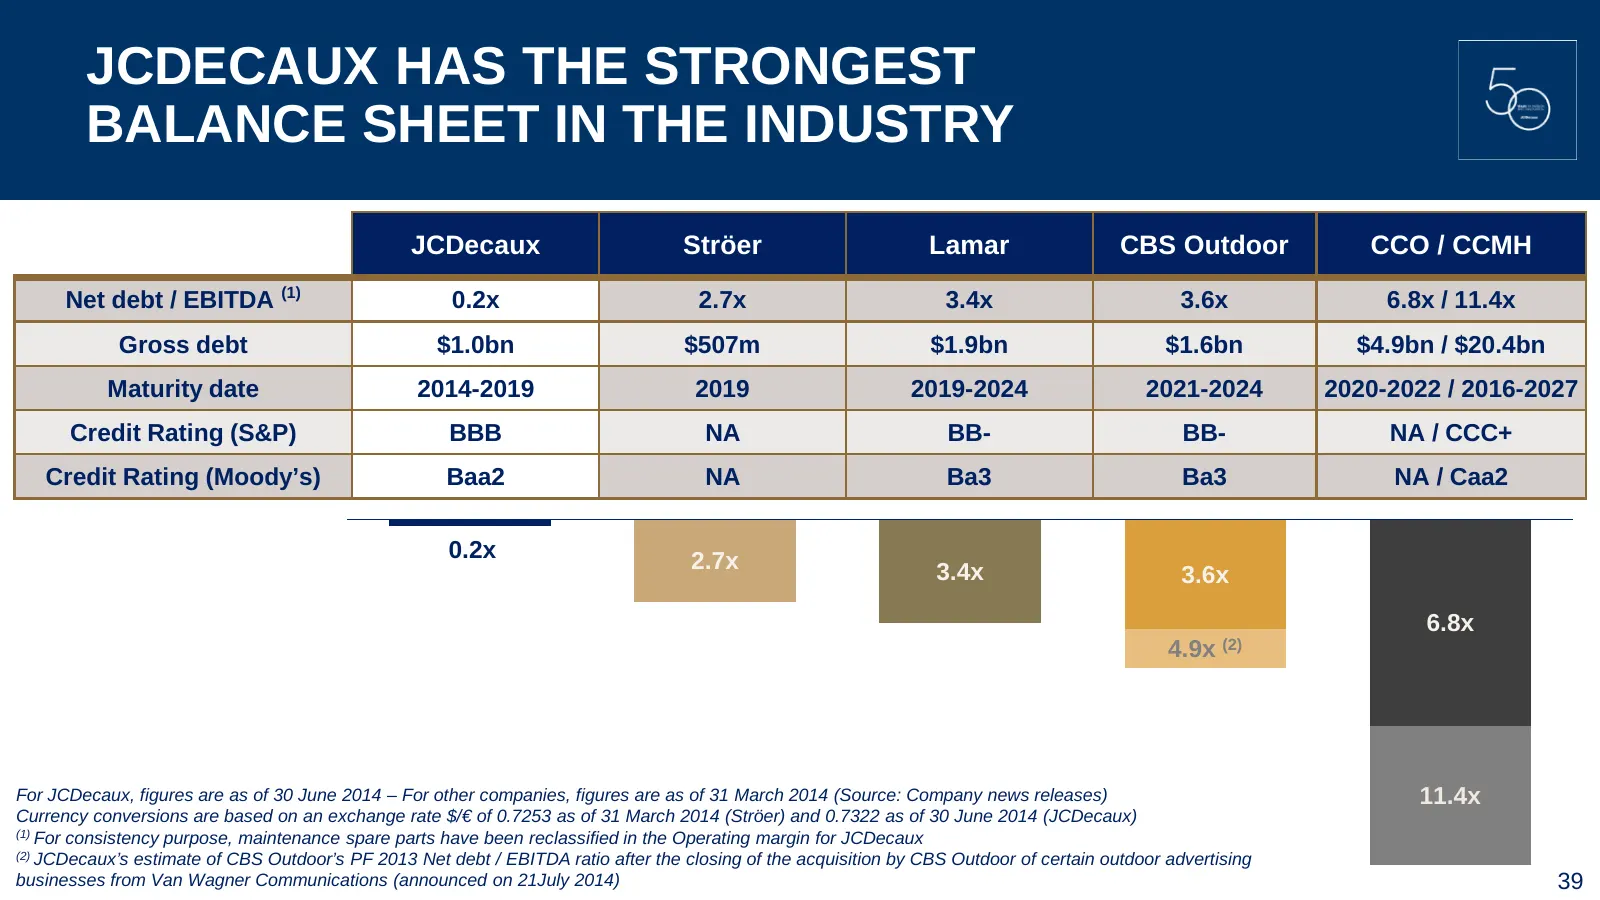
JCDECAUX HAS THE STRONGEST BALANCE SHEET IN THE INDUSTRY JCDecaux Ströer Lamar CBS Outdoor CCO / CCMH Net debt / EBITDA (1) 0.2x 2.7x 3.4x 3.6x 6.8x / 11.4x Gross debt $1.0bn $507m $1.9bn $1.6bn $4.9bn / $20.4bn Maturity date 2014-2019 2019 2019-2024 2021-2024 2020-2022 / 2016-2027 Credit Rating (S&
Slide 40: Main Tenders Expected 2014-2016
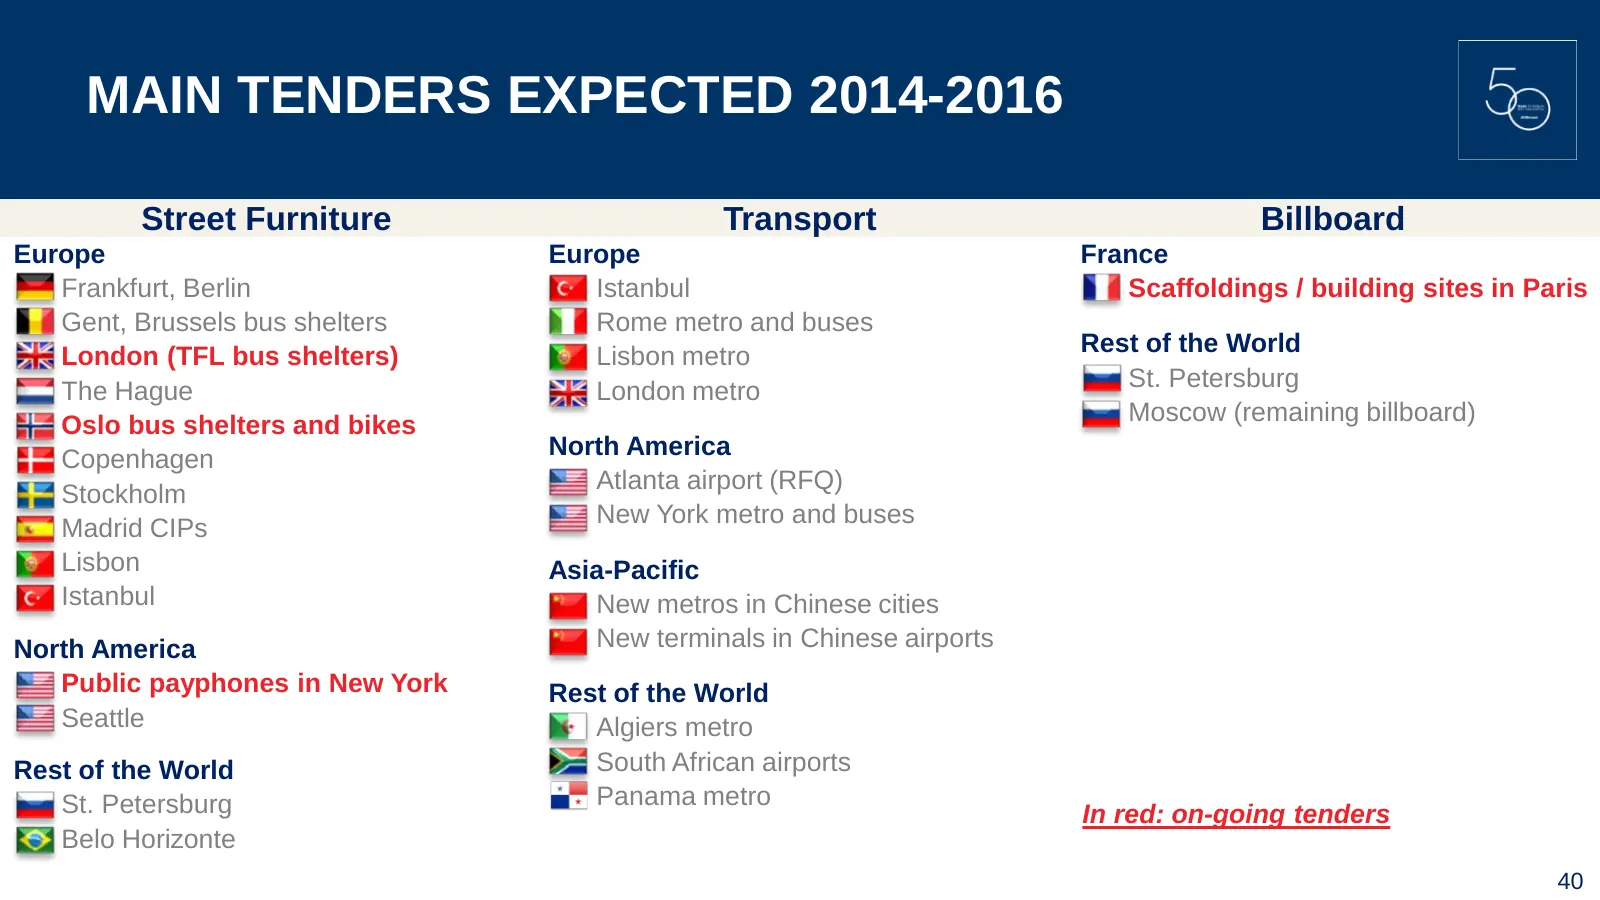
MAIN TENDERS EXPECTED 2014-2016 Street Furniture Transport Billboard Europe Europe France Frankfurt, Berlin Istanbul Scaffoldings / building sites in Paris Gent, Brussels bus shelters Rome metro and buses London (TFL bus shelters) Lisbon metro Rest of the World The Hague St. Petersburg London metro
Slide 41: New York City: Opportunities Ahead
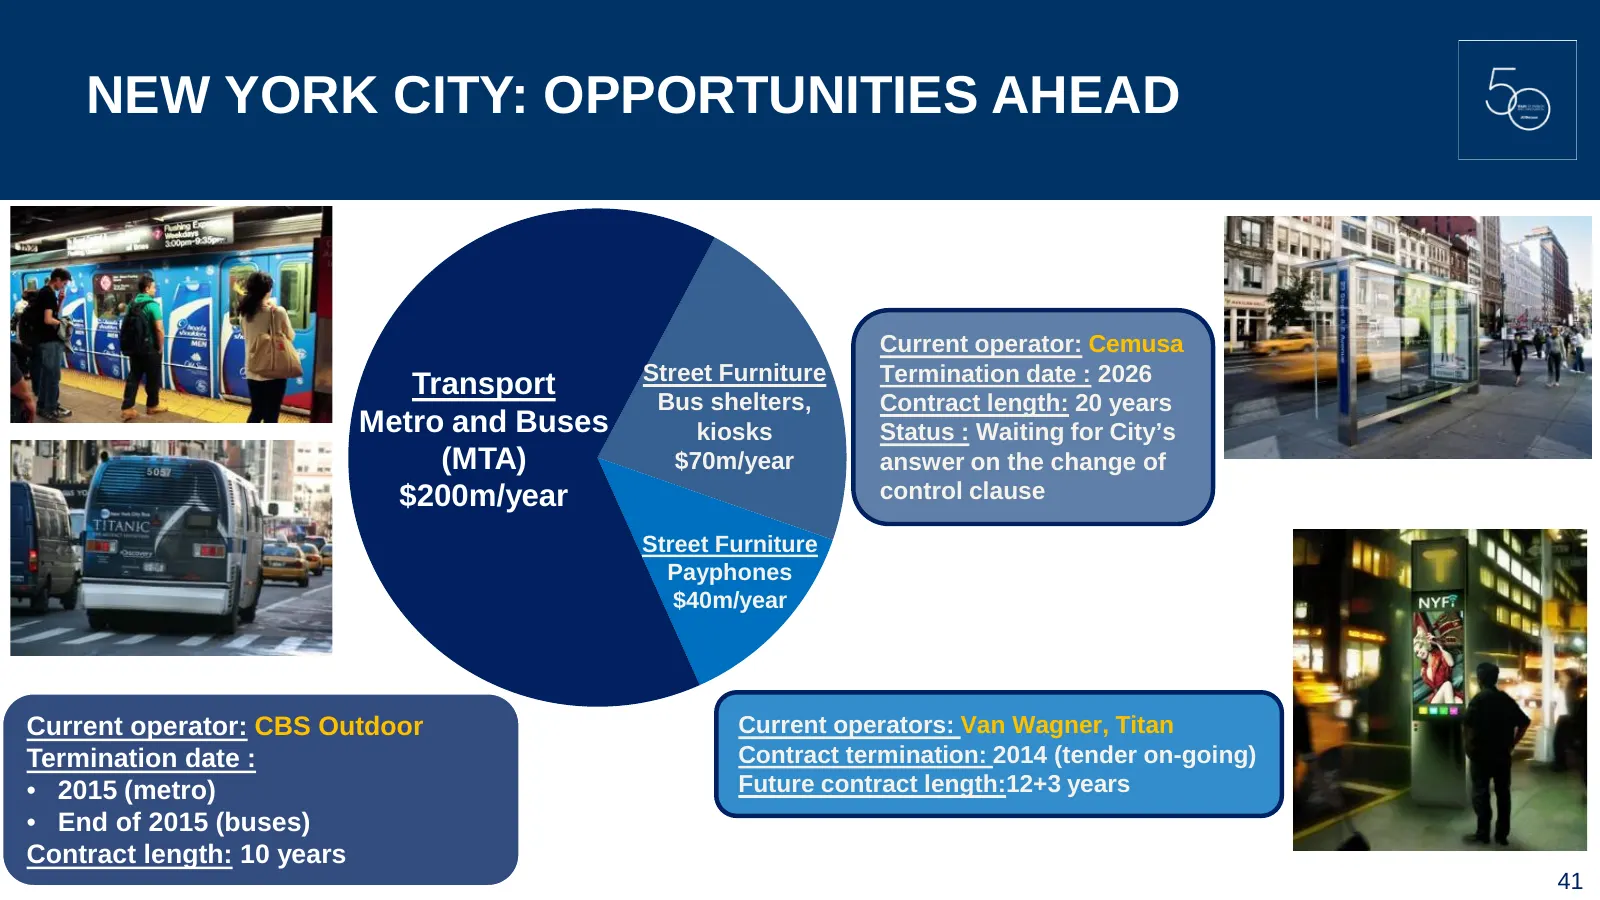
NEW YORK CITY: OPPORTUNITIES AHEAD Current operator: Cemusa Street Furniture Termination date : 2026 Transport Bus shelters, Contract length: 20 years Metro and Buses kiosks Status : Waiting for City’s (MTA) $70m/year answer on the change of $200m/year control clause Street Furniture Payphones $40m/
Slide 42: Consolidation Resumes
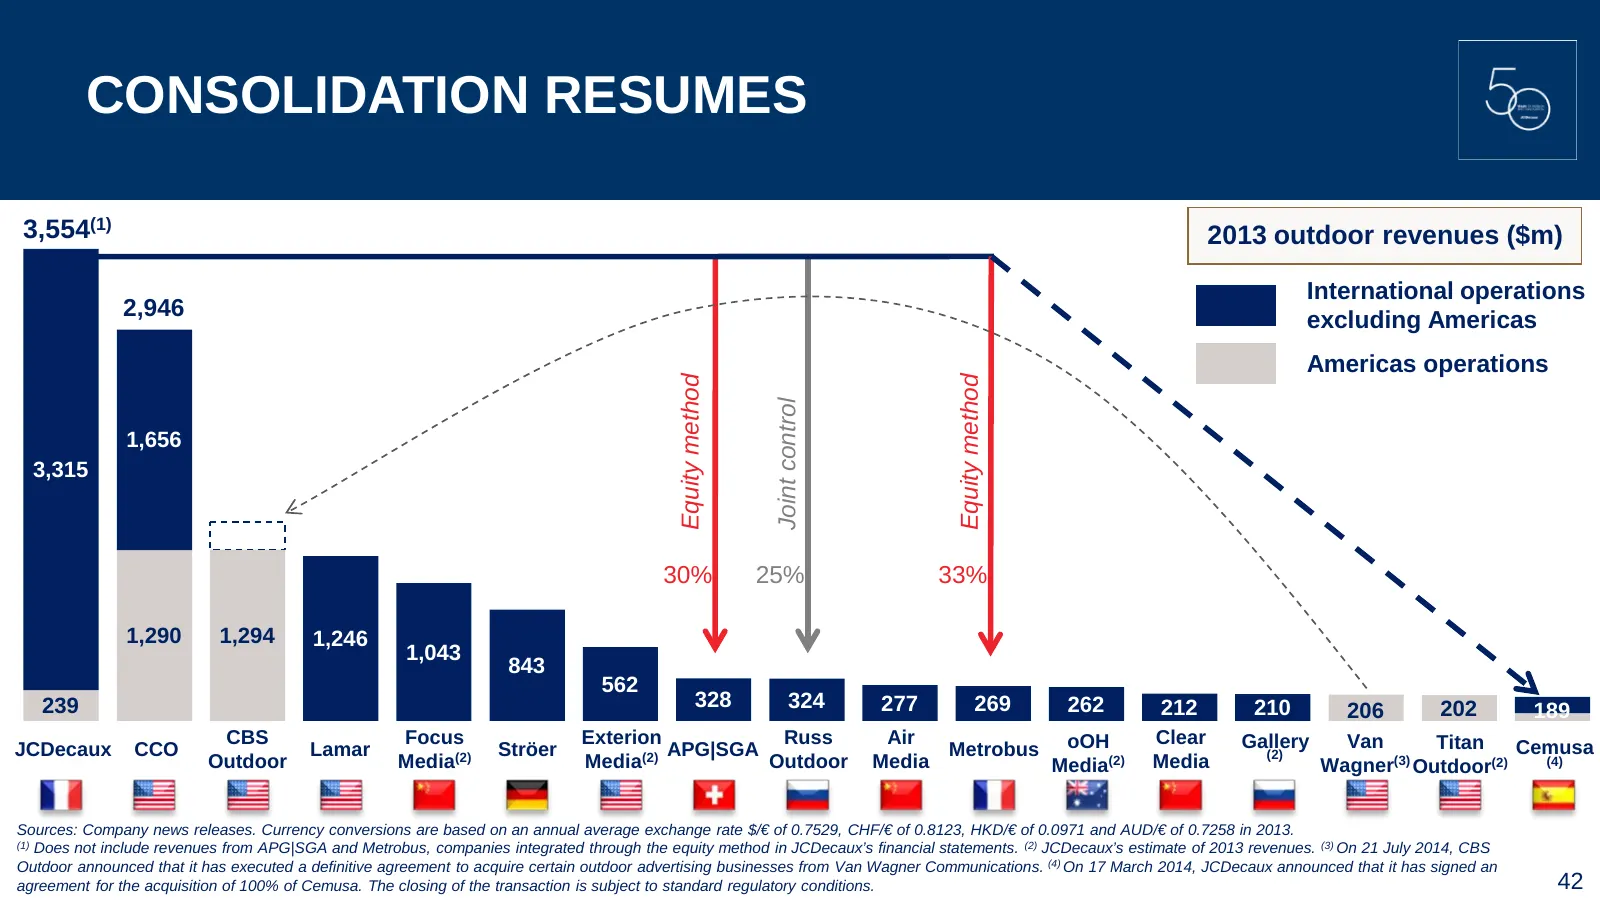
CONSOLIDATION RESUMES 3,554(1) 2013 outdoor revenues ($m) International operations 2,946 excluding Americas Americas operations Equity method Equity method Joint control 1,656 3,315 30% 25% 33% 1,290 1,294 1,246 1,043 843 562 239 328 324 277 269 262 212 210 206 202 189 CBS Focus Exterion Russ Air Cl
Slide 43: Conclusion
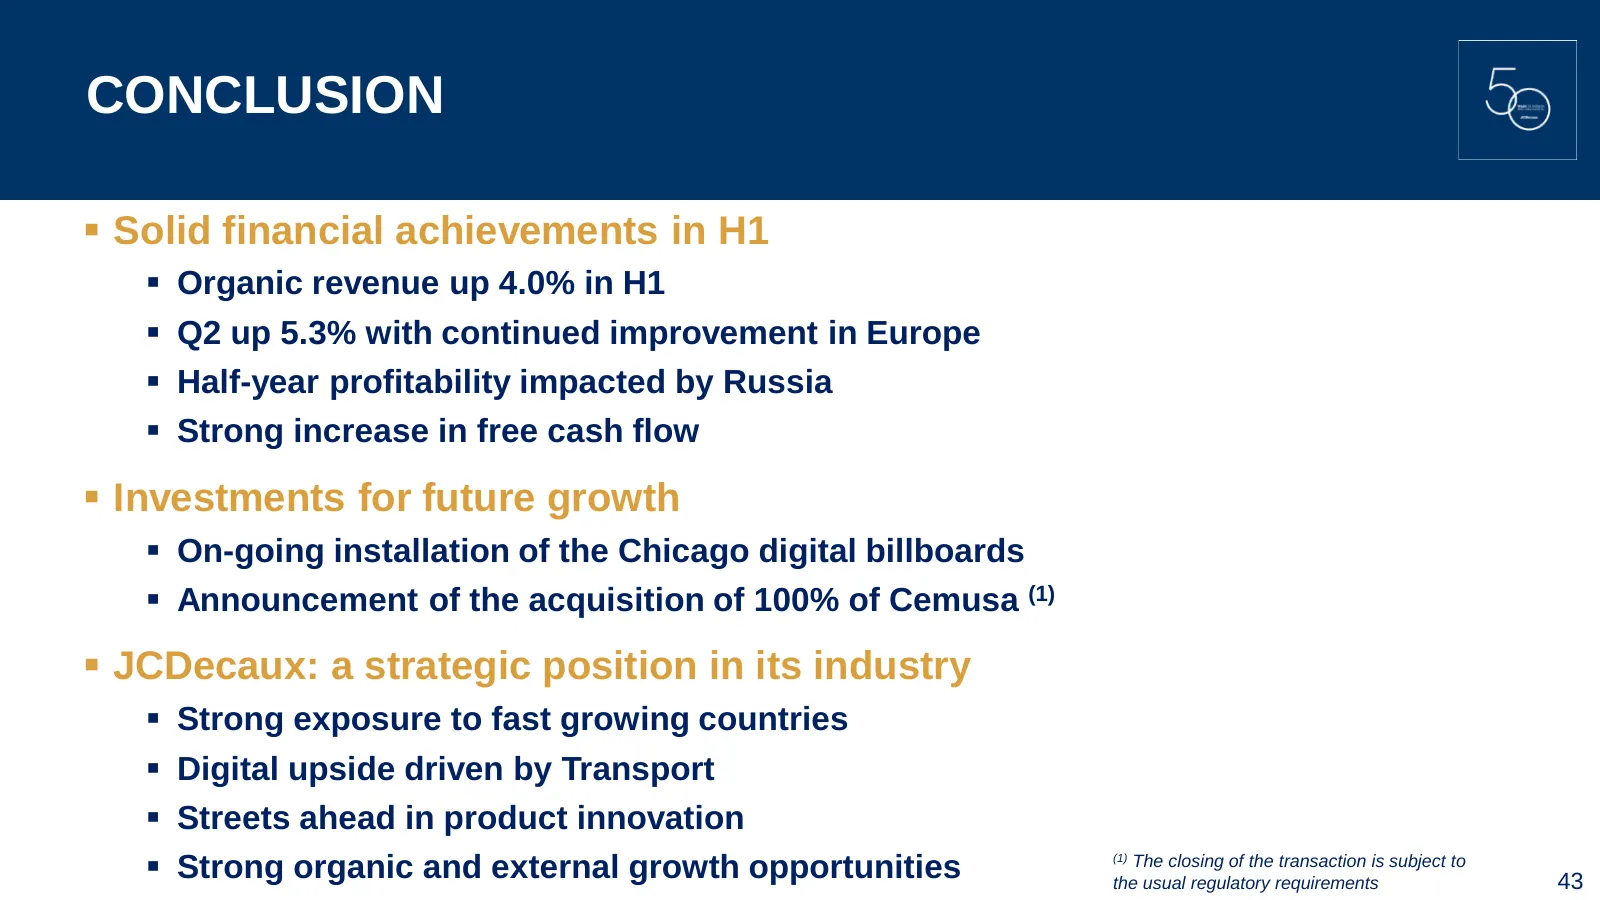
CONCLUSION Solid financial achievements in H1 Organic revenue up 4.0% in H1 Q2 up 5.3% with continued improvement in Europe Half-year profitability impacted by Russia Strong increase in free cash flow Investments for future growth On-going installation of the Chicago digital billboards
Slide 44: Q3 2014 Outlook
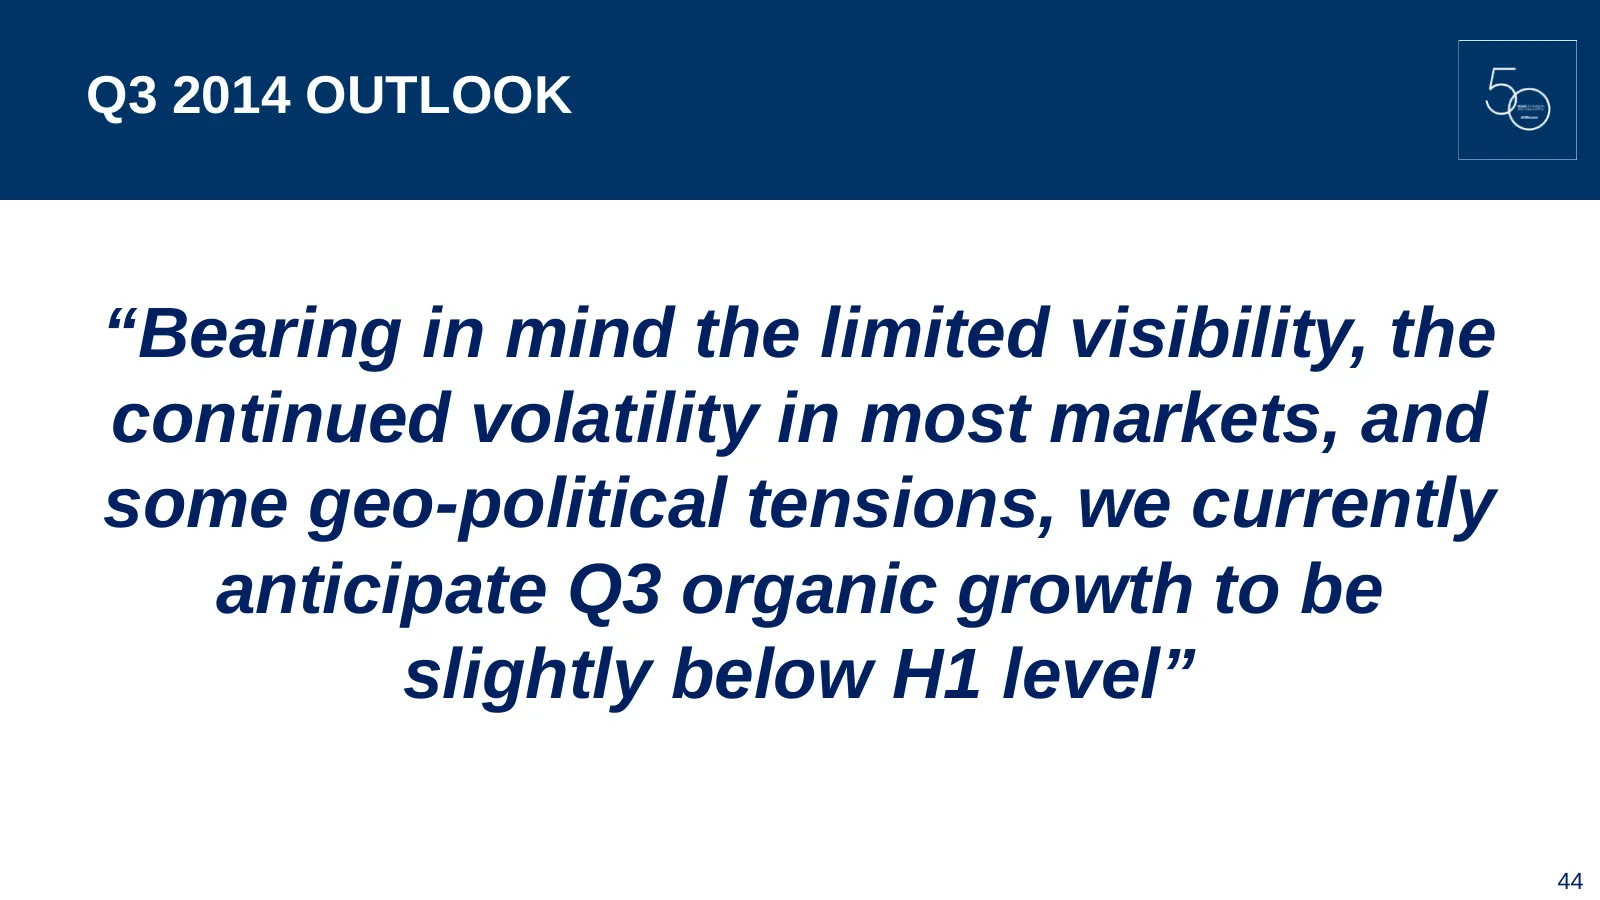
Q3 2014 OUTLOOK “Bearing in mind the limited visibility, the continued volatility in most markets, and some geo-political tensions, we currently anticipate Q3 organic growth to be slightly below H1 level” 44
Slide 45: Implementation of IFRS 11
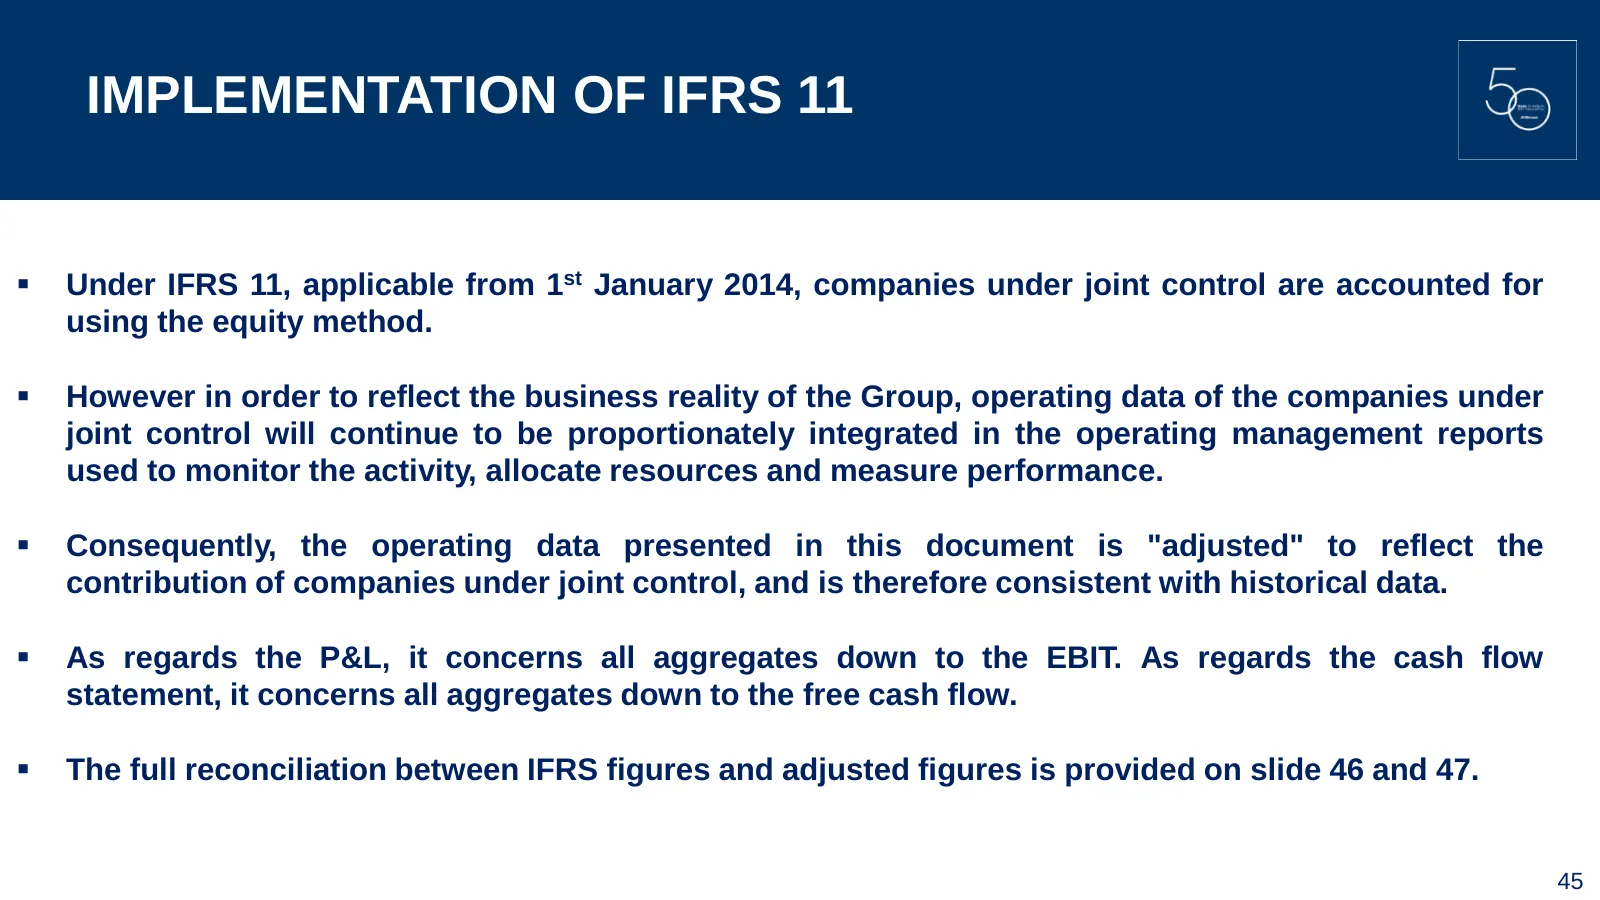
IMPLEMENTATION OF IFRS 11 Under IFRS 11, applicable from 1st January 2014, companies under joint control are accounted for using the equity method. However in order to reflect the business reality of the Group, operating data of the companies under joint control will continue to be proportionate
Slide 46: Reconciliation Between IFRS Figures and Adjusted Figures – P&L
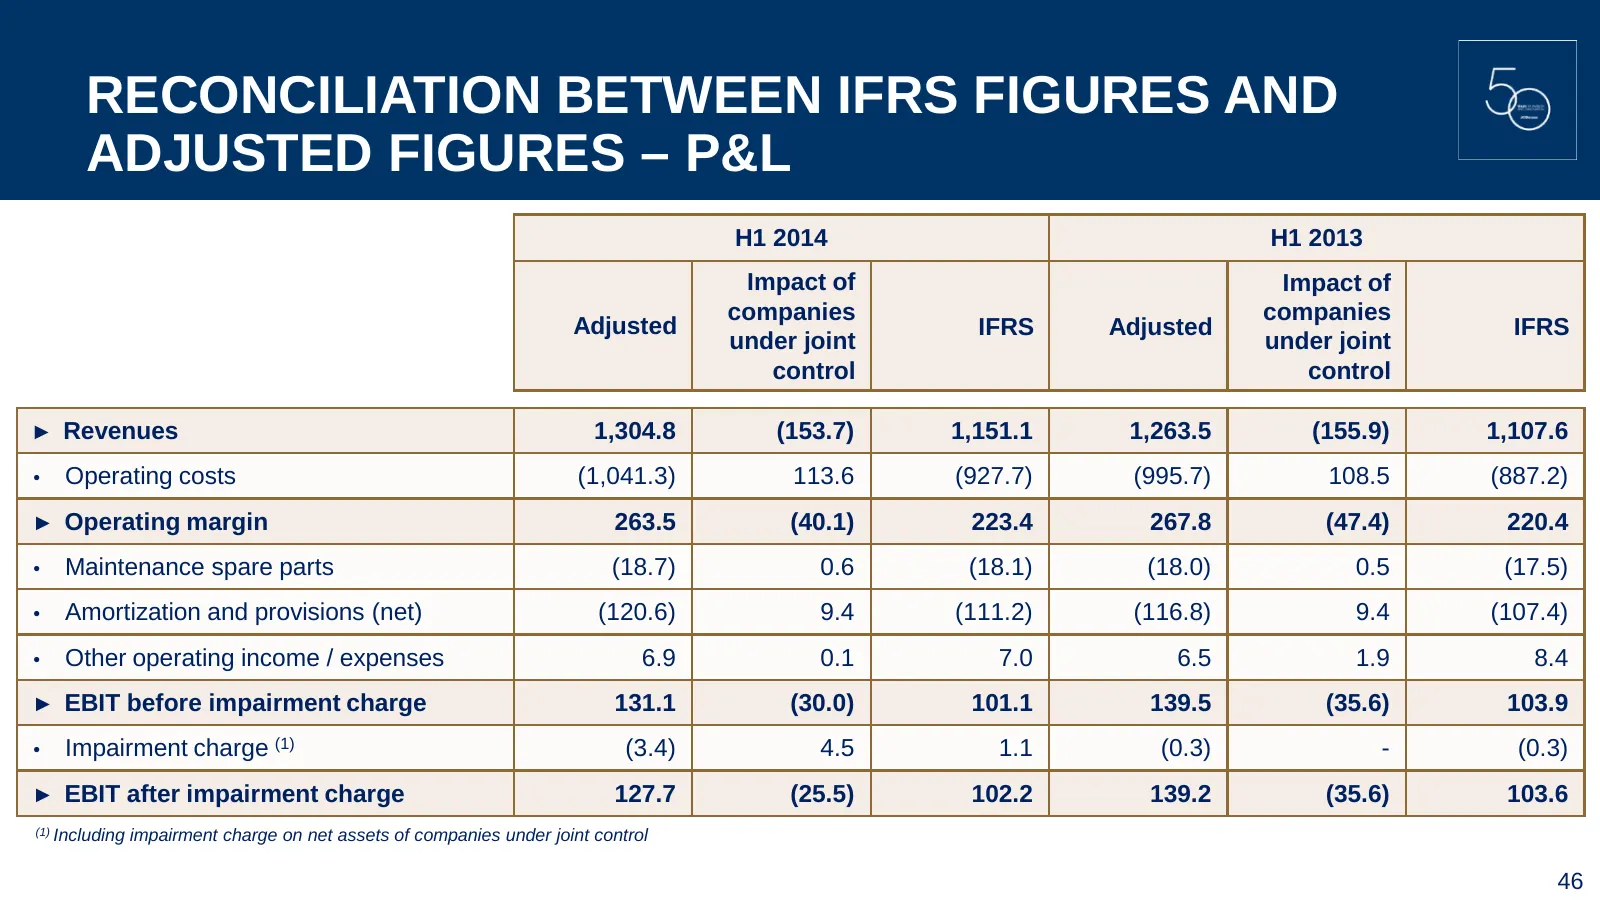
RECONCILIATION BETWEEN IFRS FIGURES AND ADJUSTED FIGURES – P&L H1 2014 H1 2013 Impact of Impact of companies companies Adjusted IFRS Adjusted IFRS under joint under joint control control ► Revenues 1,304.8 (153.7) 1,151.1 1,263.5 (155.9) 1,107.6 • Operating costs (1,041.3) 113.6 (927.7) (995.7) 108.
Slide 47: Reconciliation Between IFRS Figures and Adjusted Figures – Cash Flow Statement
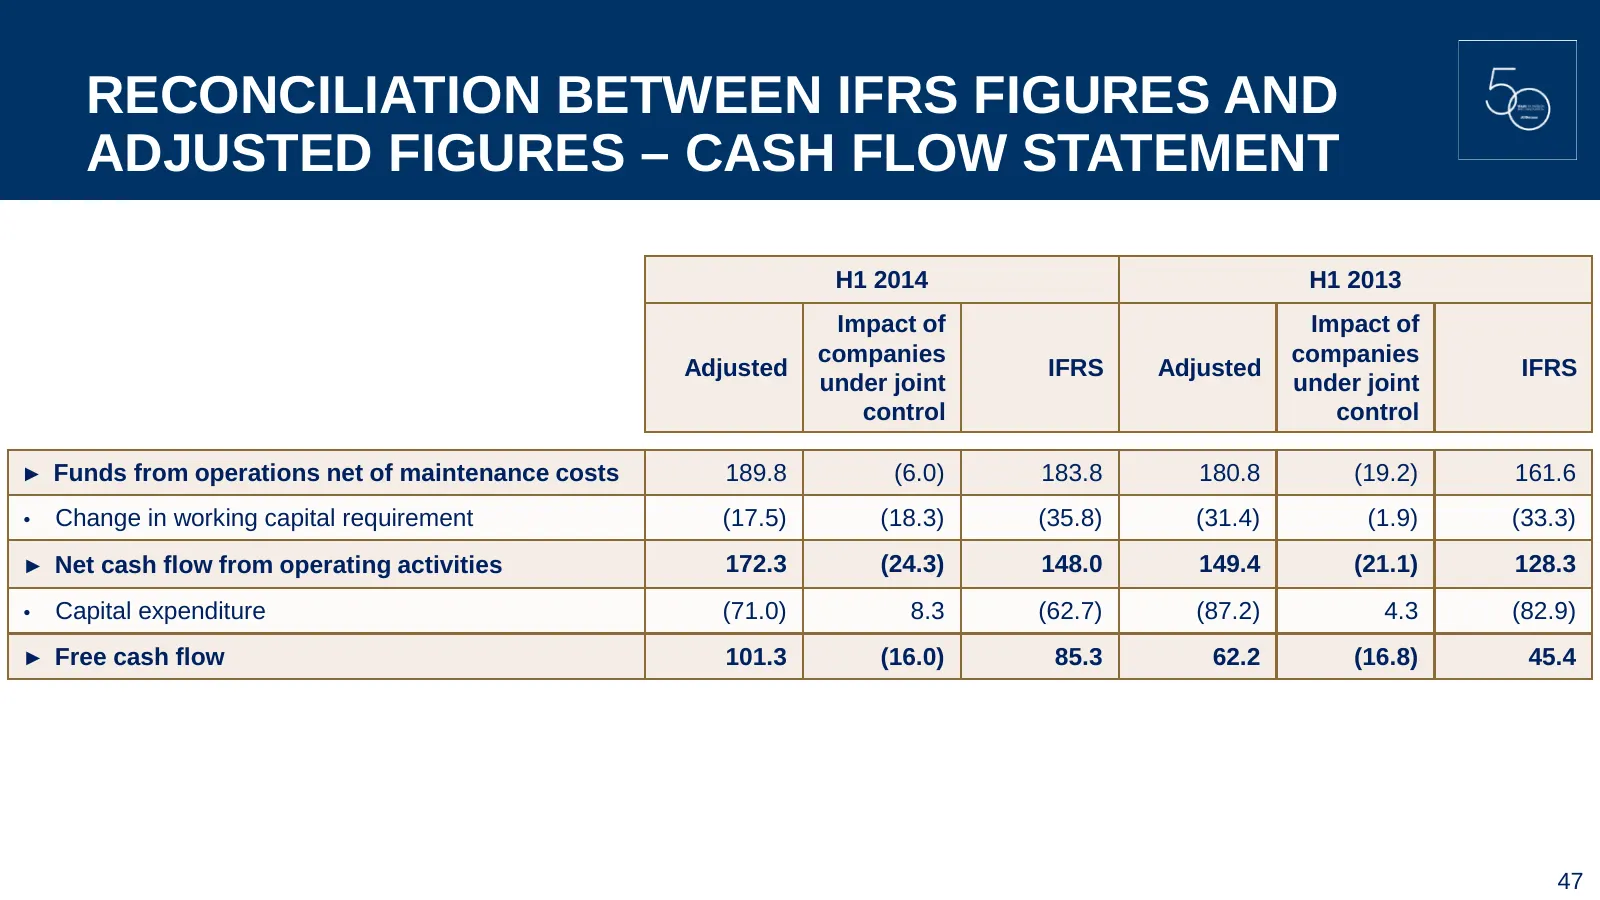
RECONCILIATION BETWEEN IFRS FIGURES AND ADJUSTED FIGURES – CASH FLOW STATEMENT H1 2014 H1 2013 Impact of Impact of companies companies Adjusted IFRS Adjusted IFRS under joint under joint control control ► Funds from operations net of maintenance costs 189.8 (6.0) 183.8 180.8 (19.2) 161.6 • Change in
Slide 48: Financial Definitions
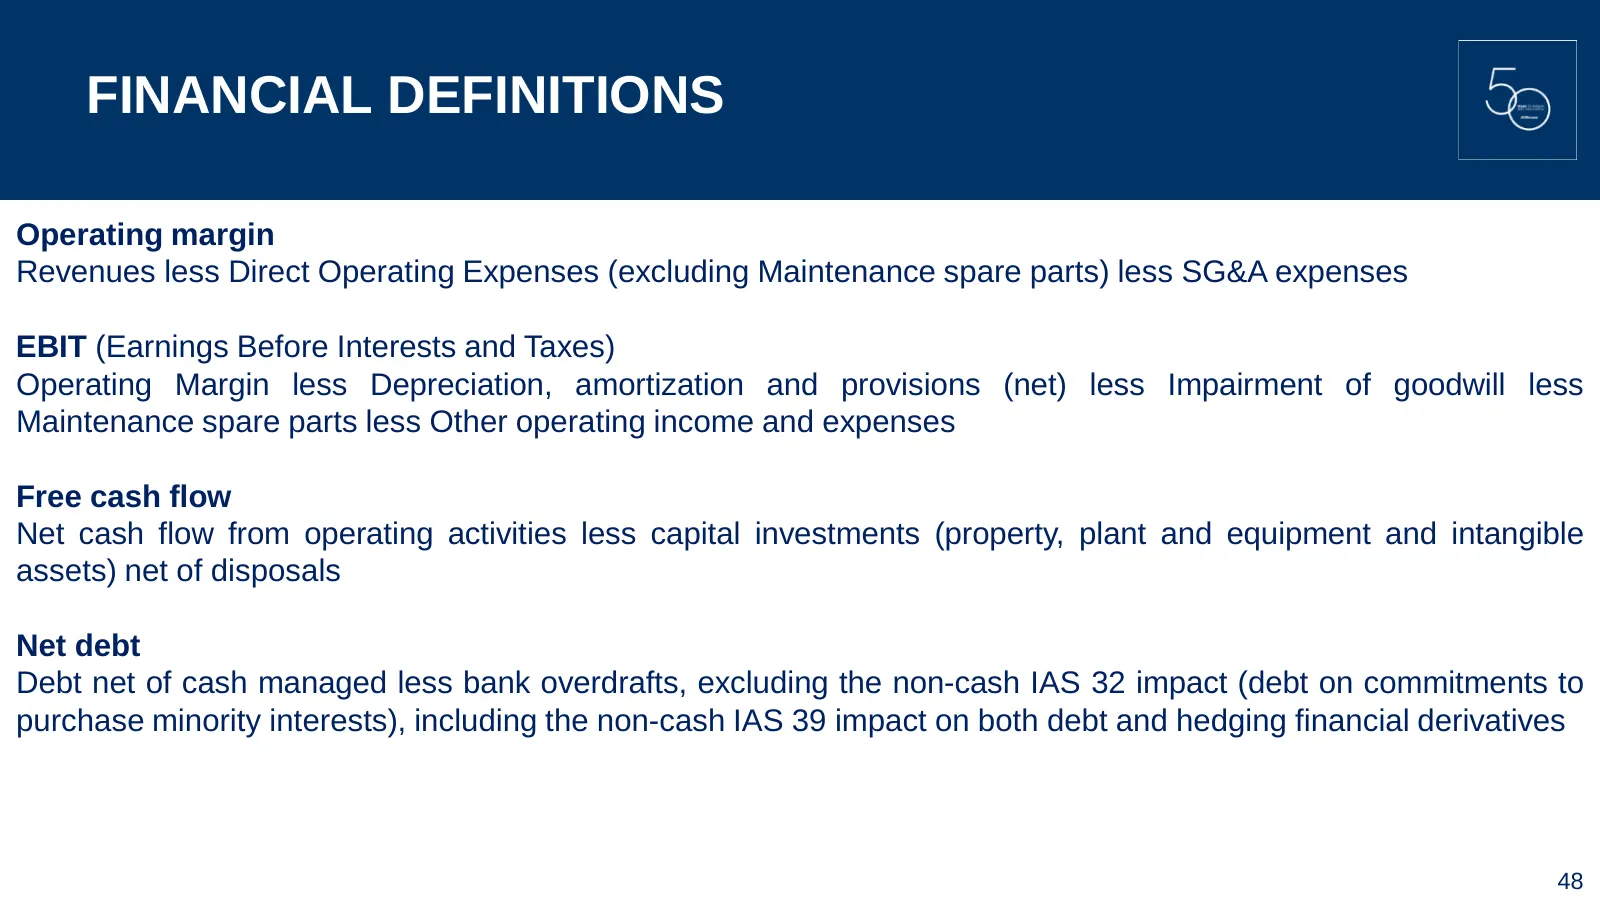
FINANCIAL DEFINITIONS Operating margin Revenues less Direct Operating Expenses (excluding Maintenance spare parts) less SG&A expenses EBIT (Earnings Before Interests and Taxes) Operating Margin less Depreciation, amortization and provisions (net) less Impairment of goodwill less Maintenance spare pa

Slide 49: Forward Looking Statements
FORWARD LOOKING STATEMENTS This presentation may contain some forward-looking statements. These statements are not undertakings as to the future performance of the Company. Although the Company considers that such statements are based on reasonable expectations and assumptions on the date of publica

Slide 50: Years of Passion and Innovation
YEARS OF PASSION AND INNOVATION JCDecaux
Source: Internet Archive copy of jcdecaux.com
More decks from JCDecaux SE
 Q2 2026 Earnings Presentation45 slides · Jul 30, 2026
 Shareholder Meeting (May 2026)97 slides · May 13, 2026
 FY2025 Earnings Presentation48 slides · Mar 12, 2026
 H1 2025 Earnings Presentation43 slides · Jul 31, 2025
 FY2024 Earnings Presentation47 slides · Mar 6, 2025
 H1 2024 Earnings Presentation48 slides · Jul 25, 2024