CyberAgent Incorporated · TSE:4751
CyberAgent — FY2009 Earnings Presentation
45 slides from CyberAgent's earnings presentation, November 2009
Slide 1: Table of Contents
0 Table of Contents Overview of Consolidated Financial Results 1 -Overview of Consolidated Financial Results for Fourth Quarter -Overview of Consolidated Financial Results for the Whole Fiscal Year 2 Consolidated Business Forecast 3 Major Business 4 Ameba Business 5 Summary 1
Slide 2: Overview of Consolidated Financial Results of Fourth Quarter
1 Overview of Consolidated Financial Results Overview of Consolidated Financial Results of Fourth Quarter July 2009-September 2009 2
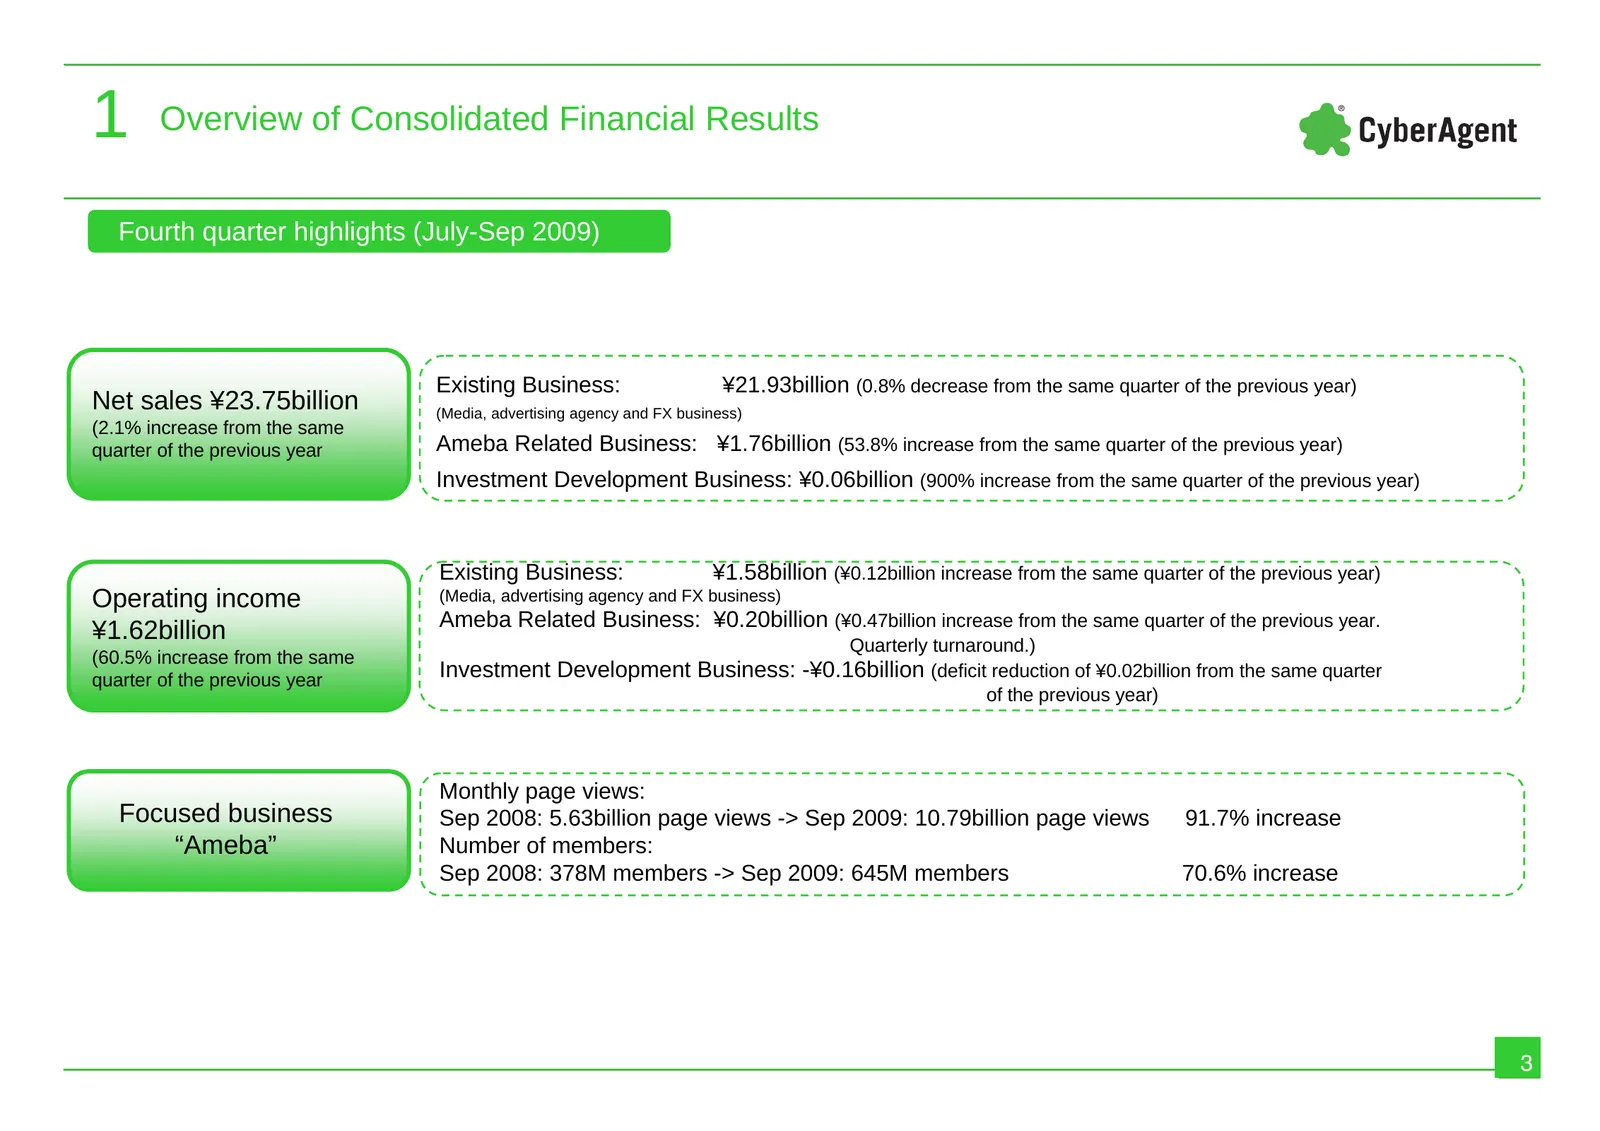
Slide 3: Fourth quarter highlights (July-Sep 2009)
1 Overview of Consolidated Financial Results Fourth quarter highlights (July-Sep 2009) Existing Business: ¥21.93billion (0.8% decrease from the same quarter of the previous year) Net sales ¥23.75billion (Media, advertising agency and FX business) (2.1% increase from the same quarter of the previous
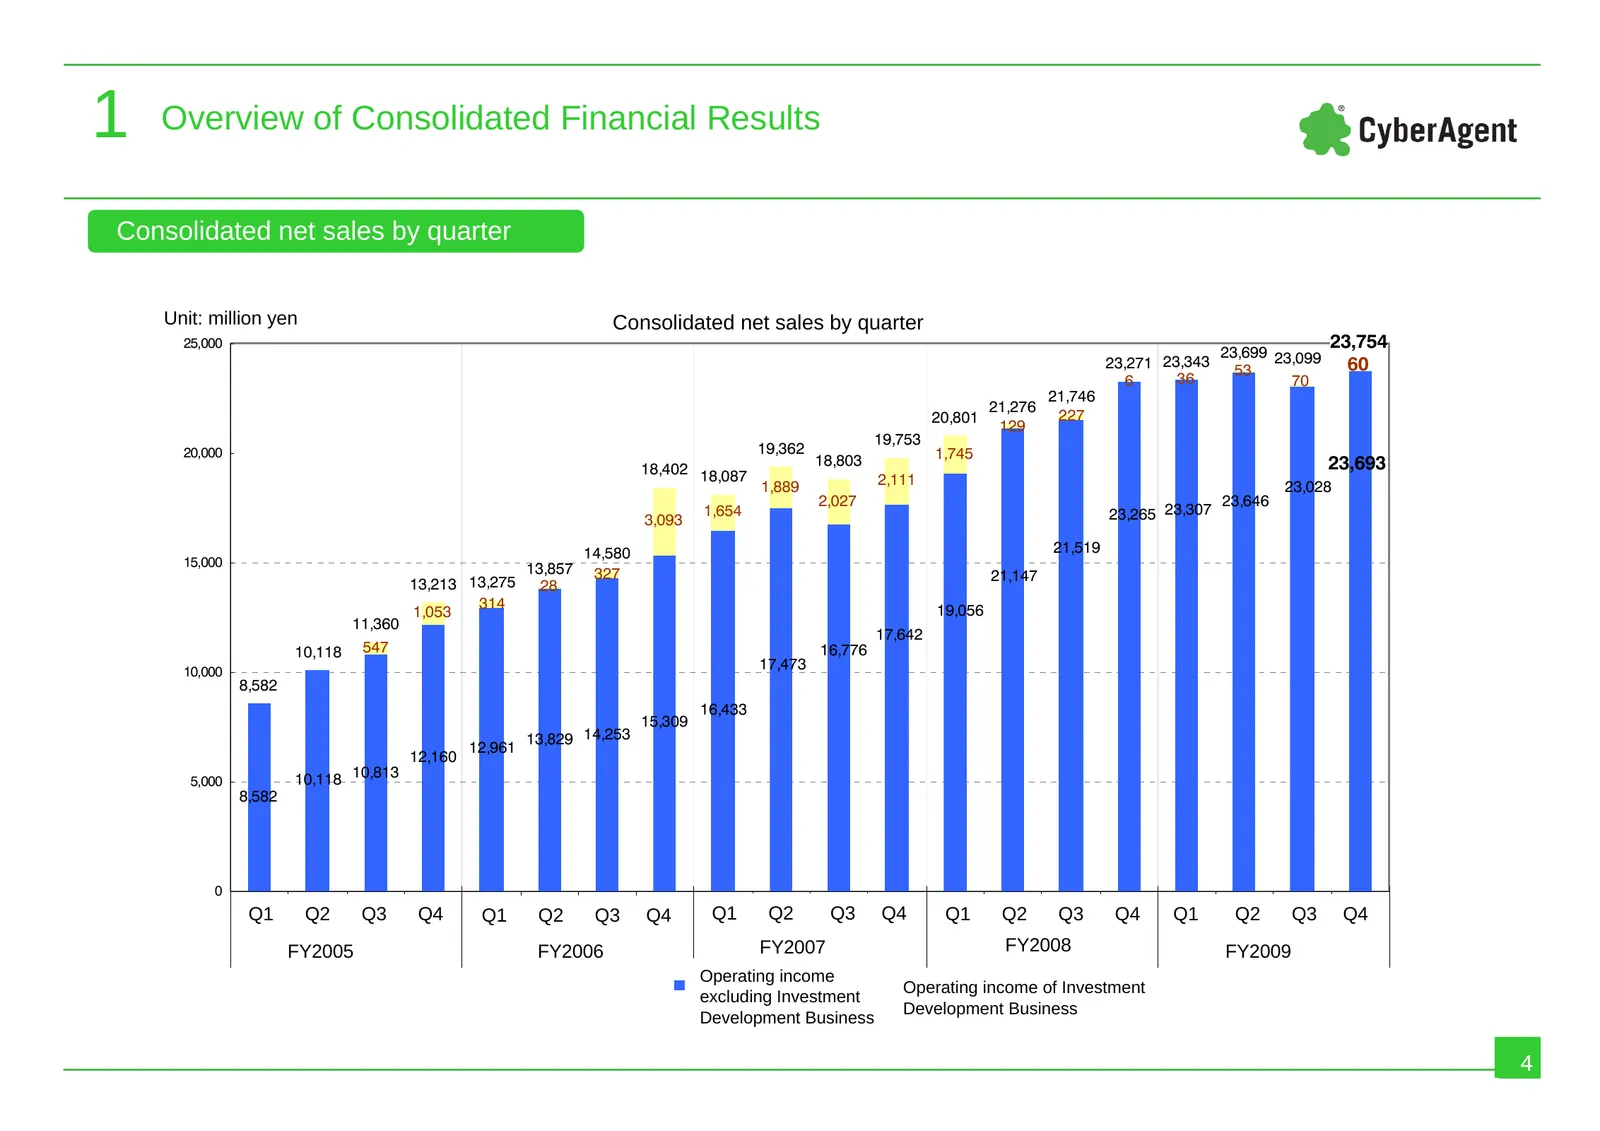
Slide 4: Consolidated net sales by quarter
1 Overview of Consolidated Financial Results Consolidated net sales by quarter Unit: million yen Consolidated net sales by quarter 25,000 23,754 23,699 23,099 23,271 23,343 53 60 6 36 70 21,746 21,276 20,801 227 129 19,753 20,000 19,362 1,745 18,803 23,693 18,402 18,087 1,889 2,111 23,028 2,027 23,6
Slide 5: Operating income by quarter
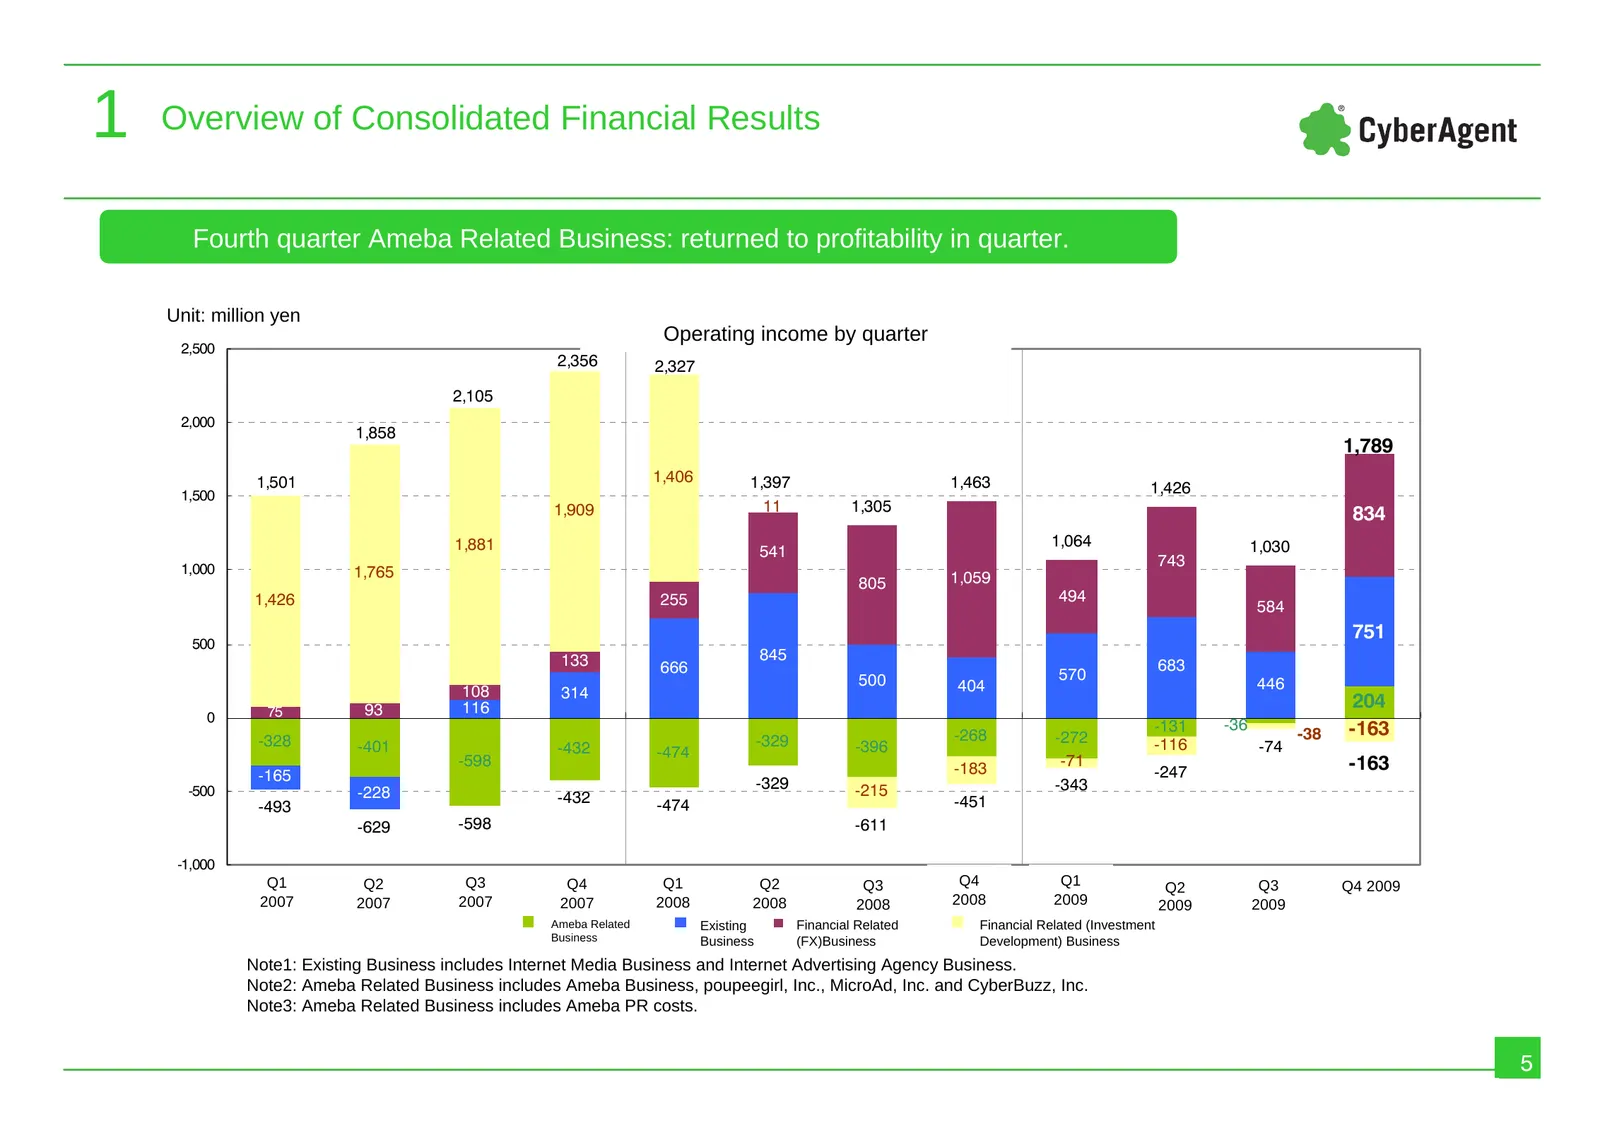
1 Overview of Consolidated Financial Results Fourth quarter Ameba Related Business: returned to profitability in quarter. Unit: million yen Operating income by quarter 2,500 2,356 2,327 2,105 2,000 1,858 1,789 1,501 1,406 1,397 1,463 1,500 1,426 1,909 11 1,305 834 1,881 1,064 1,030 541 1,000 743 1,7
Slide 6: PL
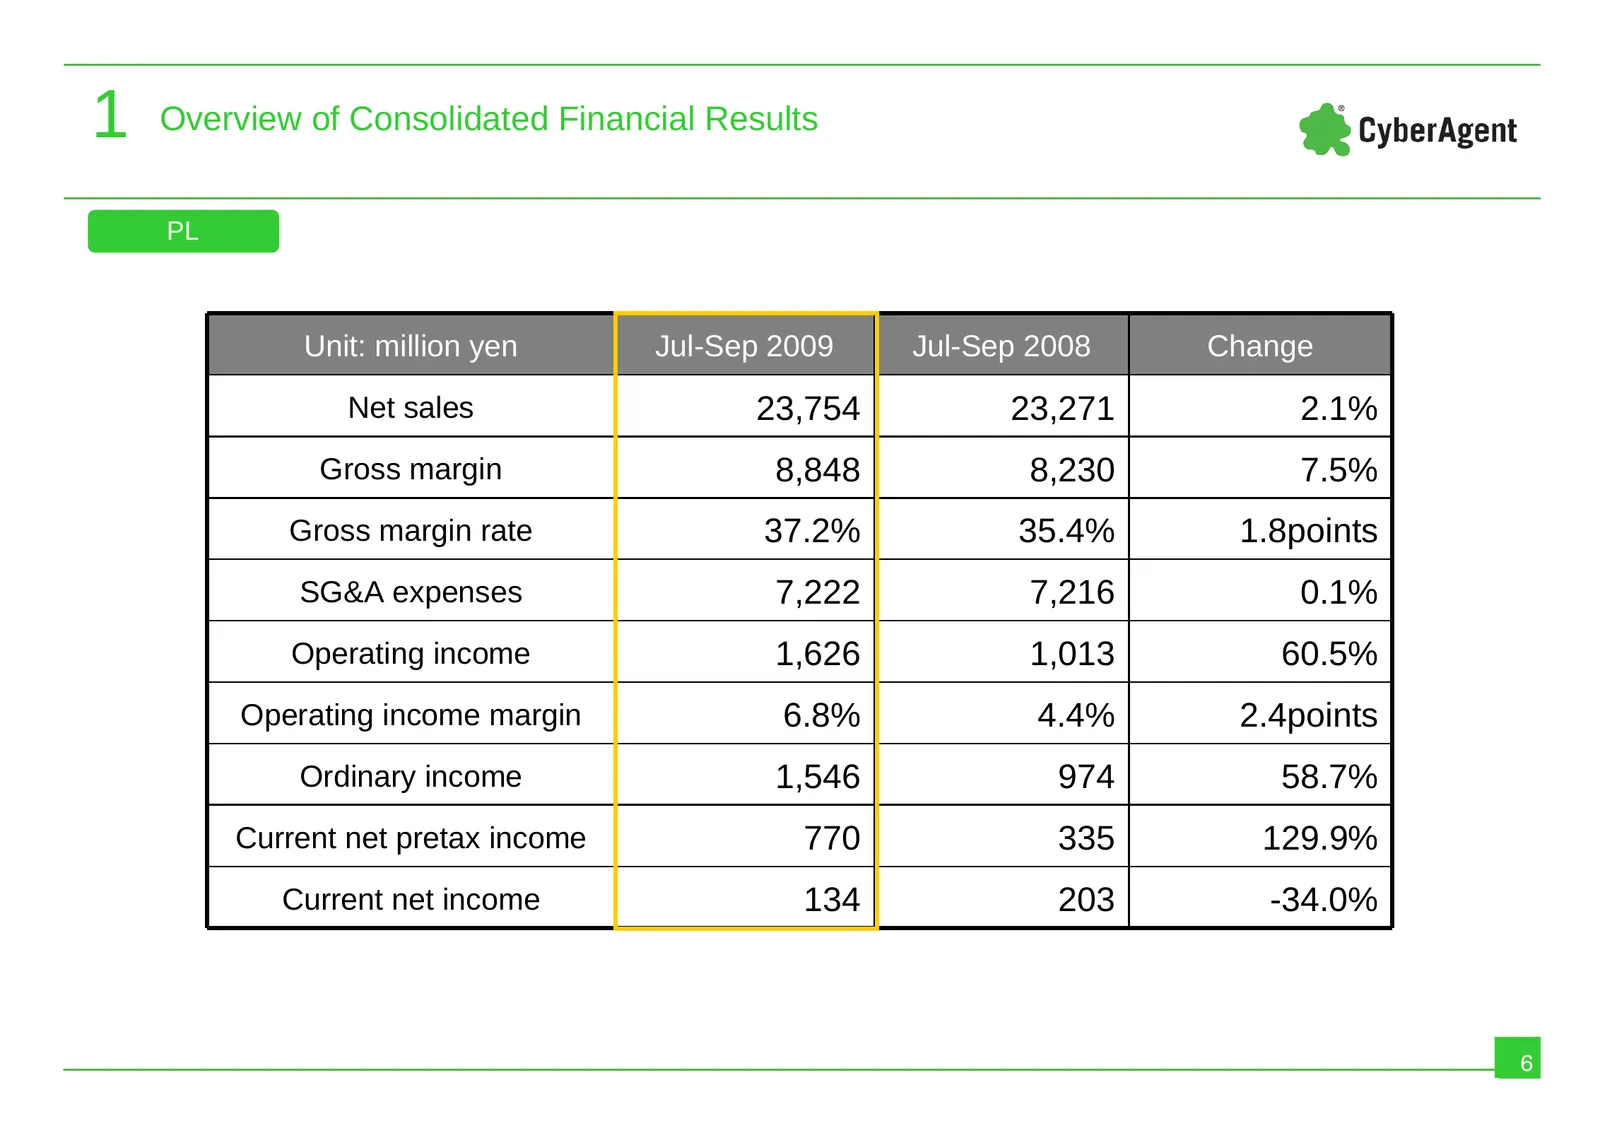
1 Overview of Consolidated Financial Results PL Unit: million yen Jul-Sep 2009 Jul-Sep 2008 Change Net sales 23,754 23,271 2.1% Gross margin 8,848 8,230 7.5% Gross margin rate 37.2% 35.4% 1.8points SG&A expenses 7,222 7,216 0.1% Operating income 1,626 1,013 60.5% Operating income margin 6.8% 4.4% 2.
Slide 7: Consolidated SG&A expenses by quarter
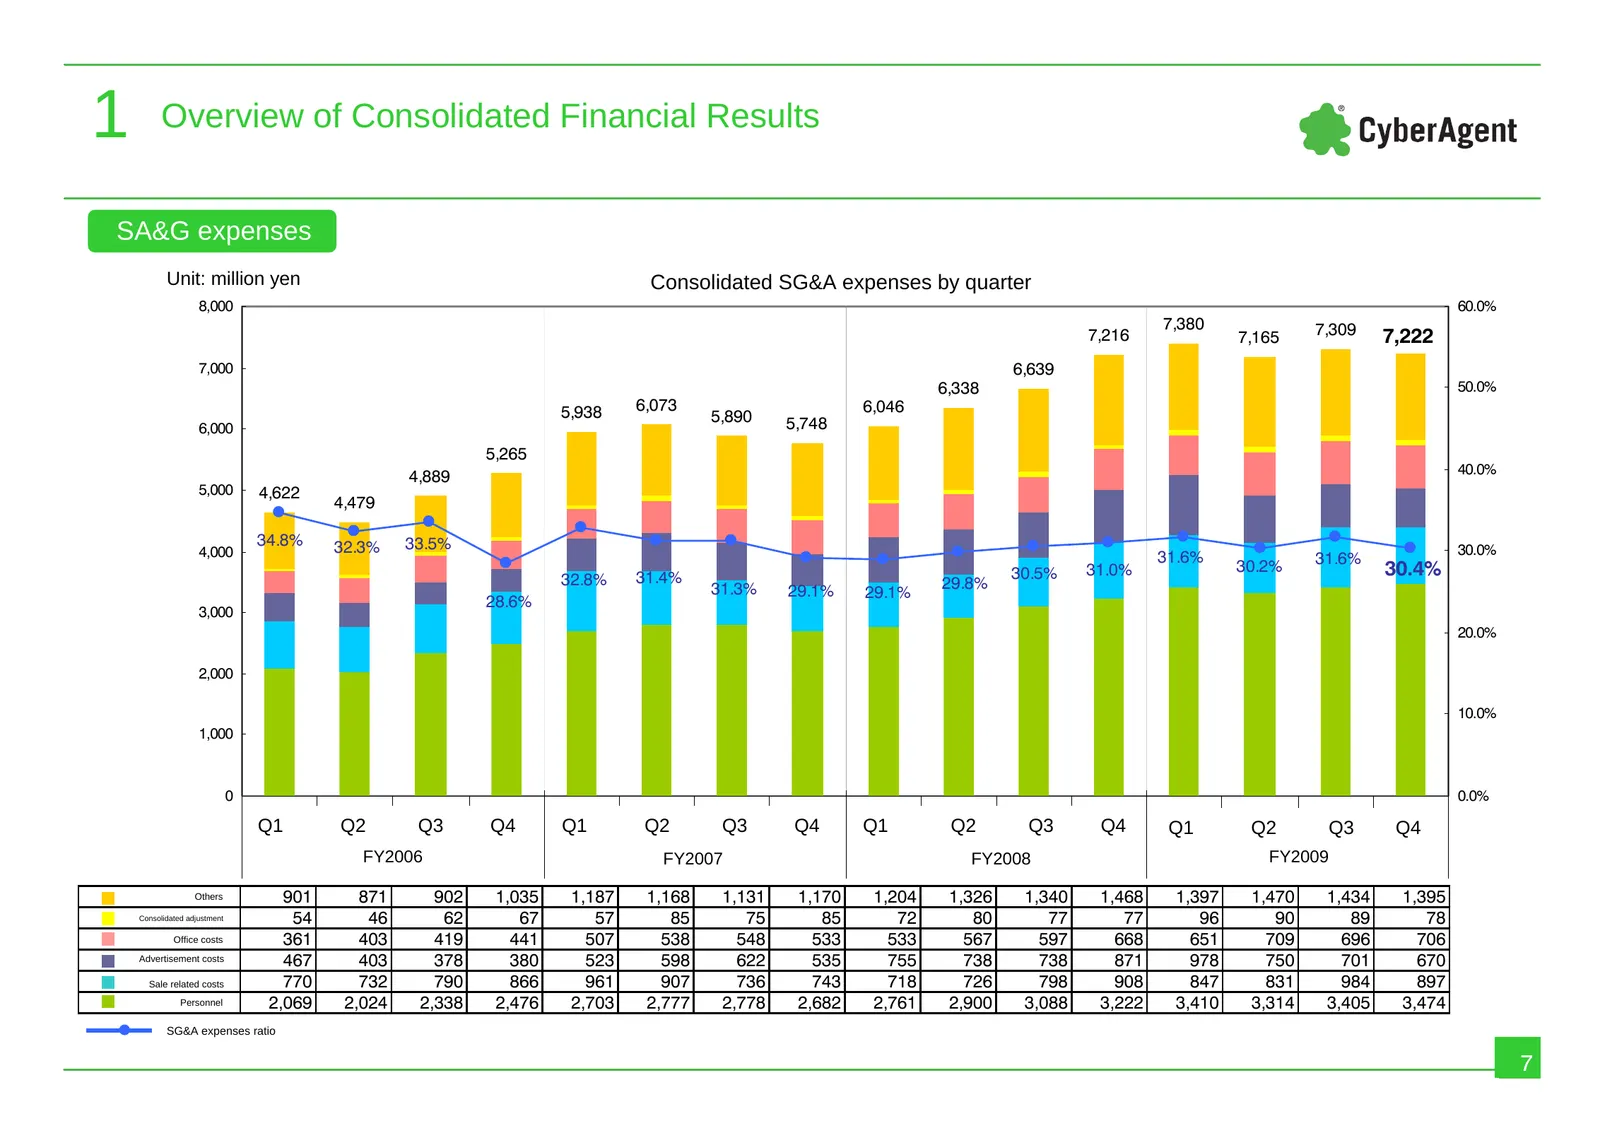
1 Overview of Consolidated Financial Results SA&G expenses Unit: million yen Consolidated SG&A expenses by quarter 8,000 60.0% 7,380 7,309 7,216 7,165 7,222 7,000 6,639 6,338 50.0% 5,938 6,073 6,046 5,890 5,748 6,000 5,265 40.0% 4,889 5,000 4,622 4,479 34.8% 32.3% 33.5% 4,000 31.6% 30.0% 31.6% 32.8%
Slide 8: Number of employees in consolidated companies
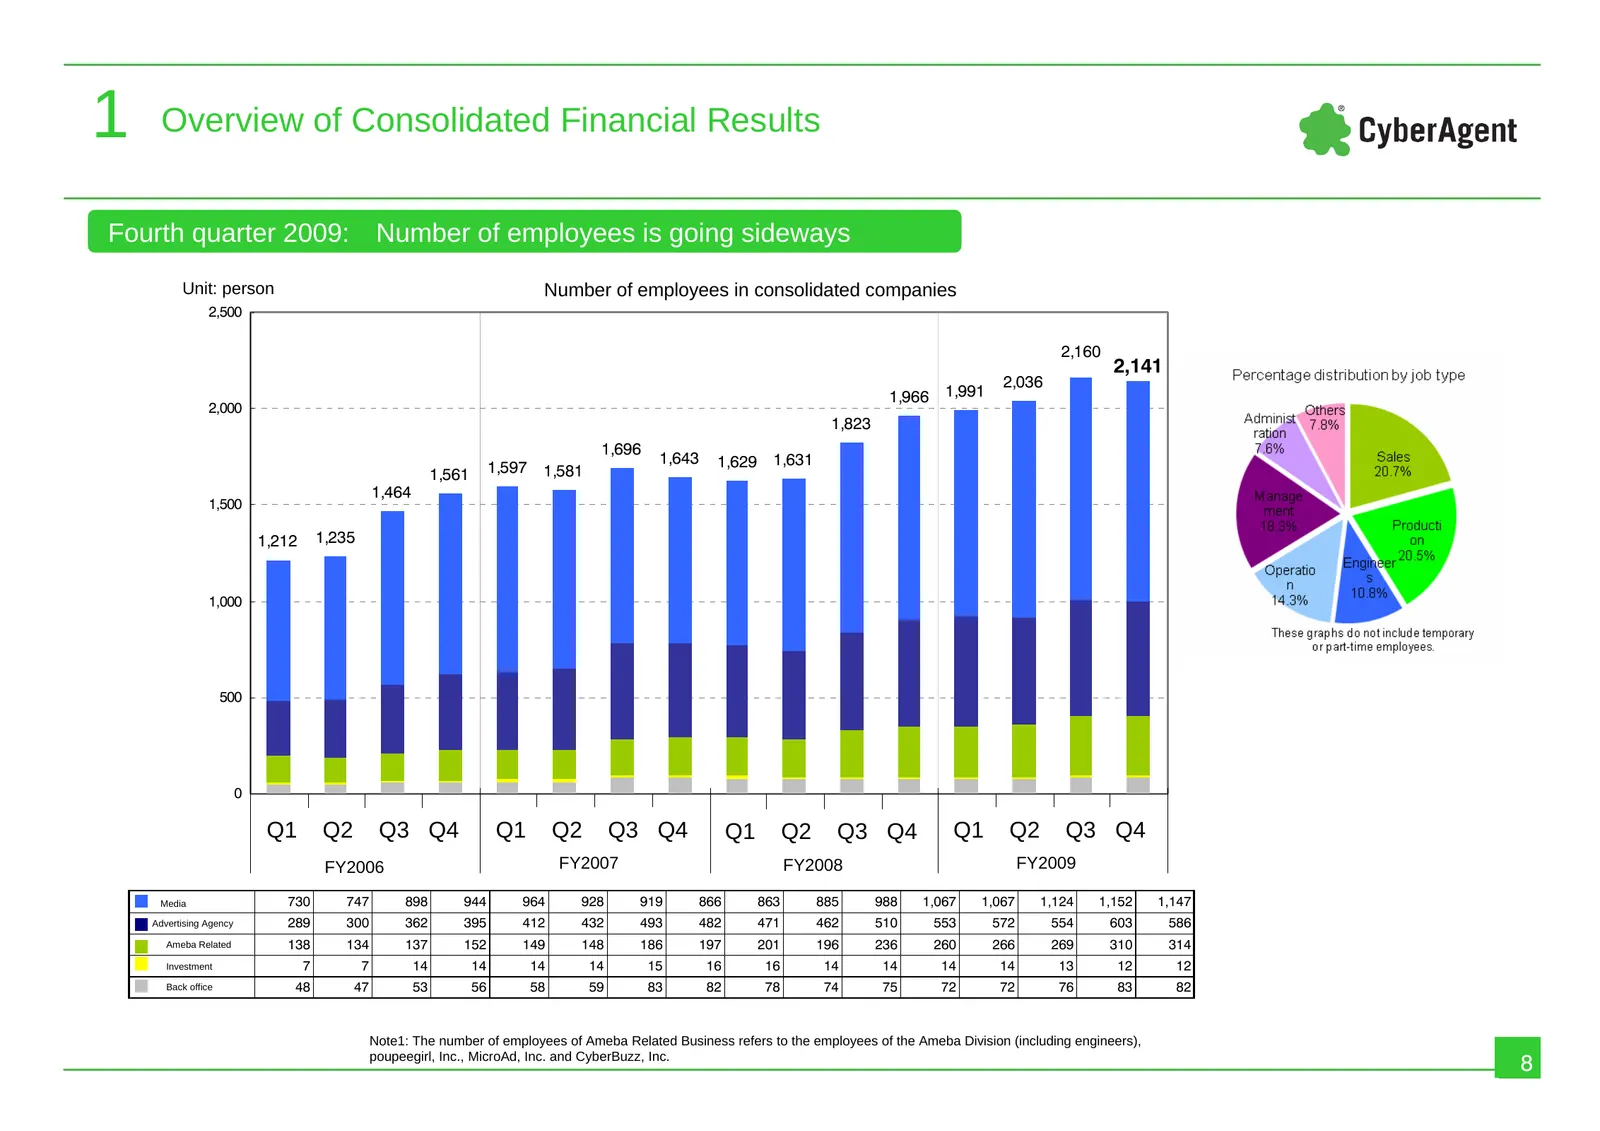
1 Overview of Consolidated Financial Results Fourth quarter 2009: Number of employees is going sideways Unit: person Number of employees in consolidated companies 2,500 2,160 2,141 2,036 1,966 1,991 2,000 1,823 1,696 1,643 1,629 1,631 1,561 1,597 1,581 1,464 1,500 1,212 1,235 1,000 500 0 Q1 Q2 Q3 Q4
Slide 9: Overview of Consolidated Financial Results for the Whole Fiscal Year
1 Overview of Consolidated Financial Results Overview of Consolidated Financial Results for the Whole Fiscal Year October 2008-September 2009 9
Slide 10: Consolidated financial results by fiscal year
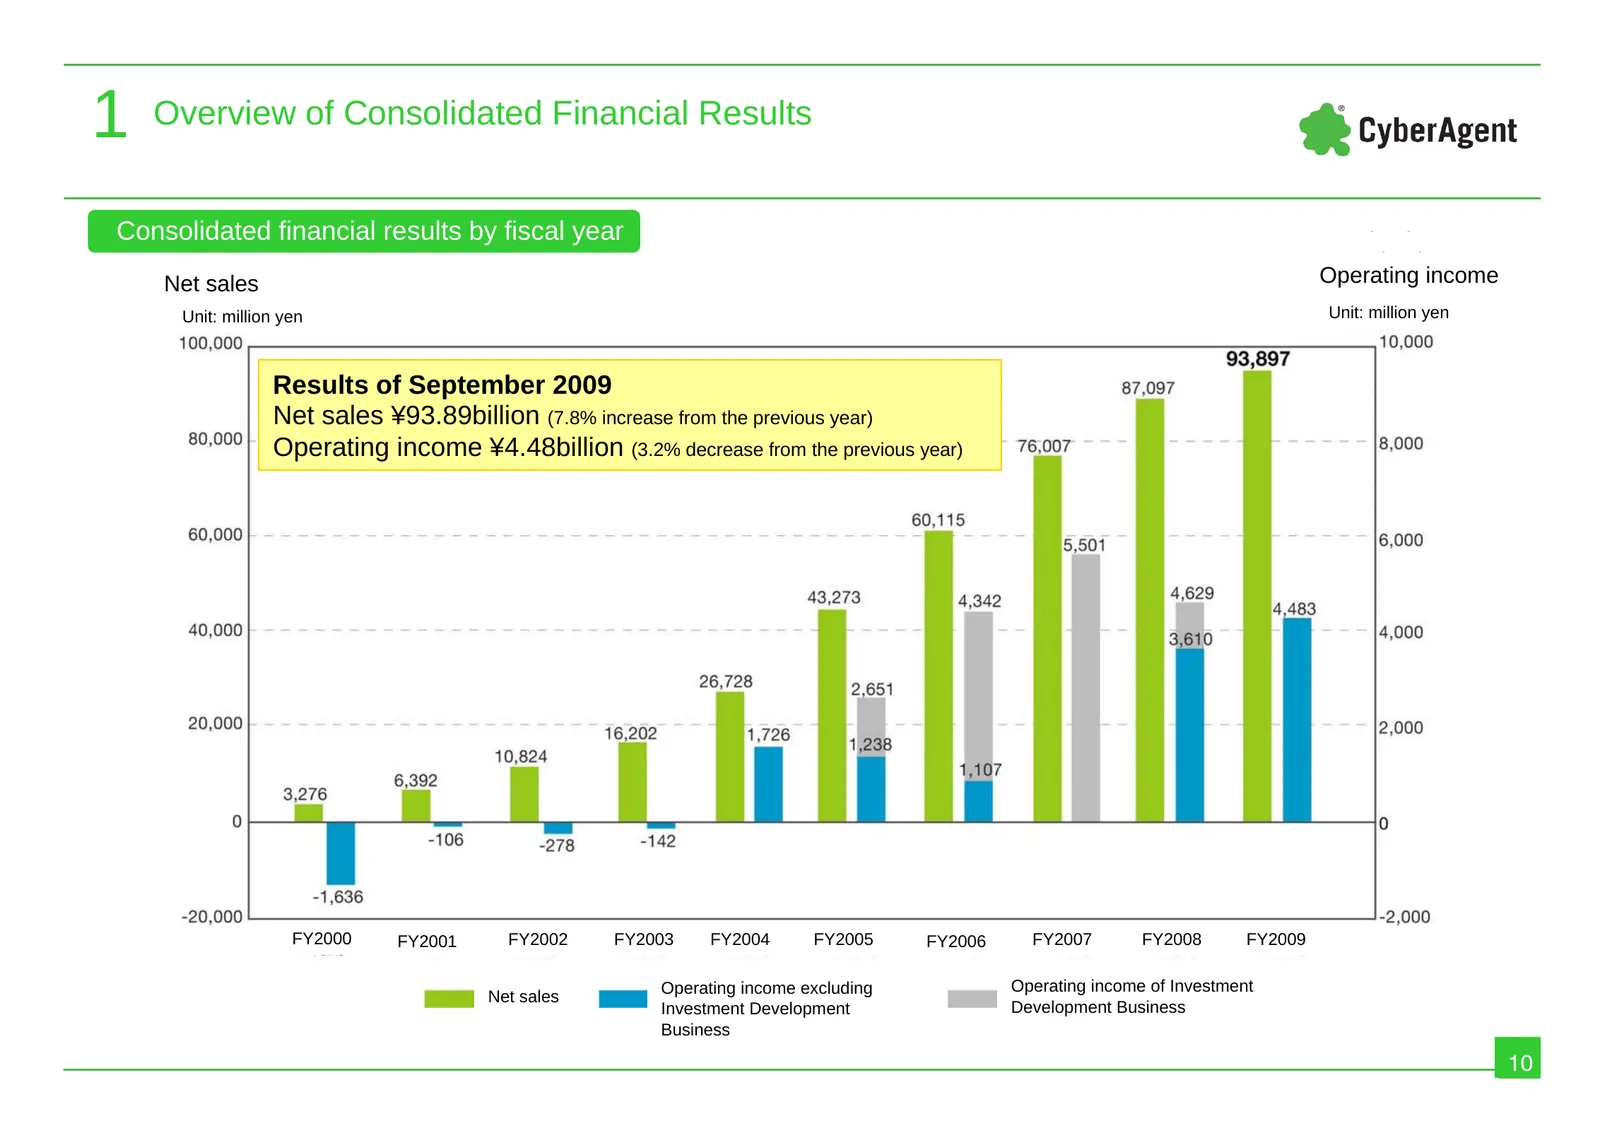
1 Overview of Consolidated Financial Results Consolidated financial results by fiscal year Operating income Operating Operating Operating income income Unit: million yen income Operating income Net sales Unit: million yen Unit: million yen Results of September 2009 Net sales ¥93.89billion (7.8% incr
Slide 11: Breakout by segments of operating income
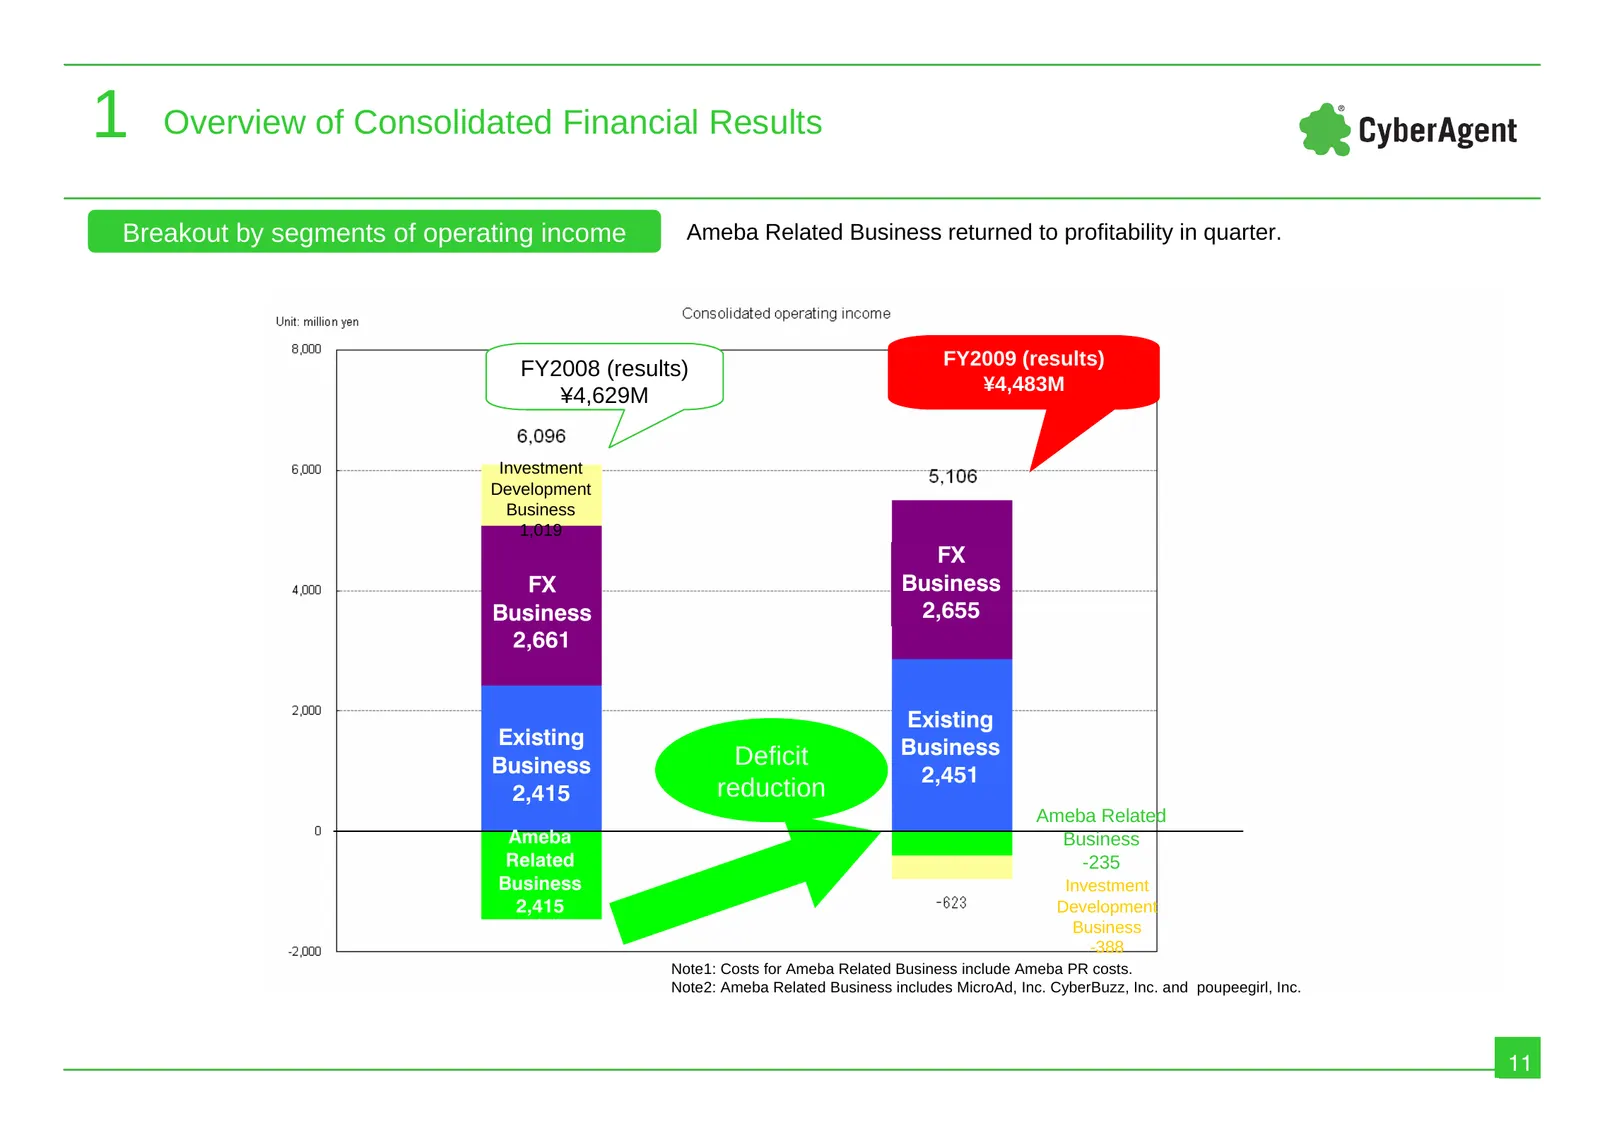
1 Overview of Consolidated Financial Results Breakout by segments of operating income Ameba Related Business returned to profitability in quarter. FY2009 (results) FY2008 (results) ¥4,483M ¥4,629M Investment Development Business 1,019 FX FX Business Business 2,655 2,661 Existing Existing Business Bu
Slide 12: BS
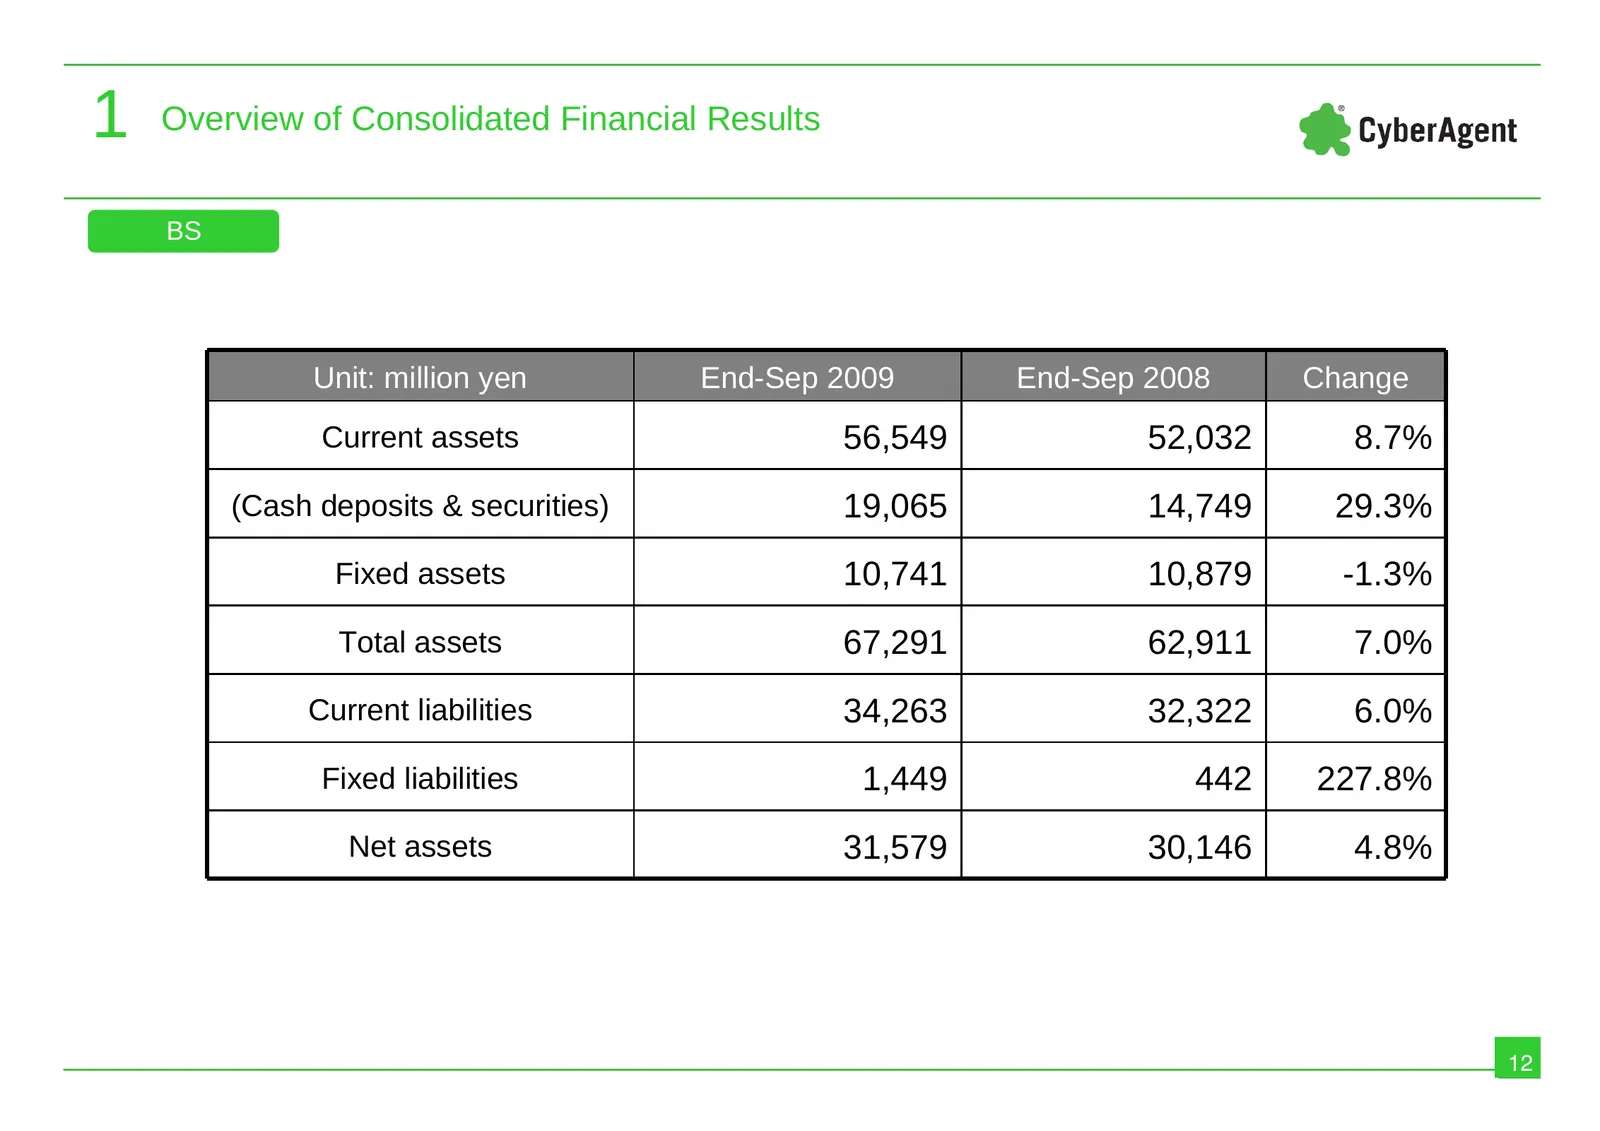
1 Overview of Consolidated Financial Results BS Unit: million yen End-Sep 2009 End-Sep 2008 Change Current assets 56,549 52,032 8.7% (Cash deposits & securities) 19,065 14,749 29.3% Fixed assets 10,741 10,879 -1.3% Total assets 67,291 62,911 7.0% Current liabilities 34,263 32,322 6.0% Fixed liabilit
Slide 13: Cash flow
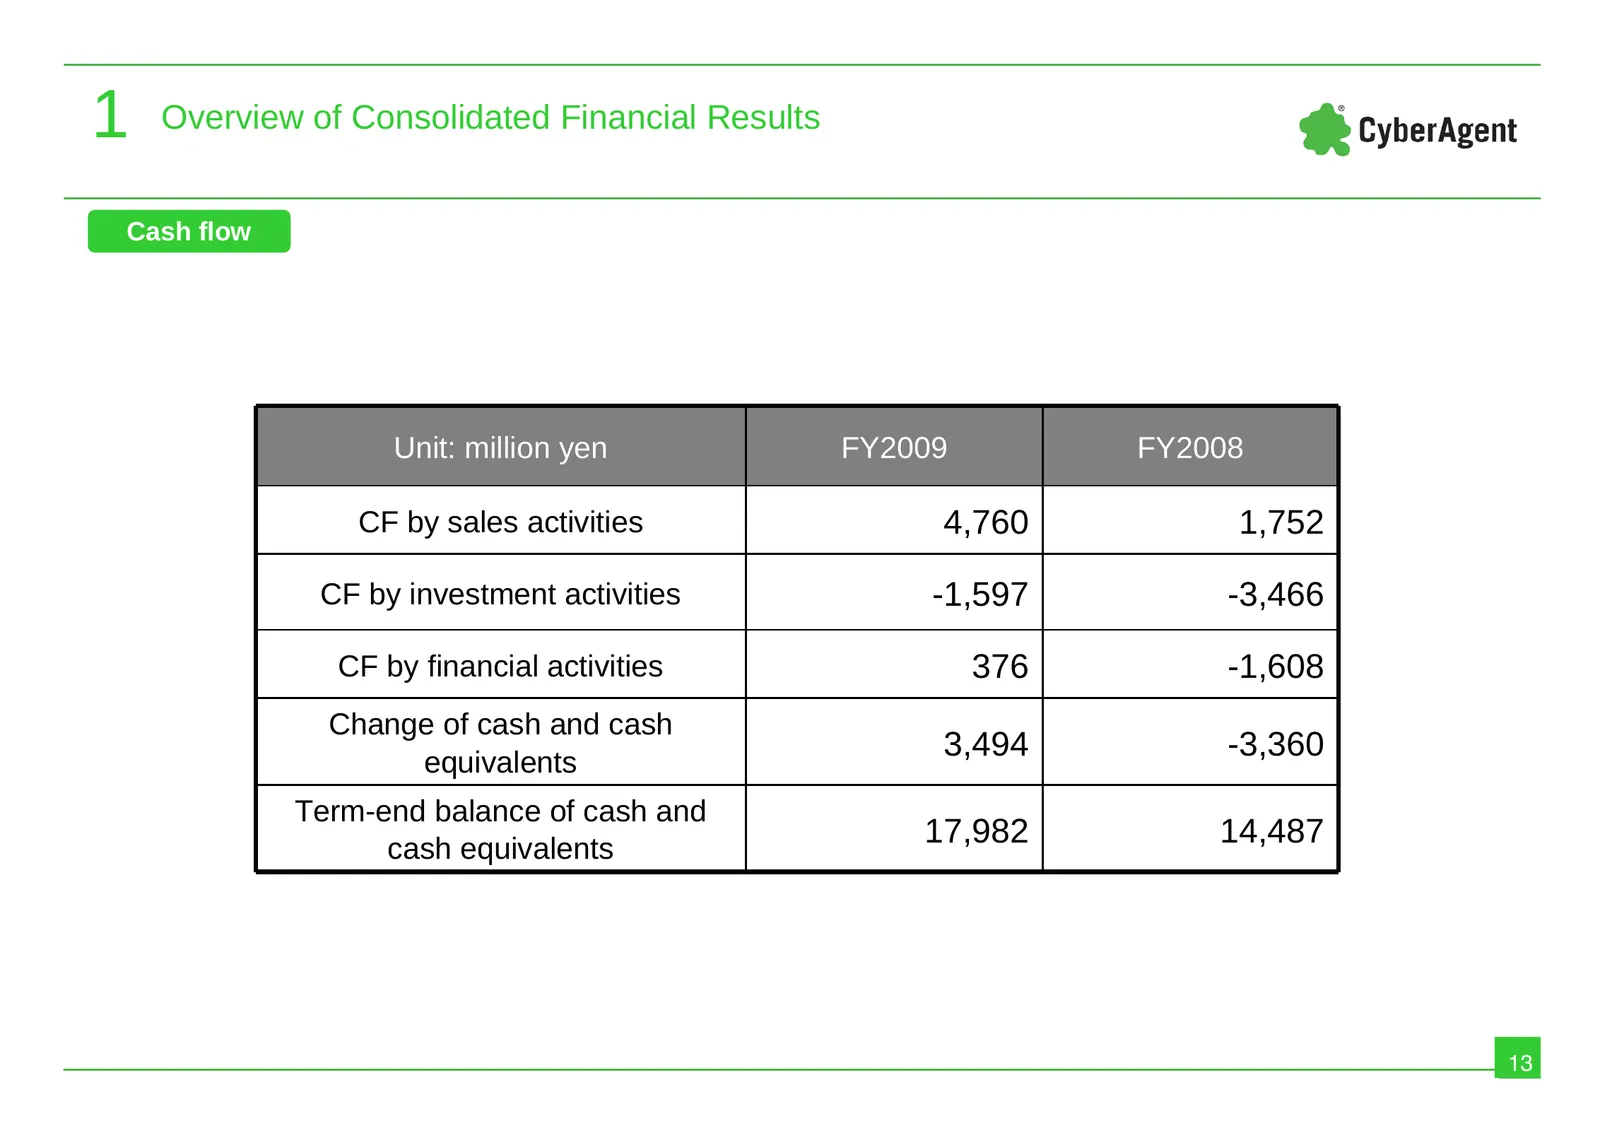
1 Overview of Consolidated Financial Results Cash flow Unit: million yen FY2009 FY2008 CF by sales activities 4,760 1,752 CF by investment activities -1,597 -3,466 CF by financial activities 376 -1,608 Change of cash and cash equivalents 3,494 -3,360 Term-end balance of cash and cash equivalents 17,

Slide 14: Consolidated Business Forecast for the Year Ending September 2010
2 Consolidated Business Forecast Consolidated Business Forecast for the Year Ending September 2010 14
Slide 15: Consolidated business forecast for FY2010
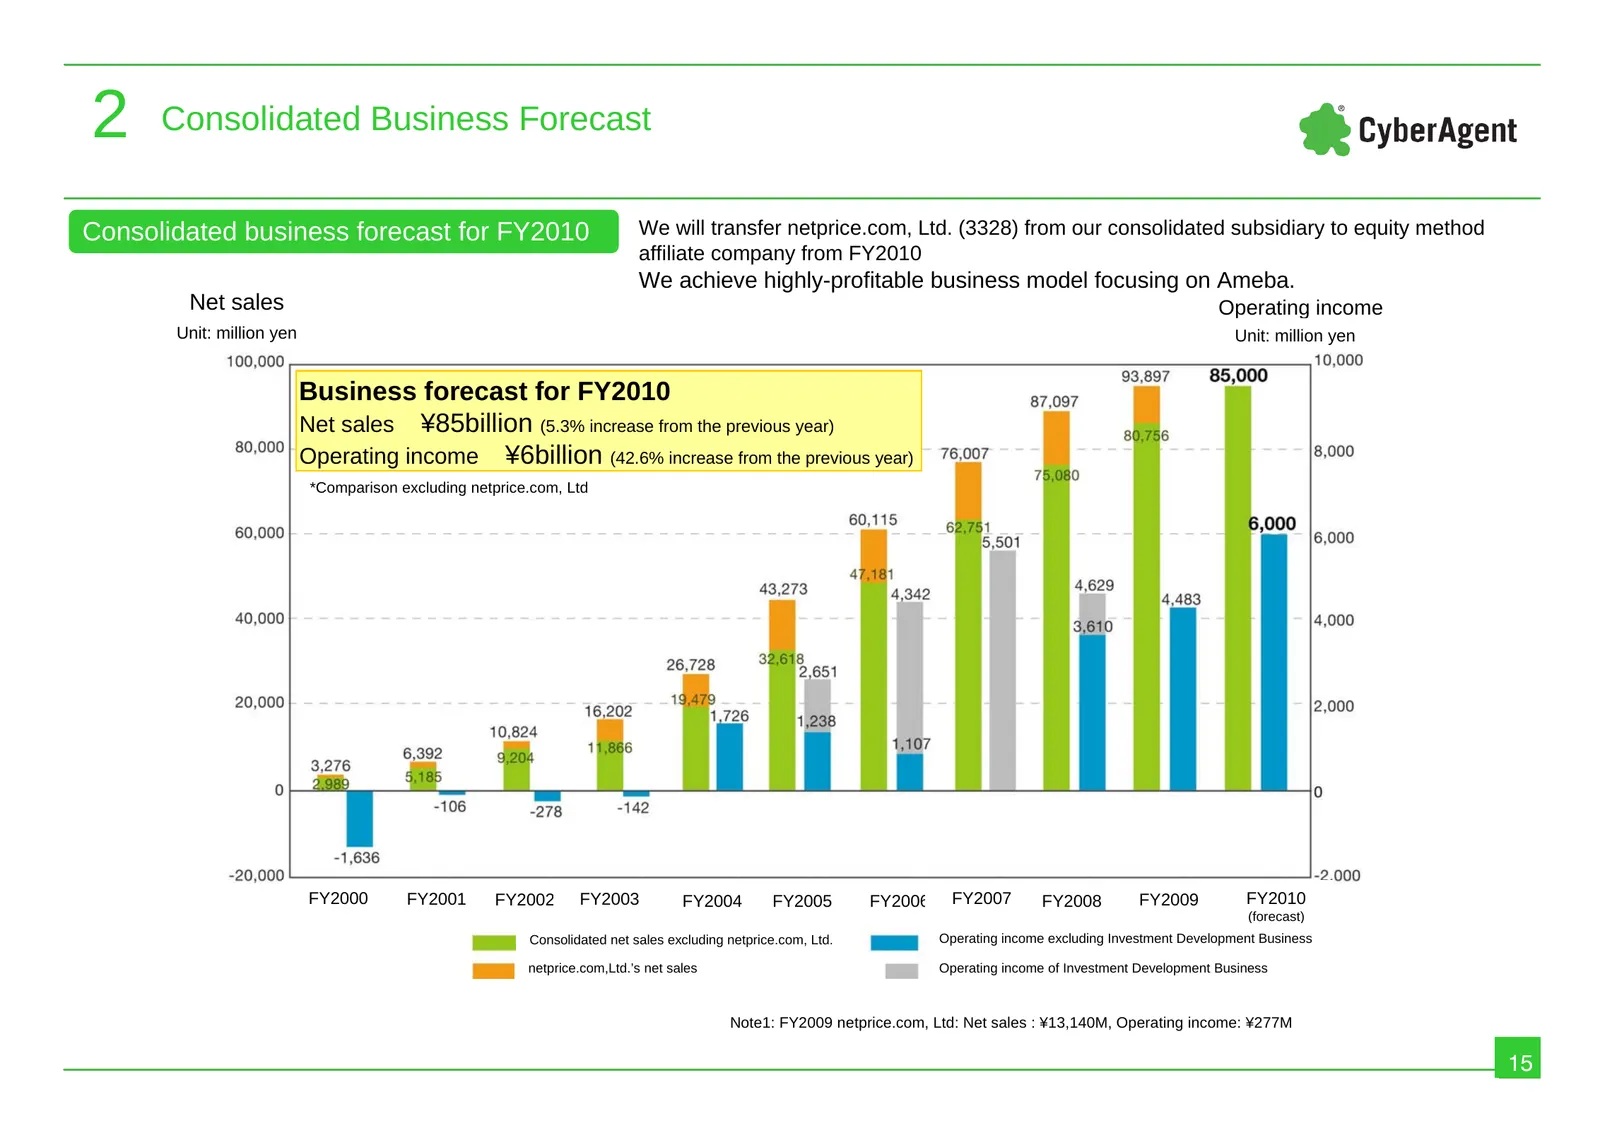
2 Consolidated Business Forecast Consolidated business forecast for FY2010 We will transfer netprice.com, Ltd. (3328) from our consolidated subsidiary to equity method affiliate company from FY2010 We achieve highly-profitable business model focusing on Ameba. Net sales Operating income Unit: millio
Slide 16: Consolidated Business Forecast for the Year Ending September 2010
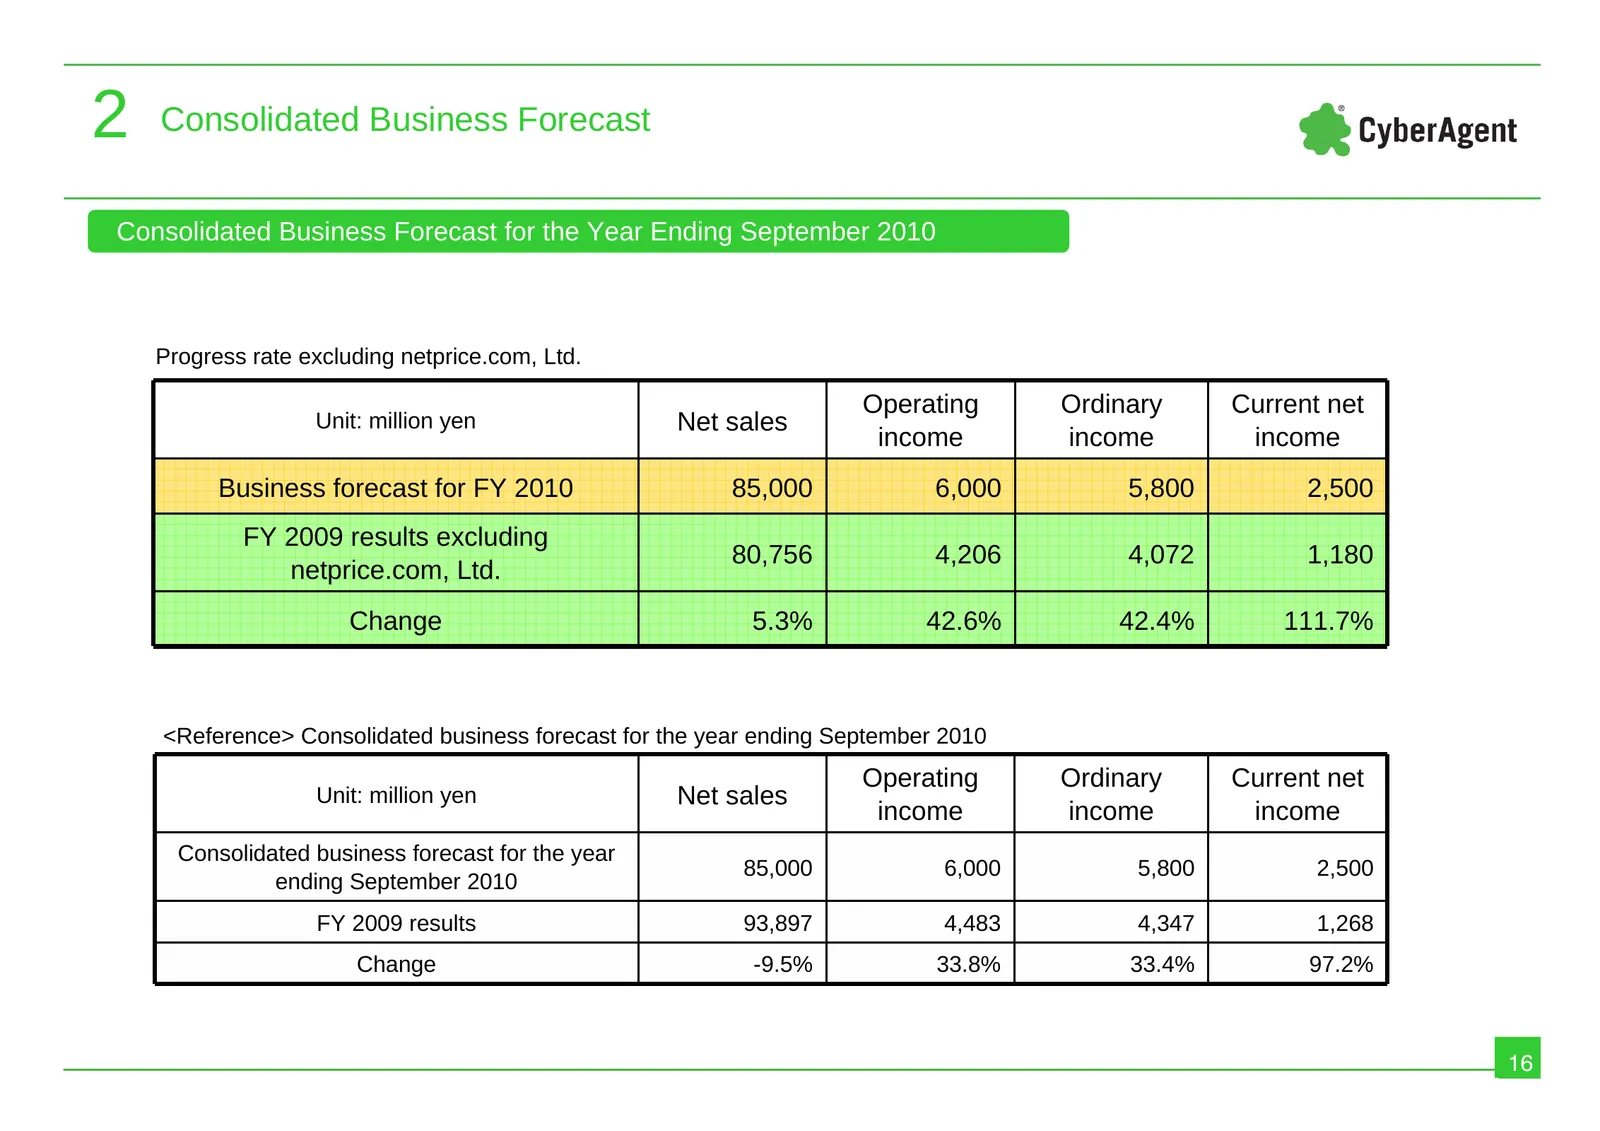
2 Consolidated Business Forecast Consolidated Business Forecast for the Year Ending September 2010 Progress rate excluding netprice.com, Ltd. Operating Ordinary Current net Unit: million yen Net sales income income income Business forecast for FY 2010 85,000 6,000 5,800 2,500 FY 2009 results excludi
Slide 17: Business Forecast FY2010 - Breakout by segments of operating income
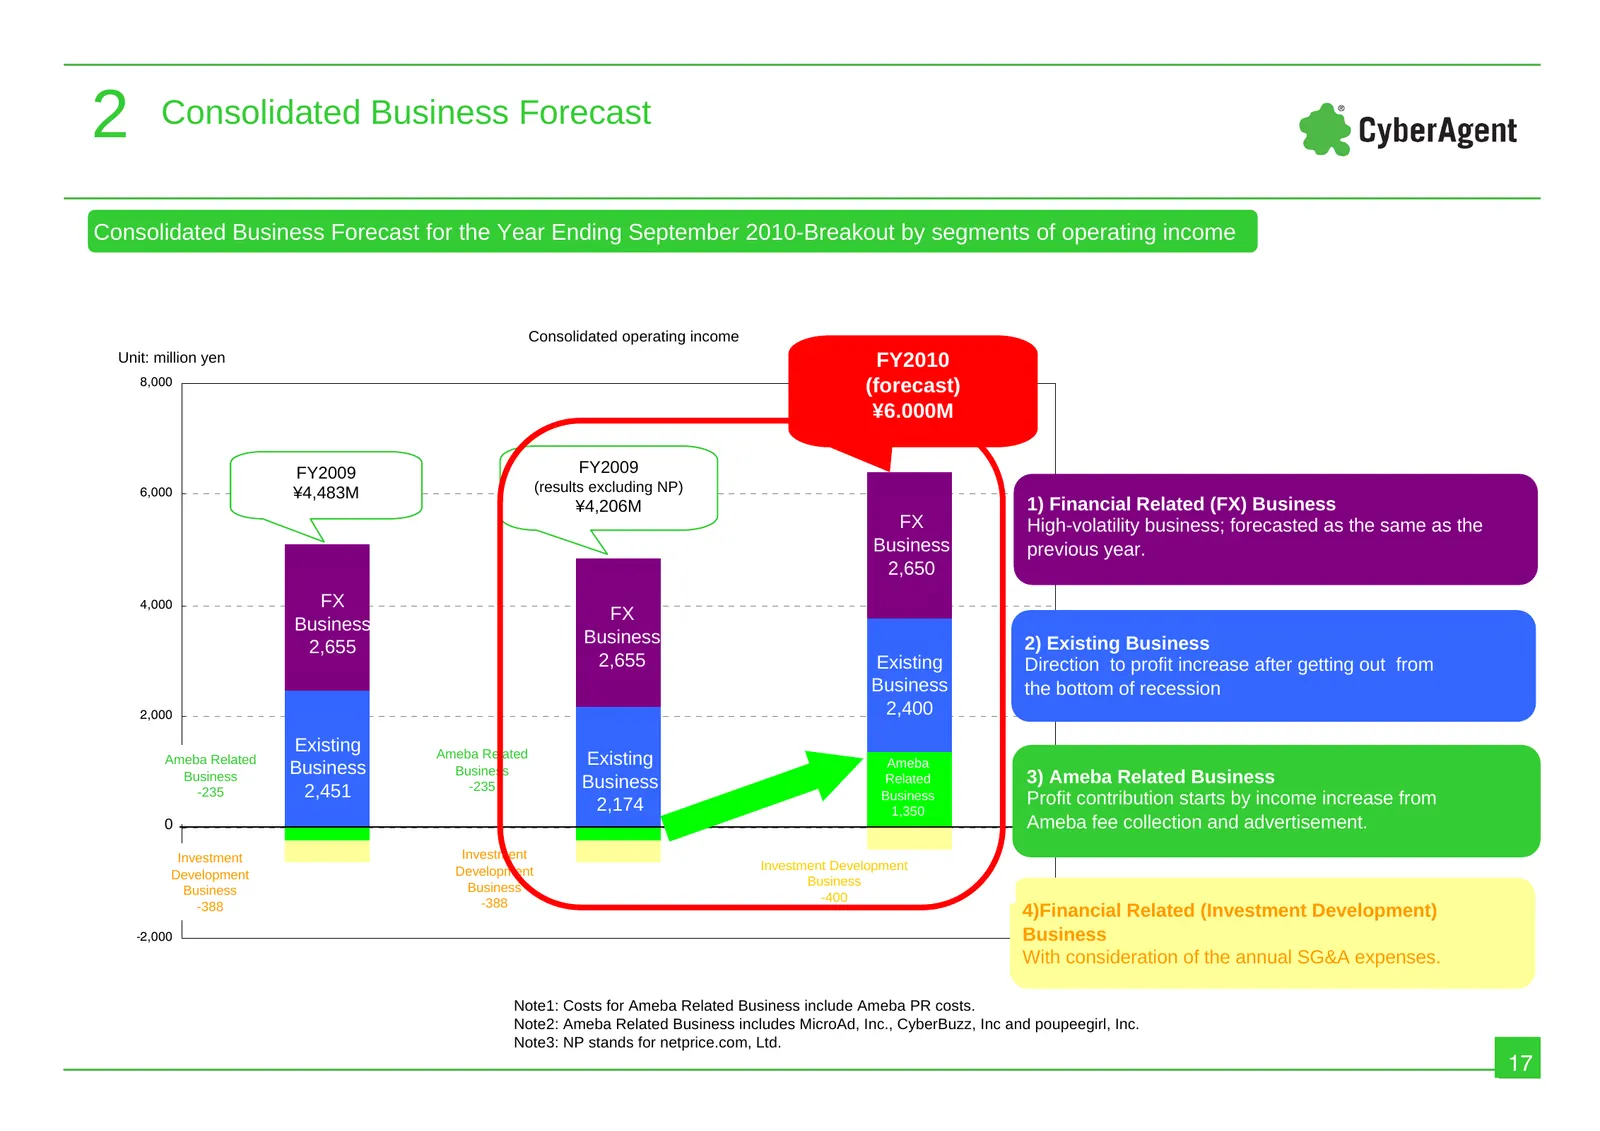
2 Consolidated Business Forecast 2009 9 Business Forecast for the Year Ending September 2010-Breakout by segments of operating income Consolidated Consolidated operating income Unit: million yen FY2010 8,000 (forecast) ¥6,000M FY2009 FY2009 6,000 ¥4,483M (results excluding NP) ¥4,206M 1) Financial R
Slide 18: Payout plan for shareholders
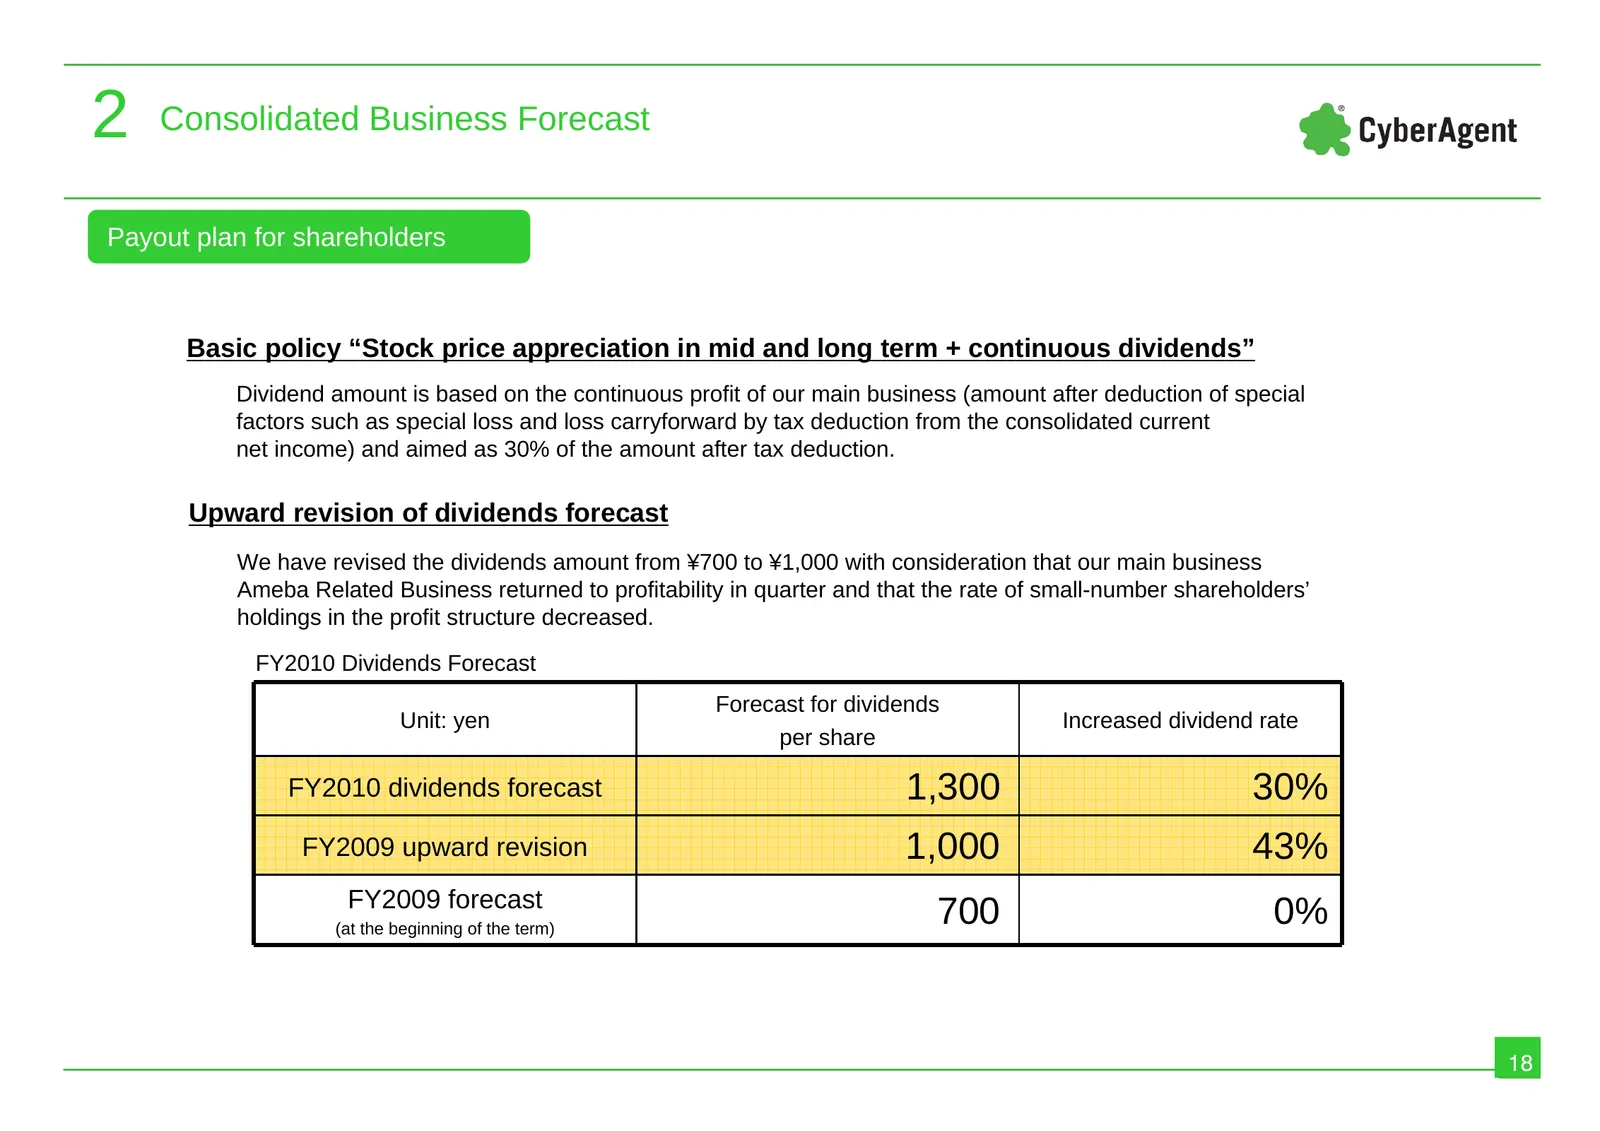
2 Consolidated Business Forecast Payout plan for shareholders Basic policy “Stock price appreciation in mid and long term + continuous dividends” Dividend amount is based on the continuous profit of our main business (amount after deduction of special factors such as special loss and loss carryforwa

Slide 19: Major Business
Major Business 3 Major Business 19
Slide 20: Major Business (Internet Advertising Agency Business)
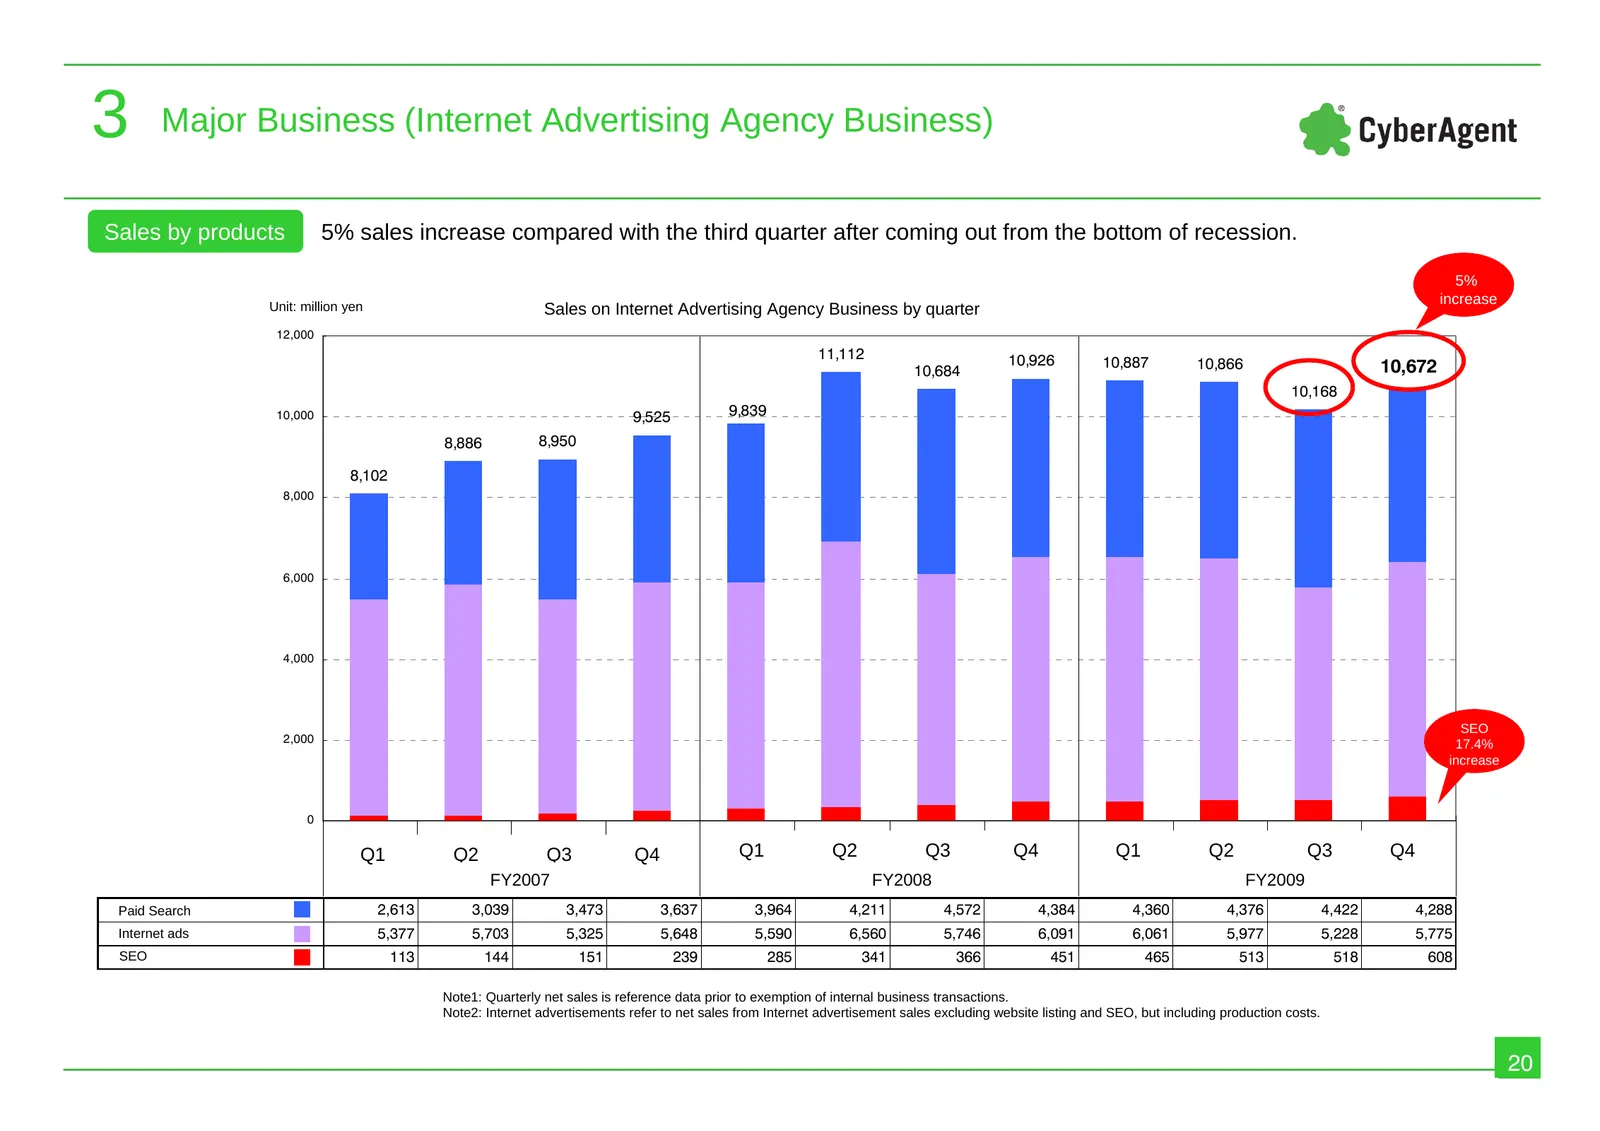
3 Major Business (Internet Advertising Agency Business) Sales by products 5% sales increase compared with the third quarter after coming out from the bottom of recession. 5% Unit: million yen increase Sales on Internet Advertising Agency Business by quarter 12,000 11,112 10,926 10,887 10,866 10,672
Slide 21: Major Business (Foreign Exchange Business)
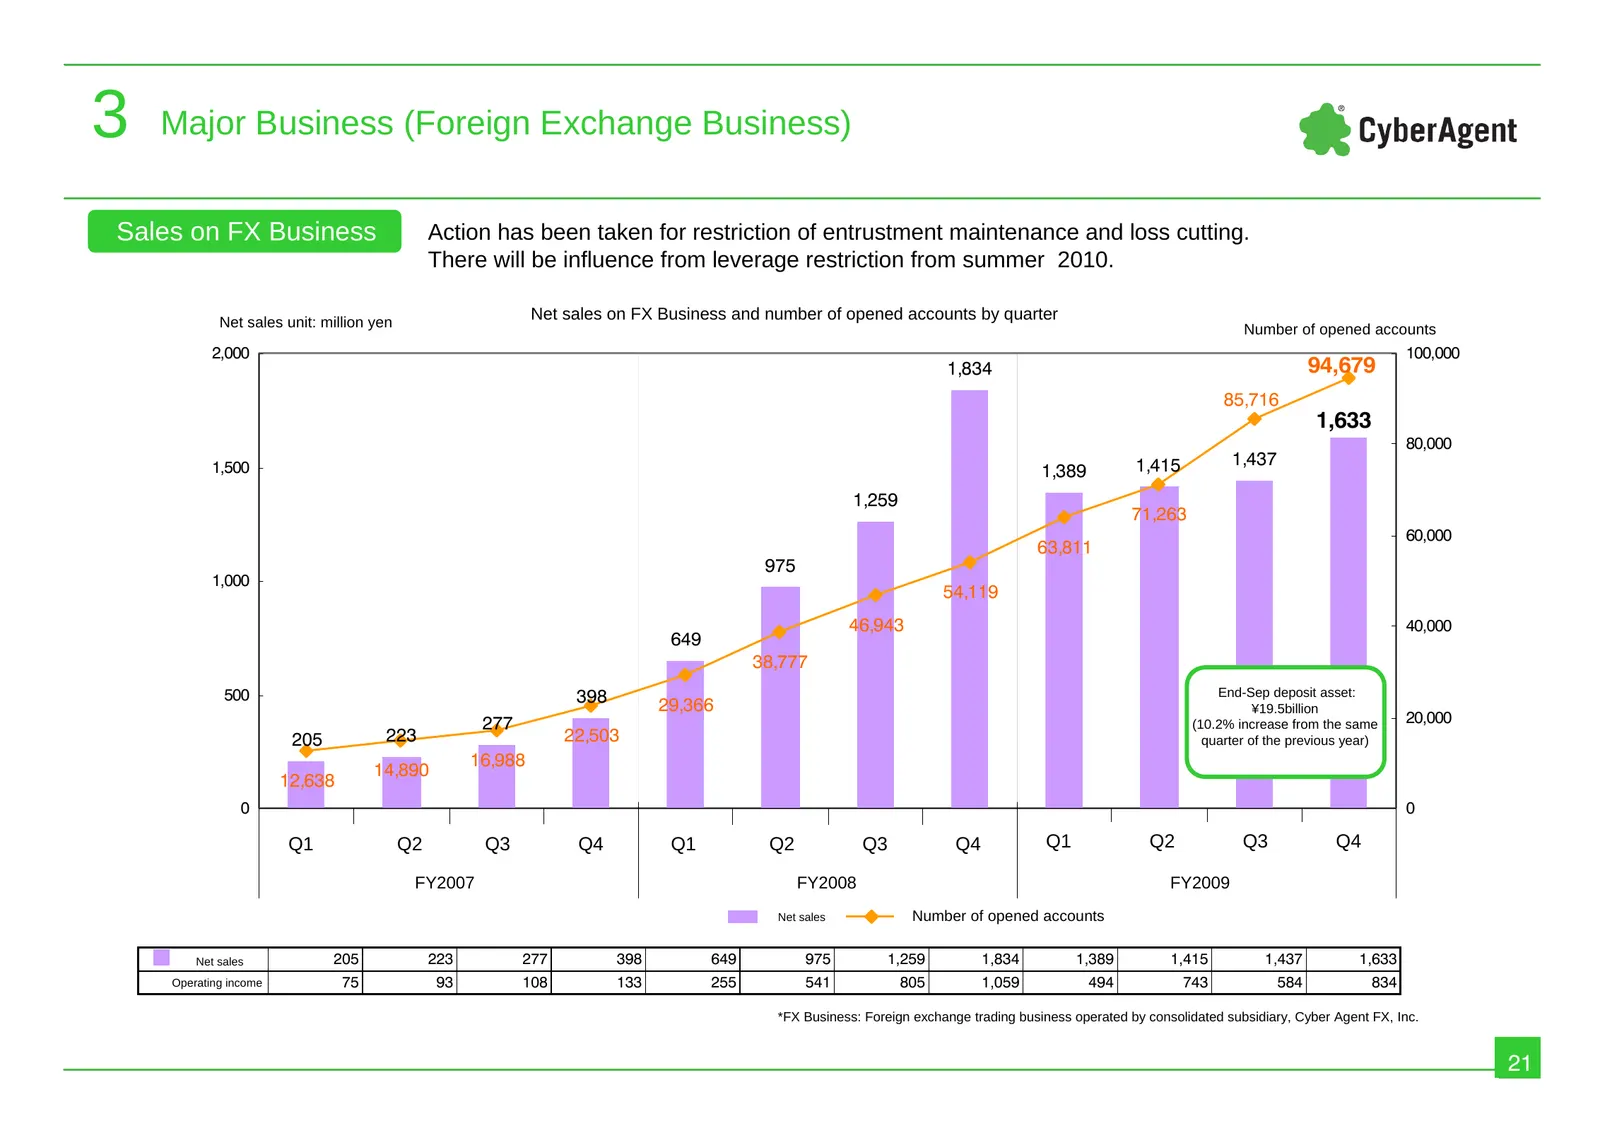
3 Major Business (Foreign Exchange Business) Sales on FX Business Action has been taken for restriction of entrustment maintenance and loss cutting. There will be influence from leverage restriction from summer 2010. Net sales unit: million yen Net sales on FX Business and number of opened accounts
Slide 22: Ameba Business
4 Ameba Business Ameba Business 22
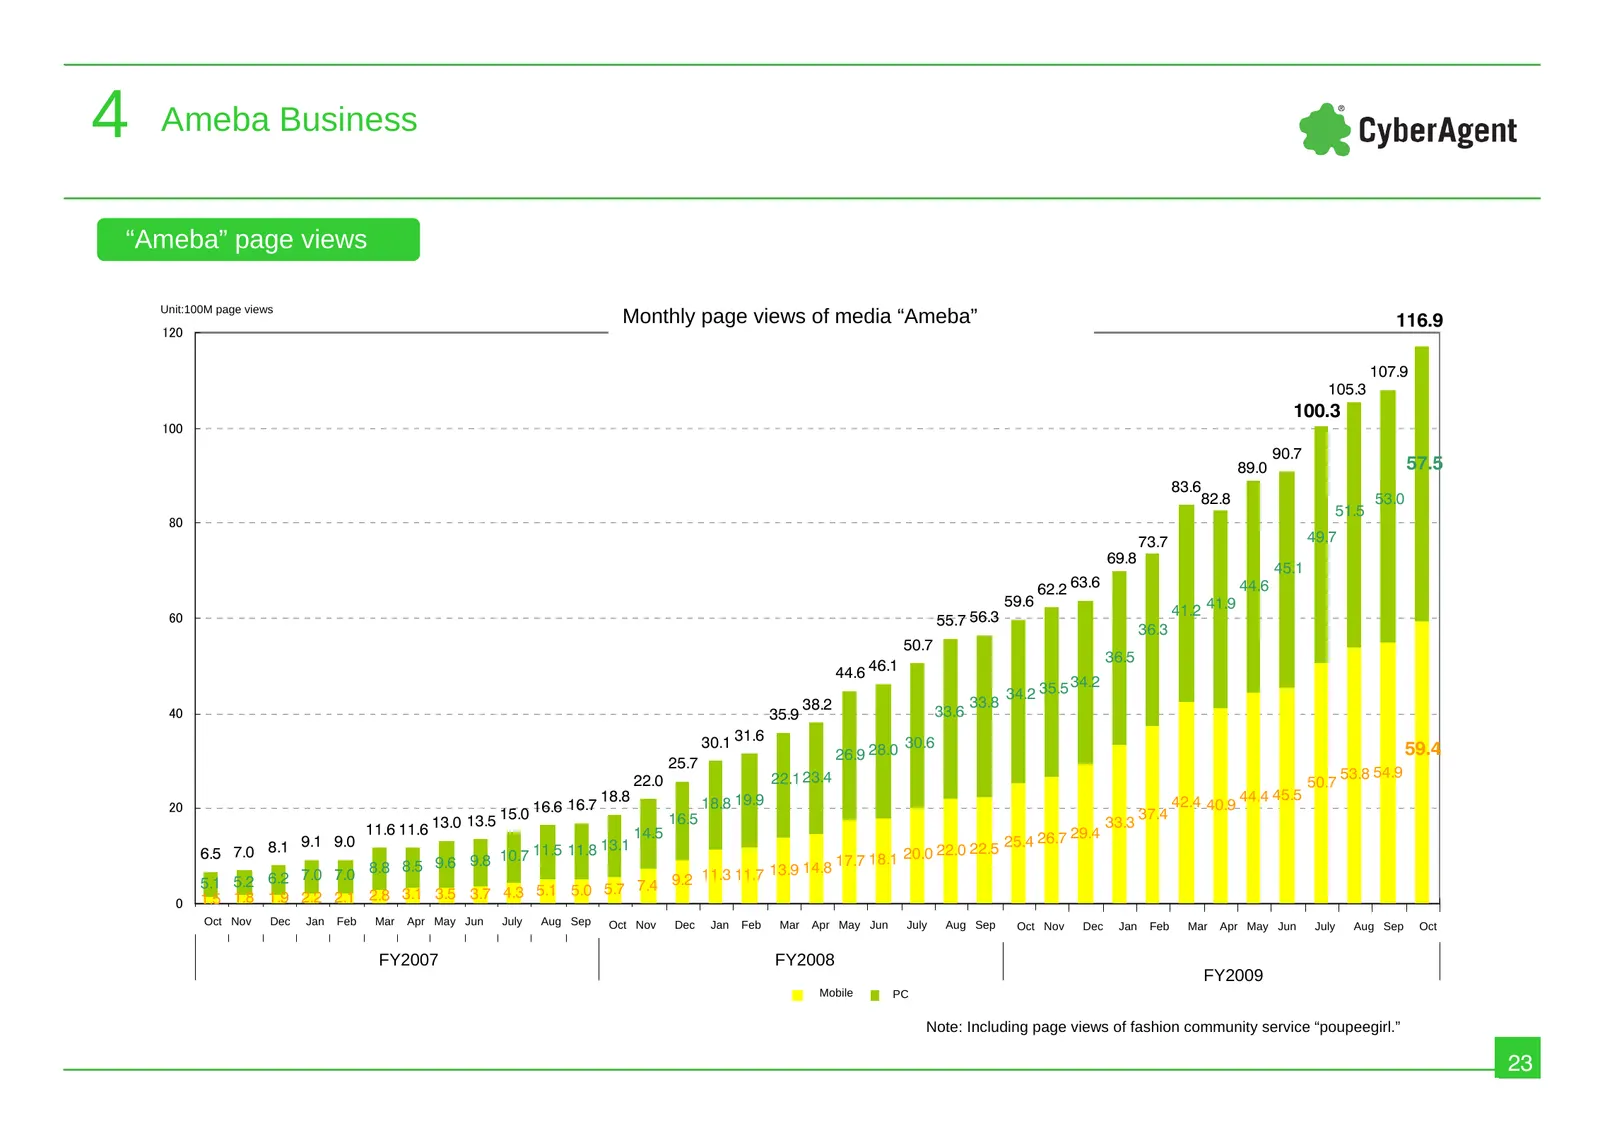
Slide 23: "Ameba" page views
4 Ameba Business “Ameba” page views Unit:100M page views Monthly page views of media “Ameba” 116.9 120 107.9 105.3 100.3 100 90.7 89.0 57.5 83.6 82.8 53.0 51.5 80 73.7 49.7 69.8 45.1 62.2 63.6 44.6 59.6 41.2 41.9 60 55.7 56.3 36.3 50.7 36.5 44.6 46.1 34.2 35.5 34.2 38.2 33.8 40 35.9 33.6 30.1 31.6 3
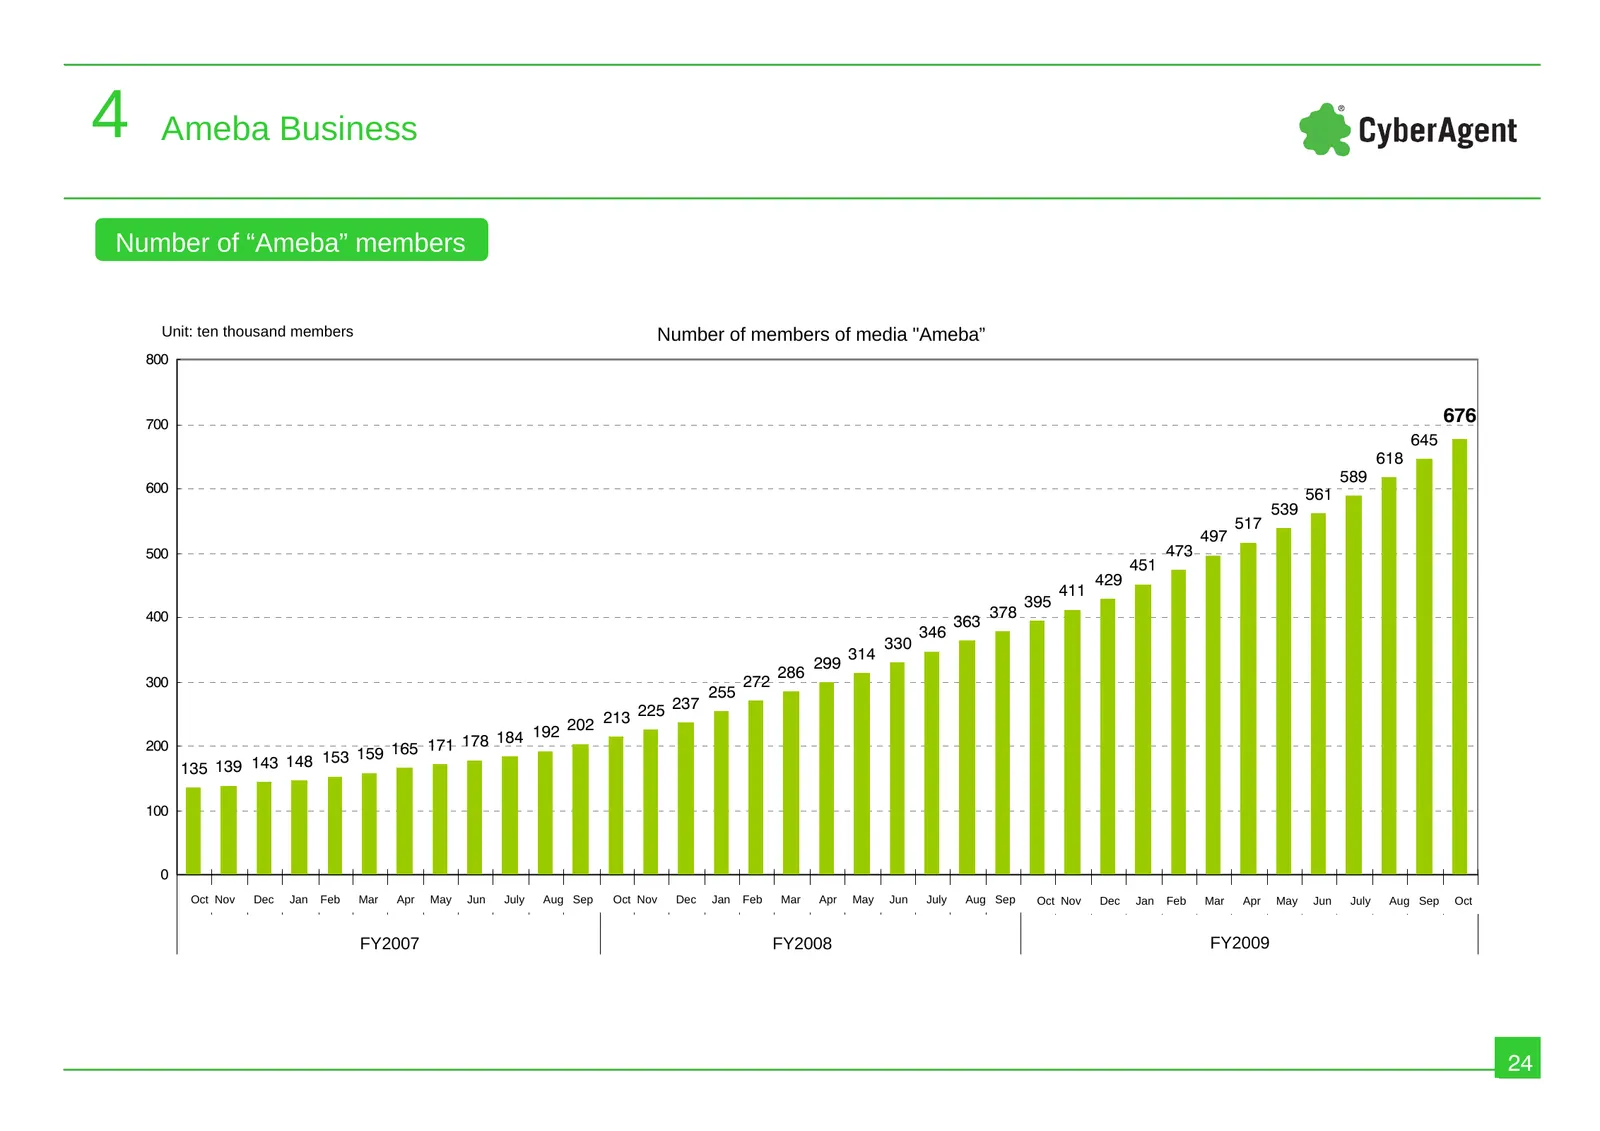
Slide 24: Number of "Ameba" members
4 Ameba Business Number of “Ameba” members Unit: ten thousand members Number of members of media "Ameba” 800 700 676 645 618 589 600 561 539 517 497 500 473 451 429 411 395 400 378 363 346 330 314 299 286 300 272 255 213 225 237 184 192 202 200 165 171 178 153 159 135 139 143 148 100 0 Oct Nov Dec J
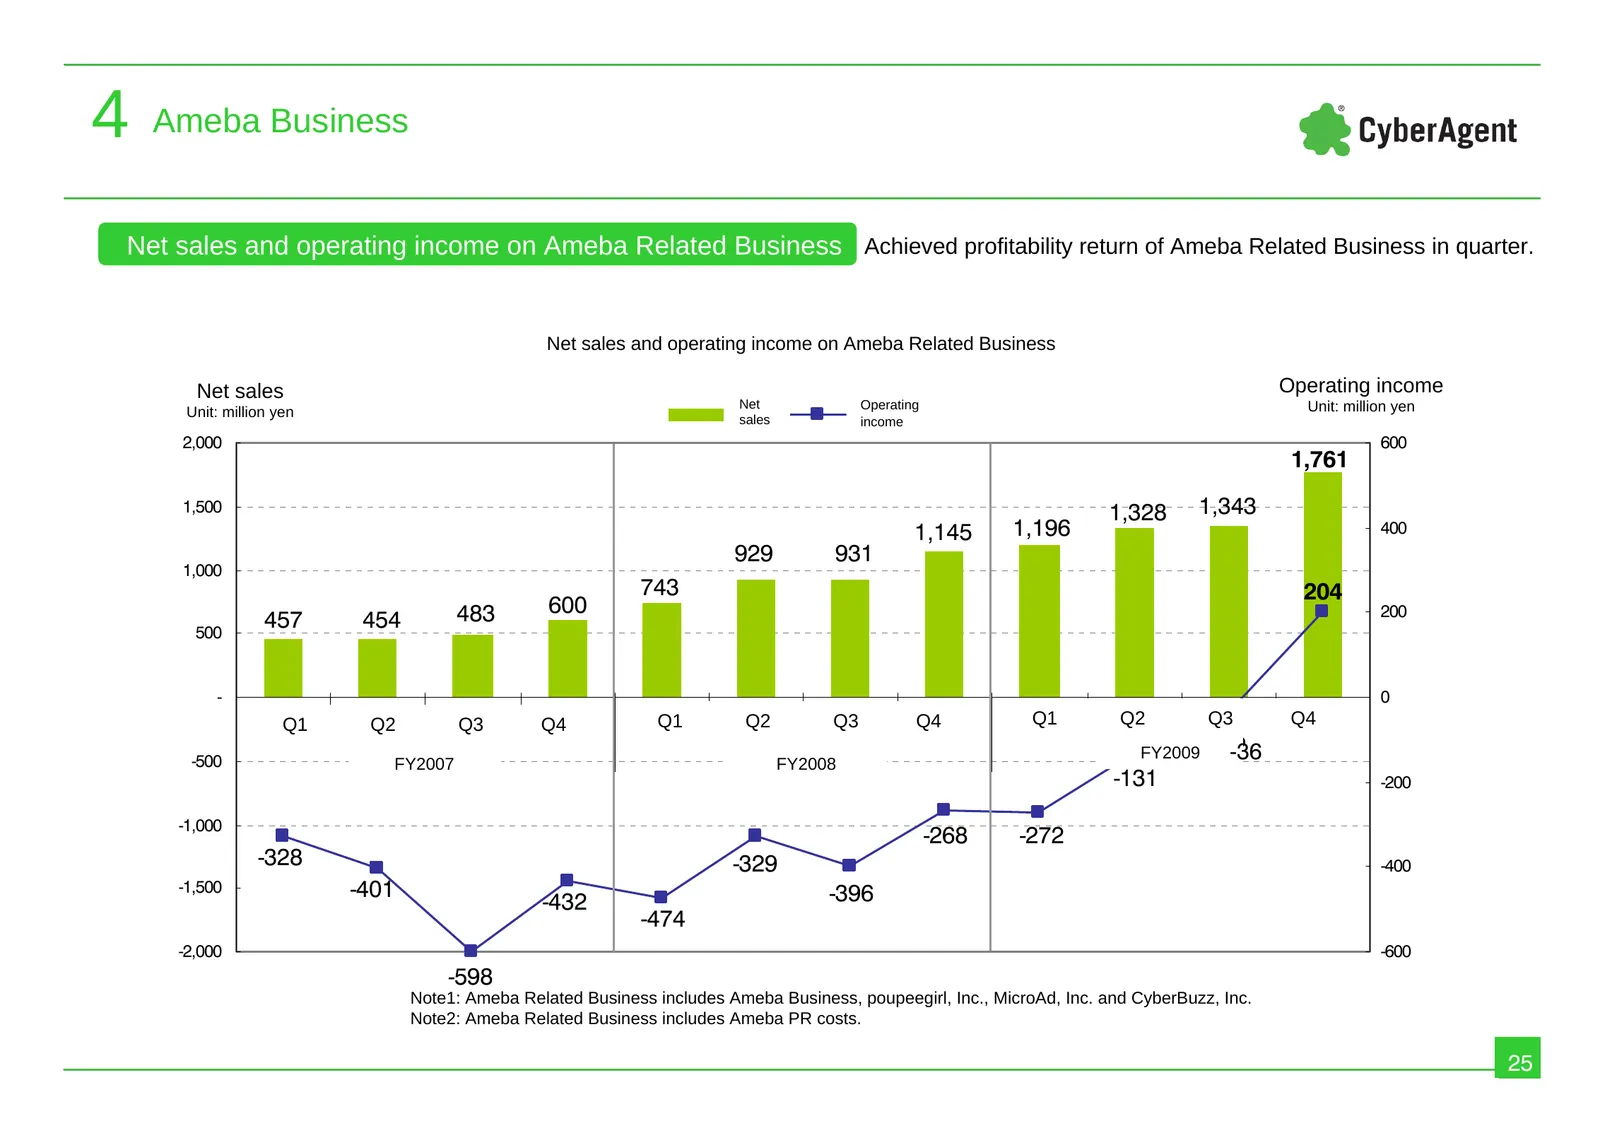
Slide 25: Net sales and operating income on Ameba Related Business
4 Ameba Business Net sales and operating income on Ameba Related Business Achieved profitability return of Ameba Related Business in quarter. Net sales and operating income on Ameba Related Business Net sales Operating income Net Operating Unit: million yen Unit: million yen sales income 2,000 600 1
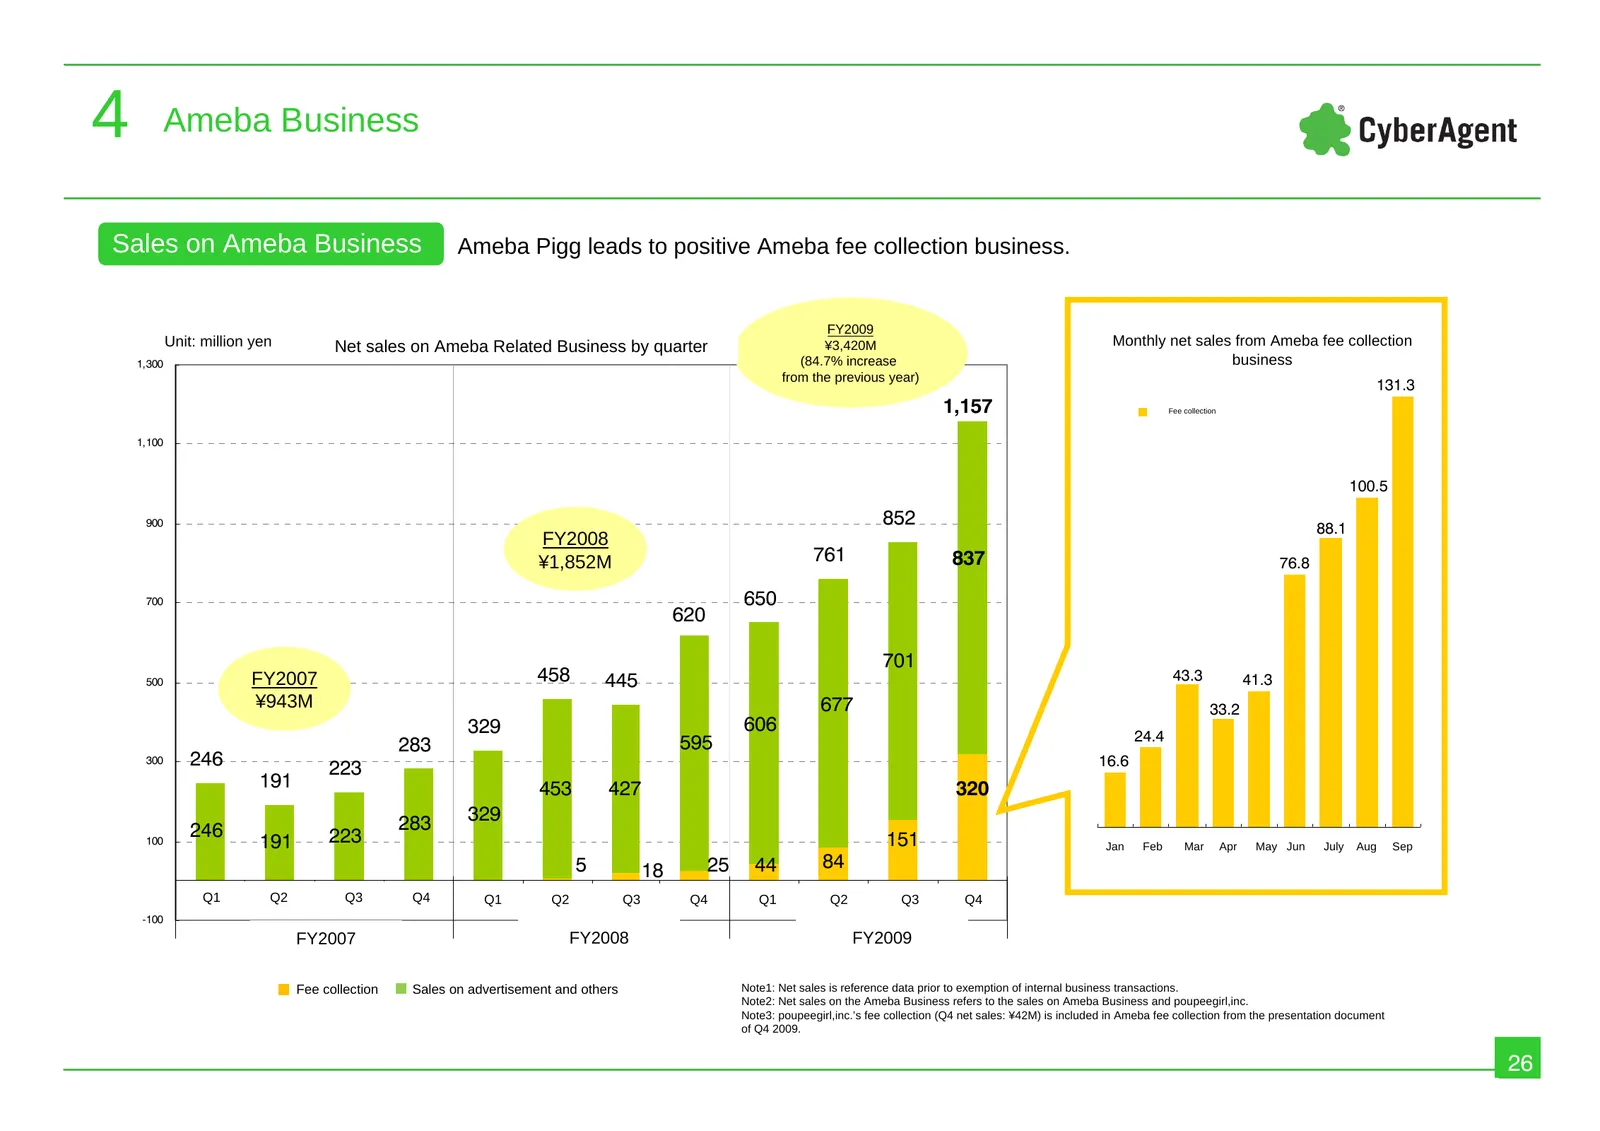
Slide 26: Sales on Ameba Business
4 Ameba Business Sales on Ameba Business Ameba Pigg leads to positive Ameba fee collection business. FY2009 Unit: million yen Net sales on Ameba Related Business by quarter ¥3,420M Monthly net sales from Ameba fee collection 1,300 (84.7% increase business from the previous year) 131.3 1,157 Fee coll
Slide 27: Attribution of AmeGold purchasers
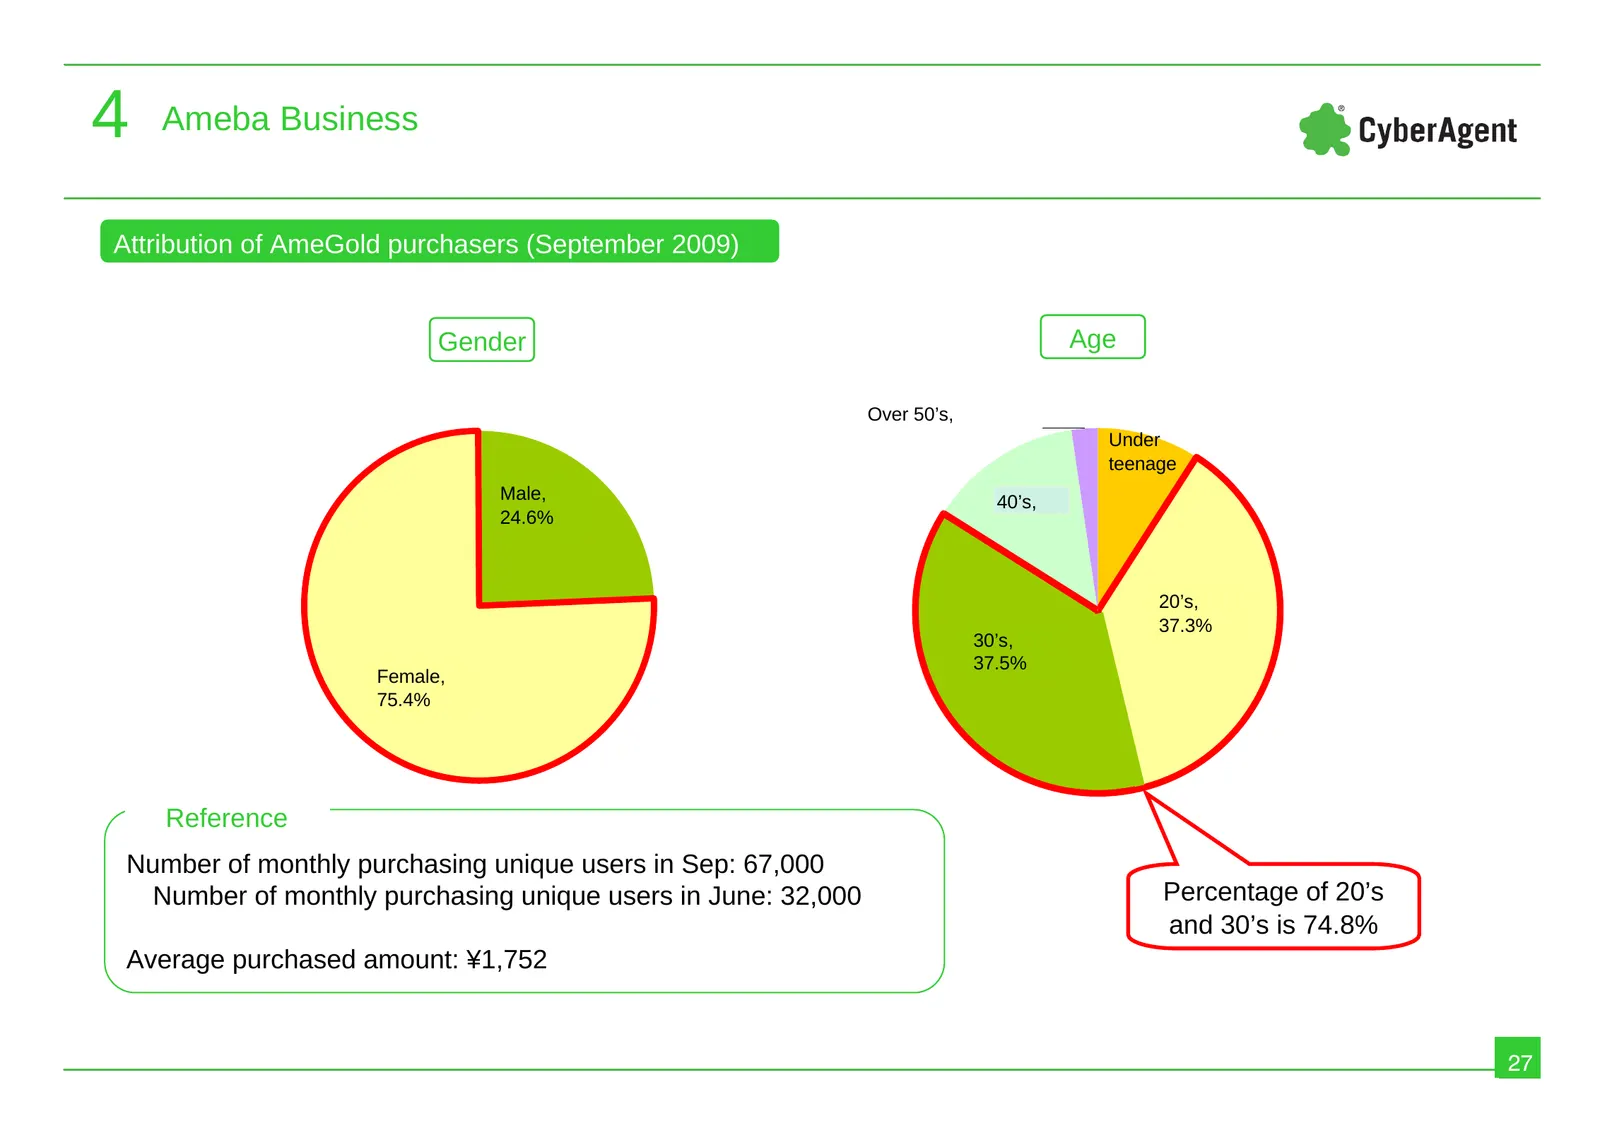
4 Ameba Business Attribution of AmeGold purchasers (September 2009) Gender Age Over 50’s, Under teenage Male, 40’s, 24.6% 20’s, 37.3% 30’s, 37.5% Female, 75.4% Reference Number of monthly purchasing unique users in Sep: 67,000 Number of monthly purchasing unique users in June: 32,000 Percentage of 2
Slide 28: Net sales on Ameba Business advertisement
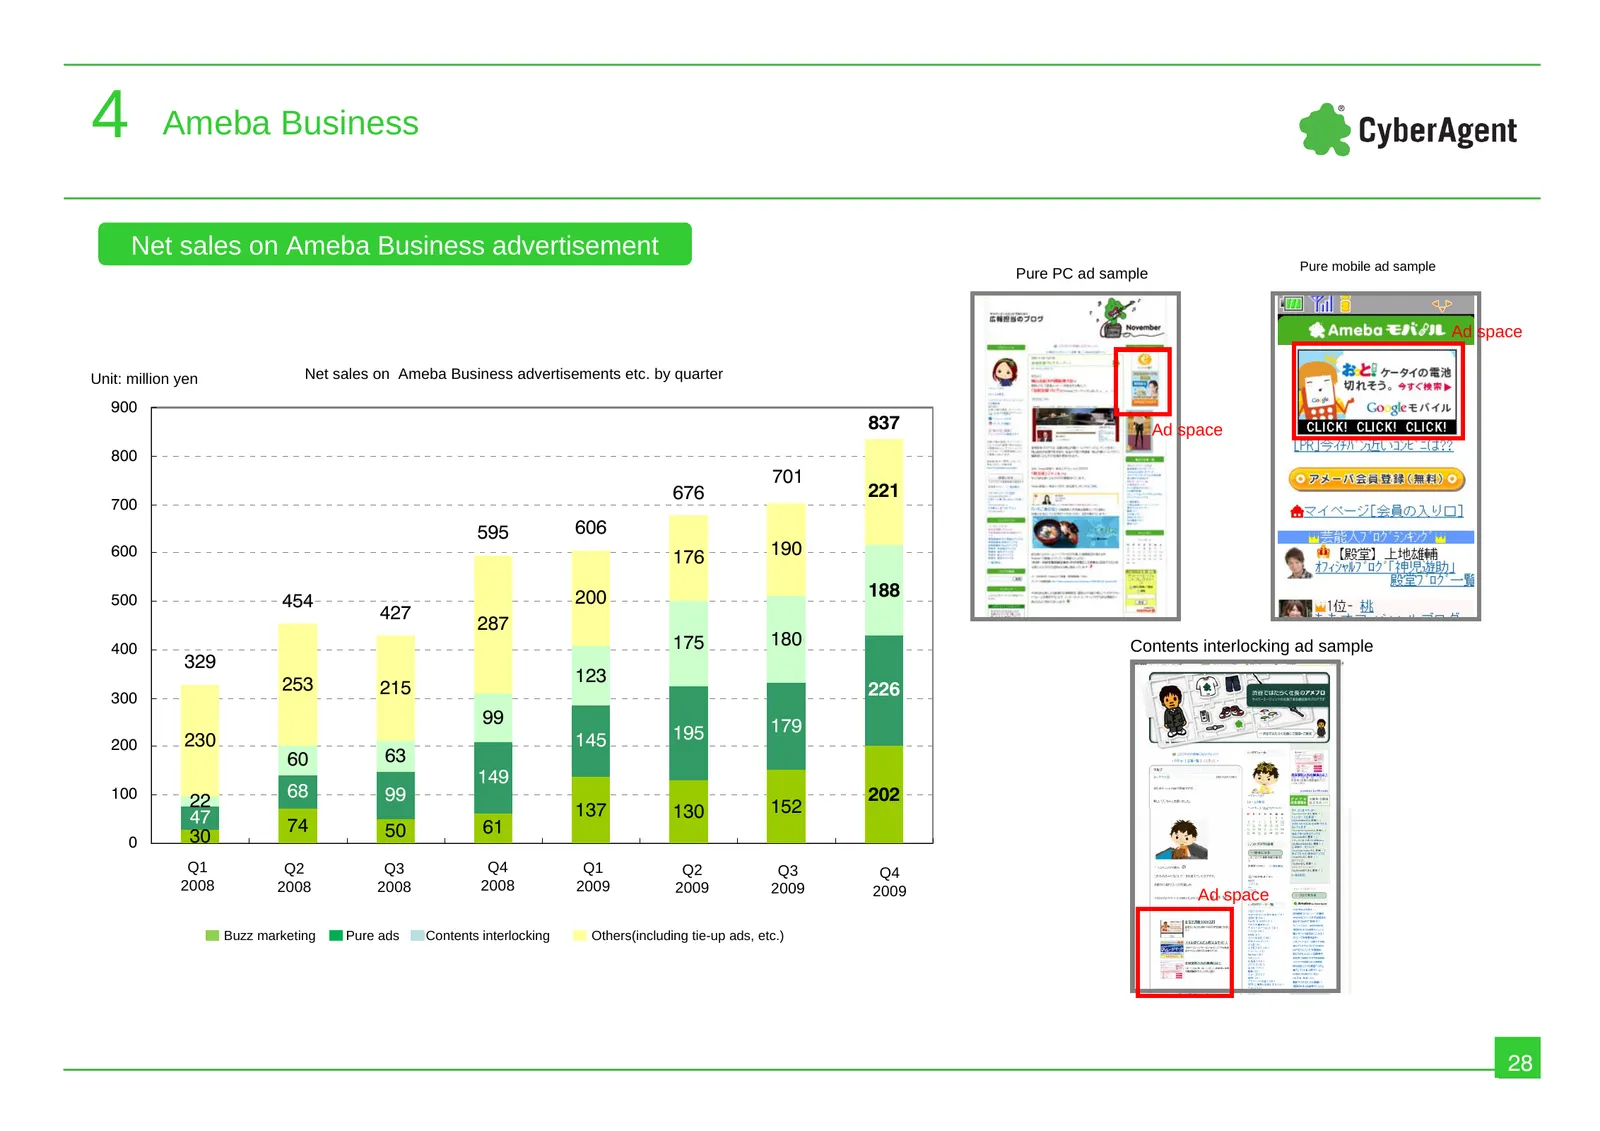
4 Ameba Business Net sales on Ameba Business advertisement Pure mobile ad sample Pure PC ad sample Ad space Unit: million yen Net sales on Ameba Business advertisements etc. by quarter 900 837 Ad space 800 701 676 221 700 595 606 600 176 190 200 188 500 454 427 287 400 175 180 Contents interlocking
Slide 29: Percentage distribution of Ameba Business sales
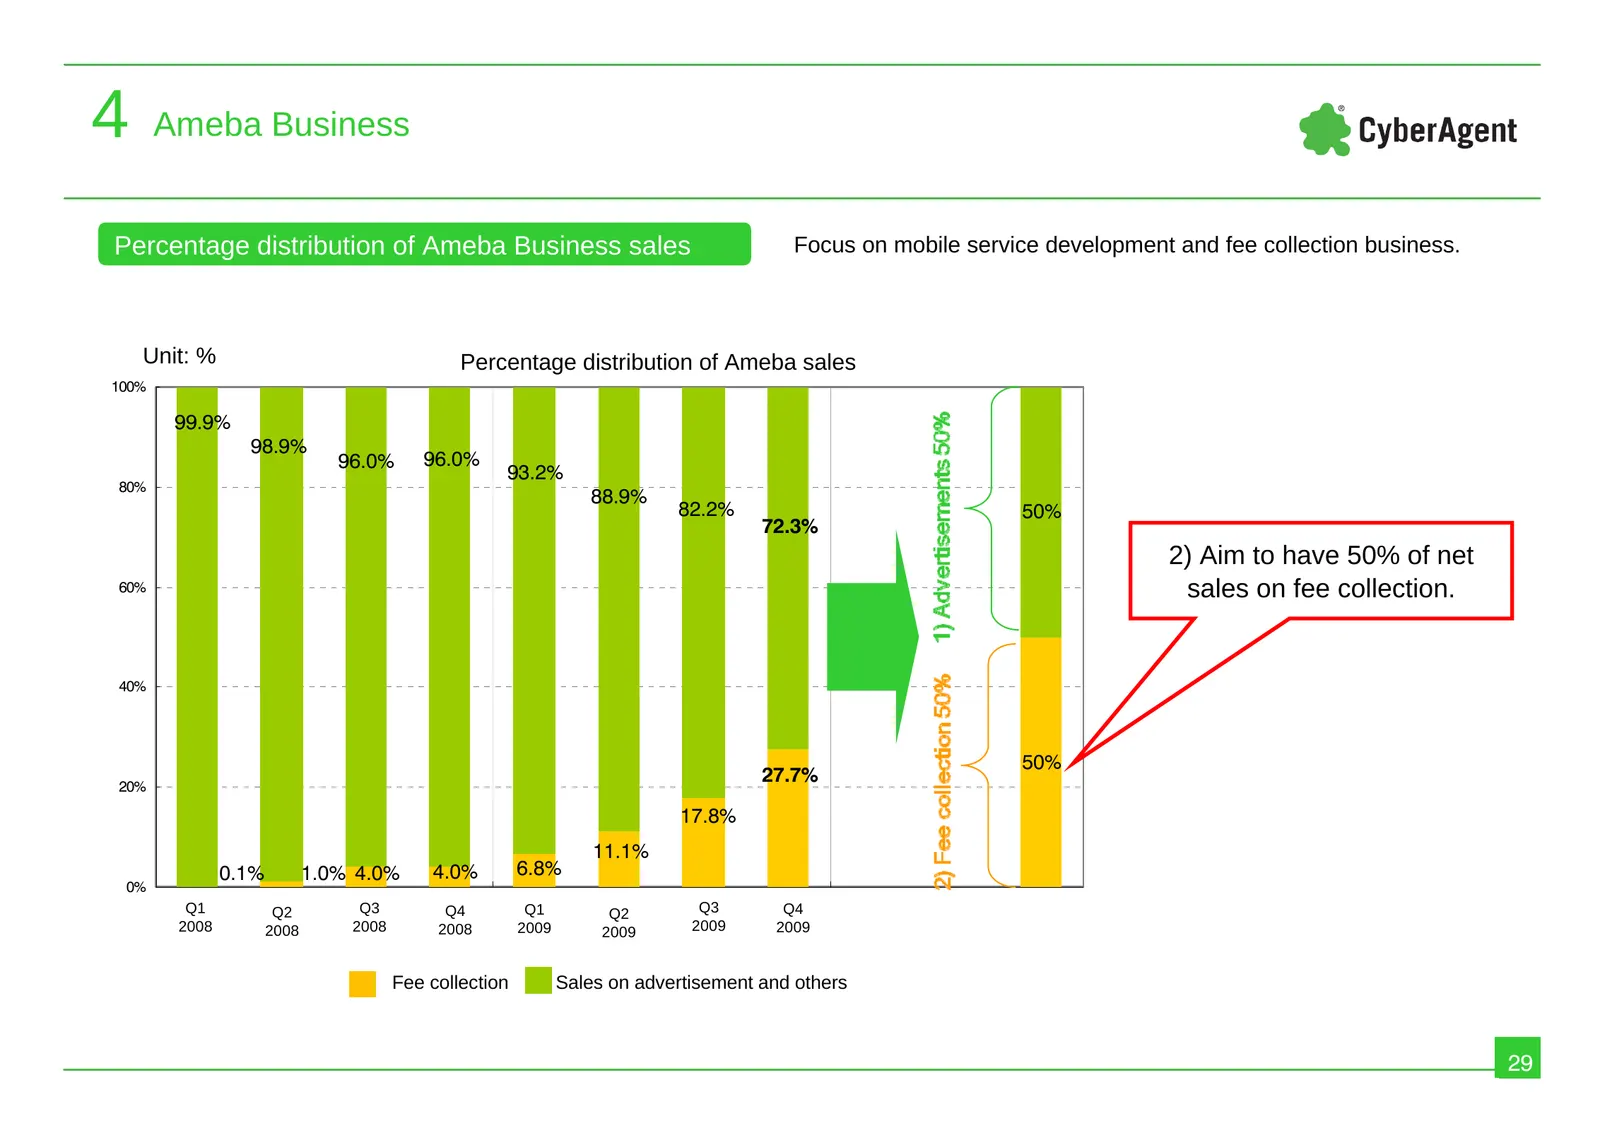
4 Ameba Business Percentage distribution of Ameba Business sales Focus on mobile service development and fee collection business. Unit: % Percentage distribution of Ameba sales 100% 99.9% 98.9% 96.0% 96.0% 93.2% 80% 88.9% 82.2% 50% 72.3% 2) Aim to have 50% of net 60% sales on fee collection. 40% 50%
Slide 30: Ameba Pigg fee collection business
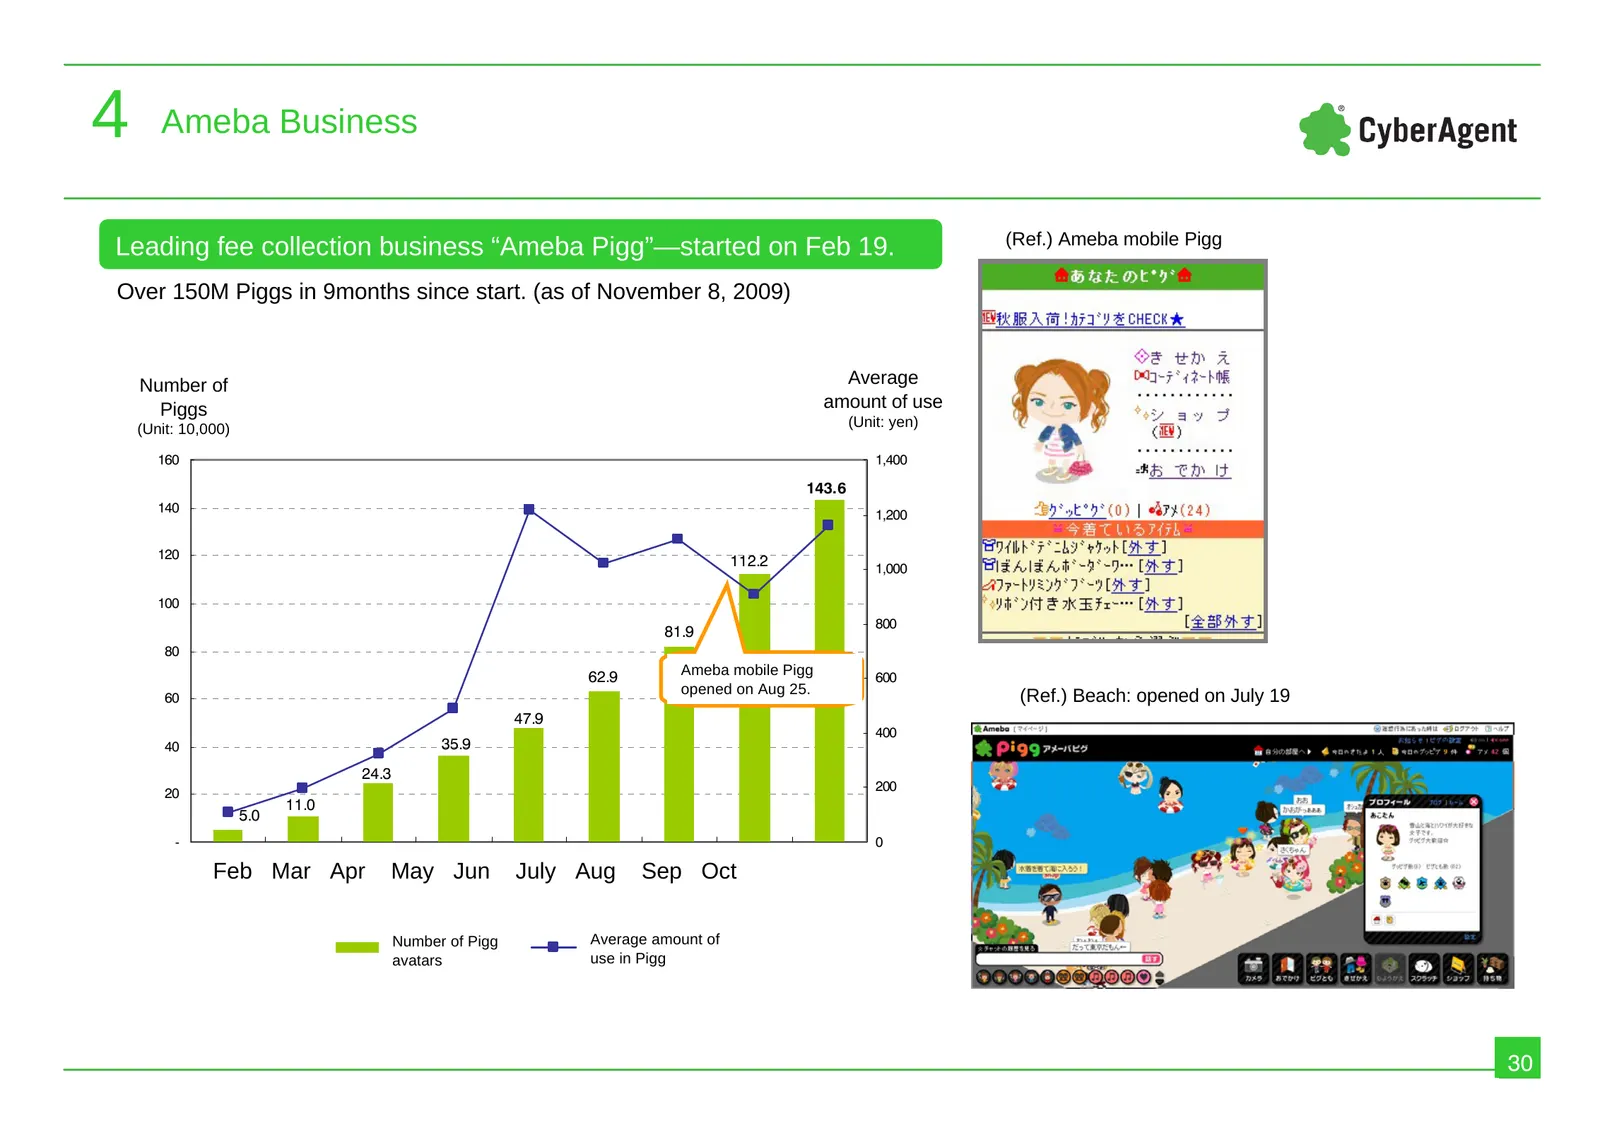
4 Ameba Business (Ref.)Ameba Ameba mobile Pigg Leading fee collection business “Ameba Pigg”—started on Feb 19. Over 150M Piggs in 9months since start. (as of November 8, 2009) Number of Average Piggs amount of use (Unit: 10,000) (Unit: yen) 160 1,400 143.6 140 1,200 120 112.2 1,000 100 800 81.9 80 6
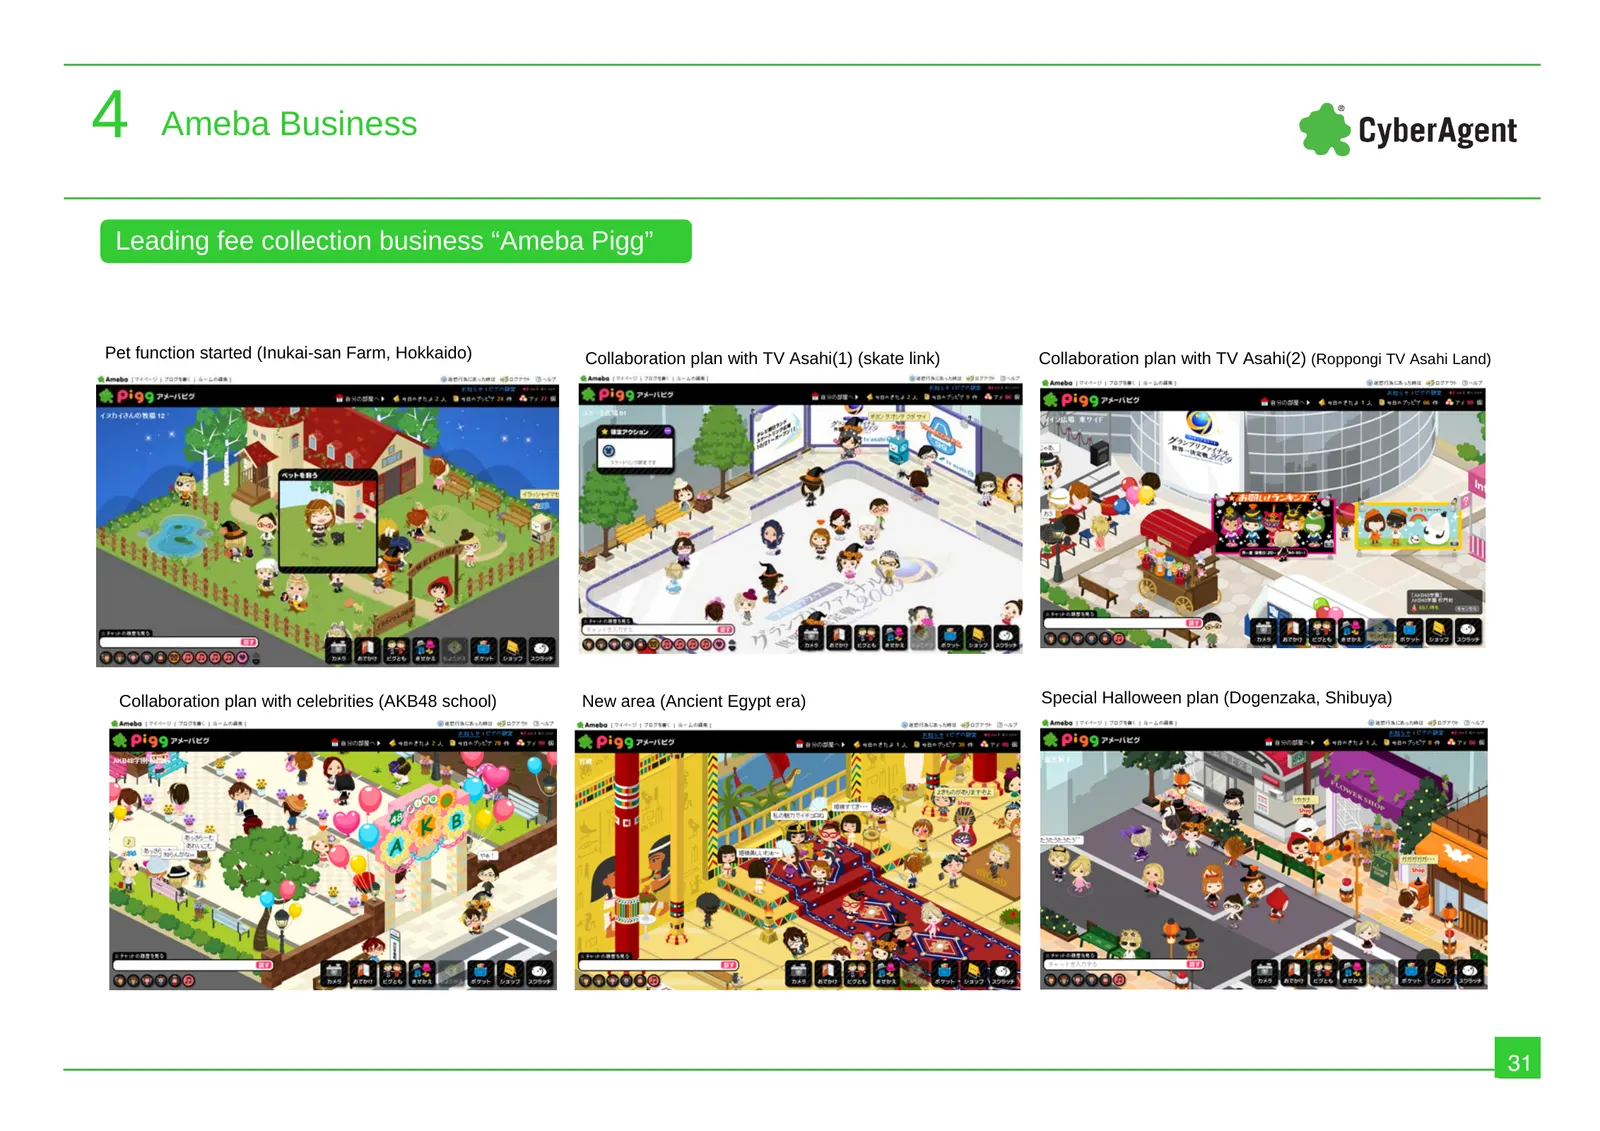
Slide 31: Leading fee collection business Ameba Pigg
4 Ameba Business Leading fee collection business “Ameba Pigg” Pet function started (Inukai-san Farm, Hokkaido) Collaboration plan with TV Asahi(1) (skate link) Collaboration plan with TV Asahi(2) (Roppongi TV Asahi Land) Collaboration plan with celebrities (AKB48 school) New area (Ancient Egypt era)
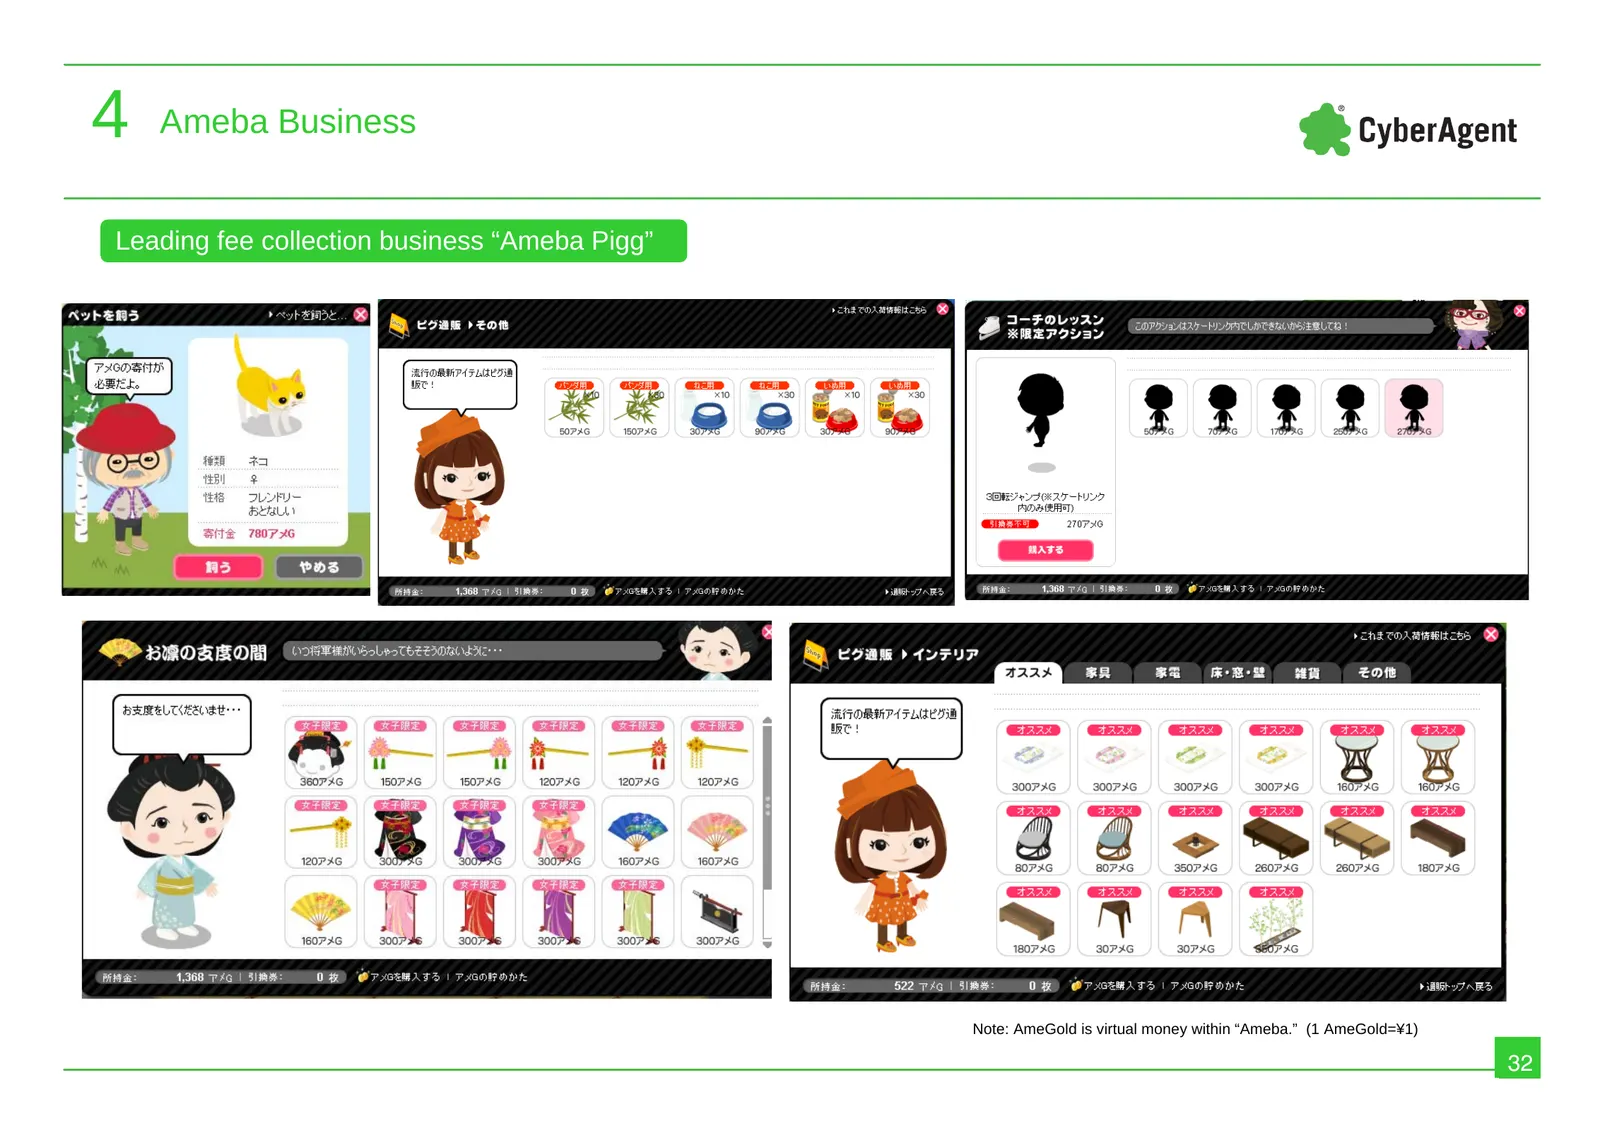
Slide 32: Leading fee collection business Ameba Pigg
4 Ameba Business Leading fee collection business “Ameba Pigg” Note: AmeGold is virtual money within “Ameba.” (1 AmeGold=¥1) 32
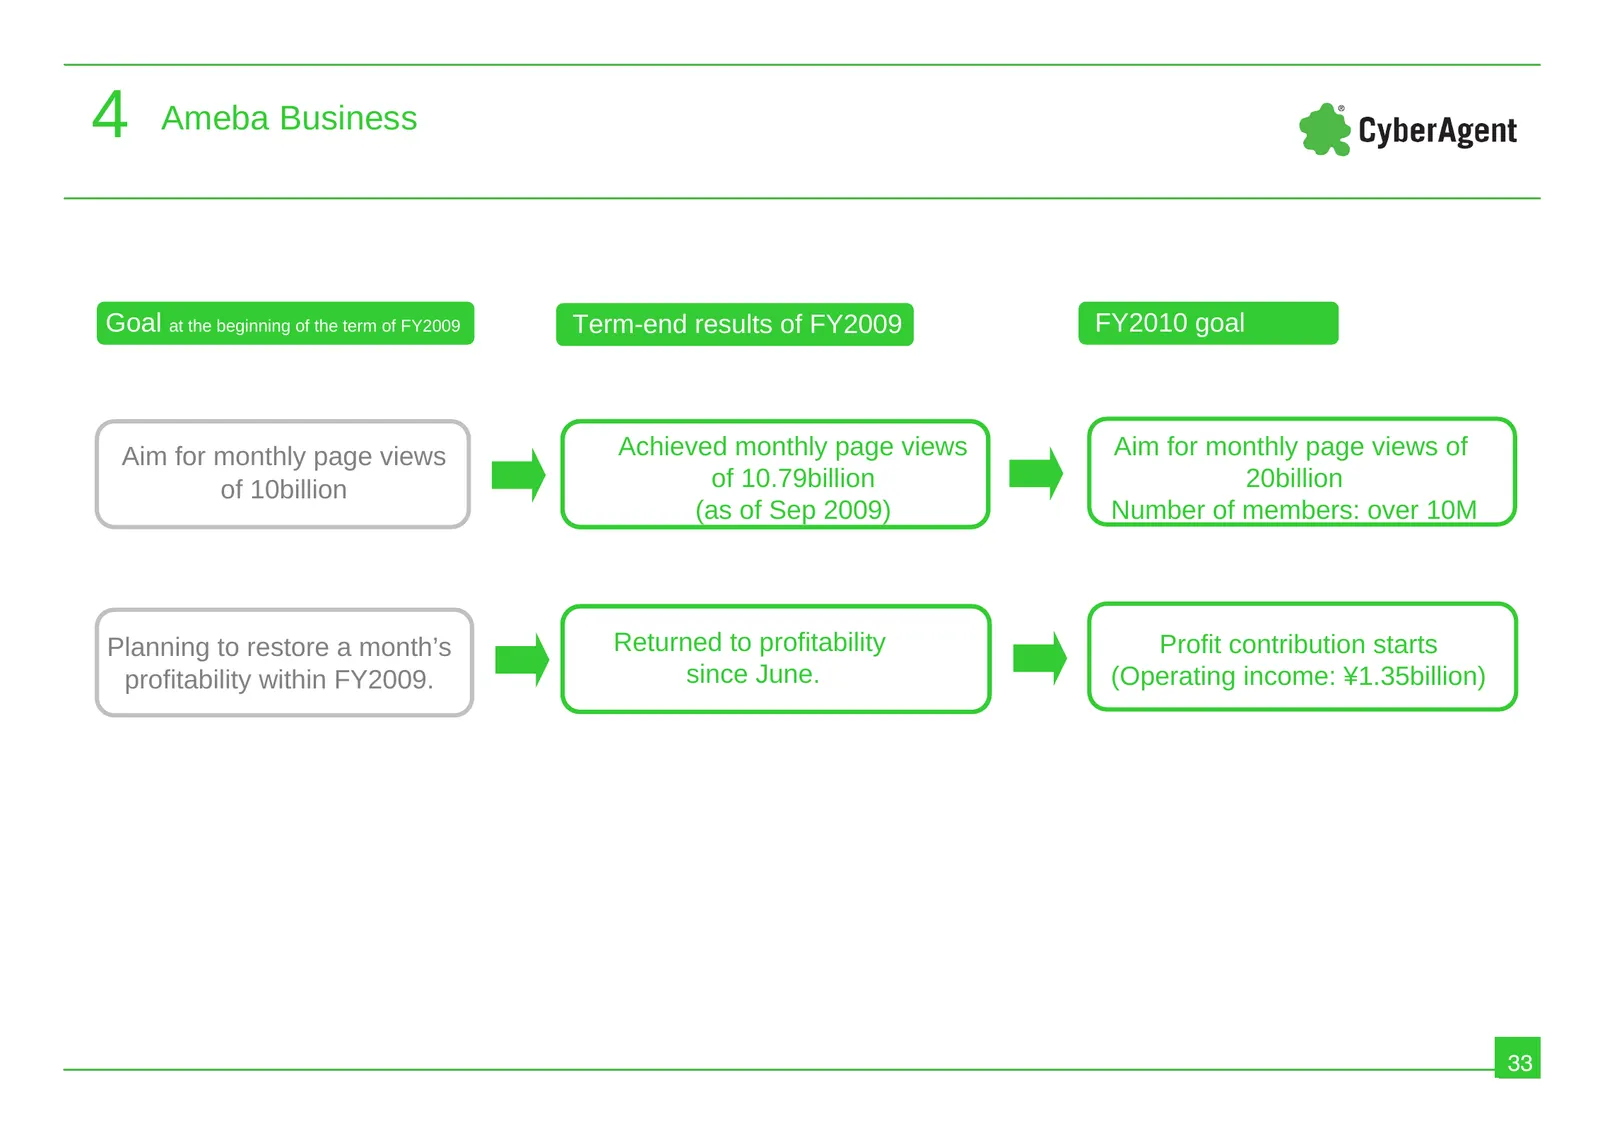
Slide 33: FY2009 goals, results and FY2010 goal
4 Ameba Business Goal at the beginning of the term of FY2009 Term-end results of FY2009 FY2010 goal Aim for monthly page views Achieved monthly page views Aim for monthly page views of of 10billion of 10.79billion 20billion (as of Sep 2009) Number of members: over 10M Planning to restore a month’s R
Slide 34: Summary
5 Summary & CyberAgent Summary
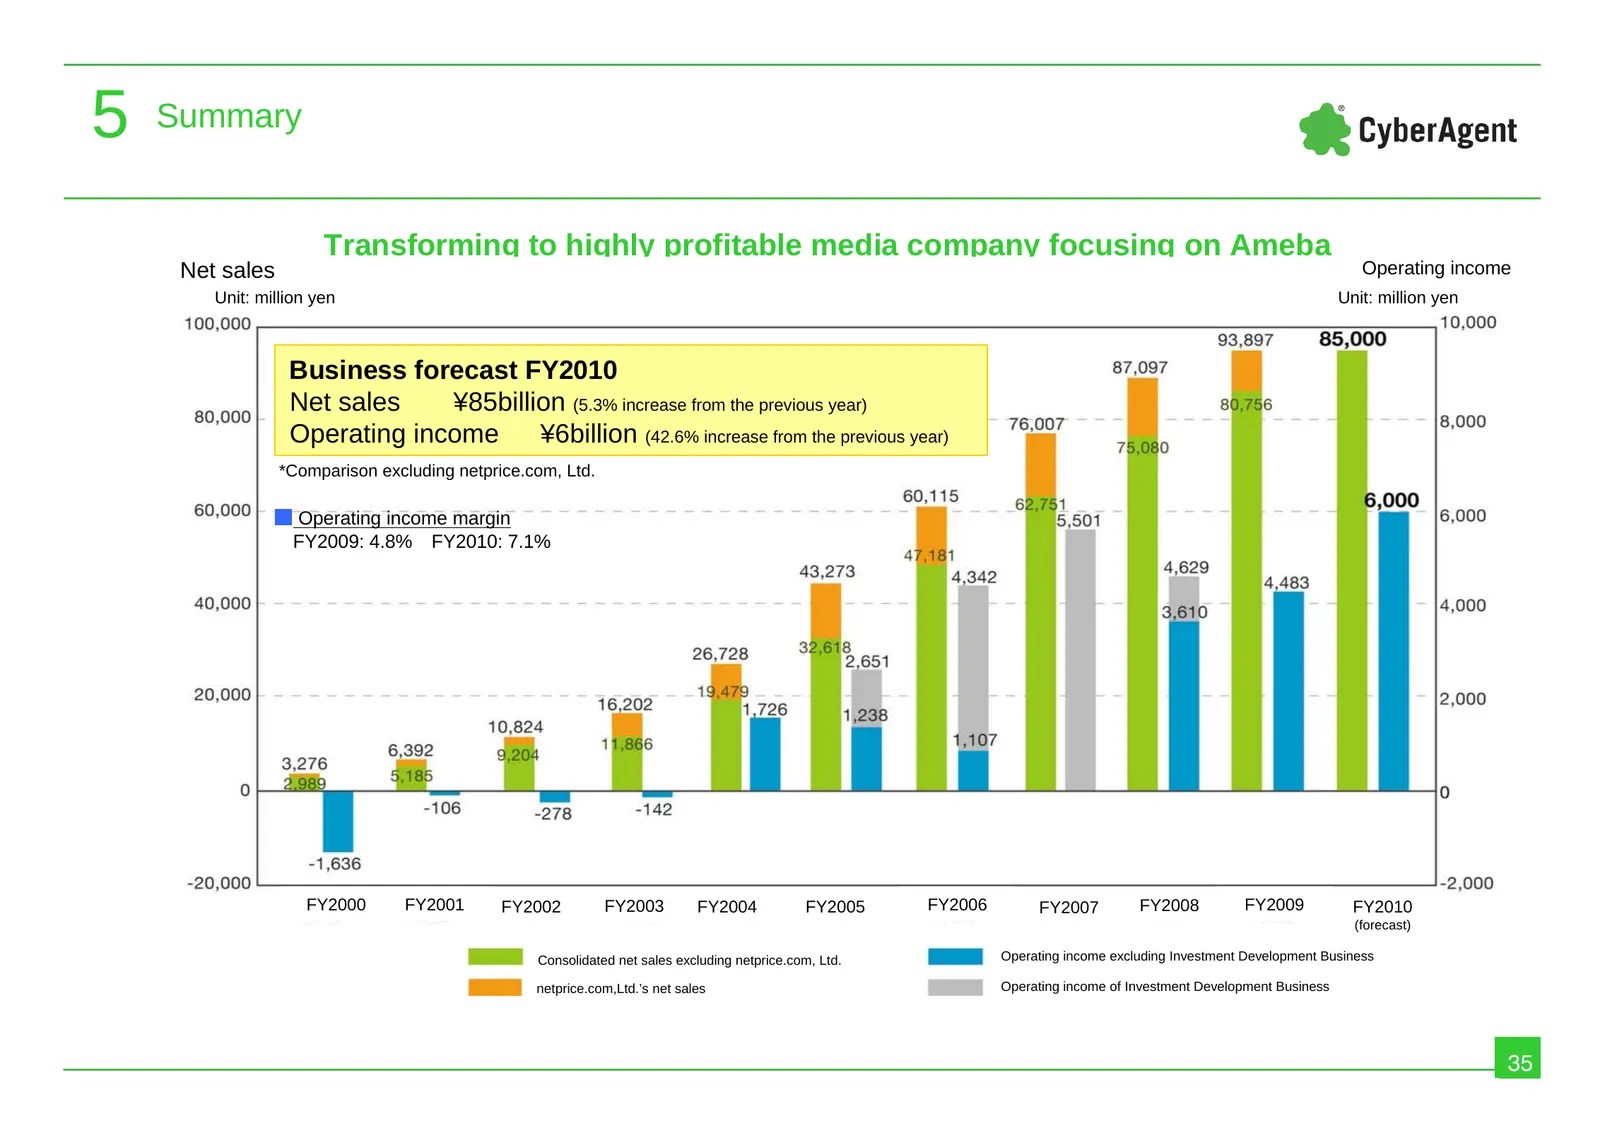
Slide 35: Transforming to highly profitable media company focusing on Ameba
5 Summary Transforming to highly profitable media company focusing on Ameba. Net sales Operating income Unit: million yen Unit: million yen Business forecast FY2010 Net sales ¥85billion (5.3% increase from the previous year) Operating income ¥6billion (42.6% increase from the previous year) *Compari
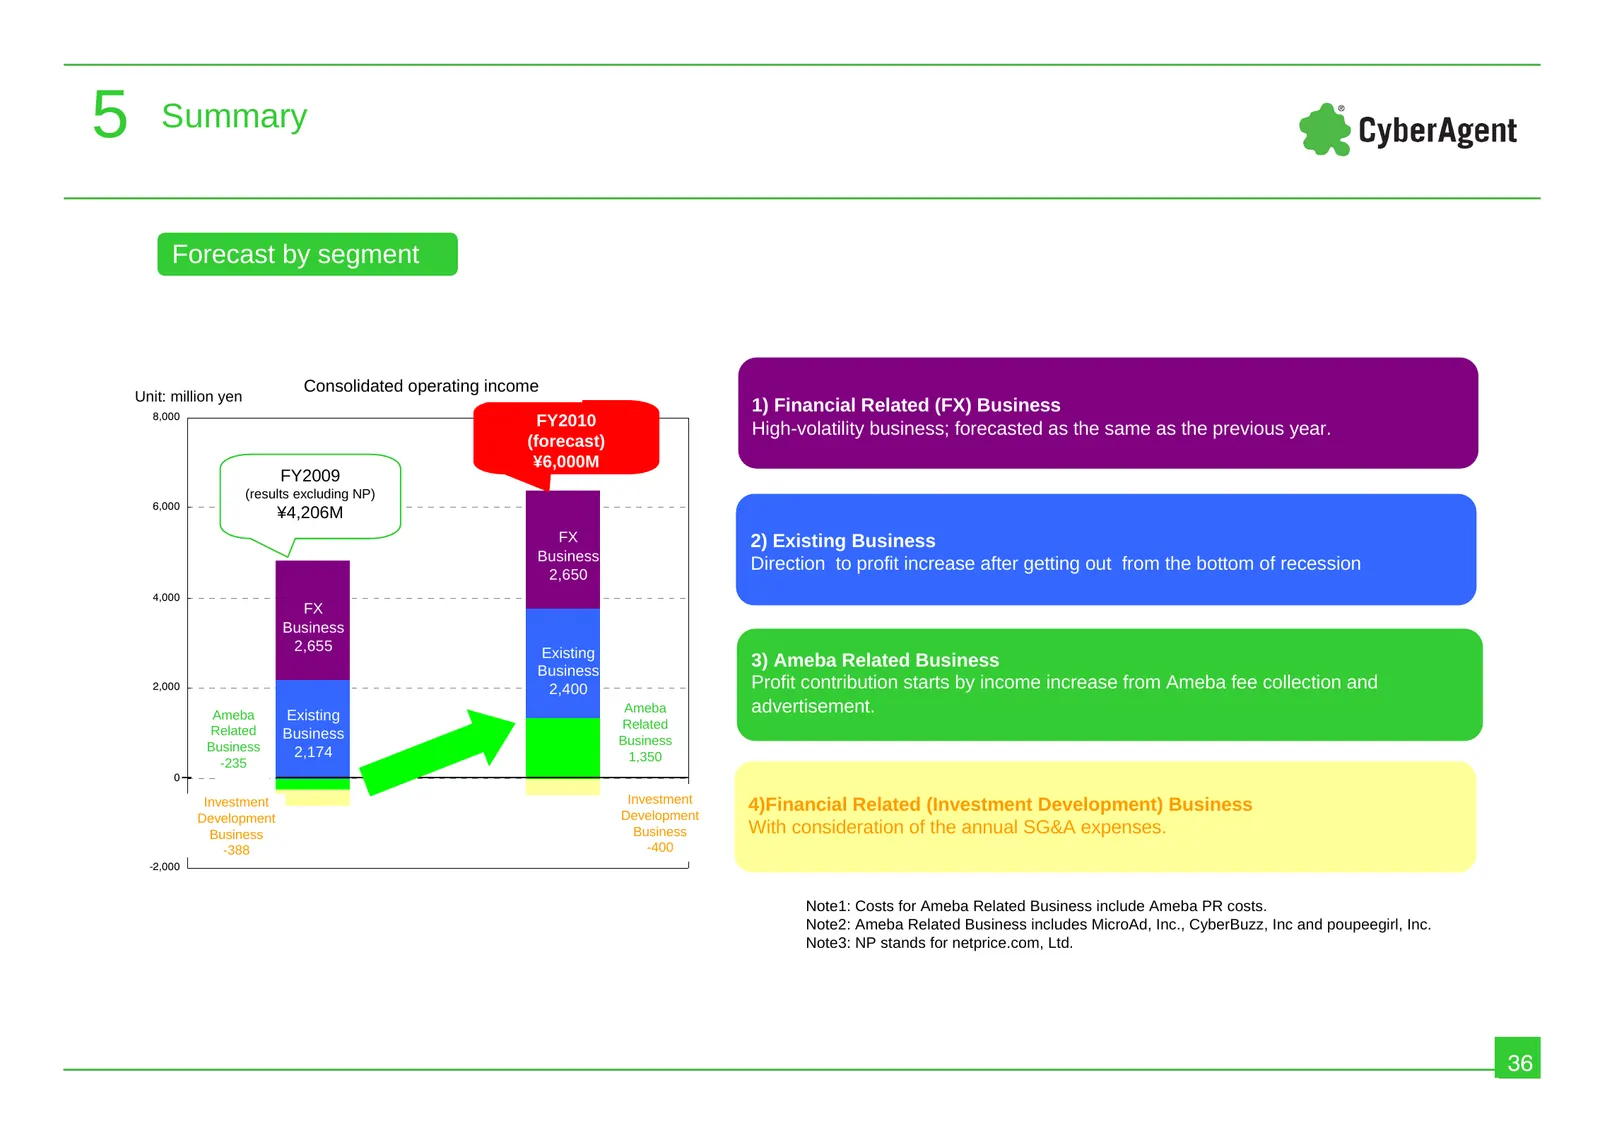
Slide 36: Forecast by segment
5 Summary Forecast by segment Consolidated operating income Unit: million yen 8,000 1) Financial Related (FX) Business FY2010 High-volatility business; forecasted as the same as the previous year. (forecast) ¥6,000M FY2009 (results excluding NP) 6,000 ¥4,206M FX 2) Existing Business Business 2,650 D
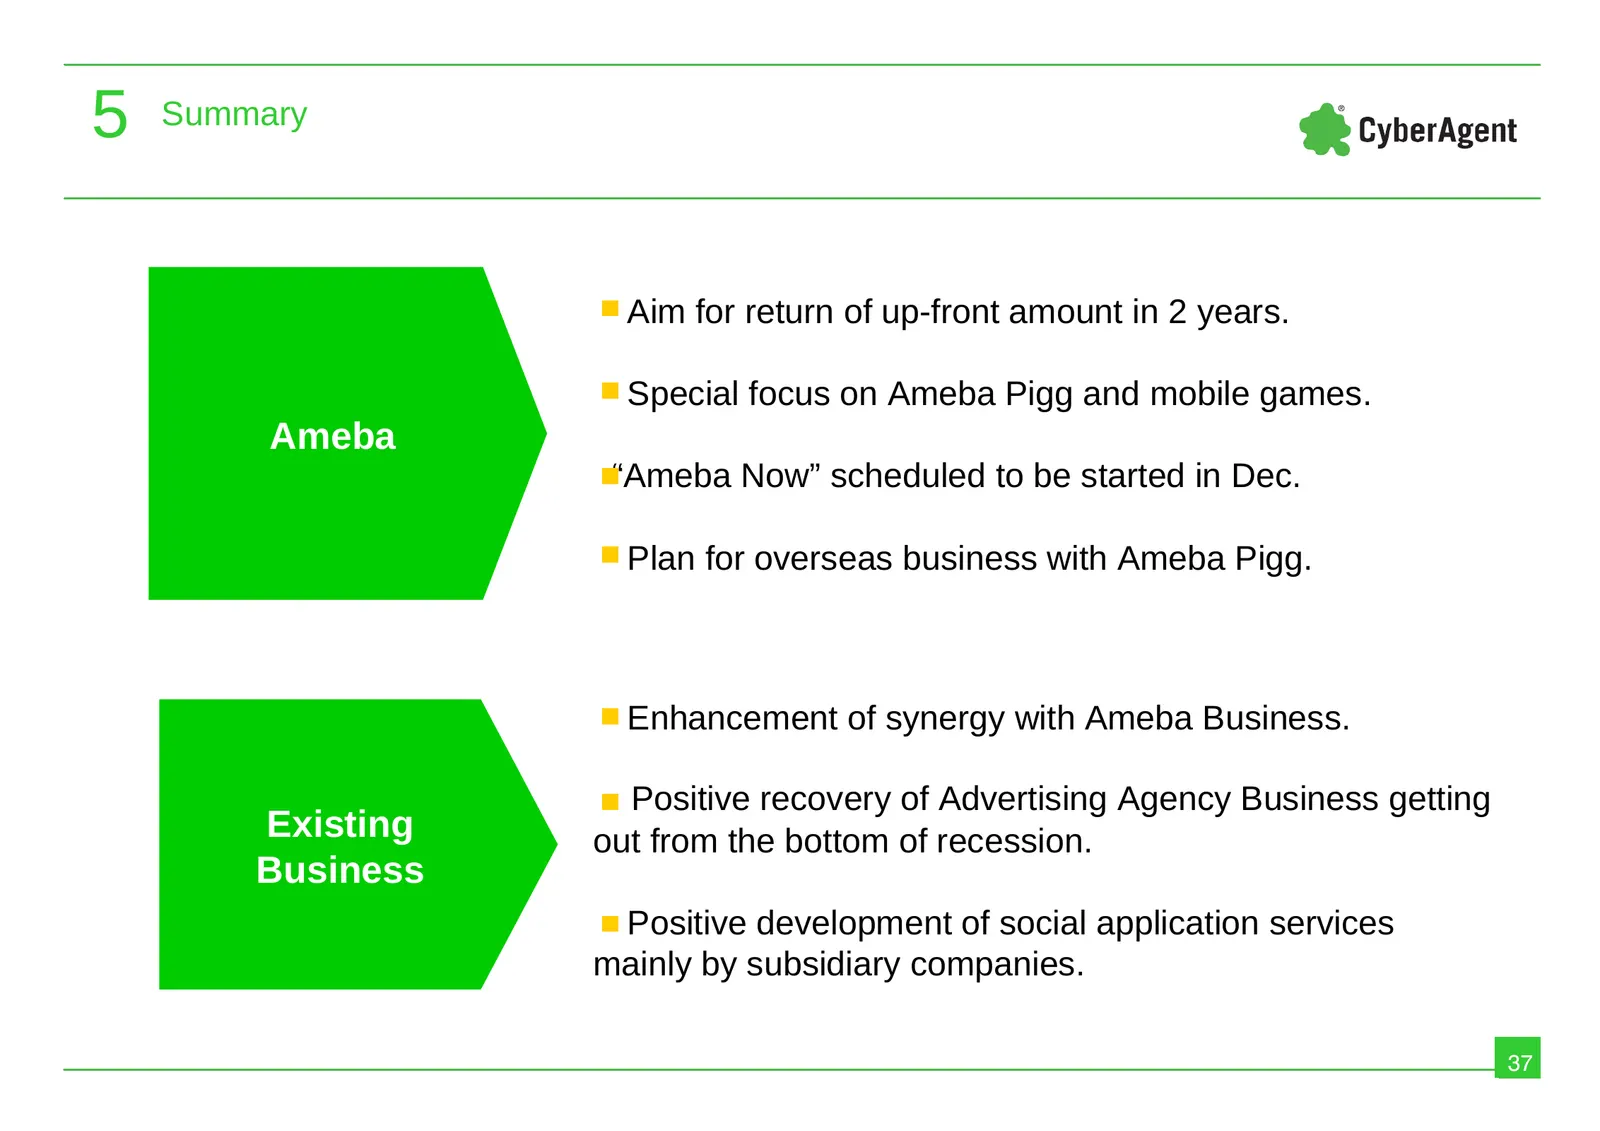
Slide 37: Summary of strategy for Ameba and existing business
5 Summary Aim for return of up-front amount in 2 years. Special focus on Ameba Pigg and mobile games. Ameba “Ameba Now” scheduled to be started in Dec. Plan for overseas business with Ameba Pigg. Enhancement of synergy with Ameba Business. Positive recovery of Advertising Agency Business getting Exi
Slide 38: Vision
5 Summary VISION We Create The Company that Symbolizes the 21st Century. 38
Slide 39: Reference
Reference & CyberAgent Reference
Slide 40: Ameba Pigg
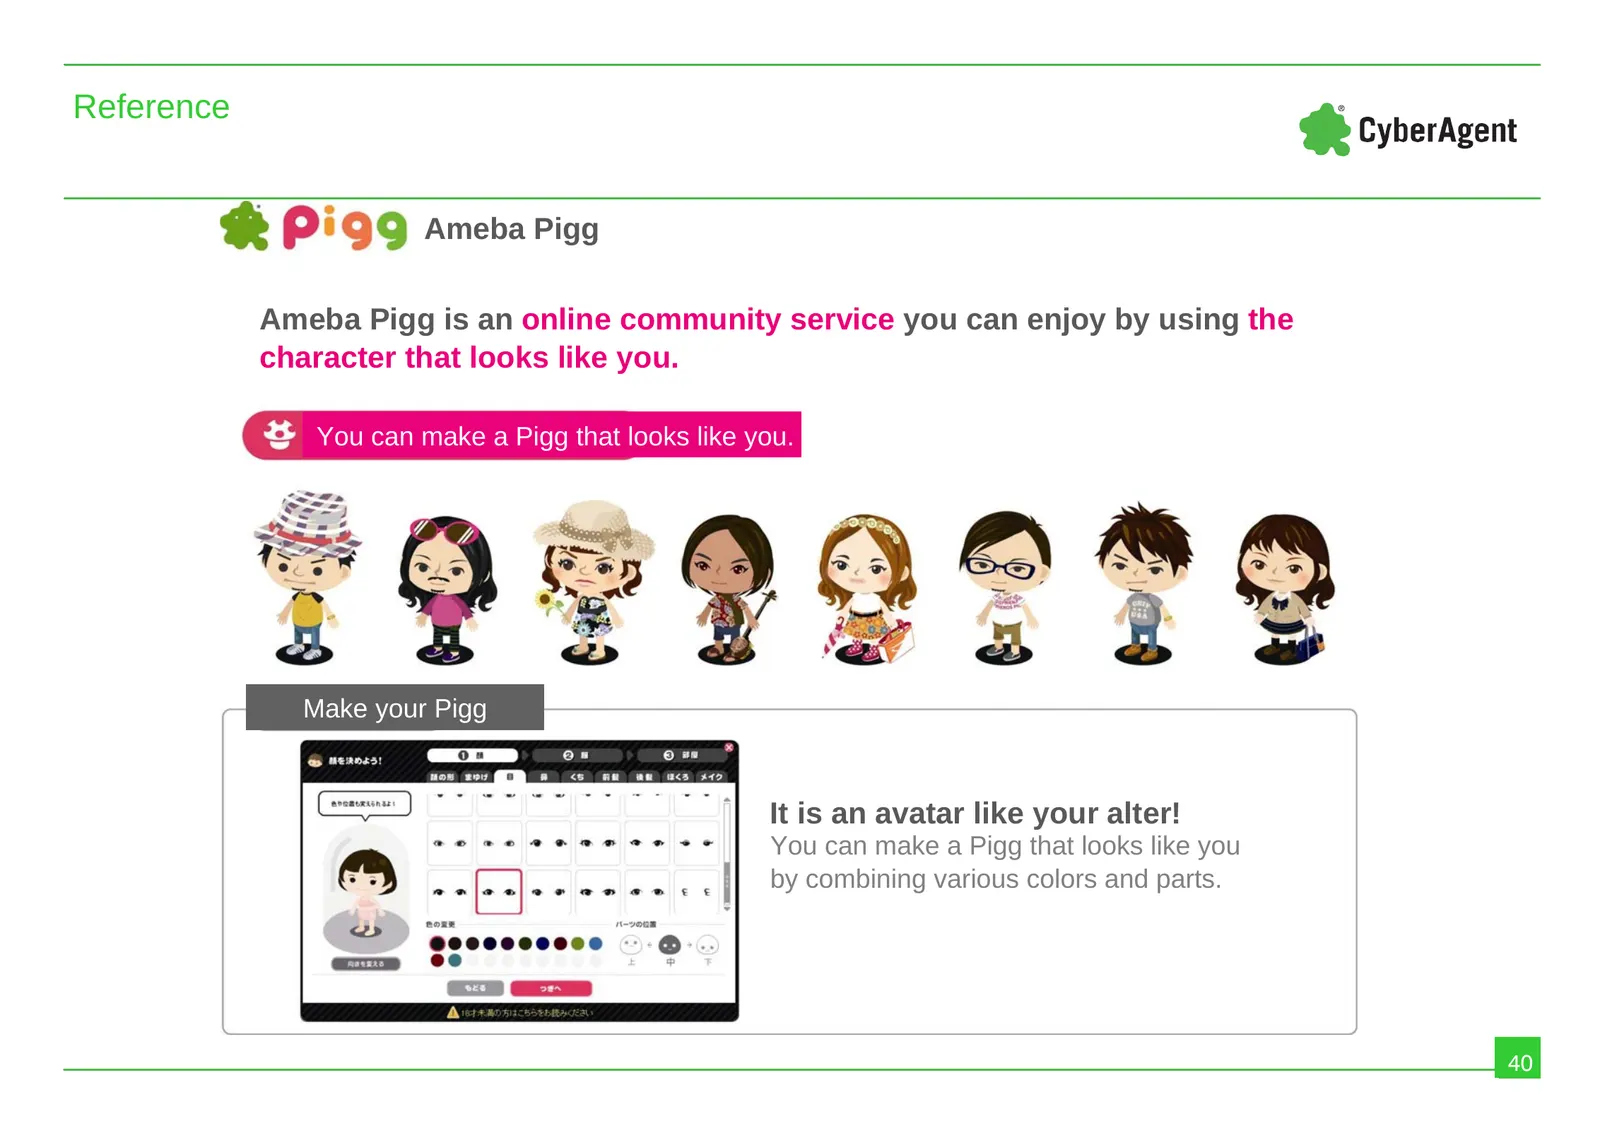
Reference Ameba Pigg Ameba Pigg is an online community service you can enjoy by using the character that looks like you. You can make a Pigg that looks like you. Make your Pigg It is an avatar like your alter! You can make a Pigg that looks like you by combining various colors and parts. 40
Slide 41: Dress-up and Room rearrangement
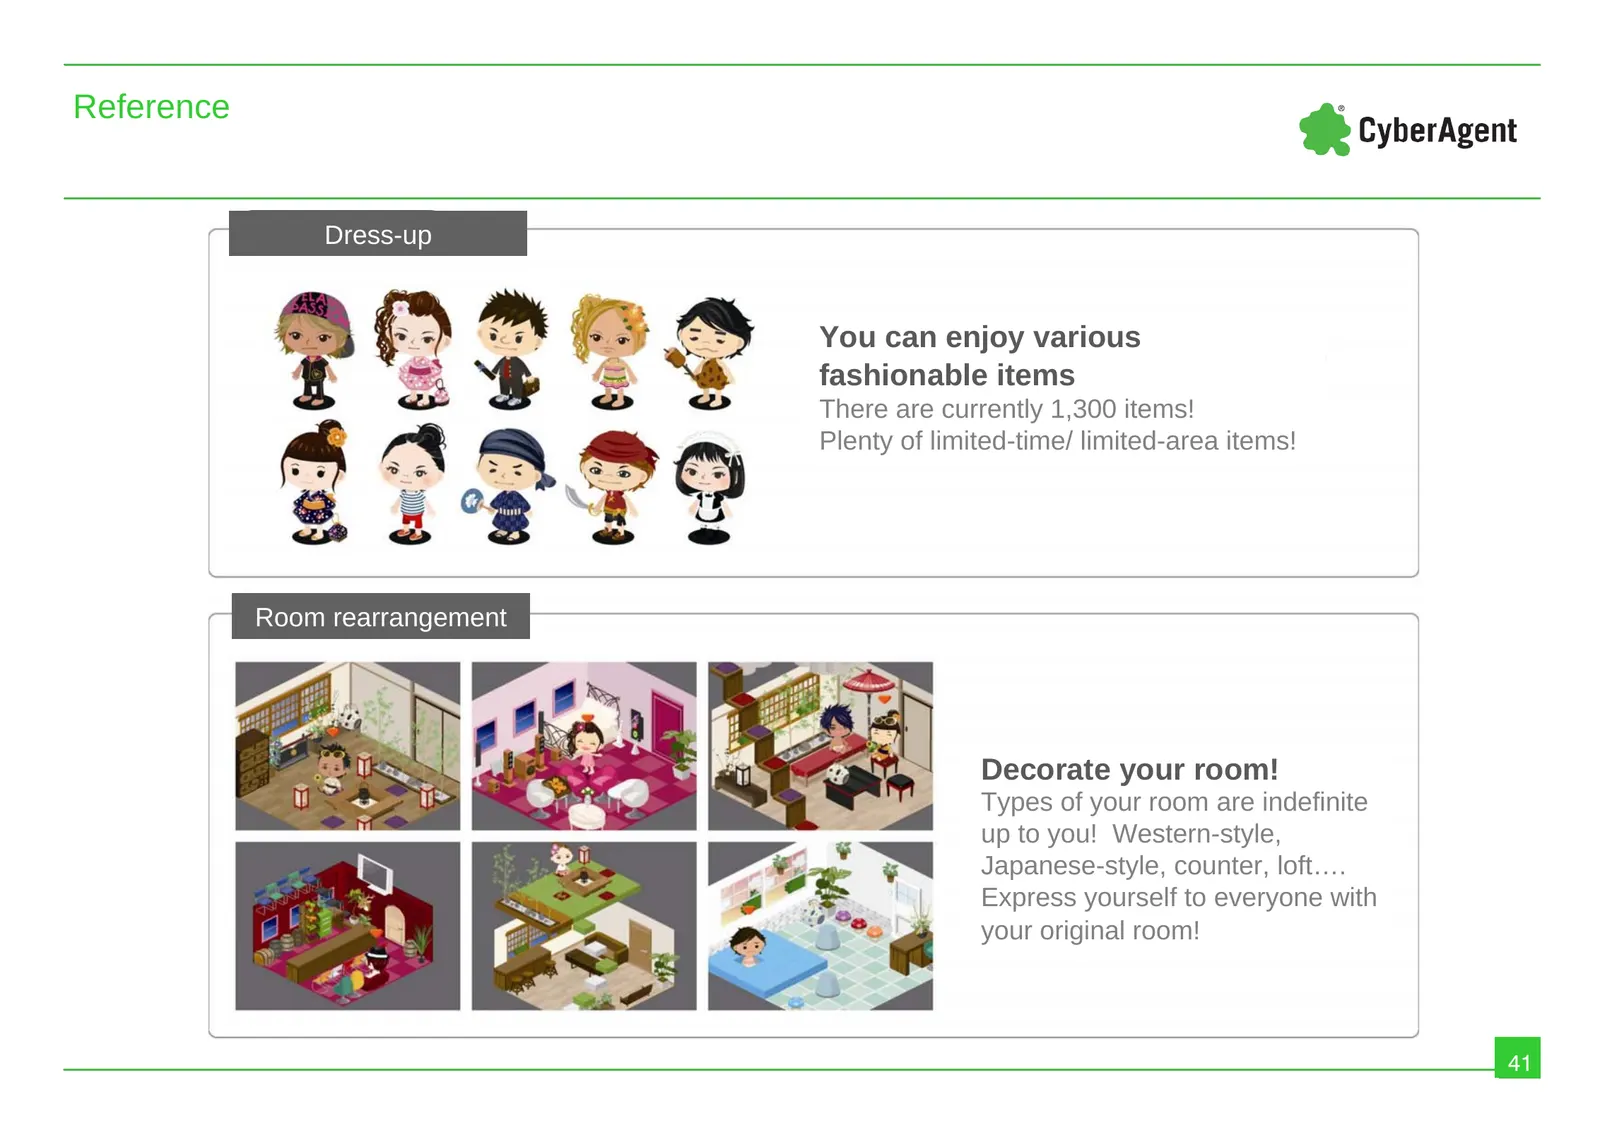
Reference Dress-up You can enjoy various fashionable items There are currently 1,300 items! Plenty of limited-time/ limited-area items! Room rearrangement Decorate your room! Types of your room are indefinite up to you! Western-style, Japanese-style, counter, loft…. Express yourself to everyone with
Slide 42: Going-out
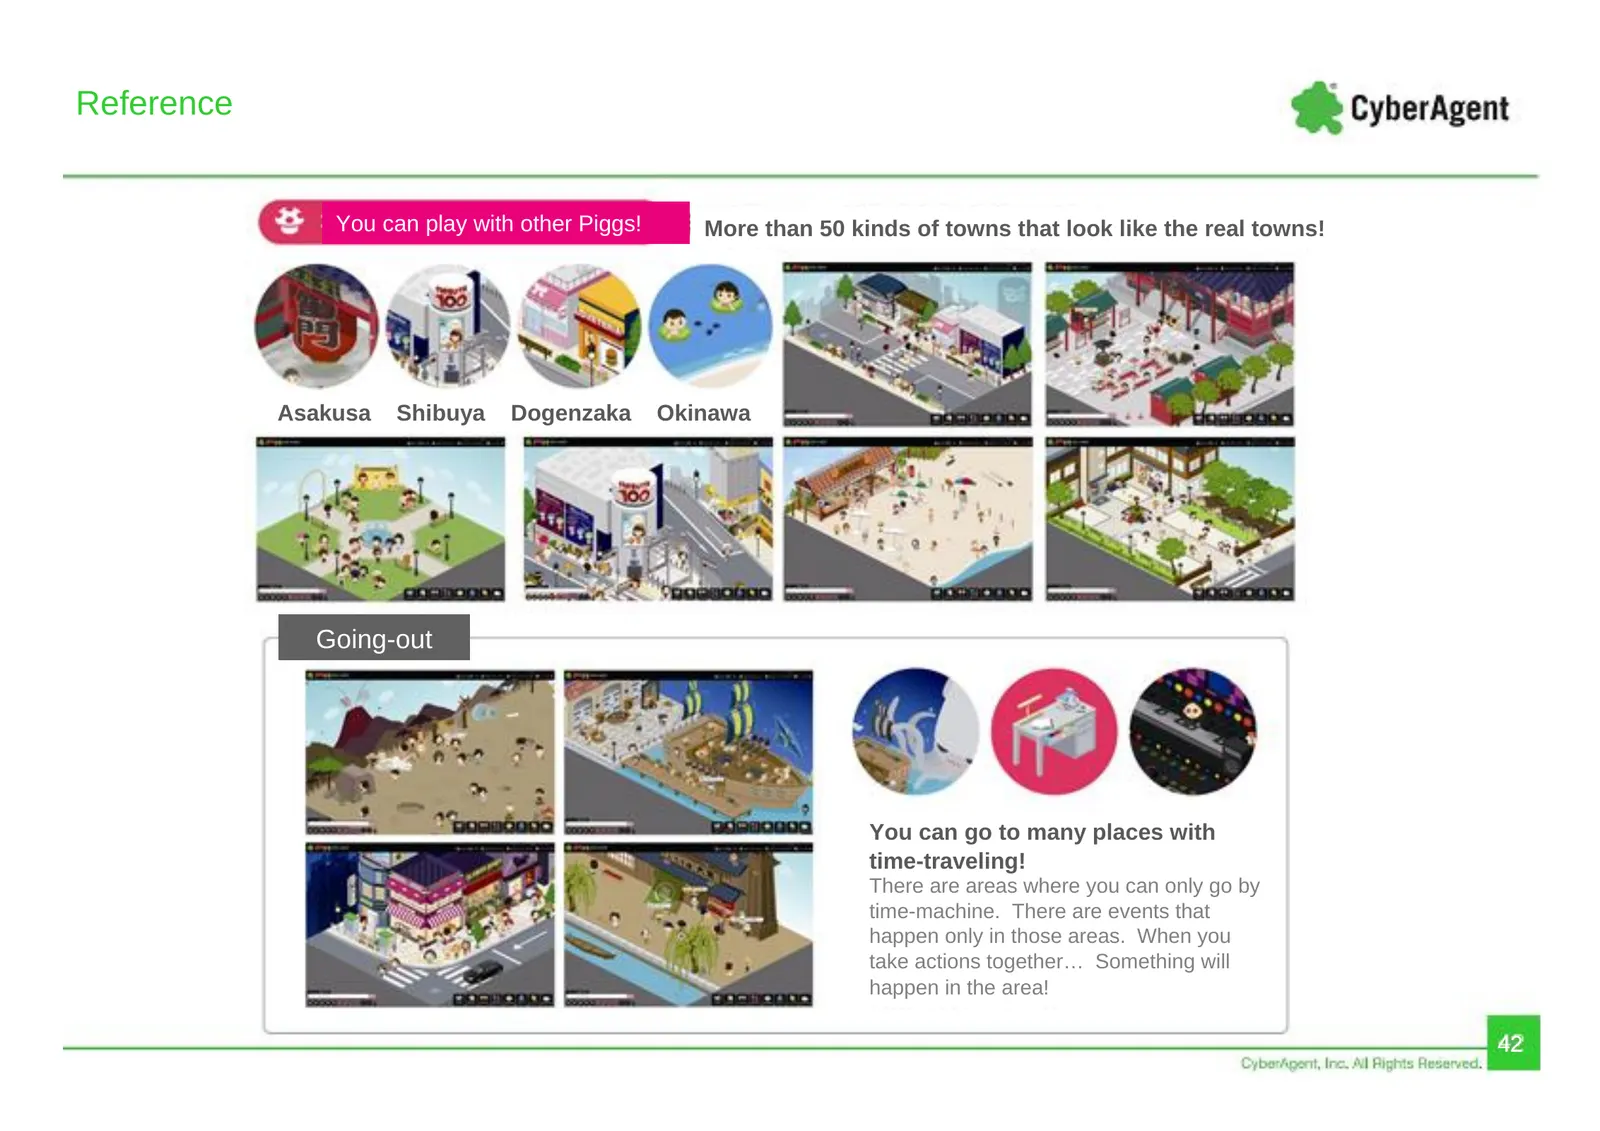
Reference You can play with other Piggs! More than 50 kinds of towns that look like the real towns! Asakusa Shibuya Dogenzaka Okinawa Going-out You can go to many places with time-traveling! There are areas where you can only go by time-machine. There are events that happen only in those areas. When
Slide 43: Pigg-Tomo (friends)
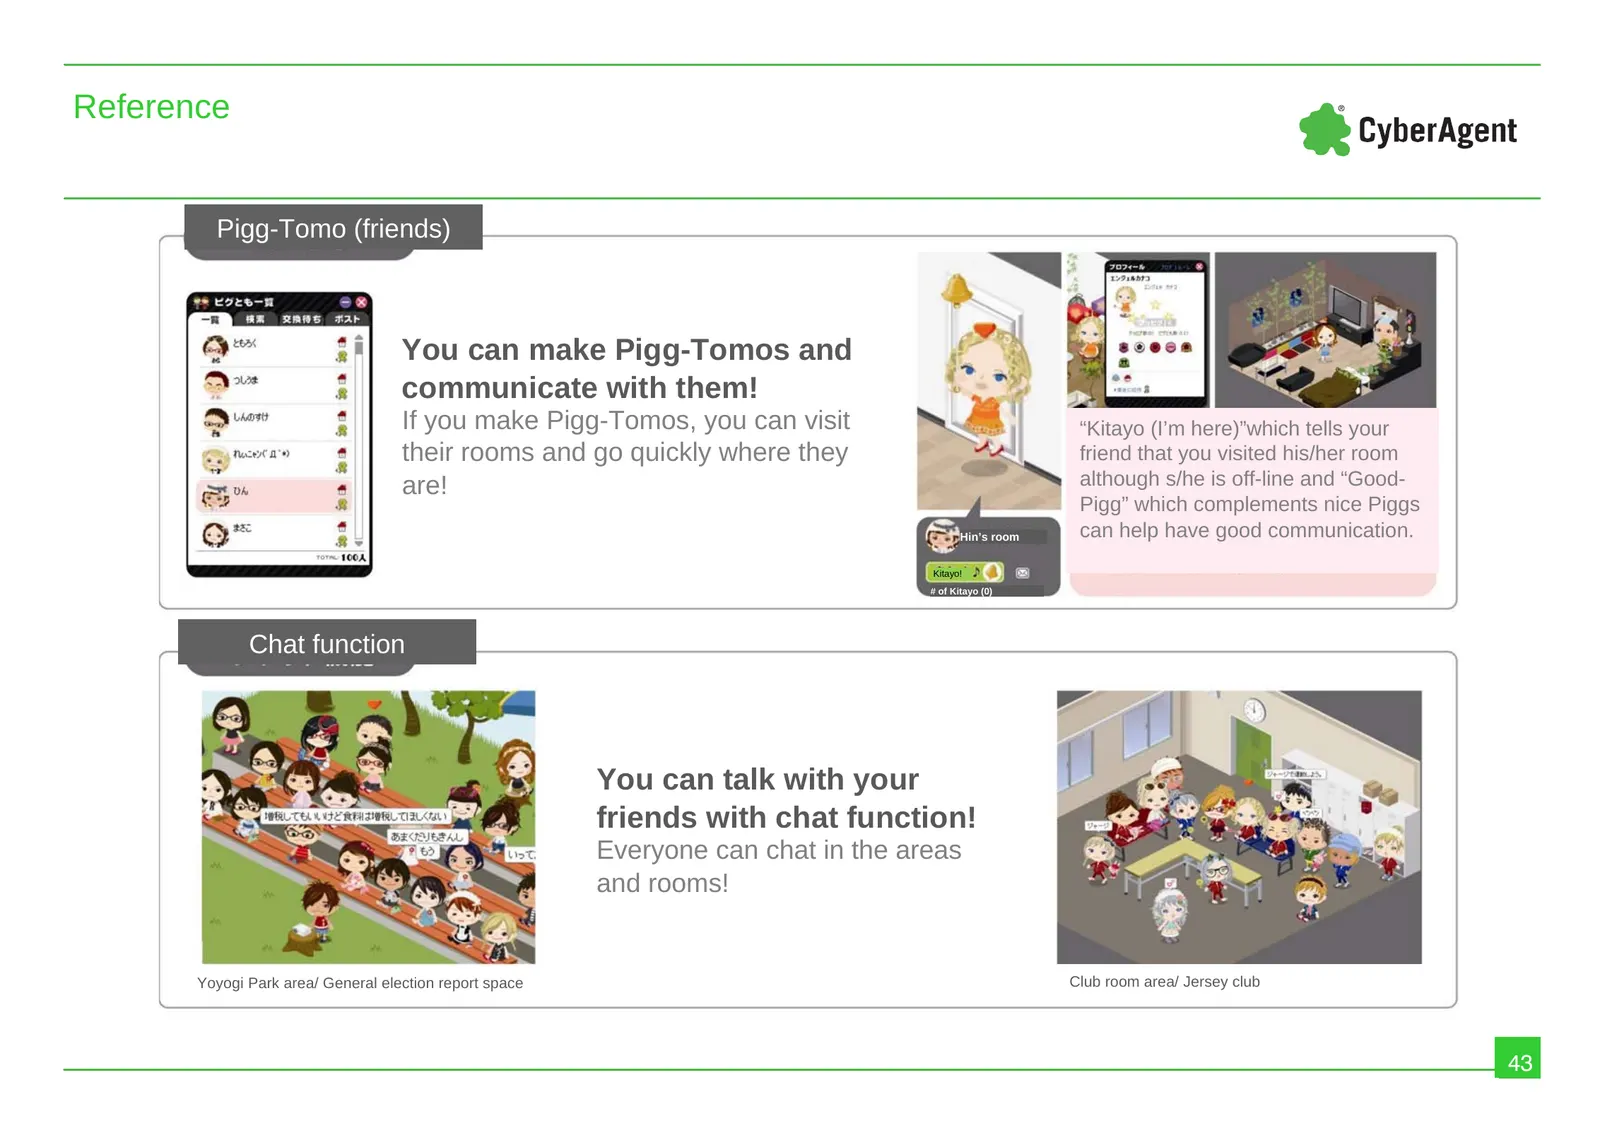
Reference Pigg-Tomo (friends) You can make Pigg-Tomos and communicate with them! If you make Pigg-Tomos, you can visit “Kitayo (I’m here)”which tells your their rooms and go quickly where they friend that you visited his/her room are! although s/he is off-line and “Good- Pigg” which complements nice
Slide 44: Actions and Camera
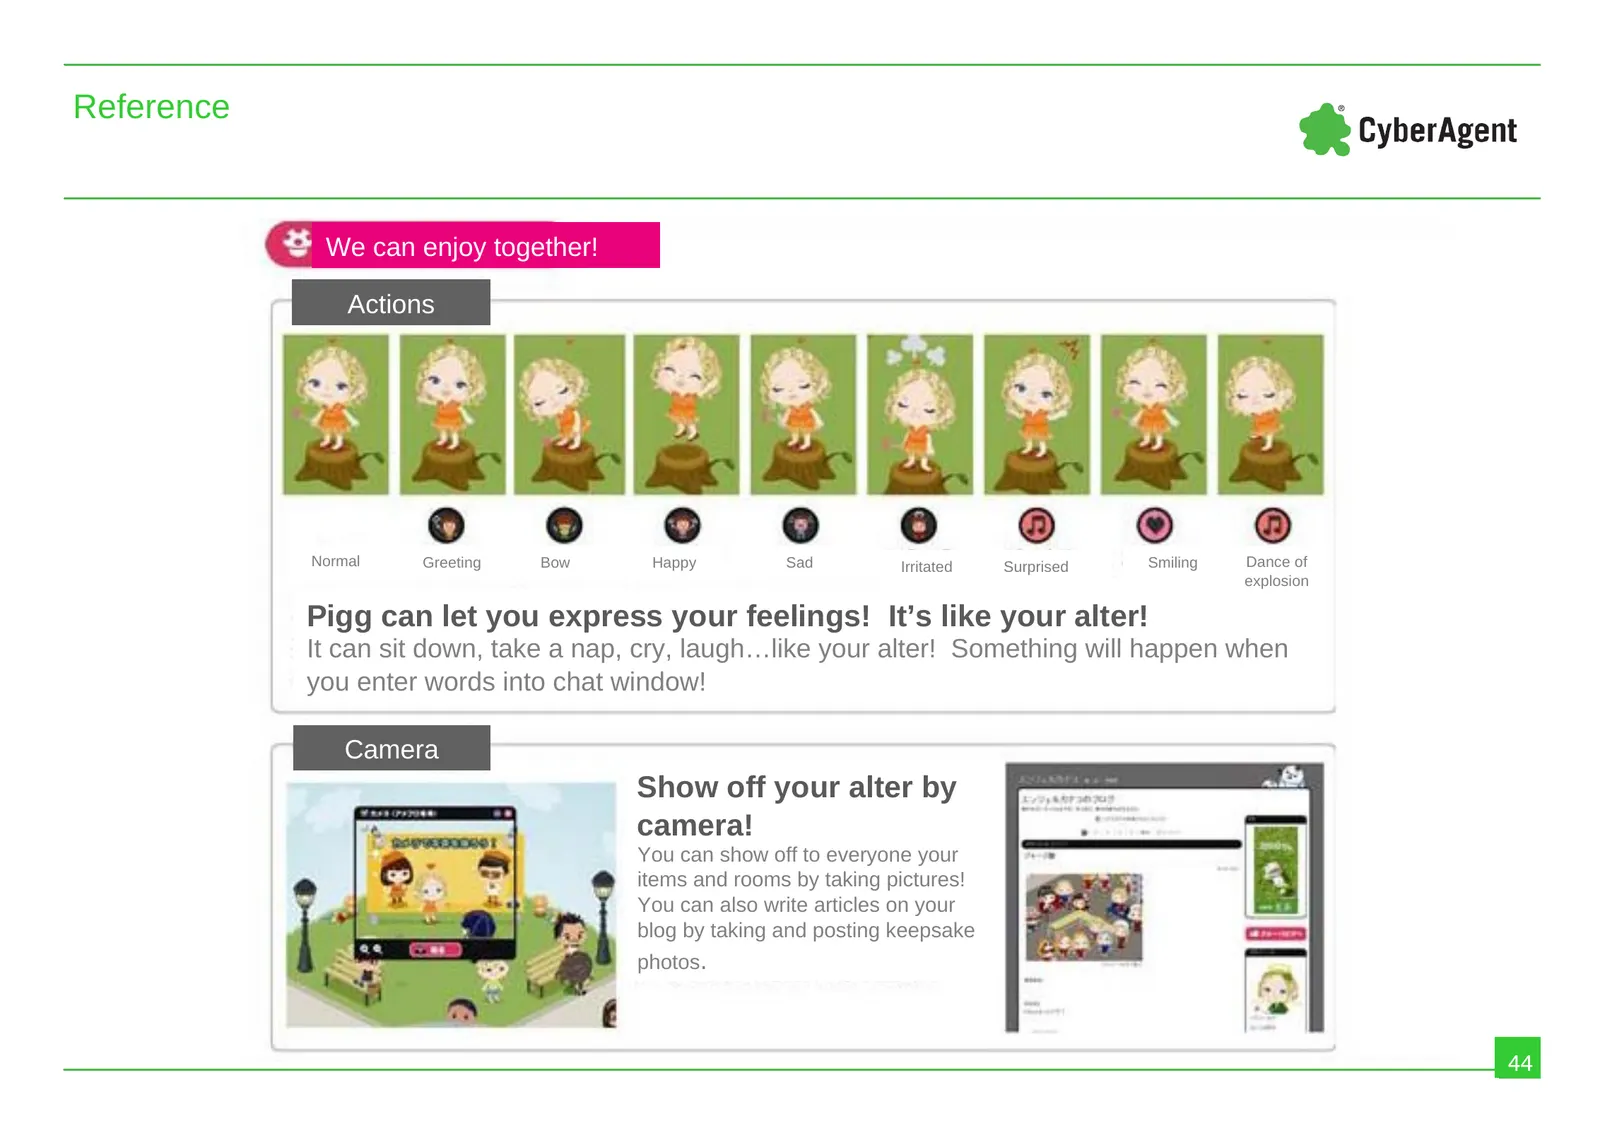
Reference We can enjoy together! Actions Normal Greeting Bow Happy Sad Irritated Surprised Smiling Dance of explosion Pigg can let you express your feelings! It’s like your alter! It can sit down, take a nap, cry, laugh…like your alter! Something will happen when you enter words into chat window! Ca
Slide 45: Games and Celebrity Pigg
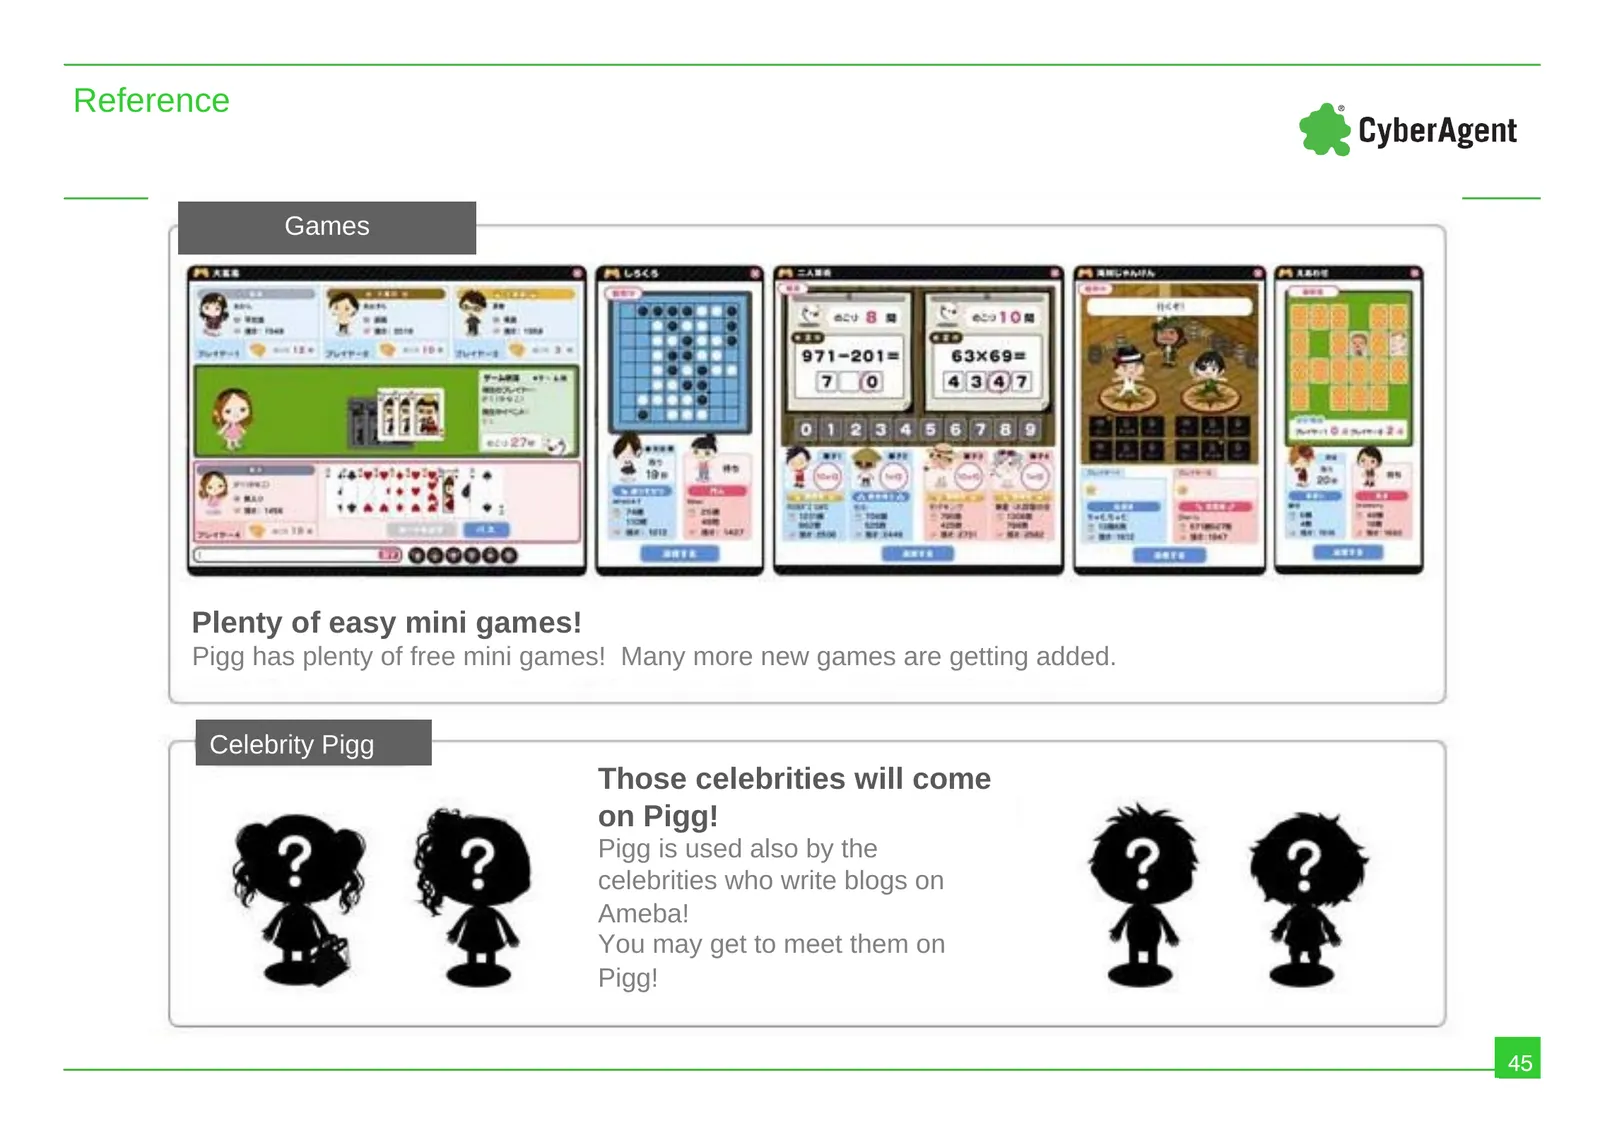
Reference Games Plenty of easy mini games! Pigg has plenty of free mini games! Many more new games are getting added. Celebrity Pigg Those celebrities will come on Pigg! Pigg is used also by the celebrities who write blogs on Ameba! You may get to meet them on Pigg! 45
Source: Internet Archive copy of ir.cyberagent.co.jp
More decks from CyberAgent Incorporated
 FY2026 Earnings Presentation59 slides · Nov 16, 2026
 FY2026 Earnings Presentation60 slides · Nov 12, 2026
 FY2026 Earnings Presentation58 slides · Nov 11, 2026
 Investor Presentation (August 2026)79 slides · Aug 7, 2026
 Q3 2026 Earnings Presentation40 slides · Aug 7, 2026
 Q2 2026 Earnings Presentation39 slides · May 13, 2026