Furmanite — FY2008 Earnings Presentation
20 slides from Furmanite's earnings presentation, Mar 16, 2009
Slide 1: Furmanite Corporation 2008 Year in Review
Furmanite Corporation 2008 Year in Review Michael L. Rose, Chairman & CEO Joseph E. Milliron, President & COO Howard C. Wadsworth, CFO
Slide 2: Safe Harbor Statement
Safe Harbor Statement Certain of the Company's statements in this presentation are not purely historical, and as such are "forward-looking statements" within the meaning of the Private Securities Litigation Reform Act of 1995. These include statements regarding management's plans, beliefs, expectati
Slide 3: Furmanite Corporation 2008 Year in Review - Michael L. Rose
Furmanite Corporation 2008 Year in Review Michael L. Rose, Chairman & CEO 03/16/2009 3
Slide 4: Overview
Overview Furmanite is the only worldwide provider of specialty technical services Deliver a broad portfolio of 12 services Serve more than 8,000 customers Operate more than 80 offices on six continents Employ talented workforce of 1,925 Strong, stable record of growth 4 03/16/2009
Slide 5: 2008 Financial Highlights
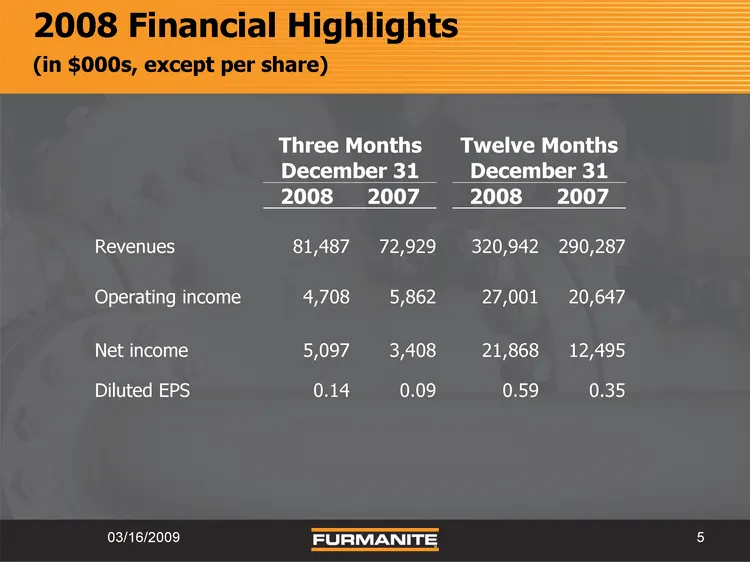
2008 Financial Highlights (in $000s, except per share) Three Months Three Months Twelve Months Twelve Months December 31 December 31 December 31 December 31 2008 2007 2008 2007 Revenues 81,487 72,929 320,942 290,287 Operating income 4,708 5,862 27,001 20,647 Net income 5,097 3,408 21,868 12,495 Dilu
Slide 6: Furmanite Corporation 2008 Year in Review - Howard C. Wadsworth, CFO
Furmanite Corporation 2008 Year in Review Howard C. Wadsworth, CFO 03/16/2009 6
Slide 7: Consolidated Condensed Statements of Operations
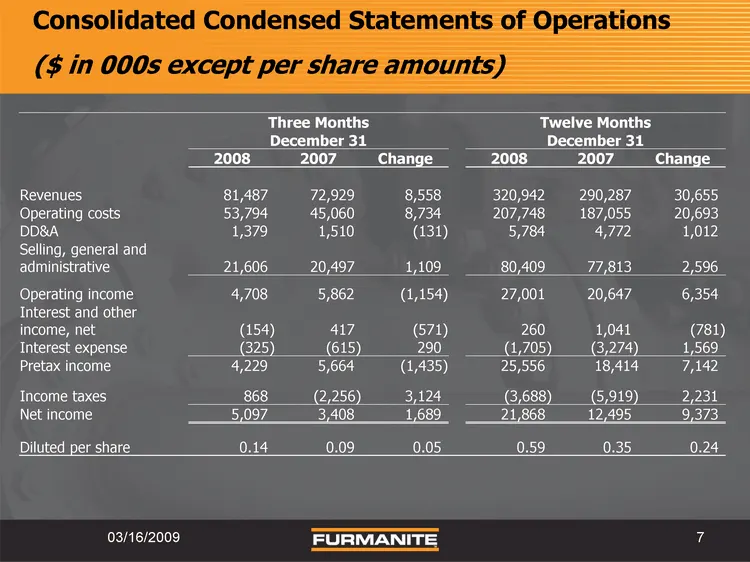
Consolidated Condensed Statements of Operations ($ in 000s except per share amounts) Three Months Three Months Three Months Twelve Months Twelve Months Twelve Months December 31 December 31 December 31 December 31 December 31 December 31 2008 2007 Change 2008 2007 Change Revenues 81,487 72,929 8,558
Slide 8: Currency Adjustments
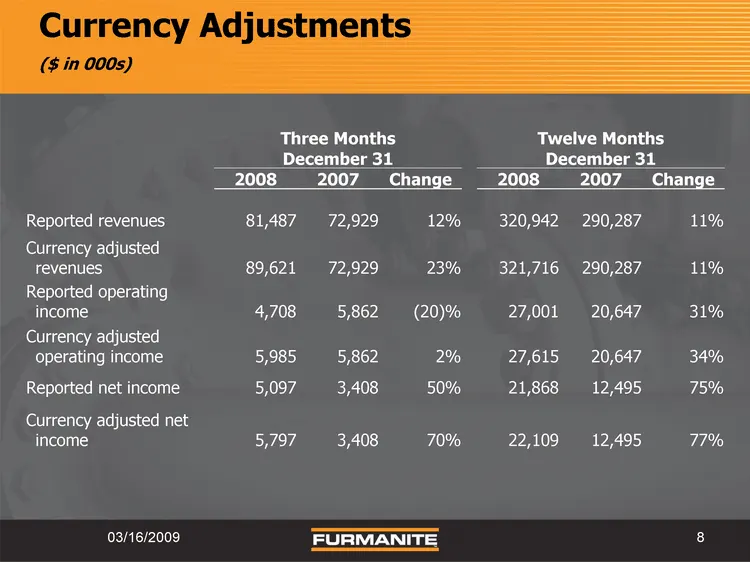
Currency Adjustments ($ in 000s) Three Months Three Months Three Months Twelve Months Twelve Months Twelve Months December 31 December 31 December 31 December 31 December 31 December 31 2008 2007 Change 2008 2007 Change Reported revenues 81,487 72,929 12% 320,942 290,287 11% Currency adjusted revenu
Slide 9: Consolidated Condensed Balance Sheets
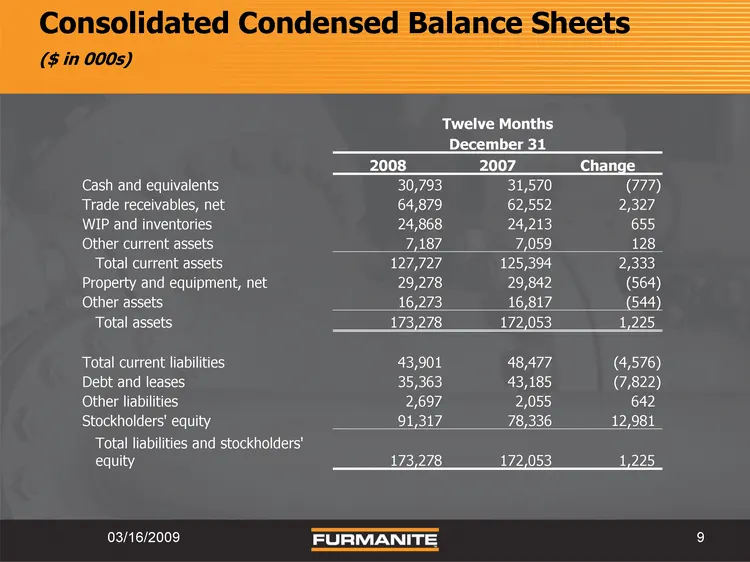
Consolidated Condensed Balance Sheets ($ in 000s) Twelve Months Twelve Months Twelve Months December 31 December 31 December 31 2008 2007 Change Cash and equivalents 30,793 31,570 (777) Trade receivables, net 64,879 62,552 2,327 WIP and inventories 24,868 24,213 655 Other current assets 7,187 7,059
Slide 10: Consolidated Condensed Cash Flows
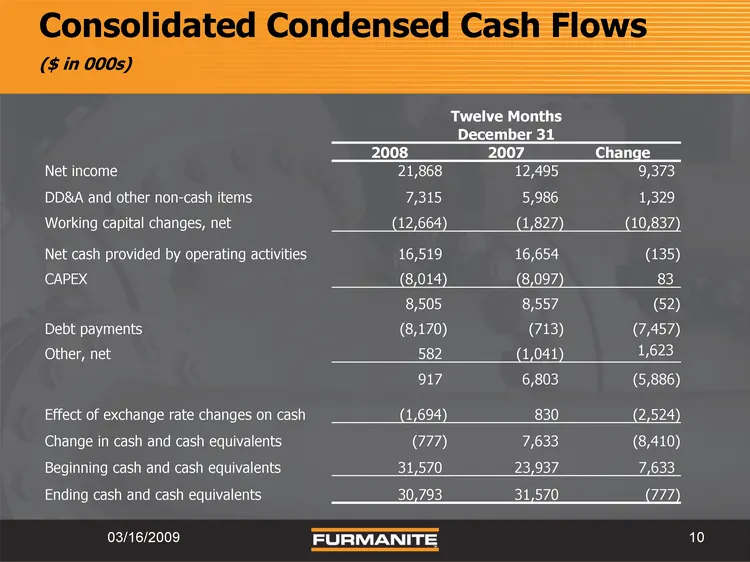
Consolidated Condensed Cash Flows ($ in 000s) Twelve Months Twelve Months Twelve Months December 31 December 31 December 31 2008 2007 Change Net income 21,868 12,495 9,373 DD&A and other non-cash items 7,315 5,986 1,329 Working capital changes, net (12,664) (1,827) (10,837) Net cash provided by oper
Slide 11: Furmanite Corporation 2008 Year in Review - Joseph E. Milliron
Furmanite Corporation 2008 Year in Review Joseph E. Milliron, President and COO 03/16/2009 11
Slide 12: The Americas Locations
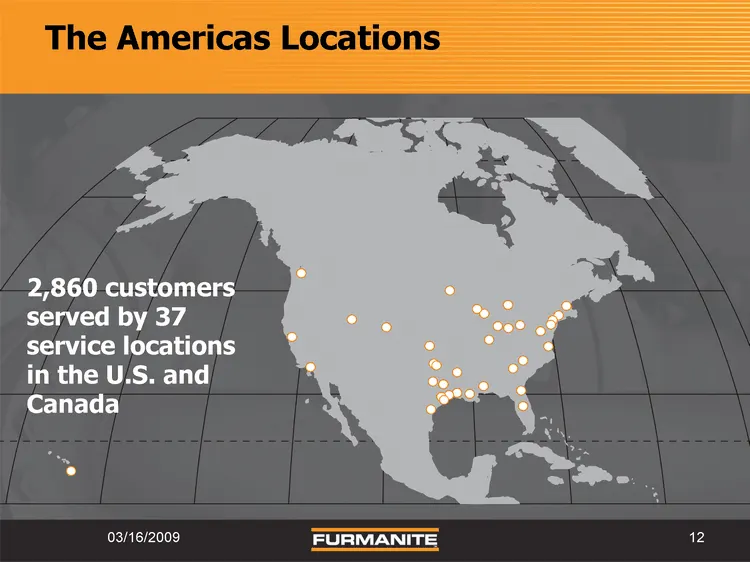
The Americas Locations 2,860 customers served by 37 service locations in the U.S. and Canada 12 03/16/2009
Slide 13: Europe, Scandinavia, Middle East and Africa Locations
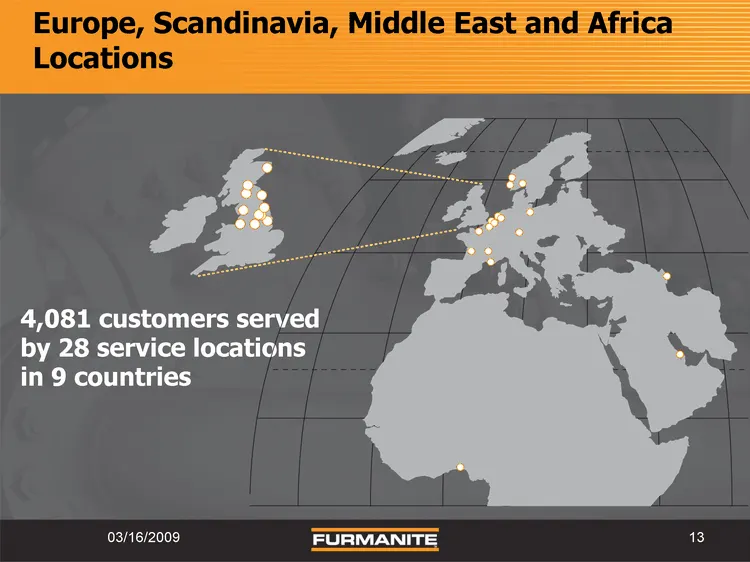
Europe, Scandinavia, Middle East and Africa Locations 4,081 customers served by 28 service locations in 9 countries 13 03/16/2009
Slide 14: Asia/Pacific Locations
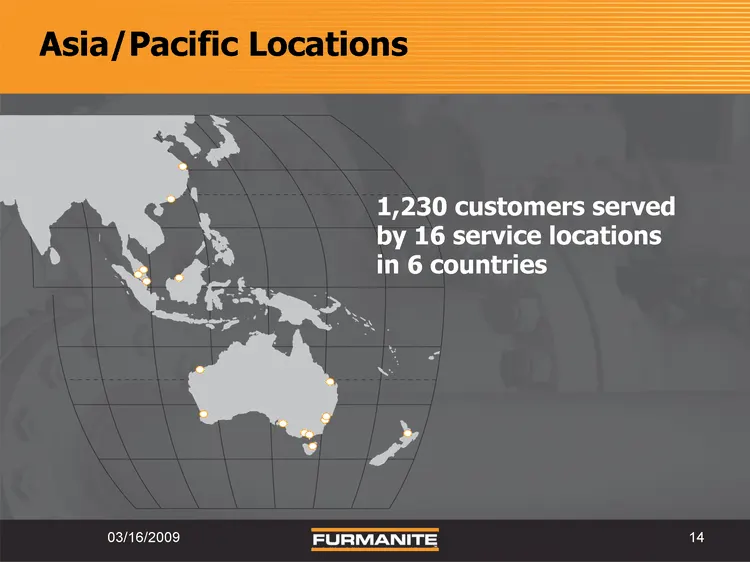
Asia/Pacific Locations 1,230 customers served by 16 service locations in 6 countries 14 03/16/2009
Slide 15: Our Greatest Asset: People
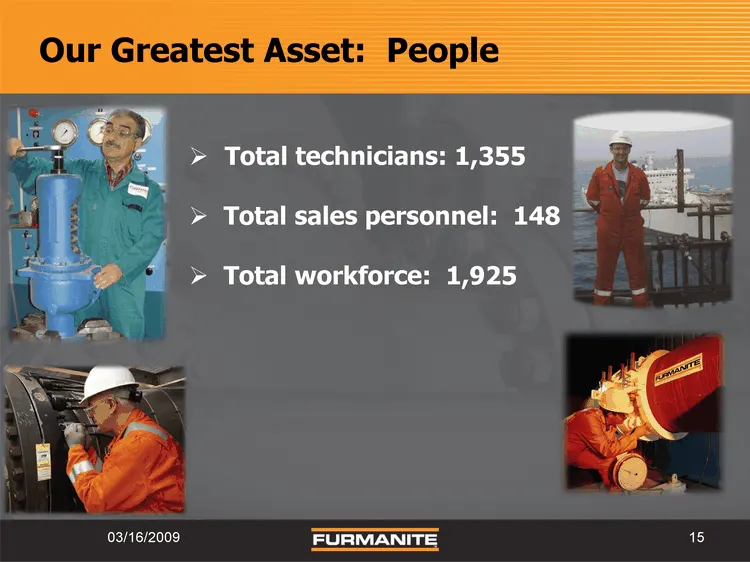
Our Greatest Asset: People Total technicians: 1,355 Total sales personnel: 148 Total workforce: 1,925 03/16/2009 15
Slide 16: Our Competitive Advantage: Services
Our Competitive Advantage: Services Under-pressure Services Leak sealing Hot tapping Line stopping Composite repair Trevitest valve testing Turnaround Services Valve repair On-site machining Heat exchanger repair Heat treatment Bolting Concrete/polymers repair SmartShim Furmanite's service lines hav
Slide 17: 2008 Furmanite Revenue By Industry
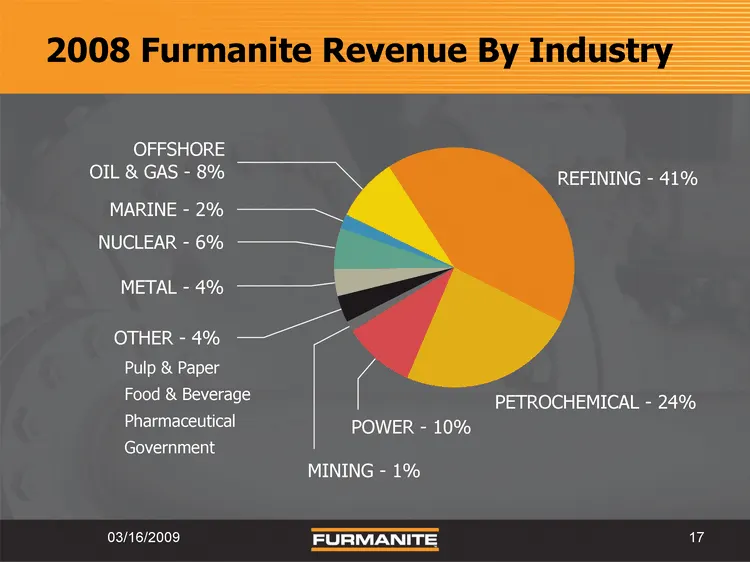
2008 Furmanite Revenue By Industry OFFSHORE OIL & GAS - 8% MARINE - 2% NUCLEAR - 6% METAL - 4% OTHER - 4% Pulp & Paper Food & Beverage Pharmaceutical Government POWER - 10% PETROCHEMICAL - 24% MINING - 1% REFINING - 41% 17 03/16/2009
Slide 18: 2008 Results by Region
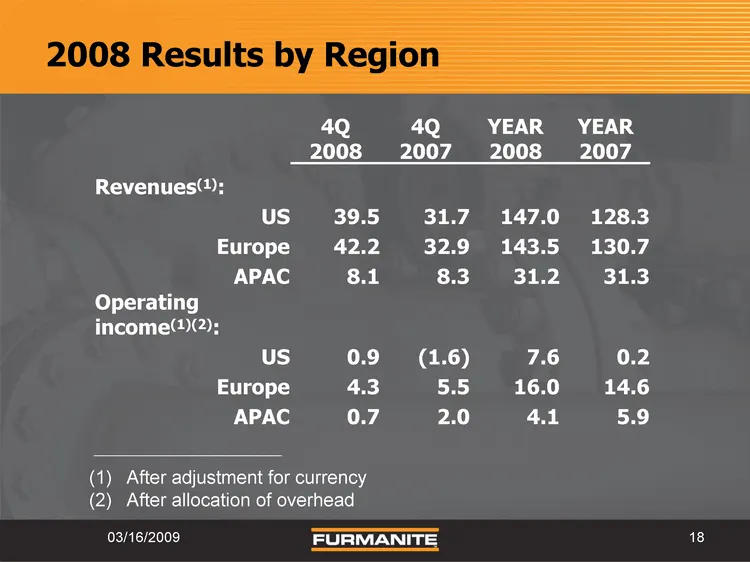
2008 Results by Region 4Q 2008 4Q 2007 YEAR 2008 YEAR 2007 Revenues(1): US 39.5 31.7 147.0 128.3 Europe 42.2 32.9 143.5 130.7 APAC 8.1 8.3 31.2 31.3 Operating income(1)(2): US 0.9 (1.6) 7.6 0.2 Europe 4.3 5.5 16.0 14.6 APAC 0.7 2.0 4.1 5.9 18 03/16/2009 After adjustment for currency After allocation
Slide 19: Market Opportunities
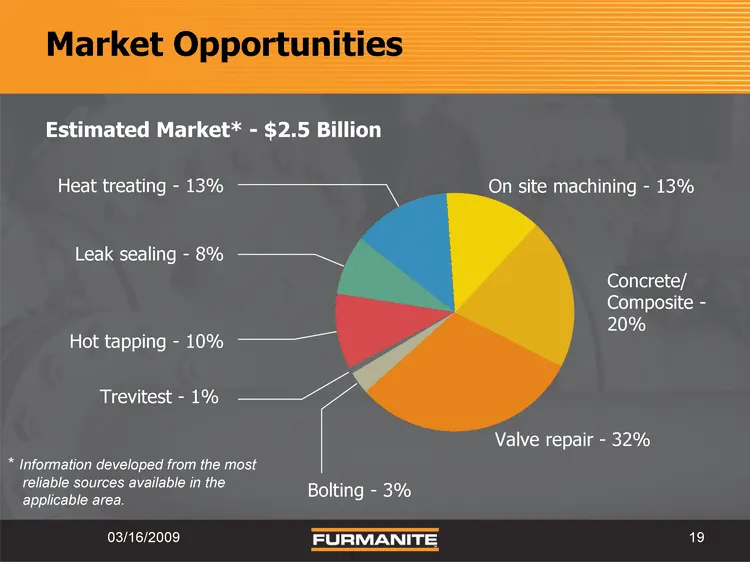
Market Opportunities Heat treating - 13% Leak sealing - 8% Hot tapping - 10% Trevitest - 1% Concrete/ Composite - 20% Valve repair - 32% Bolting - 3% On site machining - 13% Estimated Market* - $2.5 Billion 19 03/16/2009 * Information developed from the most reliable sources available in the applica
Slide 20: Furmanite Corporation 2008 Year in Review
Furmanite Corporation 2008 Year in Review 03/16/2009 20
Source: SEC EDGAR · 8-K filed Mar 16, 2009
More decks from Furmanite Corp
 Merger or Acquisition (November 2015)13 slides · Nov 2, 2015
 Q2 2015 Earnings Presentation19 slides · Aug 4, 2015
 Q1 2015 Earnings Presentation16 slides · May 11, 2015
 Proxy Contest (April 2015)40 slides · Apr 2, 2015
 Proxy Contest (April 2015)29 slides · Apr 2, 2015
 Proxy Contest (March 2015)39 slides · Mar 30, 2015