Somerset Hills Bancorp — Shareholder Meeting (April 2008)
31 slides from Somerset Hills Bancorp's shareholder meeting presentation, Apr 30, 2008

Slide 1: Annual Meeting April 30, 2008
Annual Meeting April 30, 2008 Welcome To
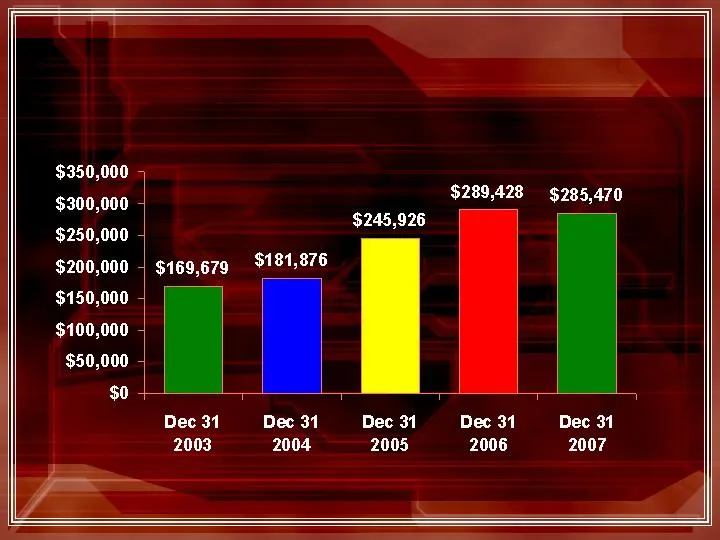
Slide 2: Total Assets
7% Increase Total Assets 13% Increase 1% Decrease ( in thousands) 2 35% Increase 18% Increase
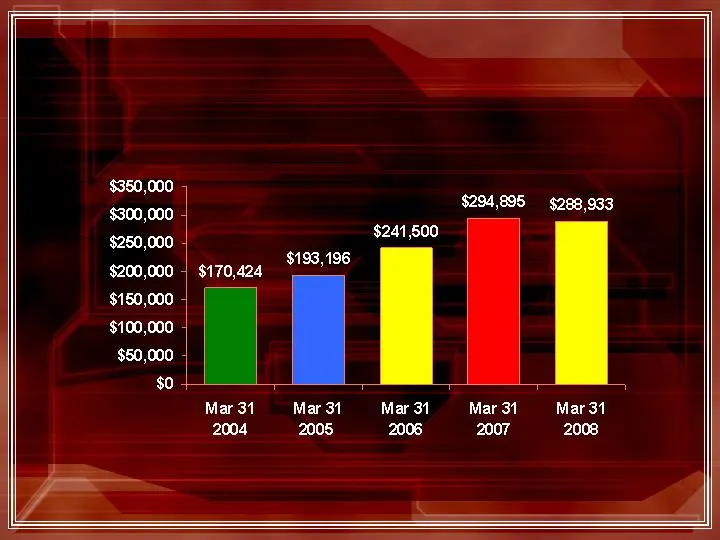
Slide 3: Total Assets
Total Assets 13% Increase 14% Increase 22% Increase ( in thousands) 3 25% Increase 2% Decrease

Slide 4: Statement of Operations
Statement of Operations ( in thousands) *reflects a one time $449,000 reversal of the valuation allowance for taxes ** reflects a one time $1,200,000 write off of goodwill and a $1,000,000 increase in loan loss provisions Year Net Income Change From Prior Year 2003 $1,173 + 555% 2004 $1,359 + 16% 20

Slide 5: Net Income Years – Without Adjustments 2004-2007
Net Income 4 Years – Without Adjustments 2004-2007 * 2005 and 2007 net income without prior page foot noted adjustments , also reflects the costs associated with our newly opened branches - Madison (September 2006) and Long Valley (May 2007). (2.7%) $2,139* 32% $2,198 22% $1,663* 16% $1,359 Net Inco

Slide 6: Income Trend
Income Trend ( in thousands) *reflects a one time $449,000 reversal of the valuation allowance for taxes ** reflects a one time $1,200,000 write off of goodwill and a $1,000,000 increase in loan loss provisions 2004 2005 2006 2007 2008 1 st Qtr. $ 222 $ 262 $ 475 $520 $444 2 nd Qtr. 313 345 485 536
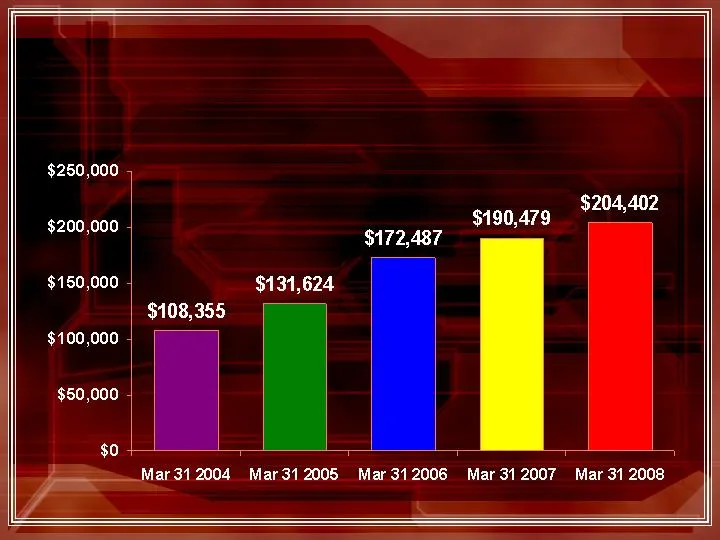
Slide 7: Loan Growth - Total Balances
Loan Growth - Total Balances 10% Increase 20% Increase 31% Increase 7% Increase ( in thousands) 7 10% Increase
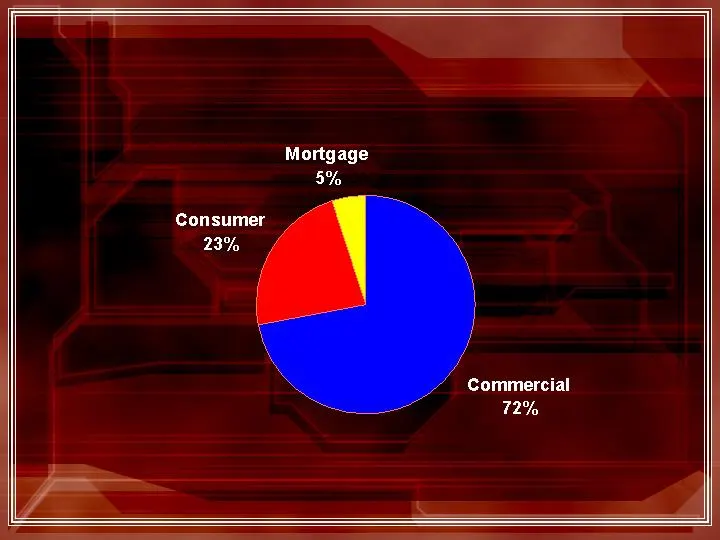
Slide 8: Loan Mix Composition
Loan Mix Composition Total Balances March 31, 2008 8

Slide 9: Net Interest Margin
Net Interest Margin 3.92% 03/31/2007 4.22% 03/31/2008 4.15% 12/31/2006 4.02% 12/31/2007 4.31% 12/31/2005 3.78% 12/31/2004 9
Slide 10: Deposit Growth
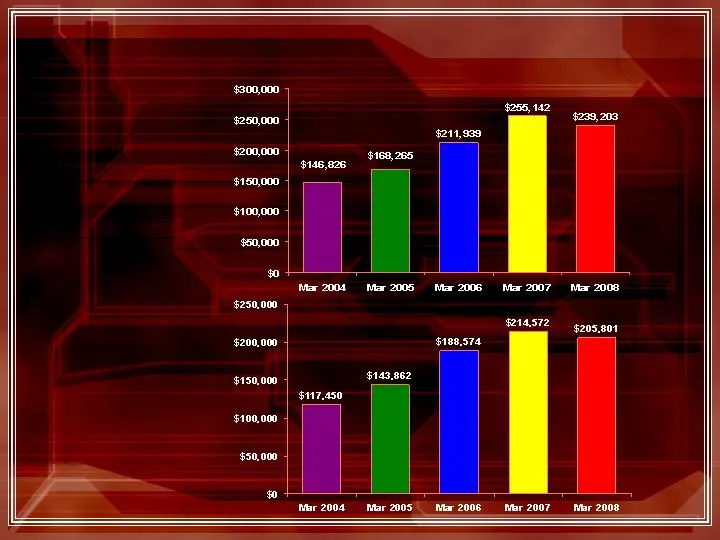
Deposit Growth Total Deposits Core Deposits 31% Increase 26% Increase 16% Increase 6% Decrease 38% Increase 4% Decrease ( in thousands) 10 15% Increase 22% Increase 14% Increase 20% Increase

Slide 11: Deposit Mix - Total Balances
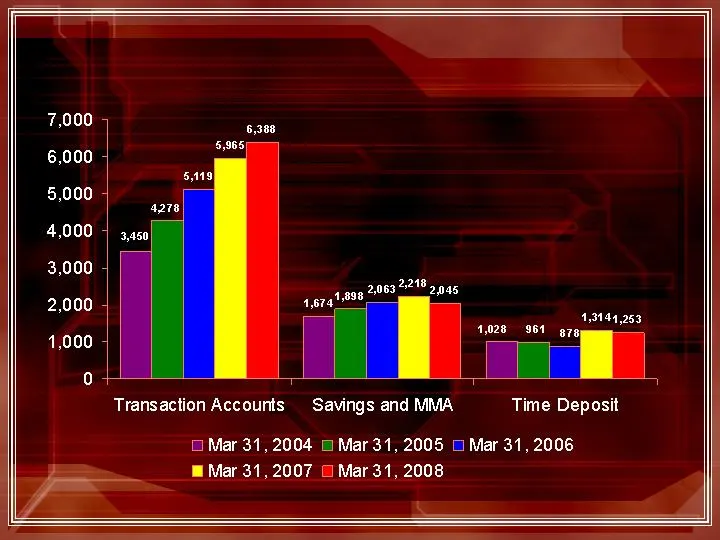
Deposit Mix - Total Balances 86% $35,616 $163,590 $51,015 12/31/2006 87% $31,428 $159,462 $53,783 12/31/2007 90% $20,731 $141,846 $45,667 12/31/2005 85% $23,748 $94,066 $37,061 12/31/2004 79% $30,545 $86,111 $28,995 12/31/2003 Core Deposits as a % of Total Deposits Time Deposits NOW/Money Market/Sav
Slide 12: 1g7ateoe
2248 2,063 2218 > 945 1g7ateoe 4,3144,253 4928 a | = Transaction Accounts Savings and MMA Time Deposit © Mar 31, 2004 © Mar 31, 2005 4 Mar 31, 2006 @ Mar 31, 2007 G Mar 31, 2008
Slide 13: Paramount Checking
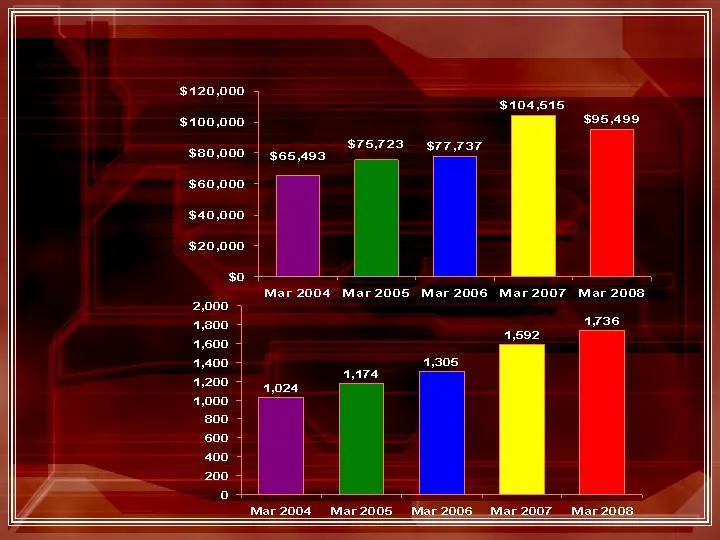
Paramount Checking Total Balances Number of Accounts 22% Increase 19% Increase 3% Increase 11% Increase 9% Decrease 9% Increase ( in thousands) 13 16% Increase 15% Increase 34% Increase 22% Increase
Slide 14: Paramount Checking - continued
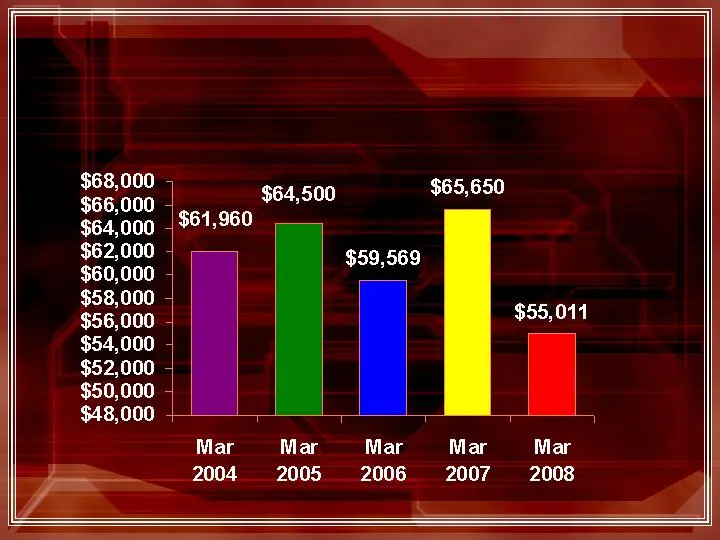
Paramount Checking - continued Average Balance Per Account 14
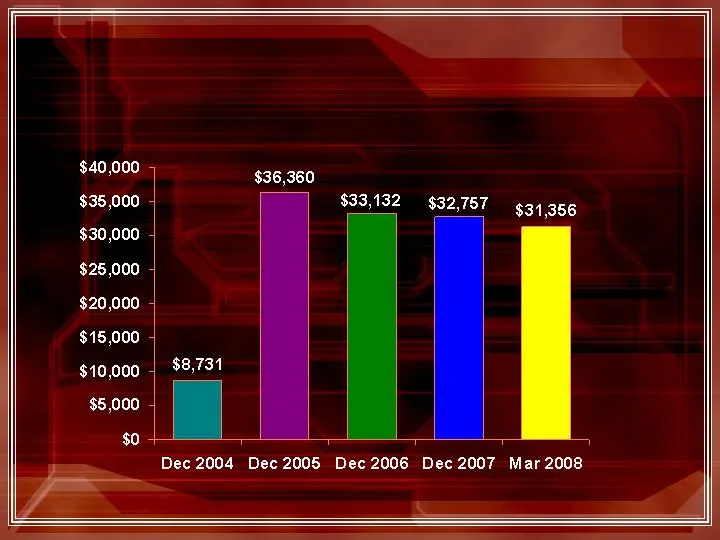
Slide 15: Escrow Ease Total Balances
Escrow Ease Total Balances ( in thousands) 15
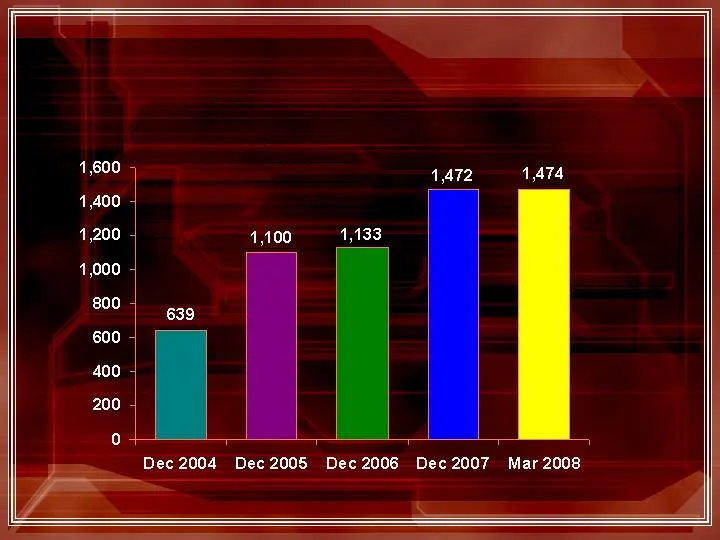
Slide 16: Escrow Ease - continued
Escrow Ease - continued Number of Client Accounts 16
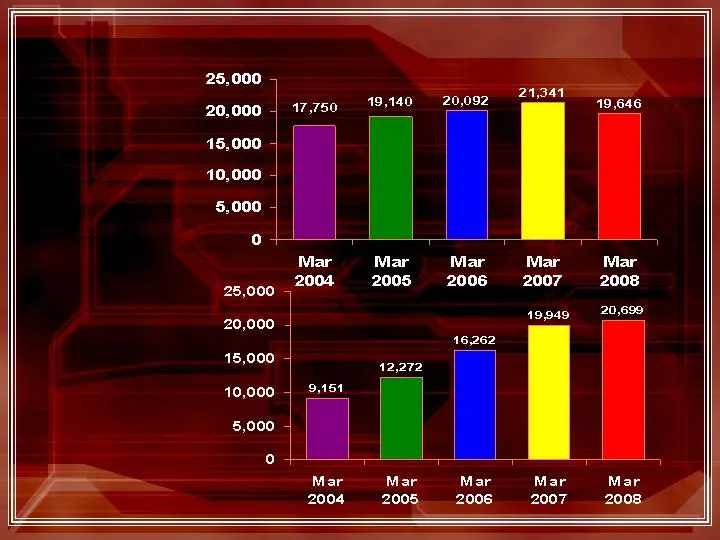
Slide 17: Transaction Activity
Transaction Activity Teller Transactions Per Month ACH Transactions Per Month 27% Increase 8% Increase 58% Increase 34% Increase 5% Increase 33% Increase 8% Decrease 4% Increase 17 6% Increase 23% Increase

Slide 18: Capital Ratios
Capital Ratios ( in thousands) Actual Well Capitalized December 31, 2007 Amount Ratio Amount Ratio Total Capital (to risk - weighted assets) $39,485 16.01% $2 4 ,657 > 10.00% Tier I Capital (to risk - weighted assets) 36,404 14.76 14,794 > 6.00 Tier I Capital (to average asse ts) 36,404 12.68 14,353

Slide 19: Sullivan Financial Services, Inc.
Sullivan Financial Services, Inc. a subsidiary of Somerset Hills Bank Headquarters 100 Executive Drive, Suite 140 West Orange, NJ 07052 Phone: 973-325-5000 Fax: 973-736-7947 19

Slide 20: Sullivan Financial Services Products and Services
Sullivan Financial Services, Inc. Products and Services Conventional Mortgage Loans Fixed and Adjustable Rate Loans FHA/VA Loans Jumbo Mortgages 1st Time Buyer Programs Reverse Mortgages No Cost Refinances 20

Slide 21: Sullivan Financial Services Loan Volume
Sullivan Financial Services, Inc. Loan Volume 2003 2004 2005 2006 2007 Originations $530,913 ,000 $330,491 ,000 $379,114 ,000 $341,689 ,000 $261,168 ,000 Originations 2,159 1,297 1,362 1,293 864 Closings $505,384 ,000 $270,803 ,000 $311,273 ,000 $293,329 ,000 $232, 7 05 ,000 Closings 1,384 2,0 98 1,

Slide 22: Somerset Hills Wealth Management: For the Individual
Somerset Hills Wealth Management, LLC For the Individual: Financial Planning Investment Management Estate Review Life, Health & Long Term Care Insurance Property and Casualty Insurance 22

Slide 23: Somerset Hills Wealth Management: For the Business Owner
Somerset Hills Wealth Management, LLC For the Business Owner: Business Succession Planning Buy-Sell & Key Person Agreements Retirement Plans & Group Insurance Property and Casualty Insurance 23
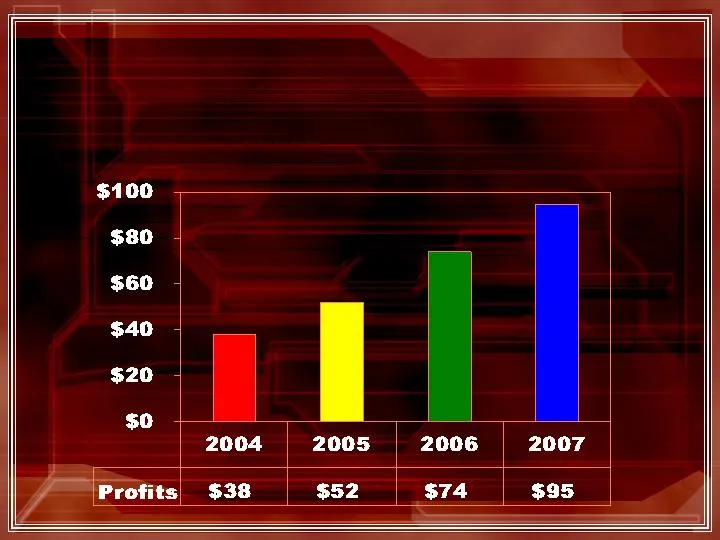
Slide 24: Somerset Hills Wealth Management Annual Profits
Somerset Hills Wealth Management, LLC Annual Profits ( in thousands) 24

Slide 25: Somerset Hills Title Company, LLC
Somerset Hills Title Company, LLC PROVIDING TITLE SERVICE IN CONNECTION WITH THE CLOSING OF REAL ESTATE TRANSACTIONS 2005 2006 2007 Total Transactions 62 36 5 8 Amount of Closed Transactions $57 Million $55 Million $ 34 Million Net Income to Bank $64,000 $101,000 $4 5 ,000 25

Slide 26: Looking at 2008
Looking at 2008 Realize on existing franchise Cross Sell Opportunities Expense Management Selective staffing opportunities 26
Slide 27: . e pal macioee
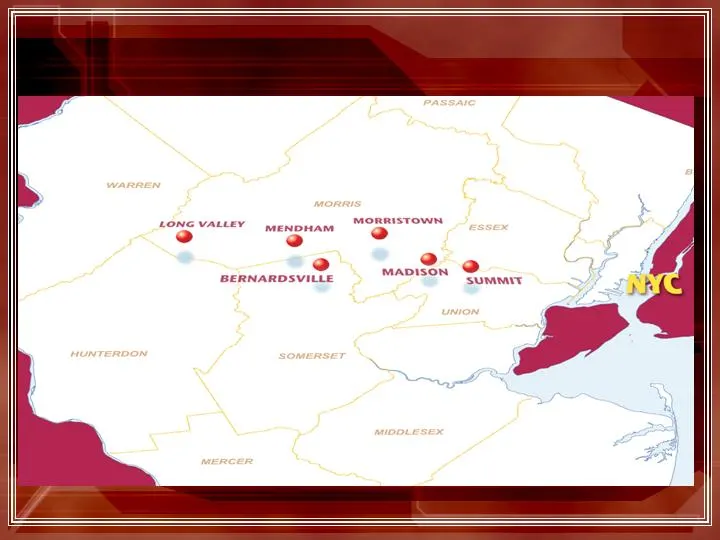
. e pal 2 macioee eepiamoavias Rael
Slide 28: New in 2007
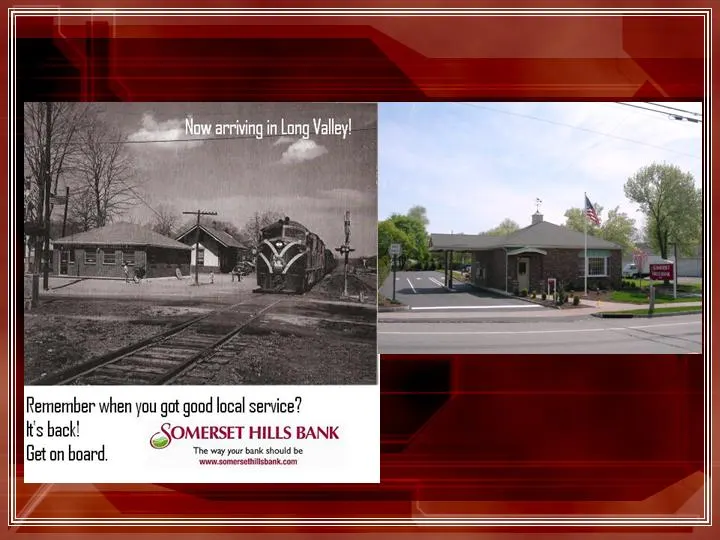
New in 2007 Then and now… 24 Schooley’s Mt. Road Long Valley, NJ 07853 908-876-5525 28
Slide 29: New in 2008
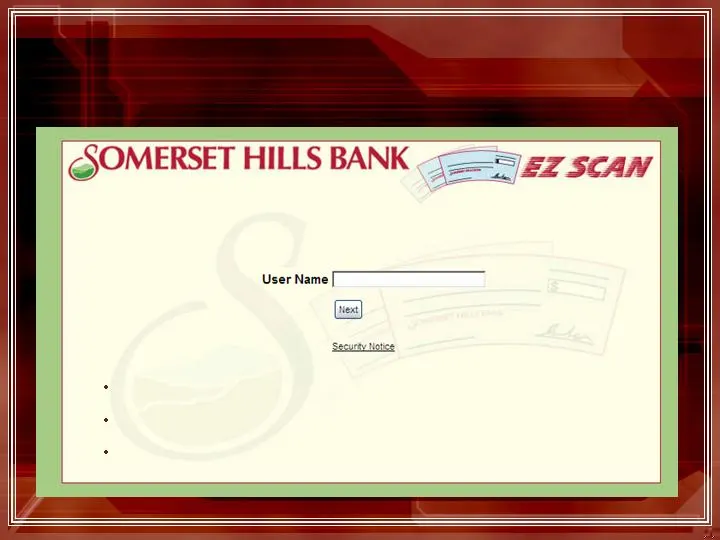
New in 2008 Remote Deposit Capture Product 29 Competitively necessary Opens new markets at minimal costs Immediate cost savings

Slide 30: 5% Stock Dividend
5% Stock Dividend !!! 30

Slide 31: Cash Dividend
$0.05 per quarter 25% Increase!!! Cash Dividend 31
Source: SEC EDGAR · 8-K filed Apr 30, 2008
More decks from Somerset Hills Bancorp
 Shareholder Meeting (May 2013)10 slides · May 8, 2013
 Merger or Acquisition (February 2013)32 slides · Feb 7, 2013
 Merger or Acquisition (January 2013)13 slides · Jan 29, 2013
 Shareholder Meeting (April 2012)25 slides · Apr 19, 2012
 Investor Presentation (November 2011)26 slides · Nov 1, 2011
 Shareholder Meeting (April 2011)29 slides · Apr 26, 2011