Somerset Hills Bancorp — Investor Presentation (November 2011)
26 slides from Somerset Hills Bancorp's investor presentation, Nov 1, 2011
Slide 1: Investor Presentation
G)OMERSET HILLS BANCORP Investor Presentation November 2, 2011
Slide 2: Forward-Looking Statements
Forward-Looking Statements This investor presentation contains certain forward-looking statements which are based on certain assumptions and describe future plans, strategies and expectations of the Company. These forward-looking statements are generally identified by use of the words "believe," “ex
Slide 3: Company Profile
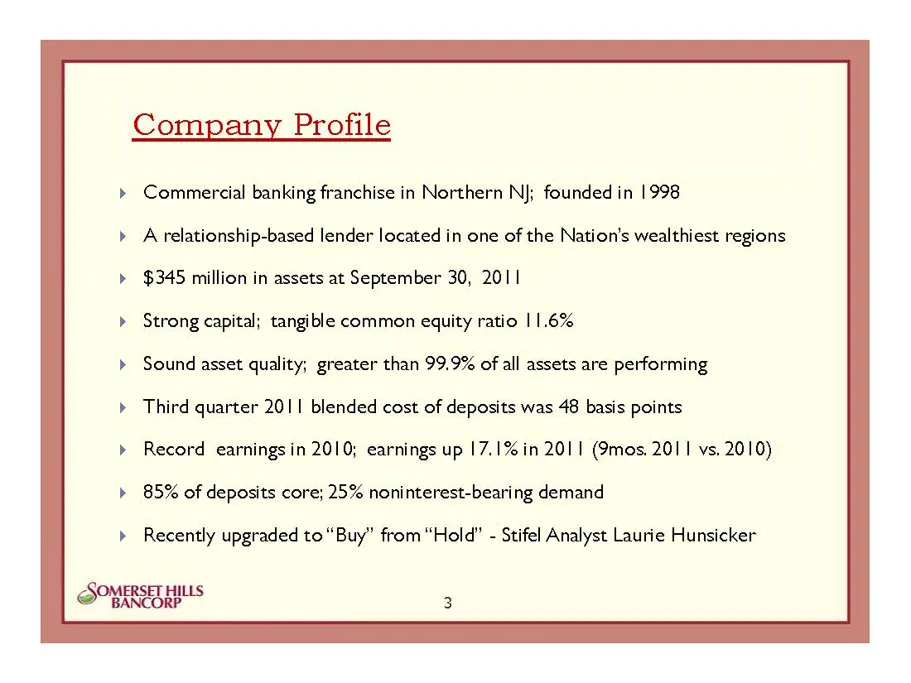
Company Profile Commercial banking franchise in Northern NJ; founded in 1998 A relationship-based lender located in one of the Nation's wealthiest regions $345 million in assets at September 30, 2011 Strong capital; tangible common equity ratio 11.6% Sound asset quality; greater than 99.9% of all as
Slide 4: Branch Network
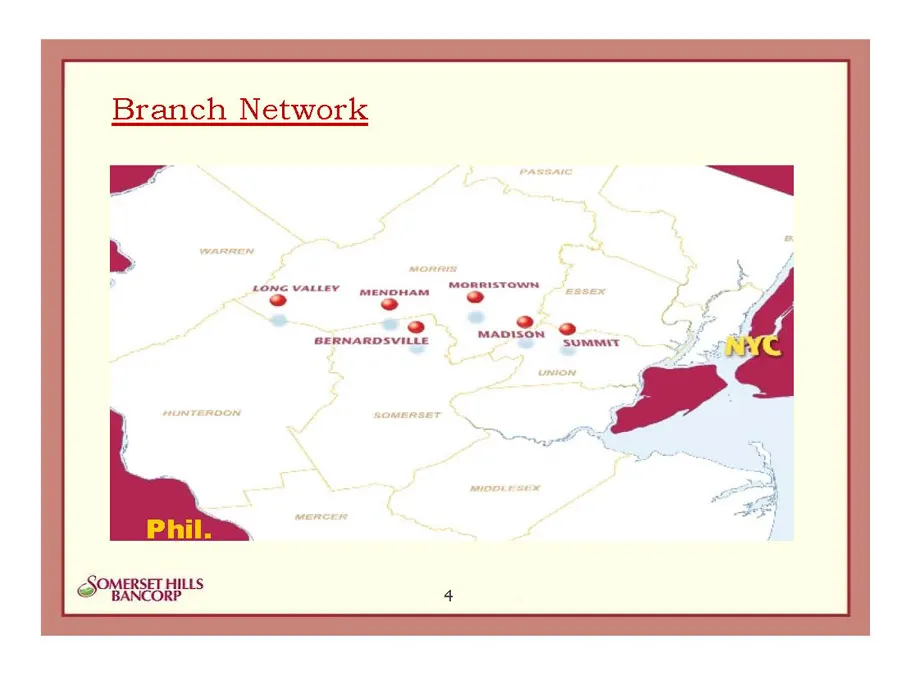
Branch Network LONG VALLEY enpu, * se BERNARDSVILLE > =
Slide 5: Valuable New Jersey Franchise
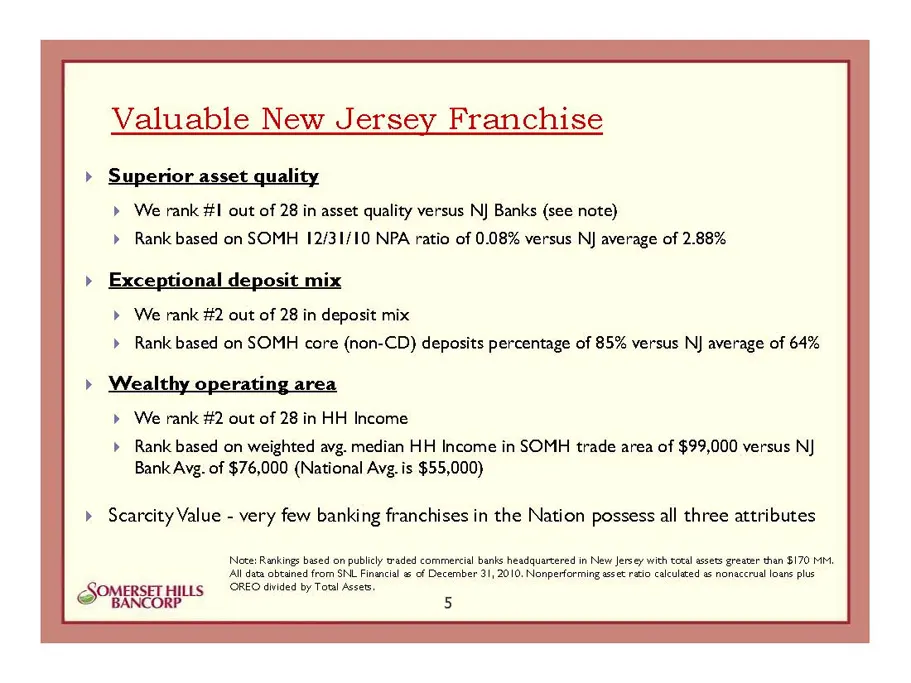
Valuable New Jersey Franchise > Superior asset quality > We rank #1 out of 28 in asset quality versus NJ Banks (see note) > Rank based on SOMH 12/31/10 NPA ratio of 0.08% versus NJ average of 2.88% ,— jswal'depoate fil > We rank #2 out of 28 in deposit mix > Rank based on SOMH core (non-CD) deposits
Slide 6: Balance Sheet Trends
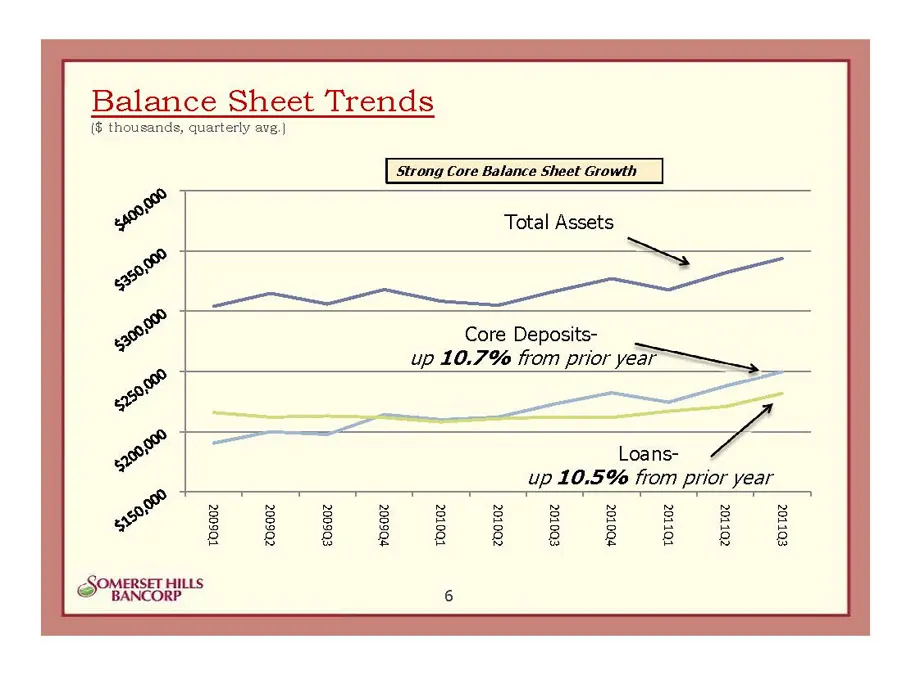
Balance Sheet Trends (S thousands, quarterly avg.) Strong Core Balance Sheet Growth Total Assets a > Core Deposits- up 10.7% from prior year ——_, ee ee — Loans- up 10.5% from prior year
Slide 7: Net Income Trend
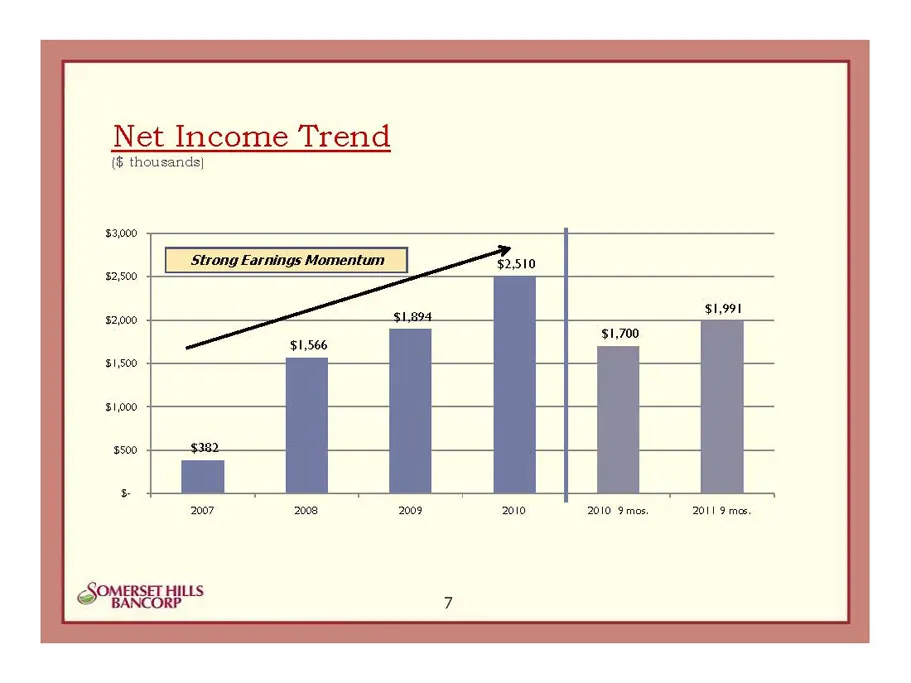
Net Income Trend (6 thousands}
Slide 8: Profitability Ratios
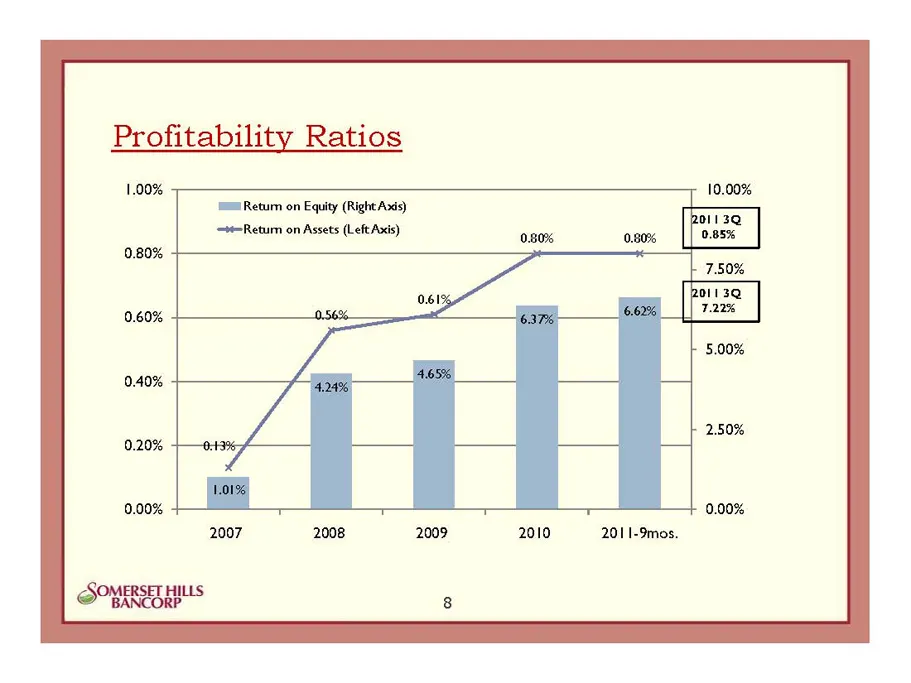
Profitability Ratios 1.00% 10.00% limi Retum on Equity (Right Axis) Ret om Assets (Left) Poasx 7.50% poll 3Q 7.22% H 5.00% 2010 2011-9mos.
Slide 9: Net Interest Income Trend
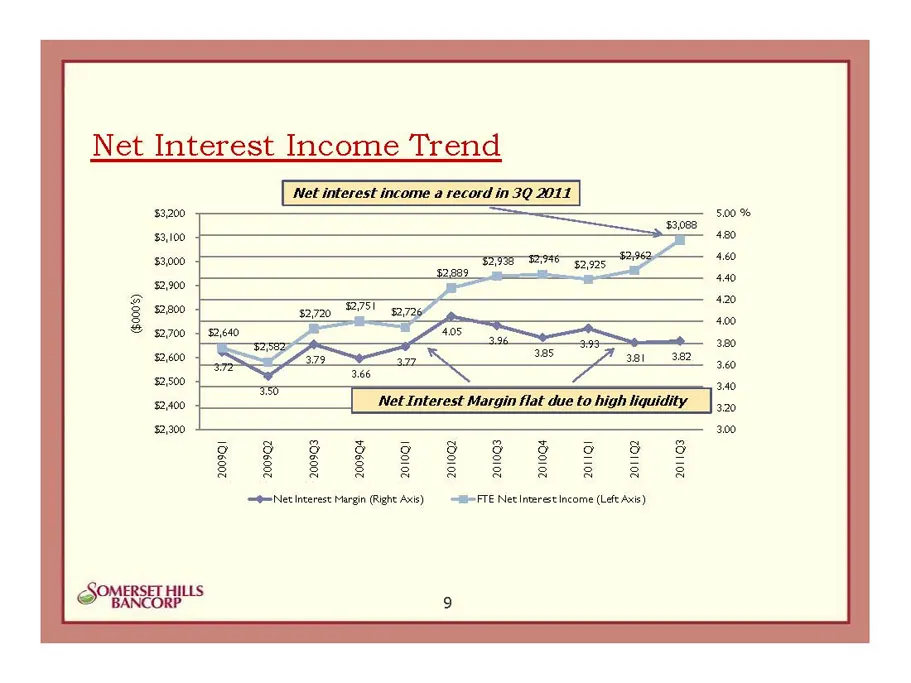
Net Interest Income Trend eoNet interest Margin (Right Axis) lSFTE Netinterestincome (Left Axis)
Slide 10: Efficiency Ratio
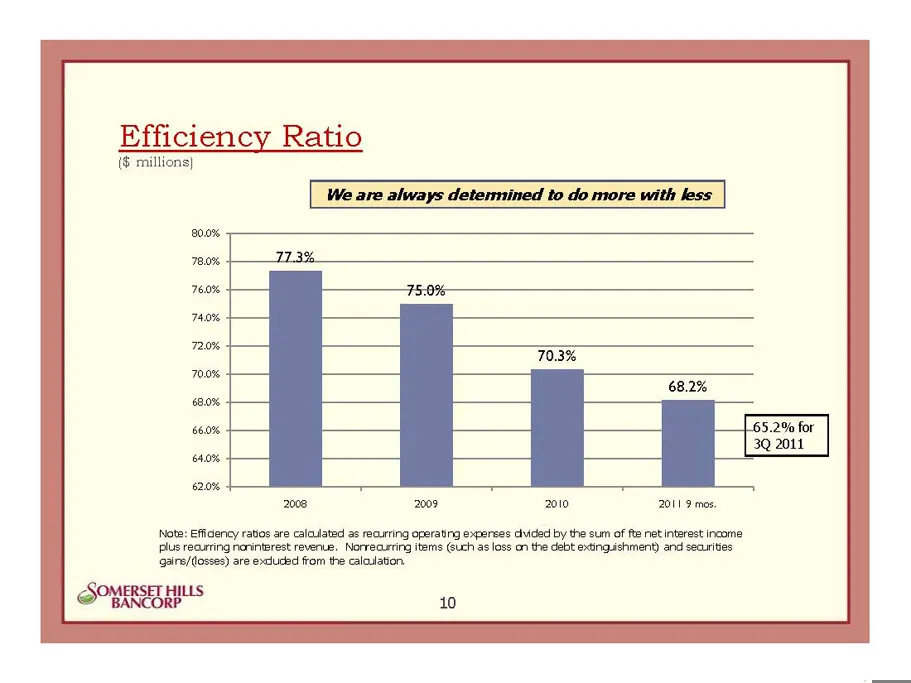
Efficiency Ratio i€ millions} 2008 2009 2010 2011 9 mos. Note: Effigency ratios are caloulated 3s recurring operating expenses divided by the sum of fte net interest income ‘plus recurring noninterest revenue, Norrecurring items (uch as loss on the debt extinguishment) and securities {gairs/((osses)
Slide 11: Capital Strength
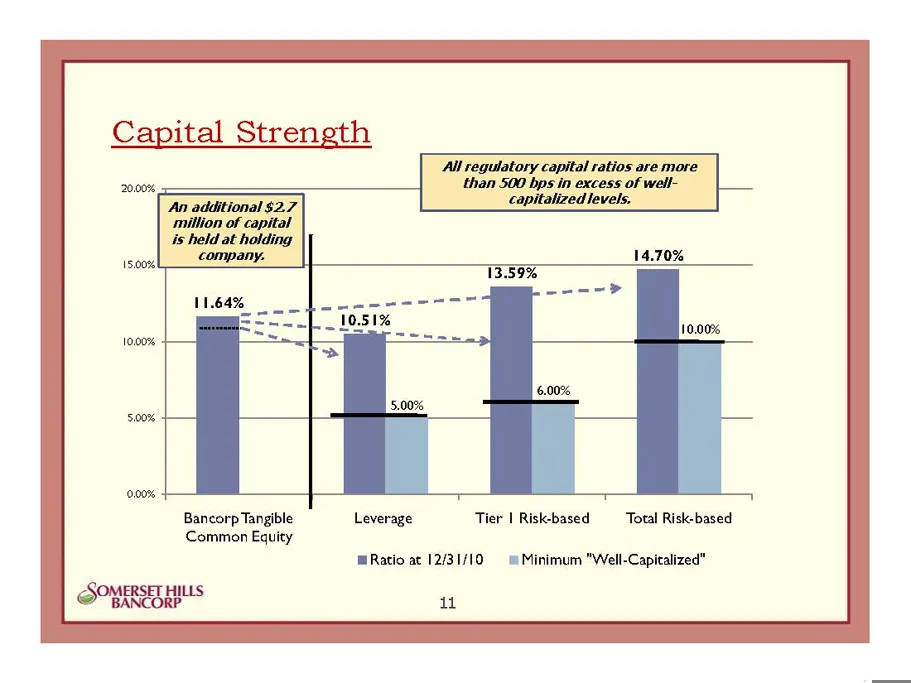
Capital Strength Bancorp Tangible Leverage Tier I Risk-based Total Risk-based Common Equity Ratio at 12/31/10 = Minimum "Well-Capitalized" SOMERSET HILLS BANCORP i
Slide 12: Credit Quality
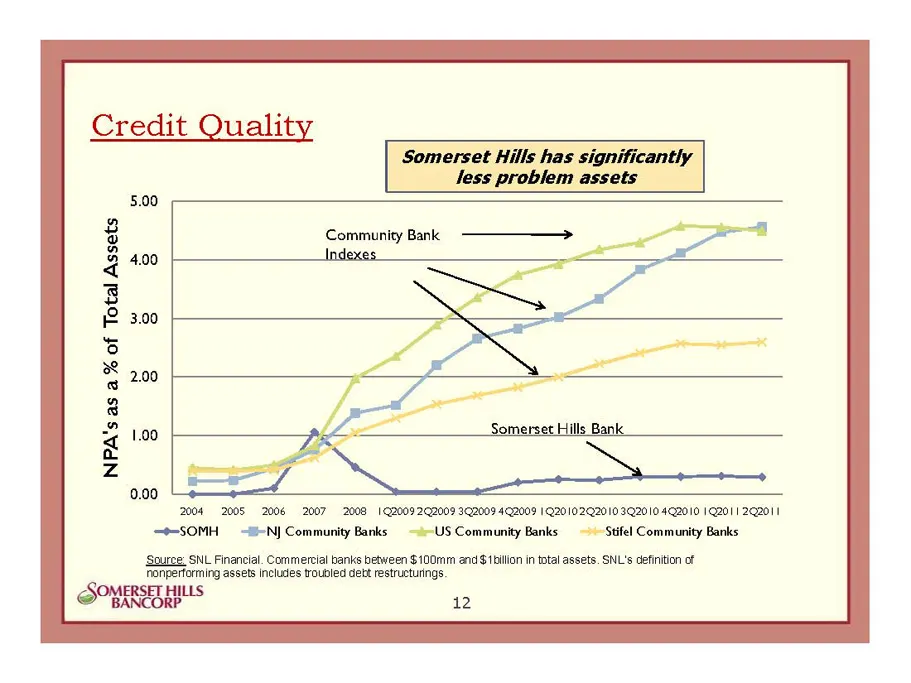
Credit Quality 4.00 1.00 Somerset Hills Bank, 8 3 4 s 2 3 ES oS 8 z 4 0.00 ‘—e 2004 2008 2006 2007 2008 19200922009 32009 442009 1201022010 3Q20 10 42010 1201 | 22011 —®-SOMH NJ Community Banks US Community Banks Stifel Community Banks: Sourve: SNL Financial. Commercial banks between $ 100mm and$ 1b
Slide 13: Asset Quality-How Do We Do It?
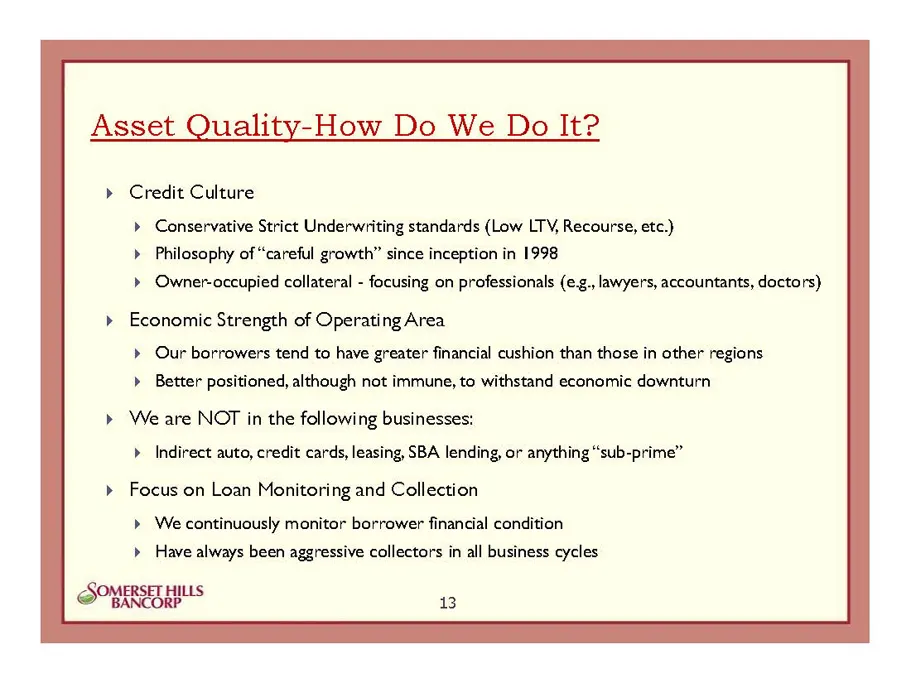
Asset Quality-How Do We Do It? > Credit Culture > Conservative Strict Underwriting standards (Low LTV, Recourse, etc.) > Philosophy of “careful growth” since inception in 1998 > Owner-occupied collateral - focusing on professionals (eg., lawyers, accountants, doctors) > Economic Strength of Operatin
Slide 14: Loan Mix
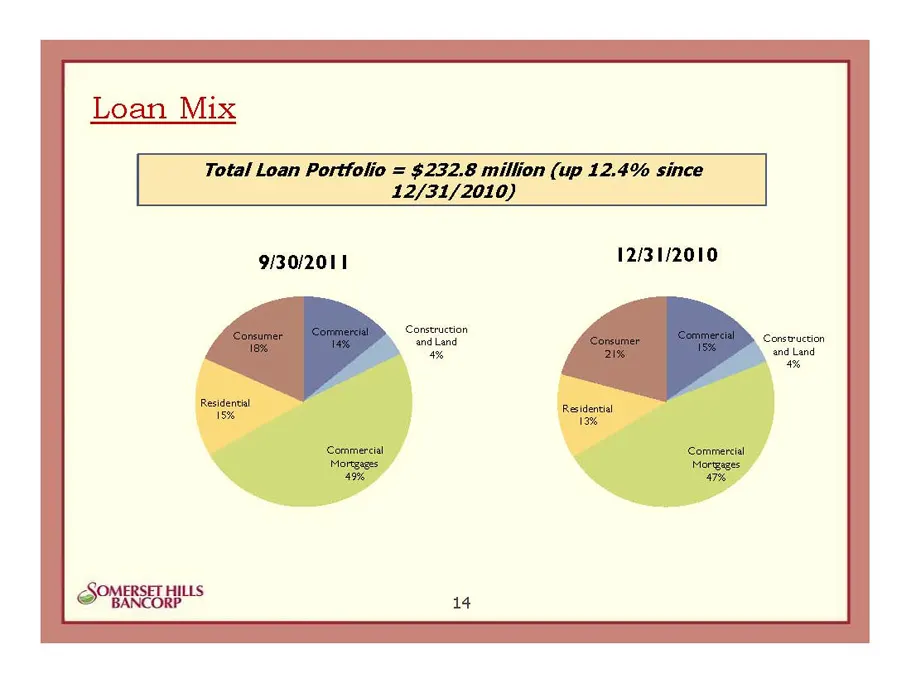
Loan Mix Total Loan Portfolio = $232.8 million (up 12.4% since 12/31/2010) 9/30/2011 12/31/2010
Slide 15: Commercial Mortgage Portfolio
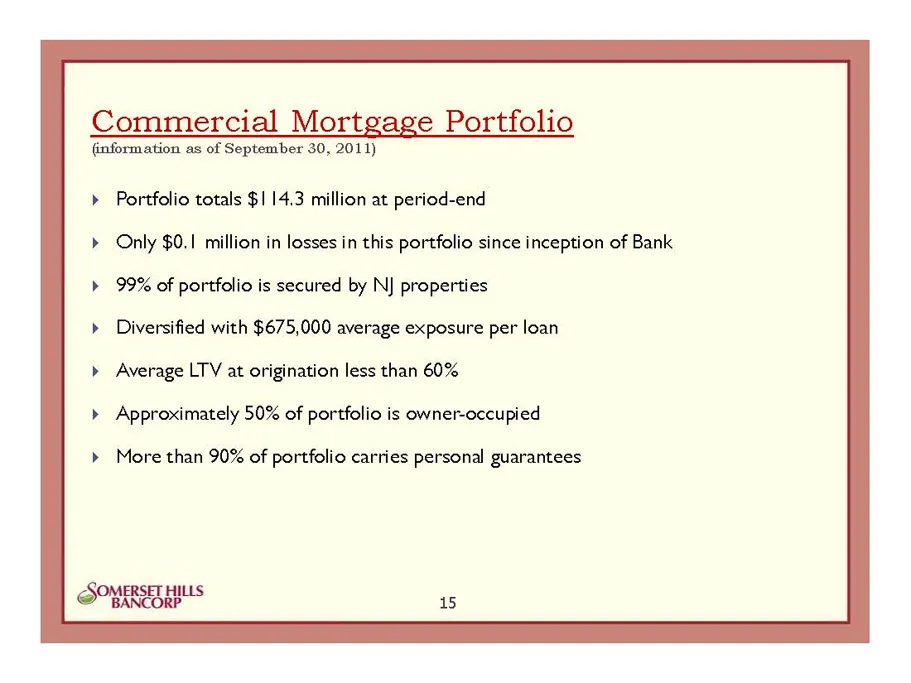
Commercial Mortgage Portfolio (information as of September 30, 2011) Portfolio totals $114.3 million at period-end Only $0.1 million in losses in this portfolio since inception of Bank 99% of portfolio is secured by NJ properties Diversified with $675,000 average exposure per loan Average LTV at ori
Slide 16: Commercial Loan Portfolio
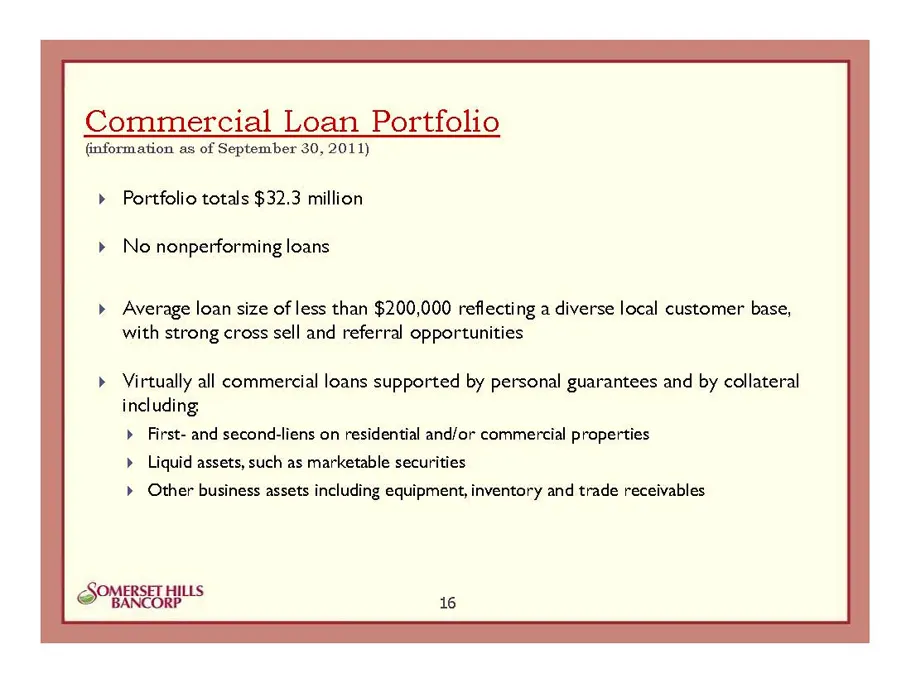
Commercial Loan Portfolio (information as of September 30, 2011) Portfolio totals $32.3 million No nonperforming loans Average loan size of less than $200,000 reflecting a diverse local customer base, with strong cross sell and referral opportunities Virtually all commercial loans supported by perso
Slide 17: Consumer Loan Portfolio
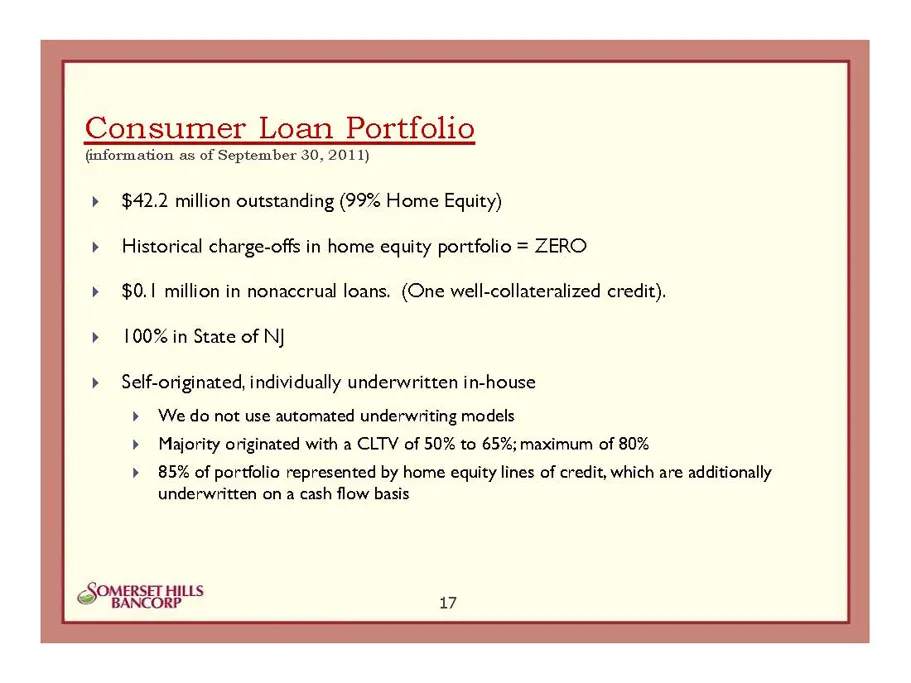
Consumer Loan Portfolio (information as of September 30, 2011) > $42.2 million outstanding (99% Home Equity) Historical charge-offs in home equity portfolio = ZERO $0.1 million in nonaccrual loans. (One well-collateralized credit). 100% in State of NJ Self-originated, individually underwritten in-ho
Slide 18: Residential Mortgage Lending
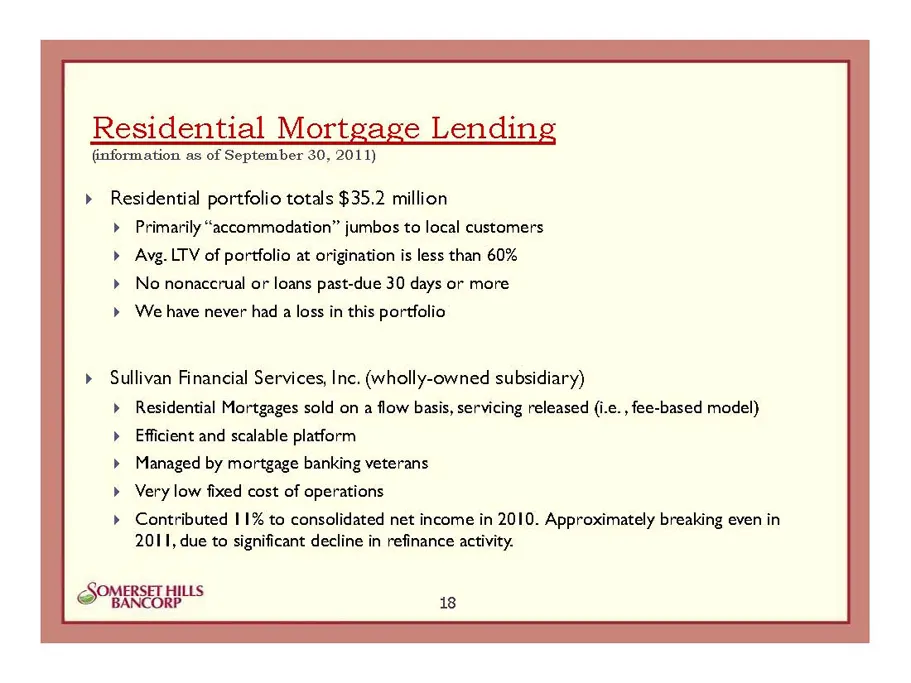
Residential Mortgage Lending (information as of September 30, 2011) > Residential portfolio totals $35.2 million Primarily “accommodation” jumbos to local customers Ayg. LTV of portfolio at origination is less than 60% No nonaccrual or loans past-due 30 days or more We have never had a loss in this
Slide 19: Investment Portfolio
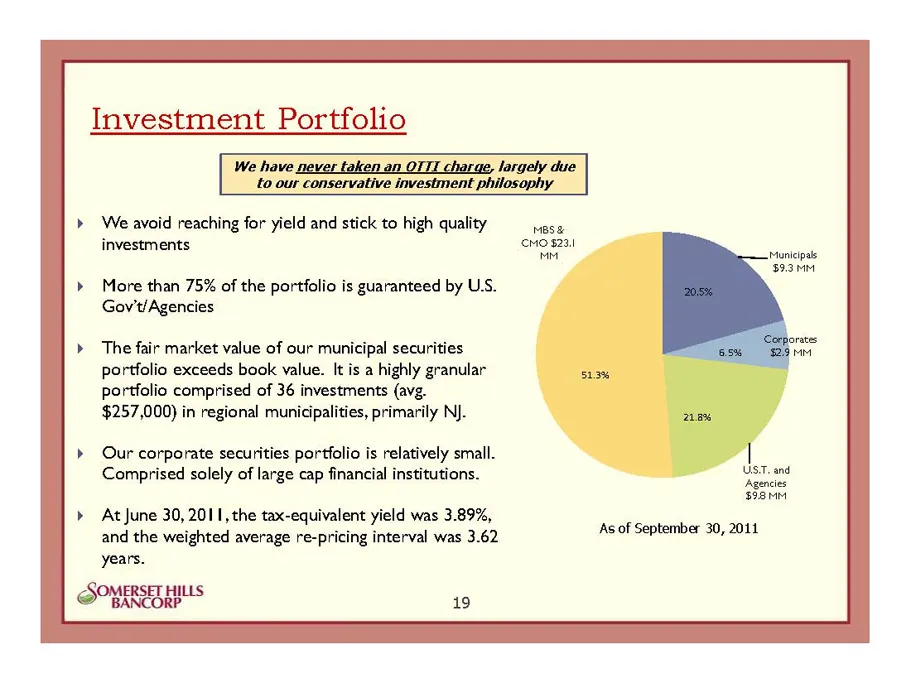
Investment Portfolio We avoid reaching for yield and stick to high quality investments More than 75% of the portfolio is guaranteed by US. Gov't/Agencies The fair market value of our municipal securities portfolio exceeds book value. It is a highly granular portfolio comprised of 36 investments (avg
Slide 20: Well-Positioned Interest Rate Risk
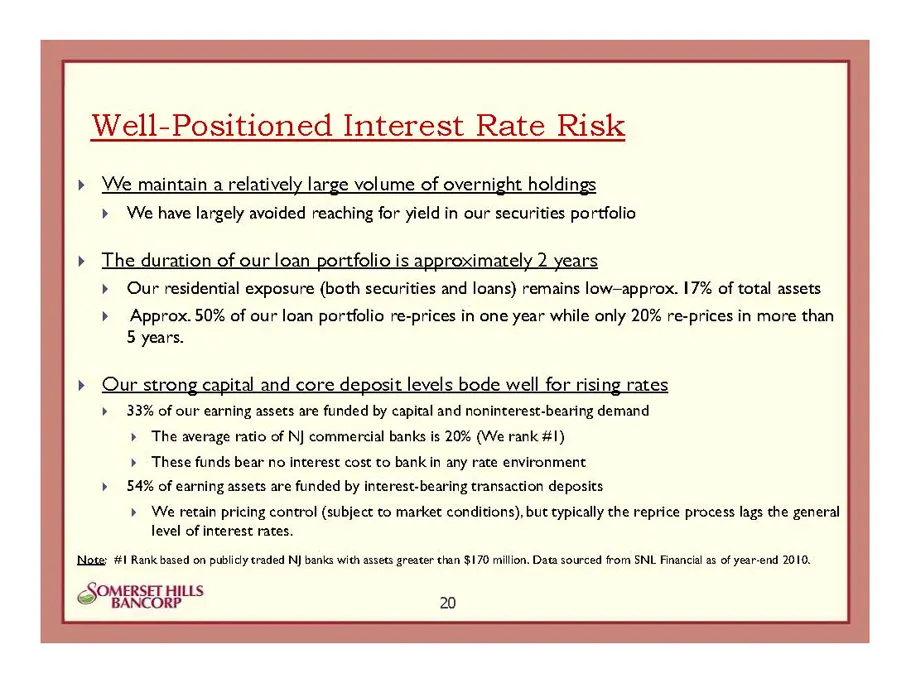
Well-Positioned Interest Rate Risk > We maintain a relatively large volume of overnight holdings > We have largely avoided reaching for yield in our securities portfolio rT oe £684 ; 2 Our residential exposure (both securities and loans) remains low-approx. 17% of total assets Approx. 50% of our loa
Slide 21: Core Deposit Funding Strategy
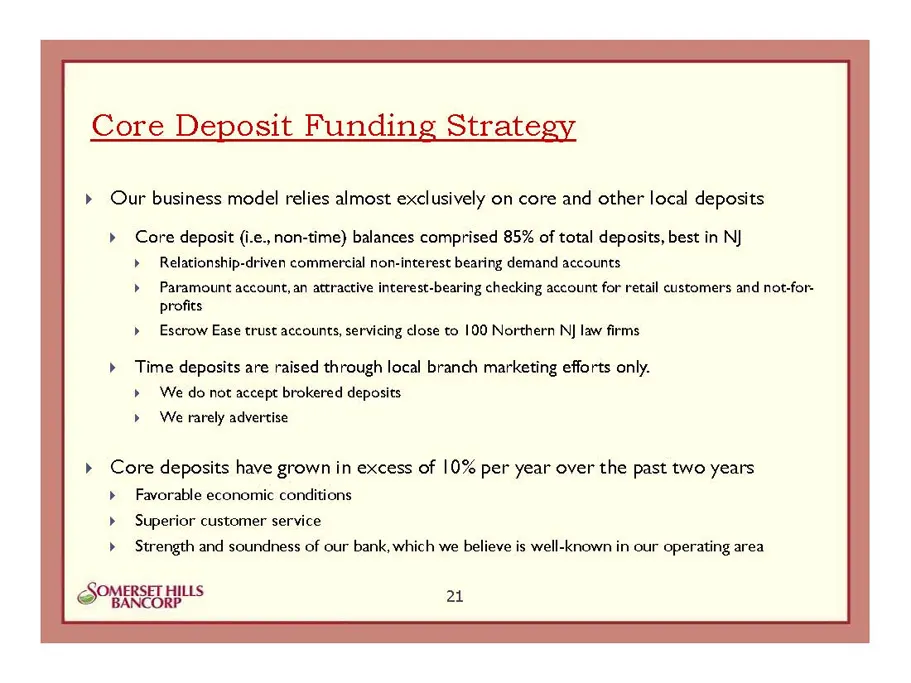
Core Deposit Funding Strategy > Our business model relies almost exclusively on core and other local deposits > Core deposit (i.e., non-time) balances comprised 85% of total deposits, best in NJ Relationship-driven commercial non-interest bearing demand accounts Paramount account, an attractive inte
Slide 22: Deposit Mix Trends
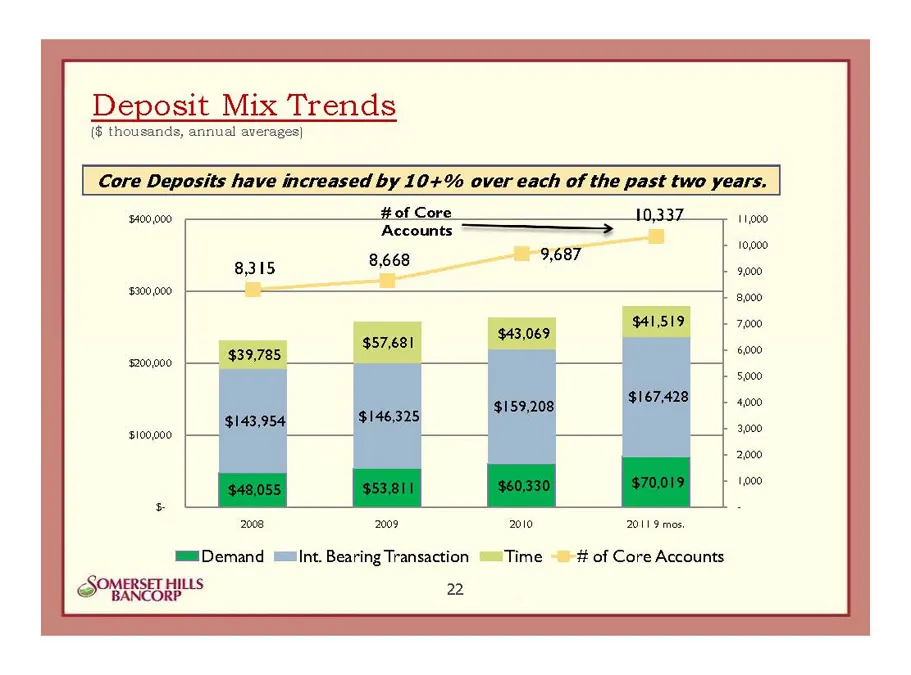
Deposit Mix Trends (§ thousands, annual averages} ae | Core Deposits have increased by 10+% over « yey #of Core Accounts > 8315 8,668 i 2008 2009 2010 20119 mes, Demand mint. Bearing Transaction Time — # of Core Accounts HILLS BANCORP a2
Slide 23: Expense Control
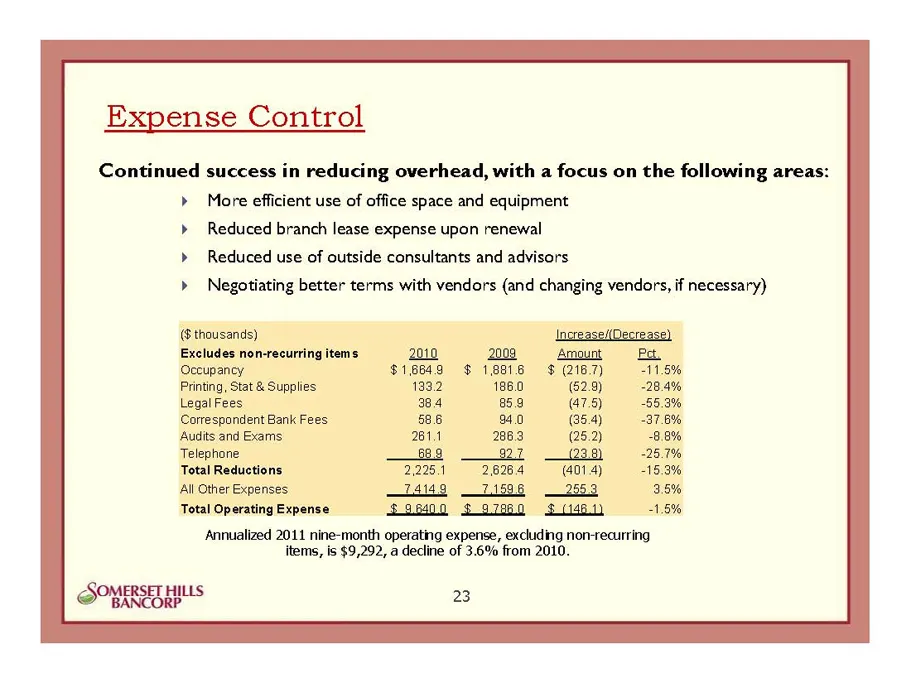
Expense Control Continued success in reducing overhead, with a focus on the following areas: More efficient use of office space and equipment Reduced branch lease expense upon renewal Reduced use of outside consultants and advisors Negotiating better terms with vendors (and changing vendors, if nece
Slide 24: Technology
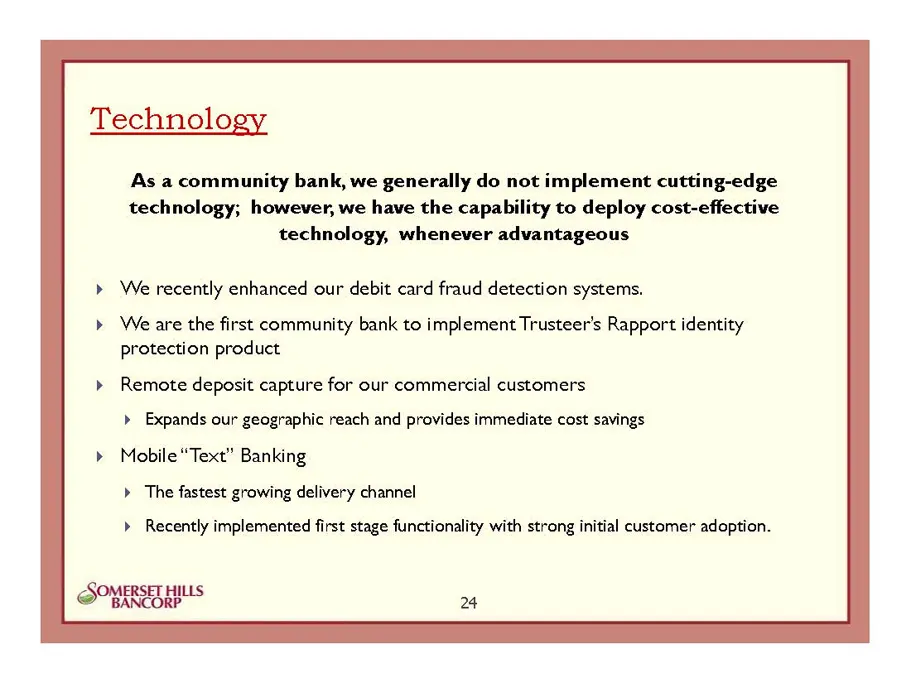
Technology As a community bank, we generally do not implement cutting-edge technology; however, we have the capability to deploy cost-effective technology, whenever advantageous We recently enhanced our debit card fraud detection systems. We are the first community bank to implement Trusteer’s Rappo
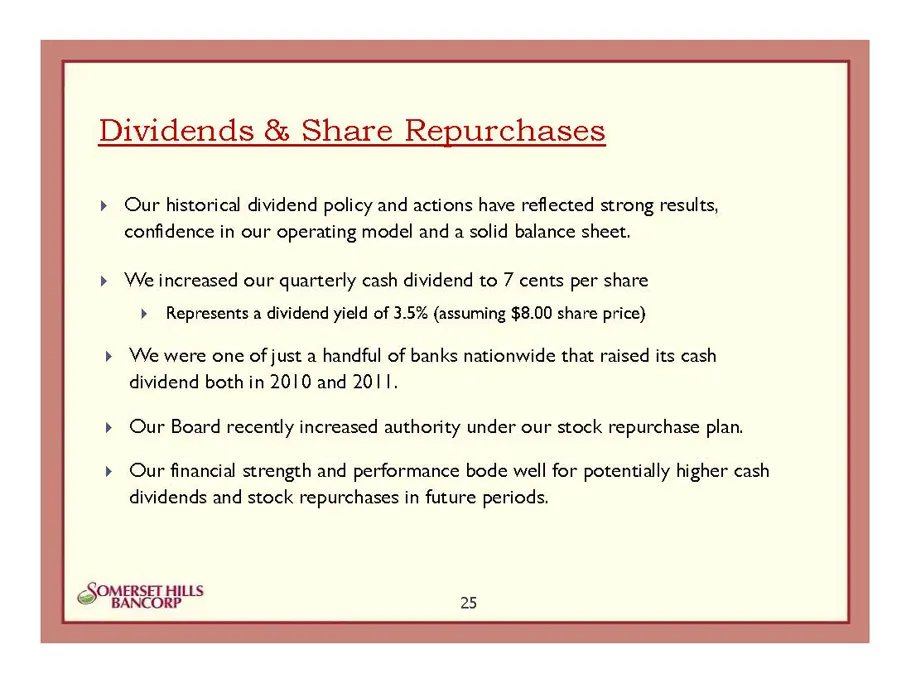
Slide 25: Dividends & Share Repurchases
Dividends & Share Repurchases Our historical dividend policy and actions have reflected strong results, confidence in our operating model and a solid balance sheet. We increased our quarterly cash dividend to 7 cents per share > Represents a dividend yield of 3.5% (assuming $8.00 share price) ‘We we
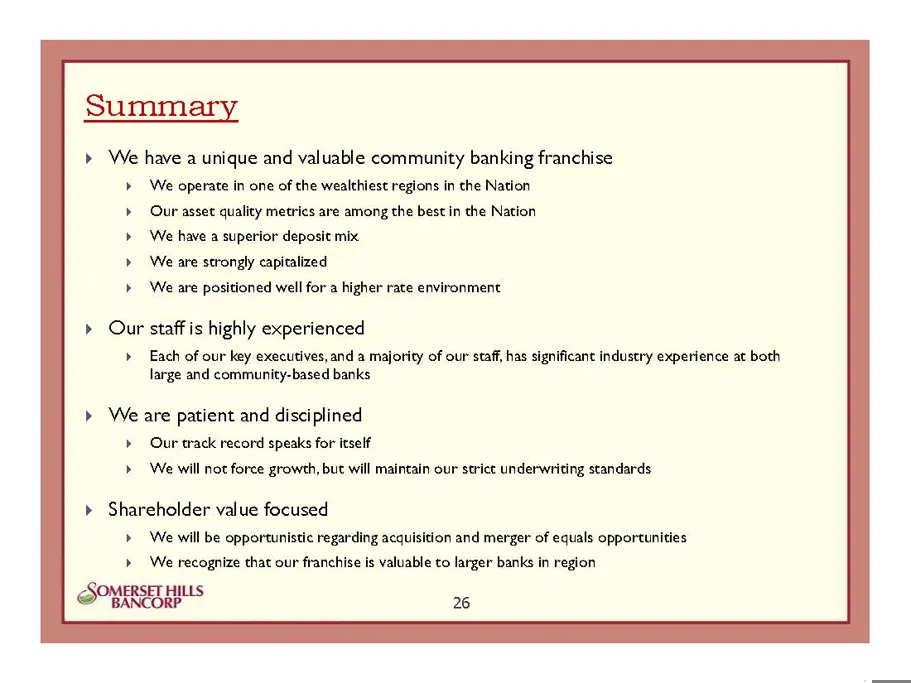
Slide 26: Summary
Summary >» We have a unique and valuable community banking franchise We operate in one of the wealthiest regions in the Nation Our asset quality metrics are among the best in the Nation We have a superior deposit mix We are strongly capitalized We are positioned well for a higher rate environment >
Source: SEC EDGAR · 8-K filed Nov 1, 2011
More decks from Somerset Hills Bancorp
 Shareholder Meeting (May 2013)10 slides · May 8, 2013
 Merger or Acquisition (February 2013)32 slides · Feb 7, 2013
 Merger or Acquisition (January 2013)13 slides · Jan 29, 2013
 Shareholder Meeting (April 2012)25 slides · Apr 19, 2012
 Shareholder Meeting (April 2011)29 slides · Apr 26, 2011
 Shareholder Meeting (April 2010)25 slides · Apr 28, 2010