Pidilite Industries Limited · NSE:PIDILITIND
Pidilite Industries — Q3 FY16 Earnings Presentation
19 slides from Pidilite Industries's earnings presentation, February 2016
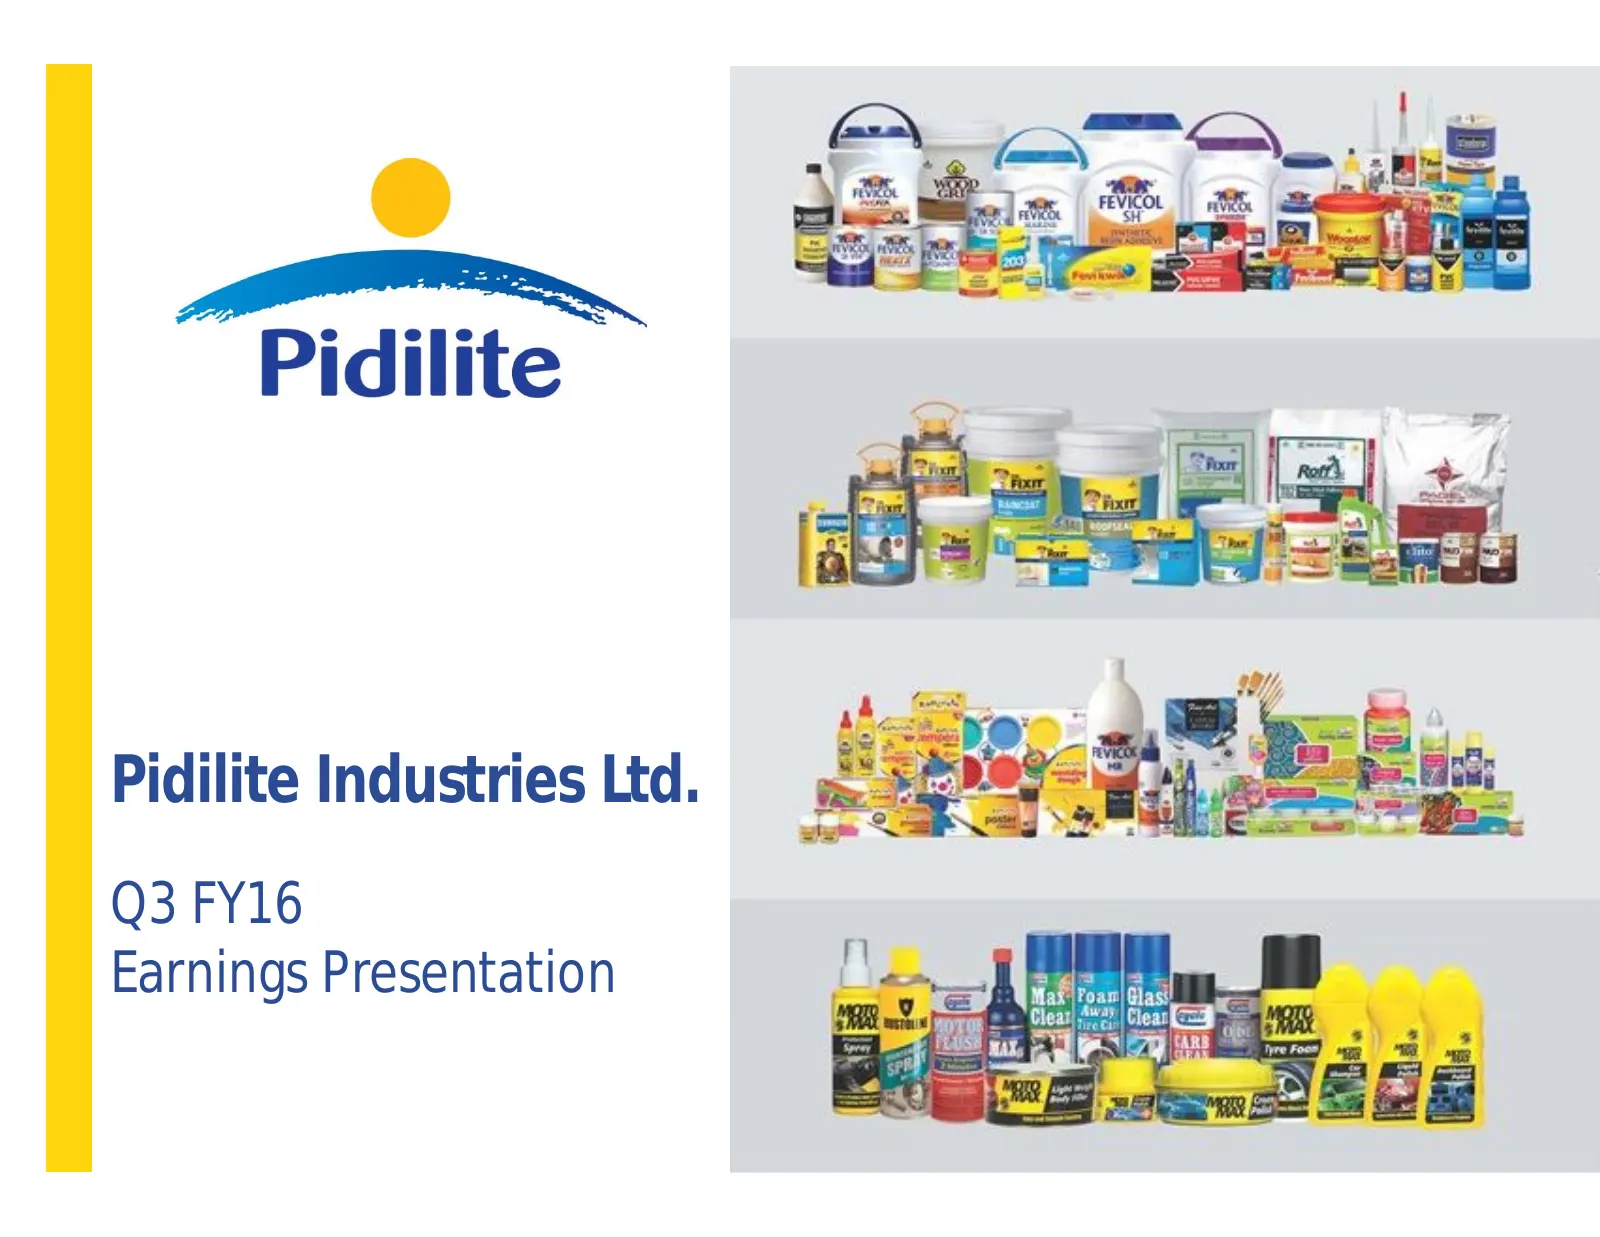
Slide 1: Pidilite Industries Ltd. Q3 FY16 Earnings Presentation
Pidilite Industries Ltd. Q3 FY16 Earnings Presentation
Slide 2: Disclaimer
Disclaimer This presentation may contain statements which reflect Management’s current views and estimates and could be construed as forward looking statements. The future involves certain risks and uncertainties that could cause actual results to differ materially from the current views being expre
Slide 3: Q3 FY16 Financial Highlights
Q3 FY16 Financial Highlights
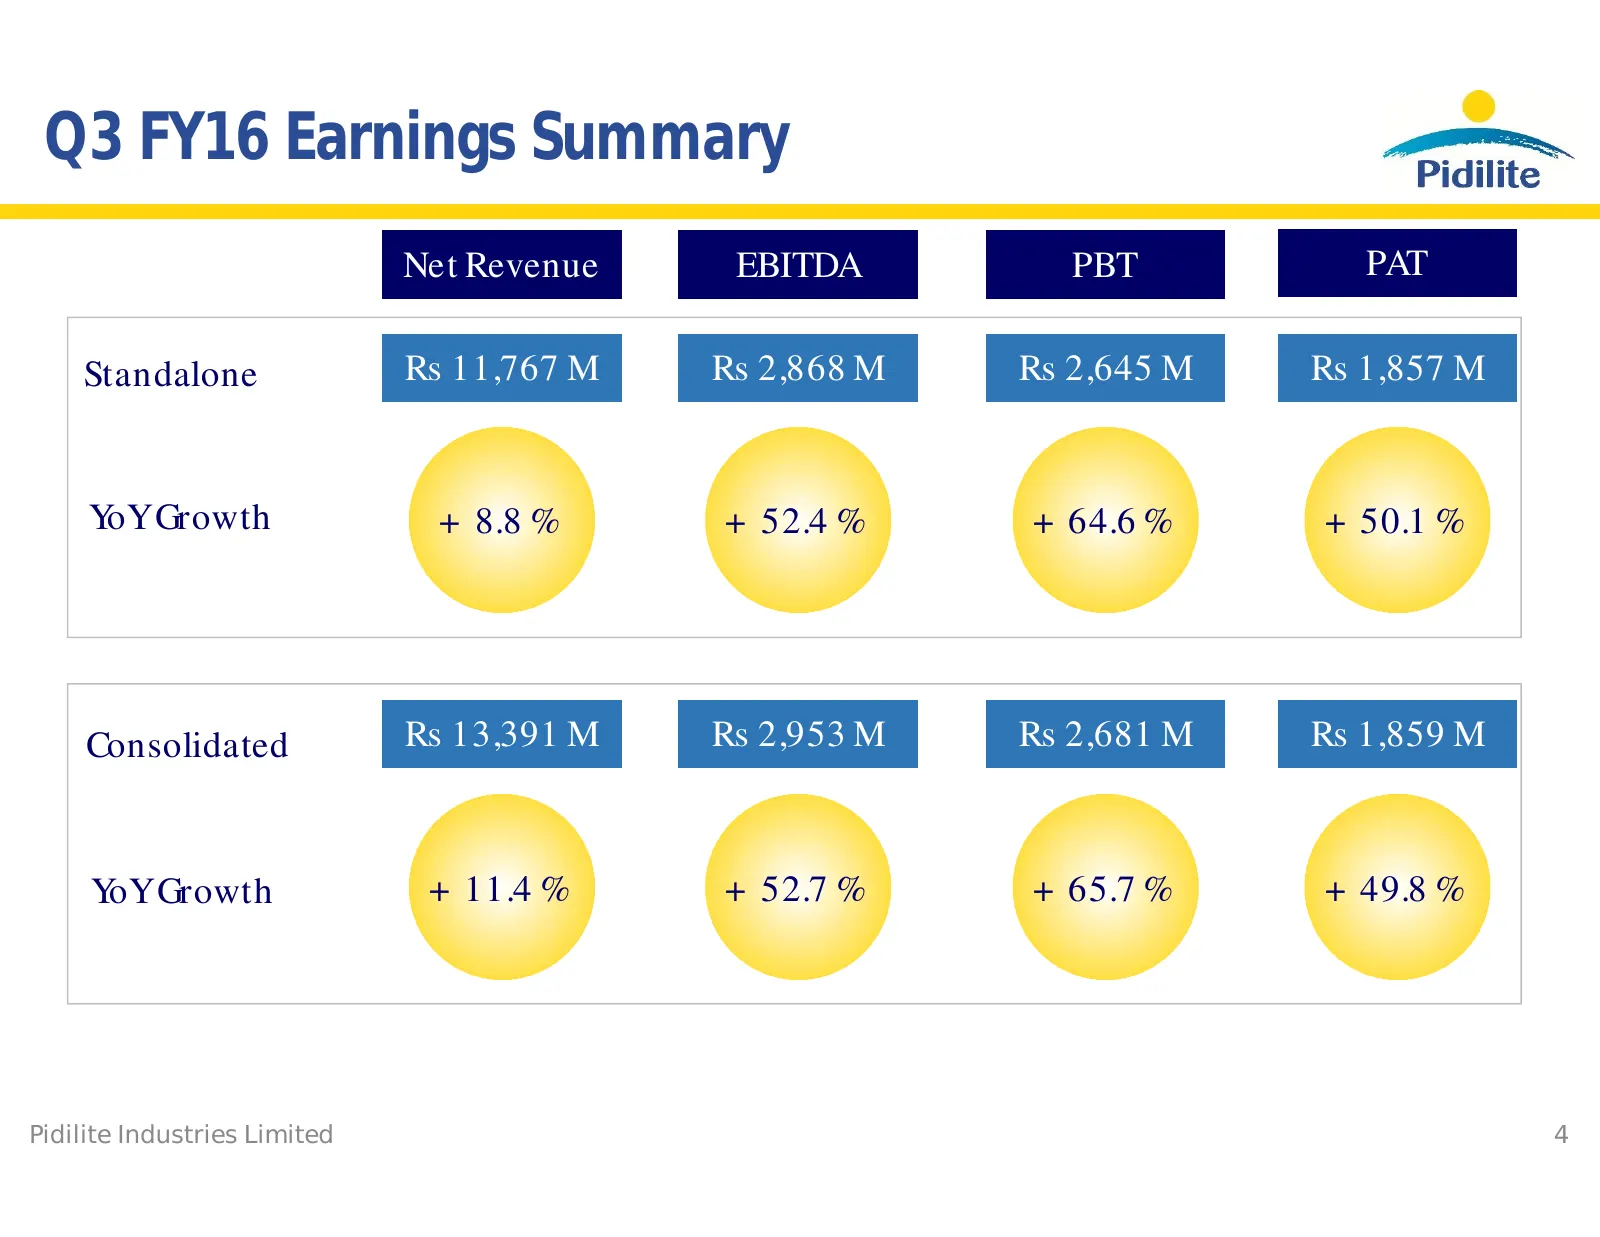
Slide 4: Q3 FY16 Earnings Summary
Q3 FY16 Earnings Summary Net Revenue EBITDA PBT PAT Standalone Rs 11,767 M Rs 2,868 M Rs 2,645 M Rs 1,857 M YoY Growth + 8.8 % + 52.4 % + 64.6 % + 50.1 % Consolidated Rs 13,391 M Rs 2,953 M Rs 2,681 M Rs 1,859 M YoY Growth + 11.4 % + 52.7 % + 65.7 % + 49.8 % Pidilite Industries Limited 4
Slide 5: YTD FY16 Earnings Summary
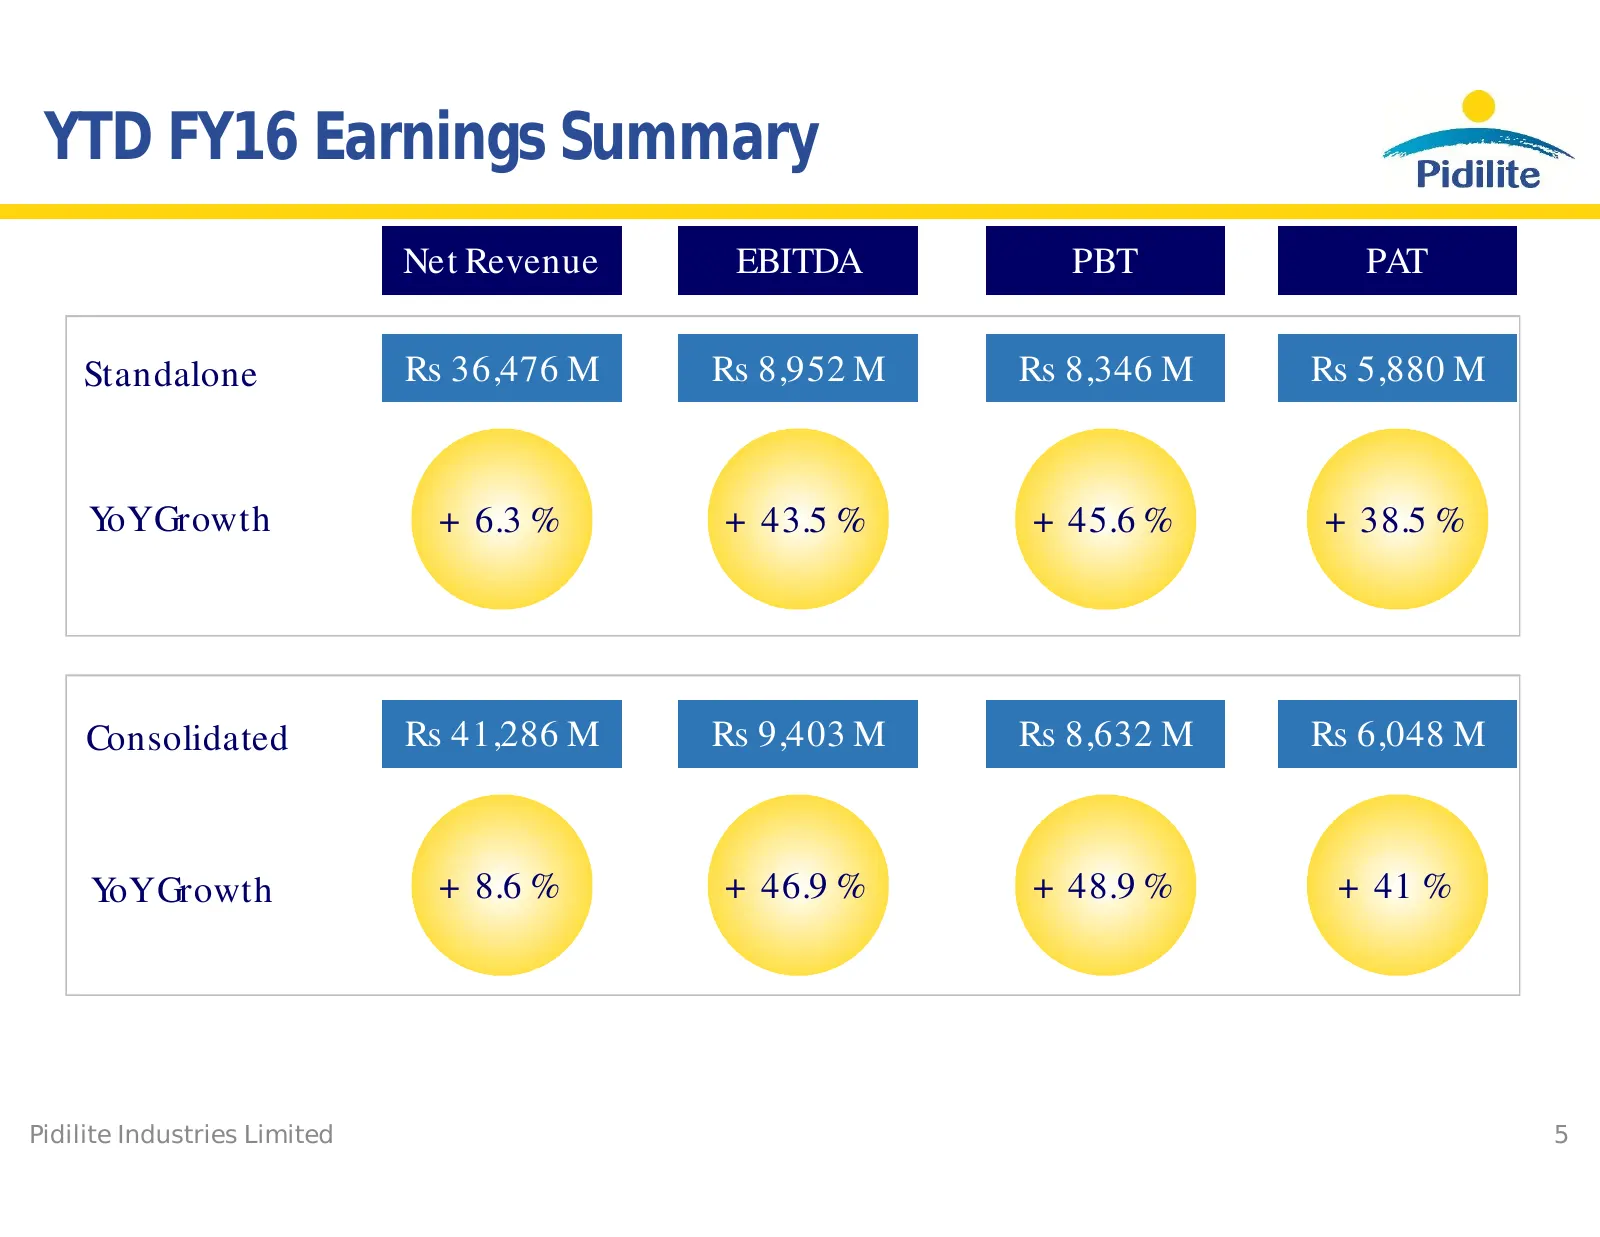
YTD FY16 Earnings Summary Net Revenue EBITDA PBT PAT Standalone Rs 36,476 M Rs 8,952 M Rs 8,346 M Rs 5,880 M YoY Growth + 6.3 % + 43.5 % + 45.6 % + 38.5 % Consolidated Rs 41,286 M Rs 9,403 M Rs 8,632 M Rs 6,048 M YoY Growth + 8.6 % + 46.9 % + 48.9 % + 41 % Pidilite Industries Limited 5
Slide 6: Comments on Financial Performance
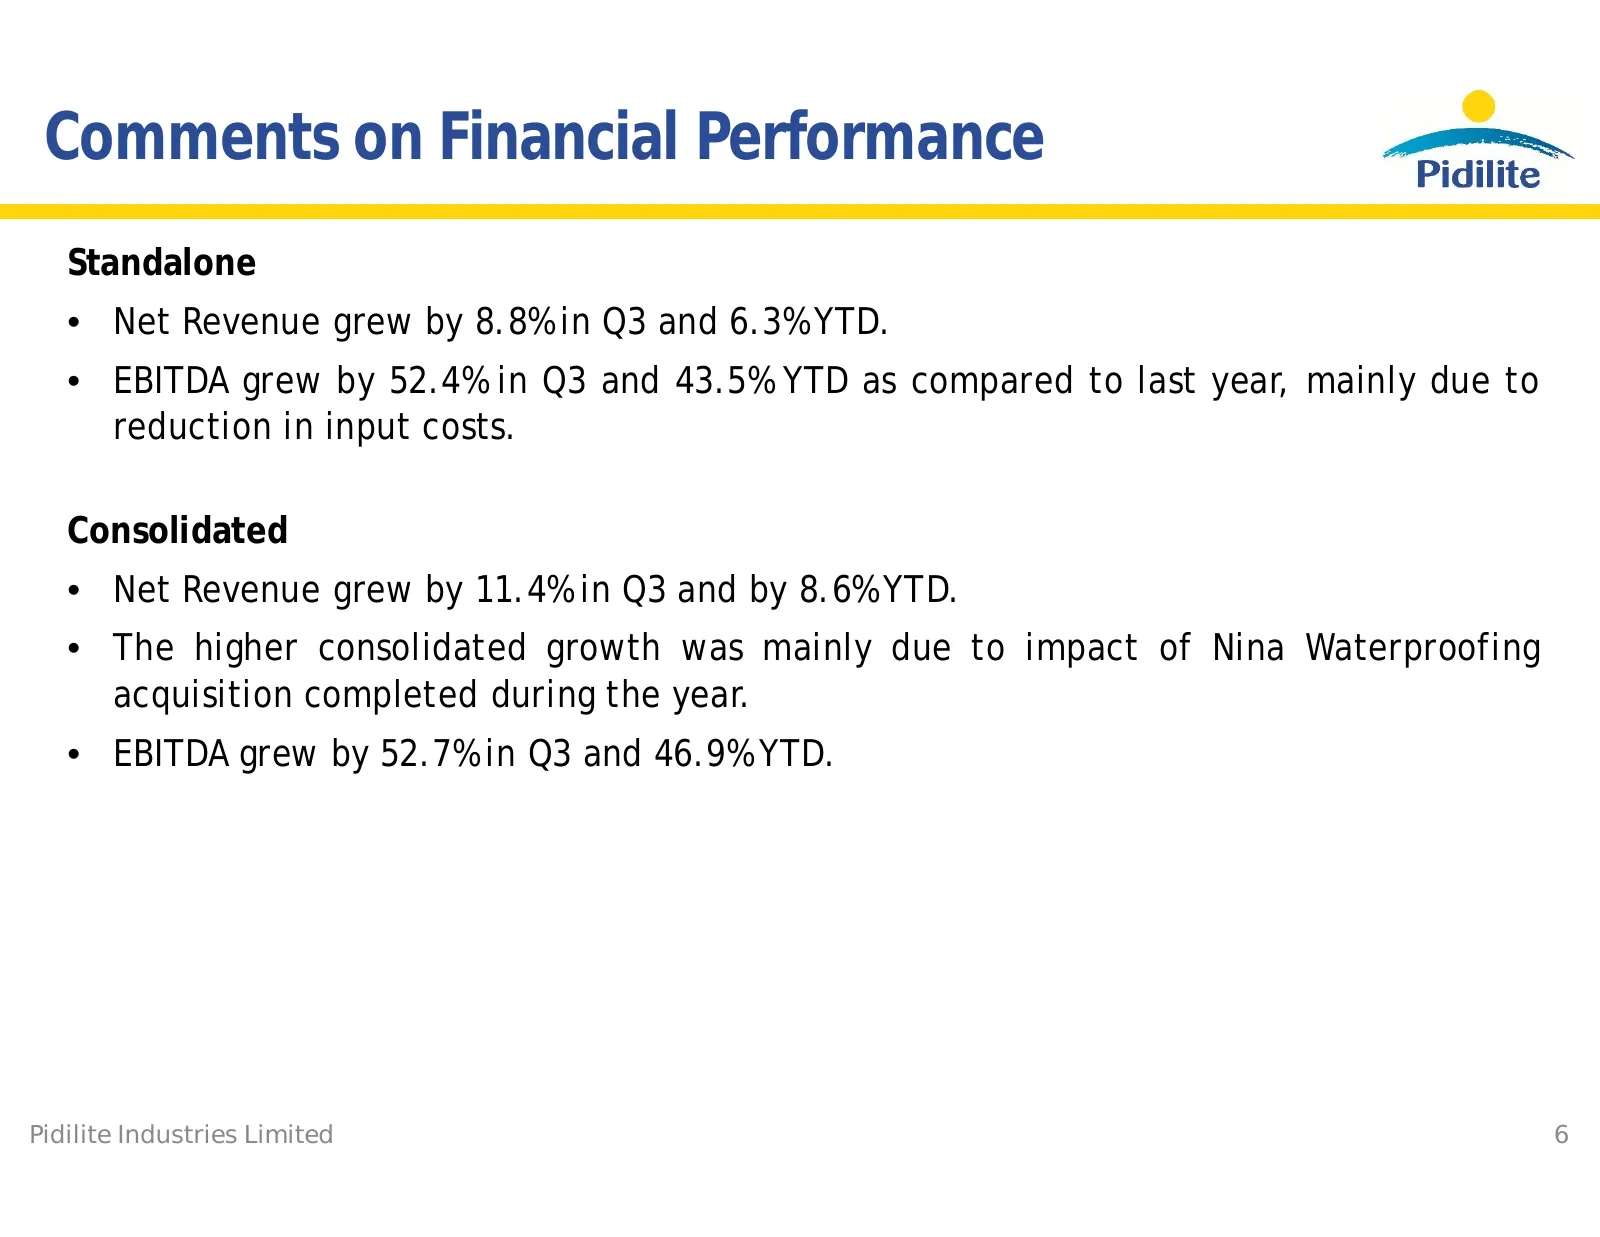
Comments on Financial Performance Standalone • Net Revenue grew by 8.8% in Q3 and 6.3% YTD. • EBITDA grew by 52.4% in Q3 and 43.5% YTD as compared to last year, mainly due to reduction in input costs. Consolidated • Net Revenue grew by 11.4% in Q3 and by 8.6% YTD. • The higher consolidated growth wa
Slide 7: Q3 FY16 Overseas Performance
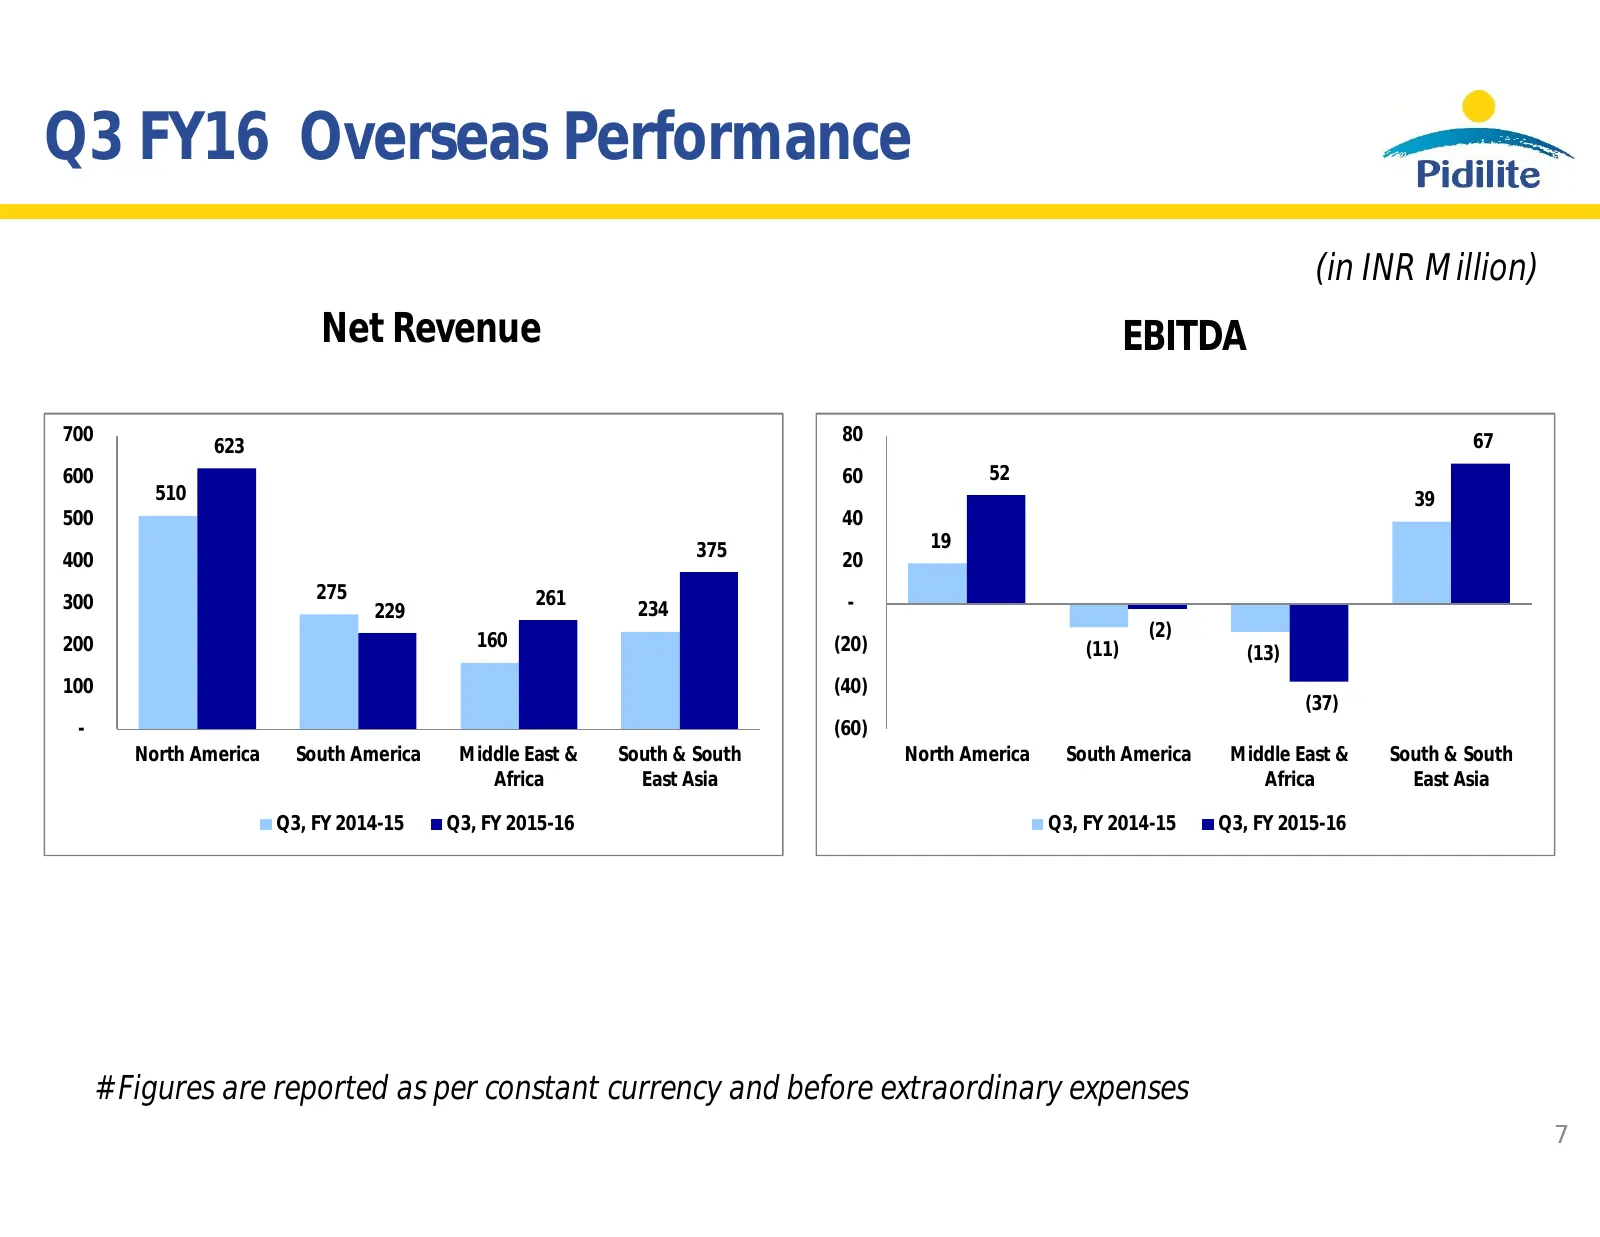
Q3 FY16 Overseas Performance (in INR Million) Net Revenue EBITDA 700 80 67 623 600 60 52 510 39 500 40 375 19 400 20 275 261 300 229 234 - 160 (2) 200 (20) (11) (13) Rs. 1377.5 M 100 (40) (37) - (60) North America South America Middle East & South & South North America South America Middle East & So
Slide 8: YTD FY16 Overseas Performance
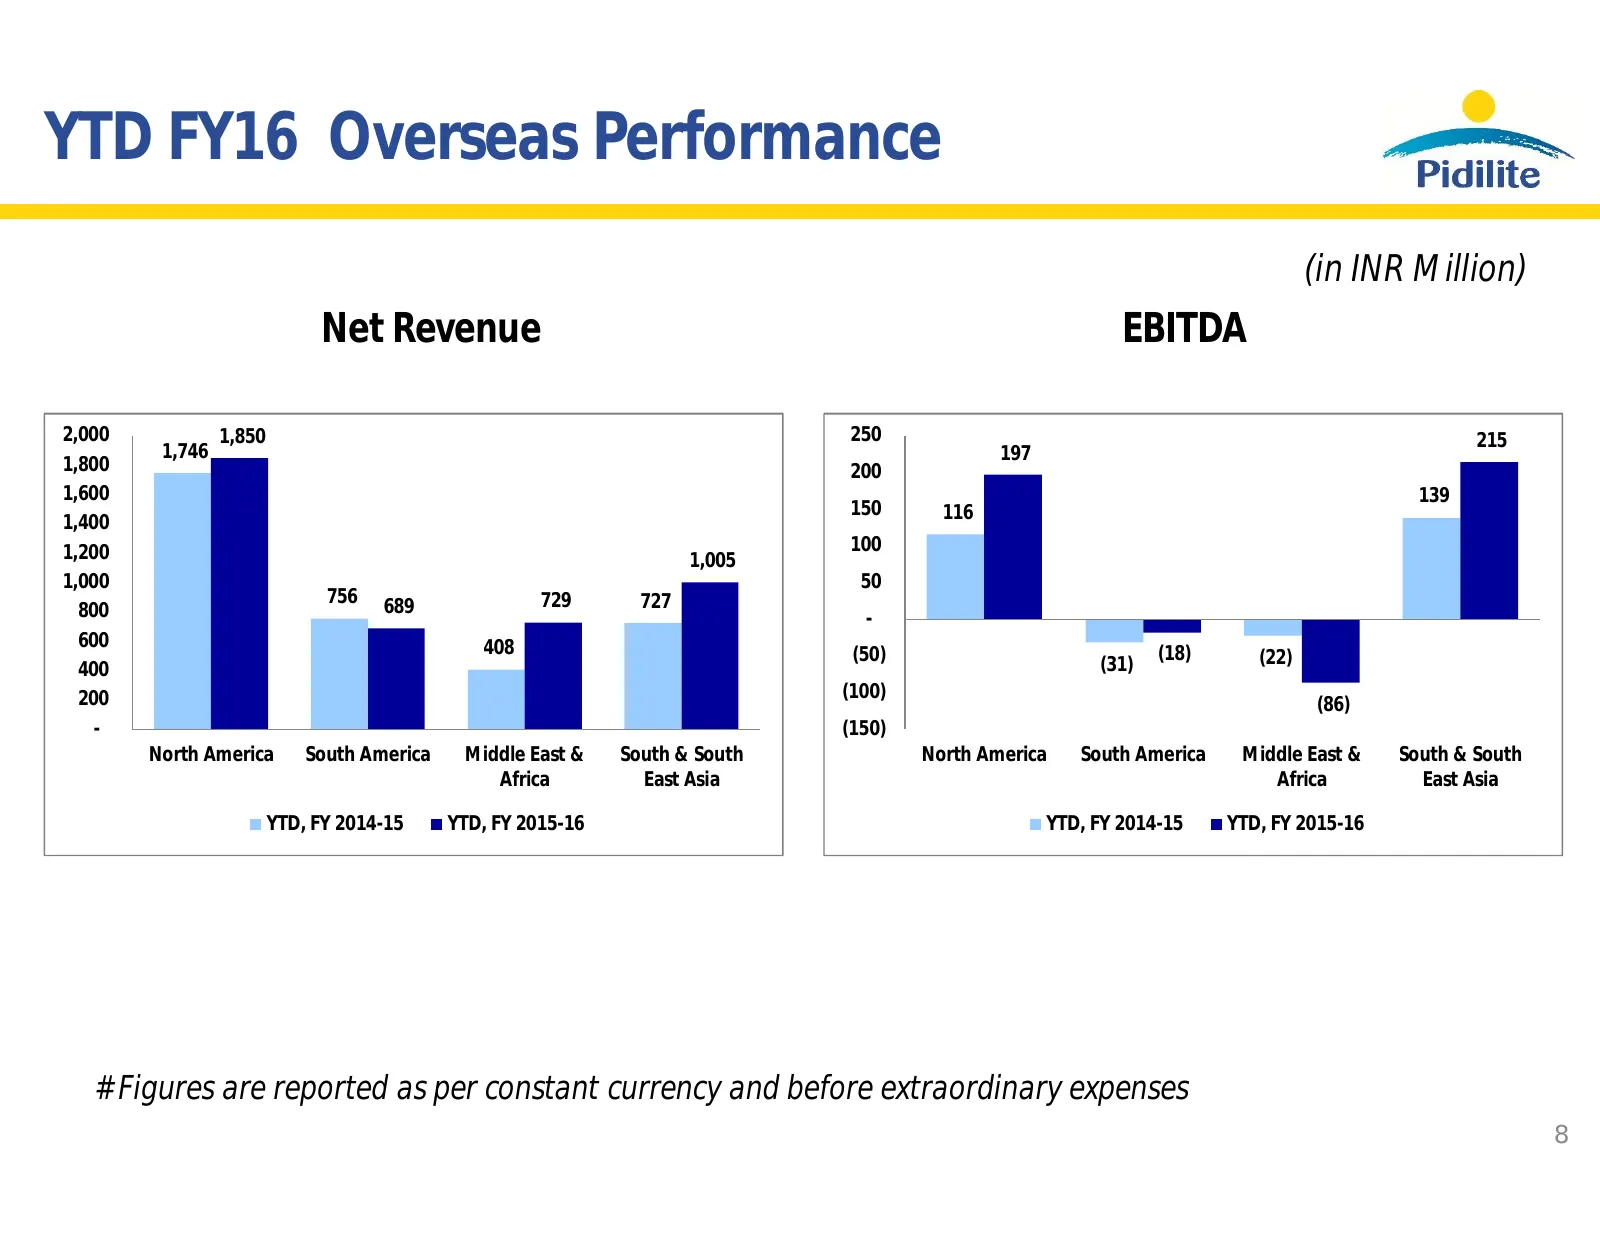
YTD FY16 Overseas Performance (in INR Million) Net Revenue EBITDA 2,000 1,850 250 215 1,746 197 1,800 200 1,600 139 150 116 1,400 1,200 100 1,005 1,000 50 756 689 729 727 800 - 600 408 (50) (31) (18) (22) 400 200 (100) (86) - (150) North America South America Middle East & South & South North Americ
Slide 9: Q3 FY16 Company Overview
Oo O3 FYI Pidilite Company Overview Be Fevikwi® Fevicryl’ rangeela” Roff THE ULTIMATE ADHESIVE steelorip|® MOY m-seaL Gycio. Sune PROTECTION
Slide 10: Company Overview
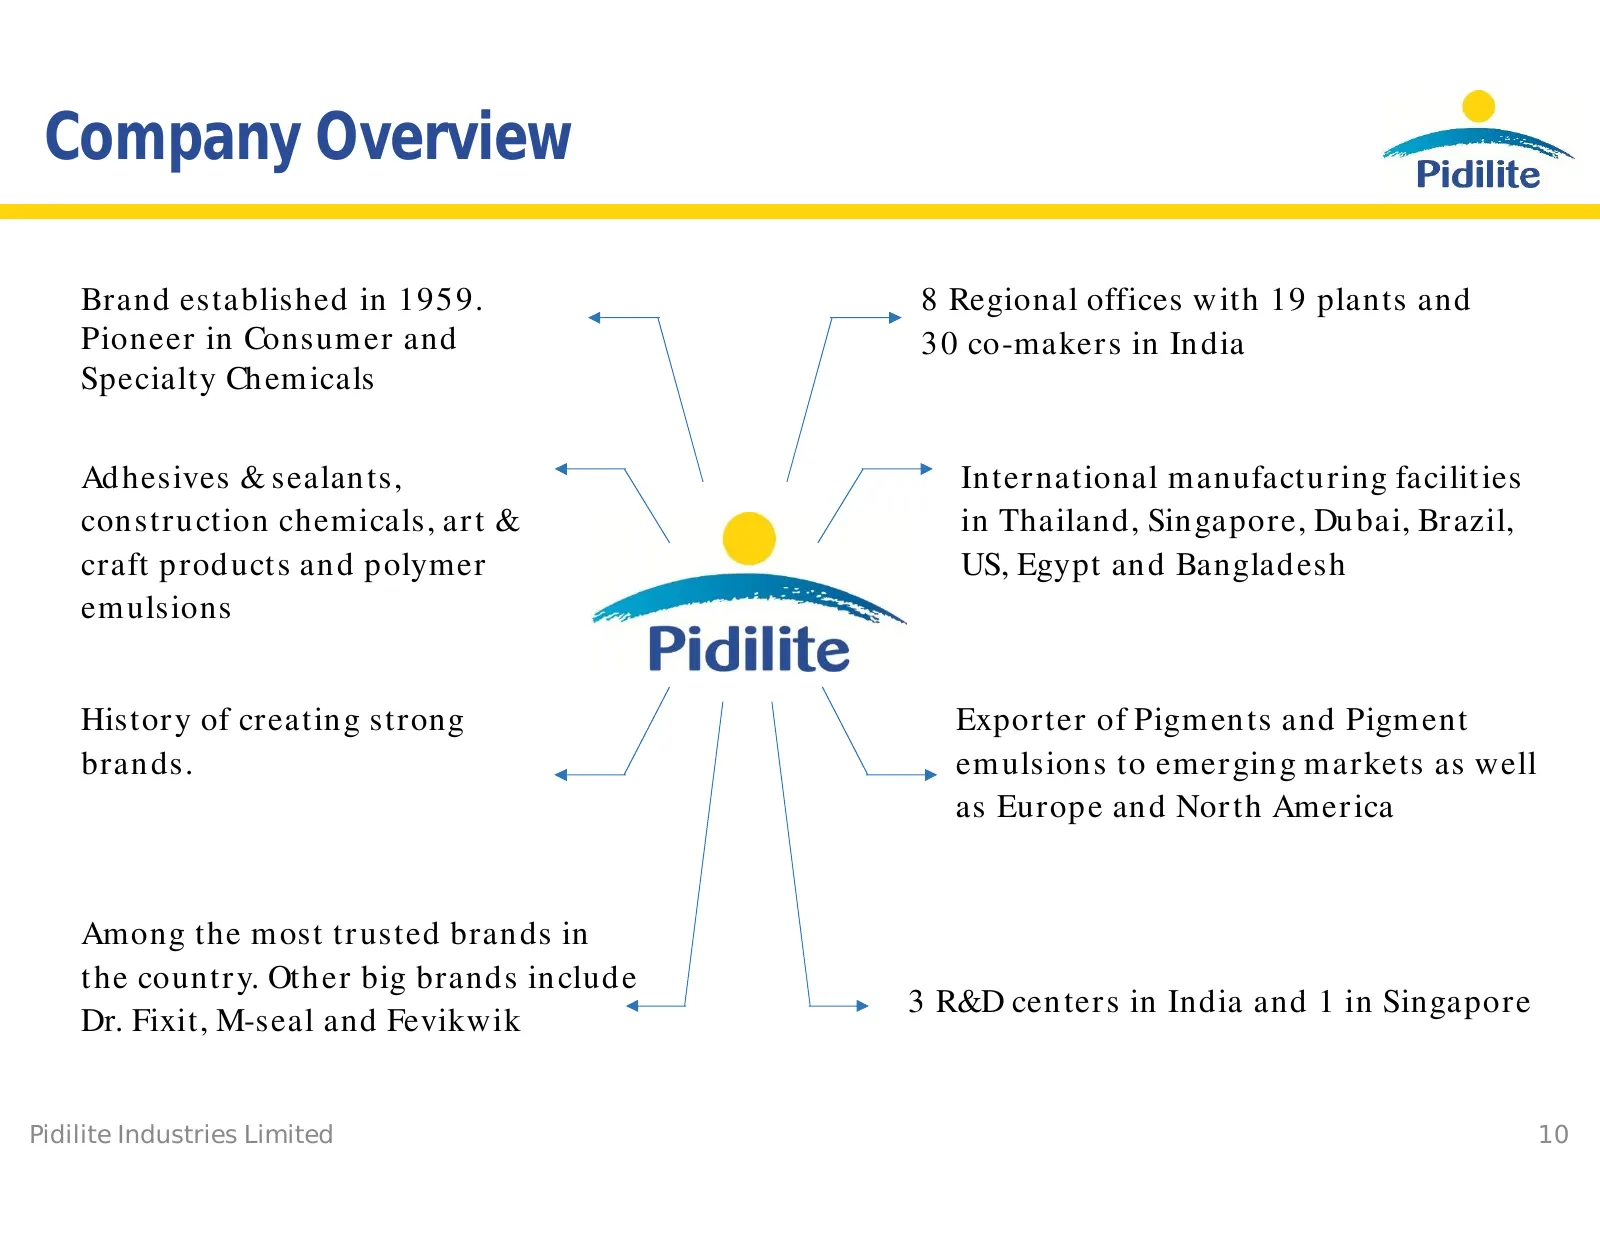
Company Overview Brand established in 1959. 8 Regional offices with 19 plants and Pioneer in Consumer and 30 co-makers in India Specialty Chemicals Adhesives & sealants, International manufacturing facilities construction chemicals, art & in Thailand, Singapore, Dubai, Brazil, craft products and pol
Slide 11: Industry Segment Composition as on March 2015
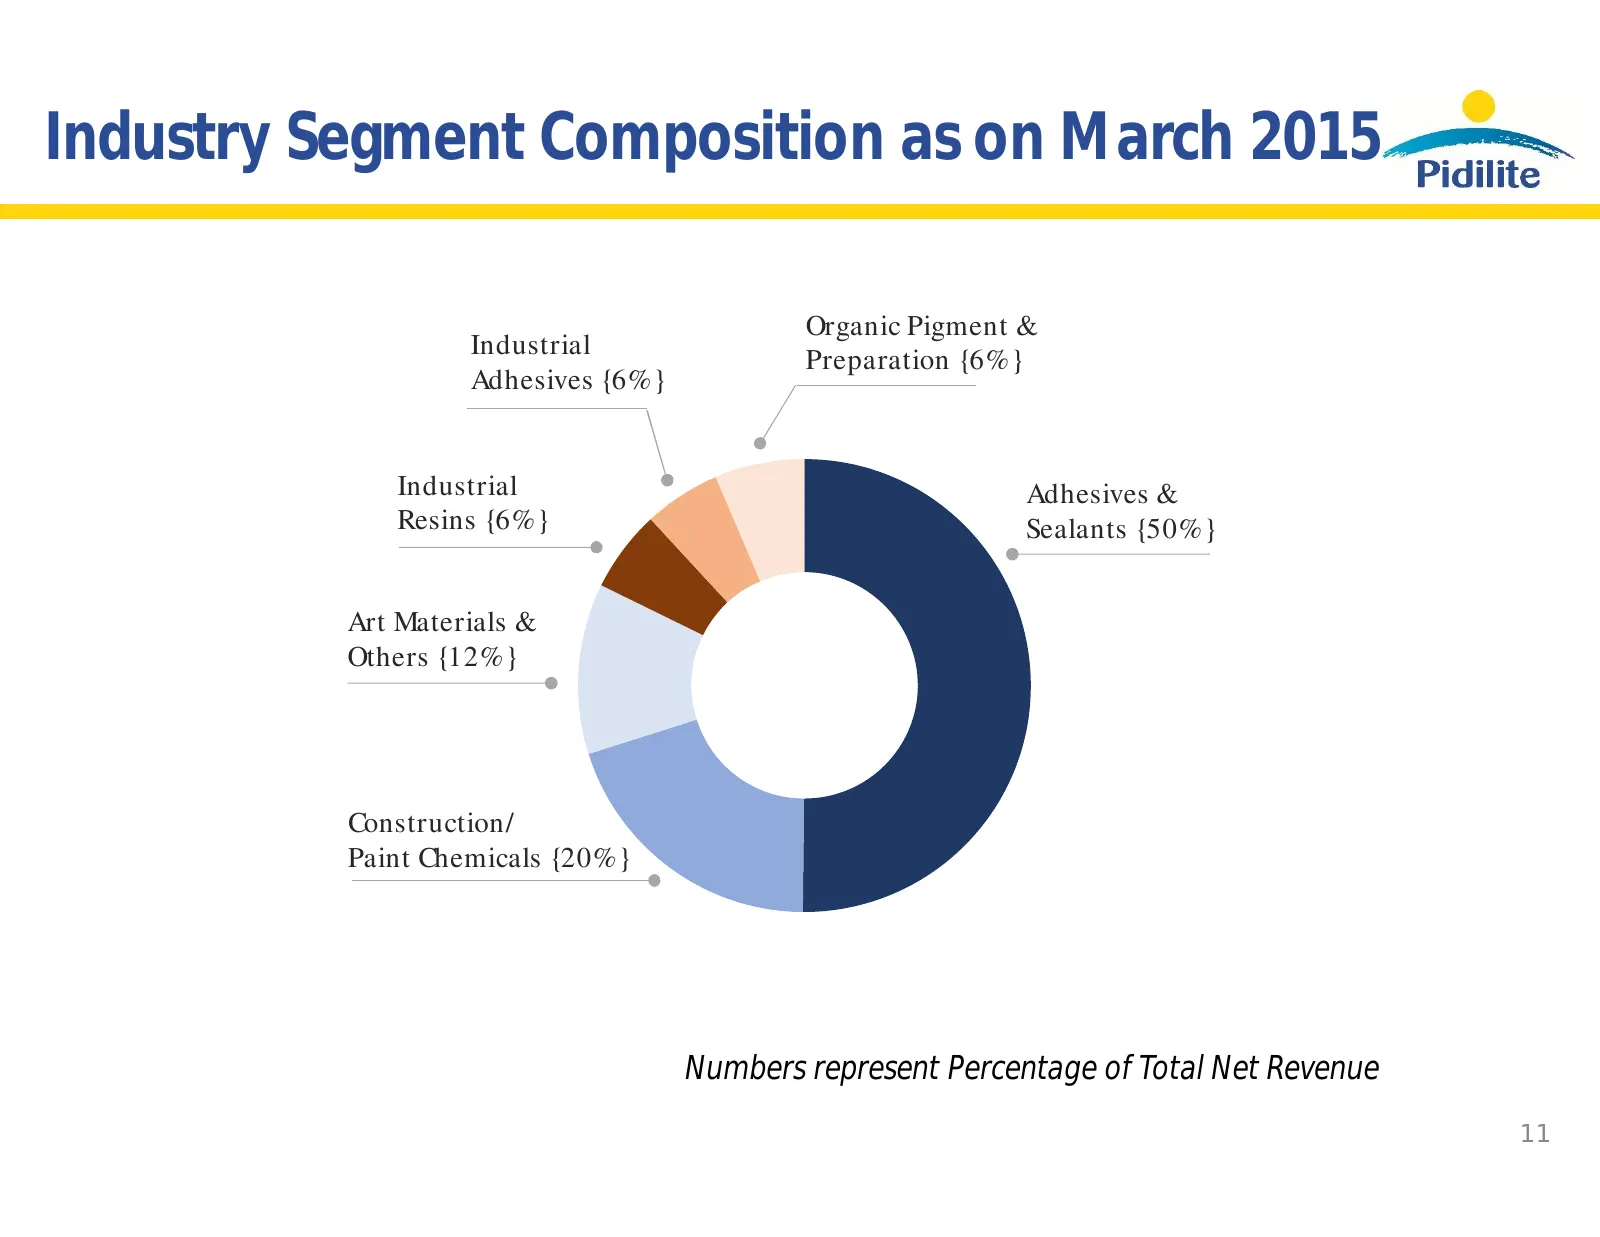
Industry Segment Composition as on March 2015 Organic Pigment & Industrial Preparation {6%} Adhesives {6%} Industrial Adhesives & Resins {6%} Sealants {50%} Art Materials & Others {12%} Construction/ Paint Chemicals {20%} Numbers represent Percentage of Total Net Revenue 11
Slide 12: 5-Year Performance by Business Segments
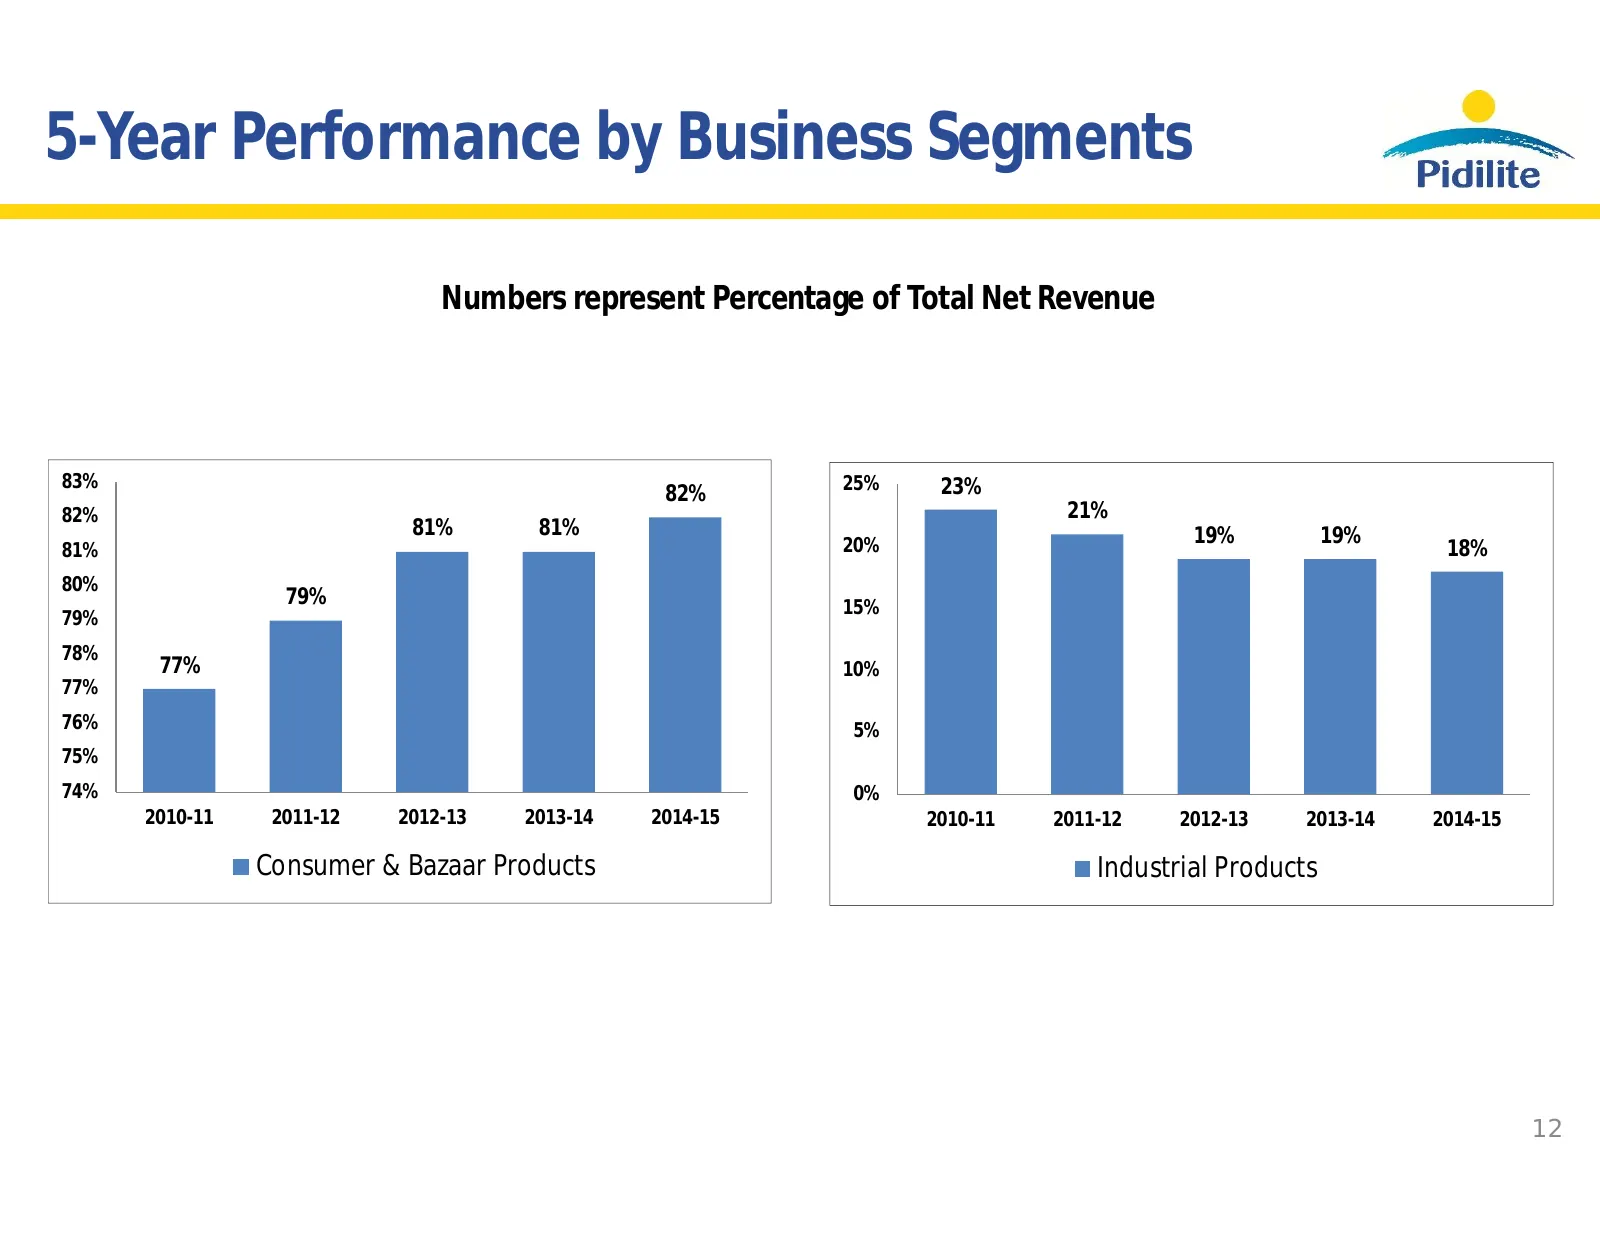
5-Year Performance by Business Segments Numbers represent Percentage of Total Net Revenue 83% 25% 23% 82% 82% 21% 81% 81% 19% 19% 81% 20% 18% 80% 79% 15% 79% 78% 77% 10% 77% 76% 5% 75% 74% 0% 2010-11 2011-12 2012-13 2013-14 2014-15 2010-11 2011-12 2012-13 2013-14 2014-15 Consumer & Bazaar Products I
Slide 13: Domestic Presence – India operations
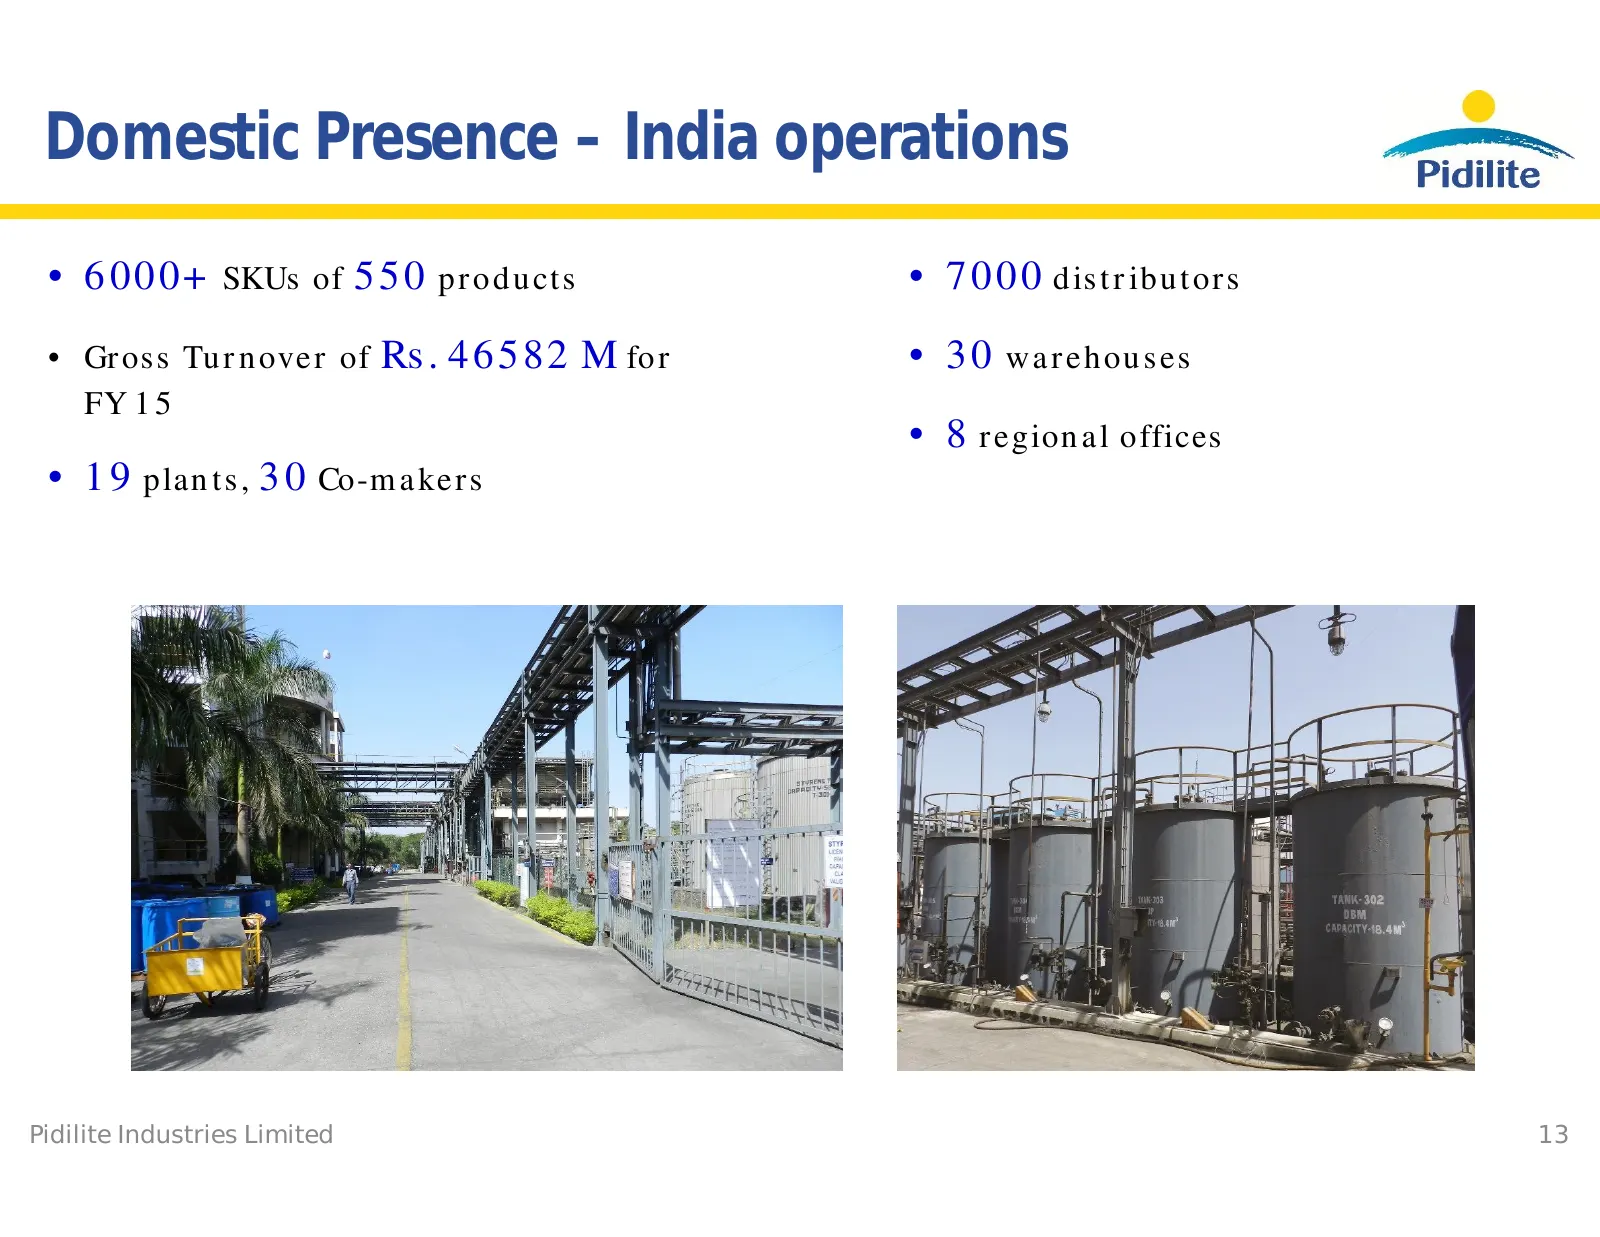
Domestic Presence – India operations • 6000+ SKUs of 550 products • 7000 distributors • Gross Turnover of Rs. 46582 M for • 30 warehouses FY 15 • 8 regional offices • 19 plants, 30 Co-makers Pidilite Industries Limited 13
Slide 14: Global Presence
Global Presence • Exports to more than 60 countries. Major exports to Middle East, Africa, USA & Europe • Export Turnover of Rs 4149 M in FY15 • 16 Overseas subsidiaries – (5 Direct and 11 Step down) and 1 Joint Venture • Total Revenue from Overseas subsidiaries of Rs.4895 M in FY15 • International
Slide 15: Marketing/ Advertising
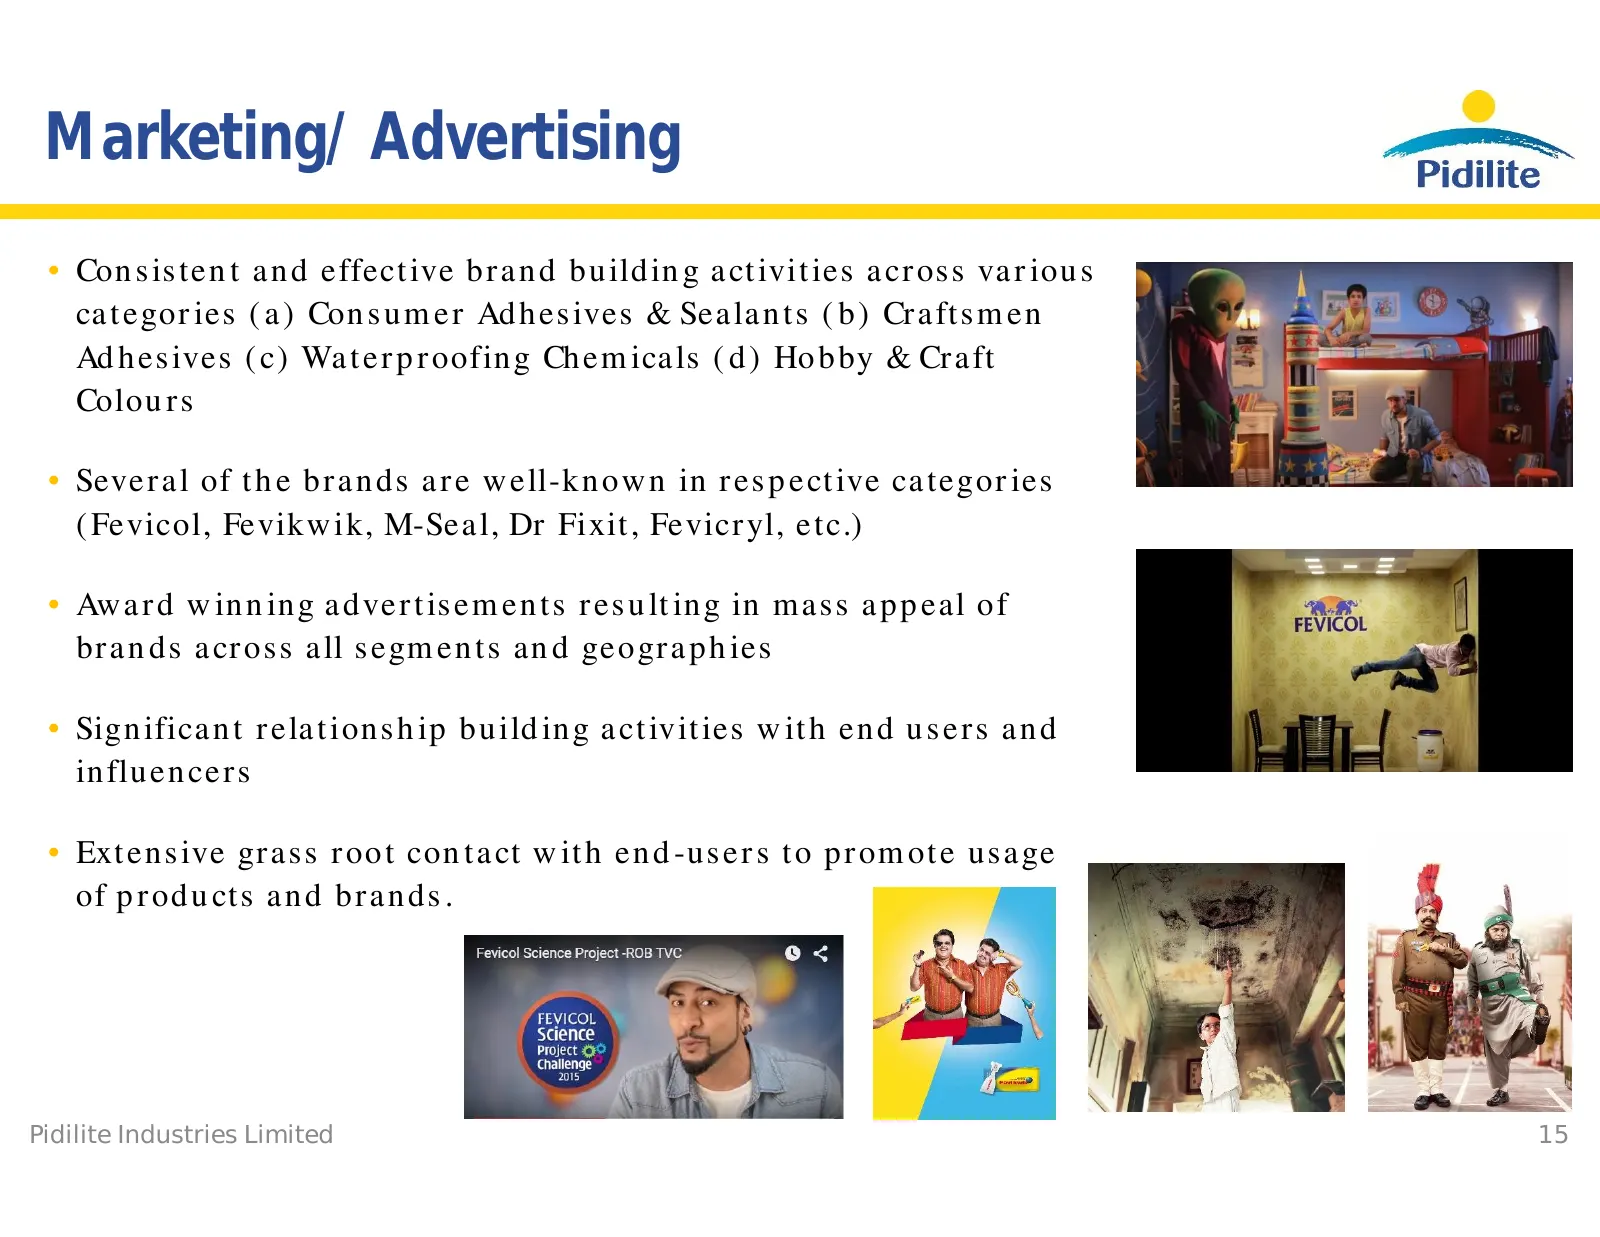
Marketing/ Advertising • Consistent and effective brand building activities across various categories (a) Consumer Adhesives & Sealants (b) Craftsmen Adhesives (c) Waterproofing Chemicals (d) Hobby & Craft Colours • Several of the brands are well-known in respective categories (Fevicol, Fevikwik, M-
Slide 16: Shareholding Pattern (December 31, 2015)
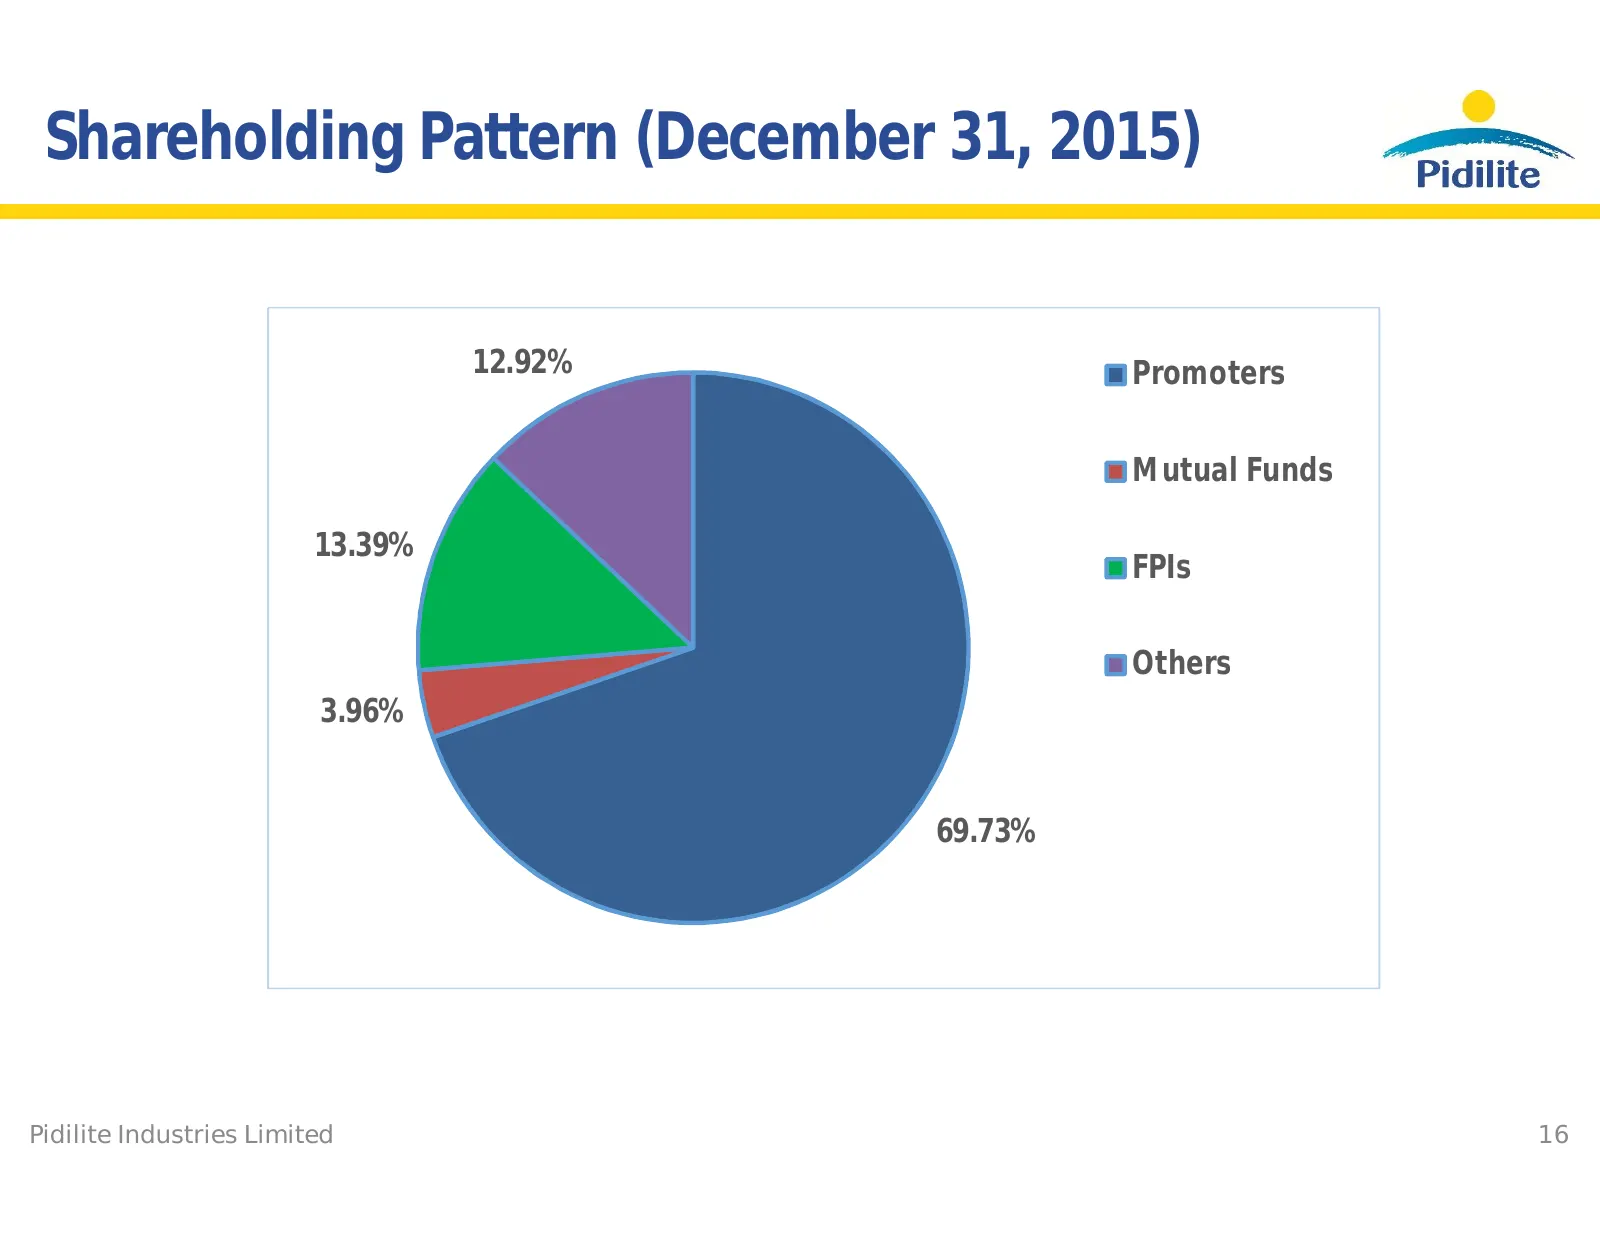
Shareholding Pattern (December 31, 2015) 12.92% Promoters Mutual Funds 13.39% FPIs Others 3.96% 69.73% Pidilite Industries Limited 16
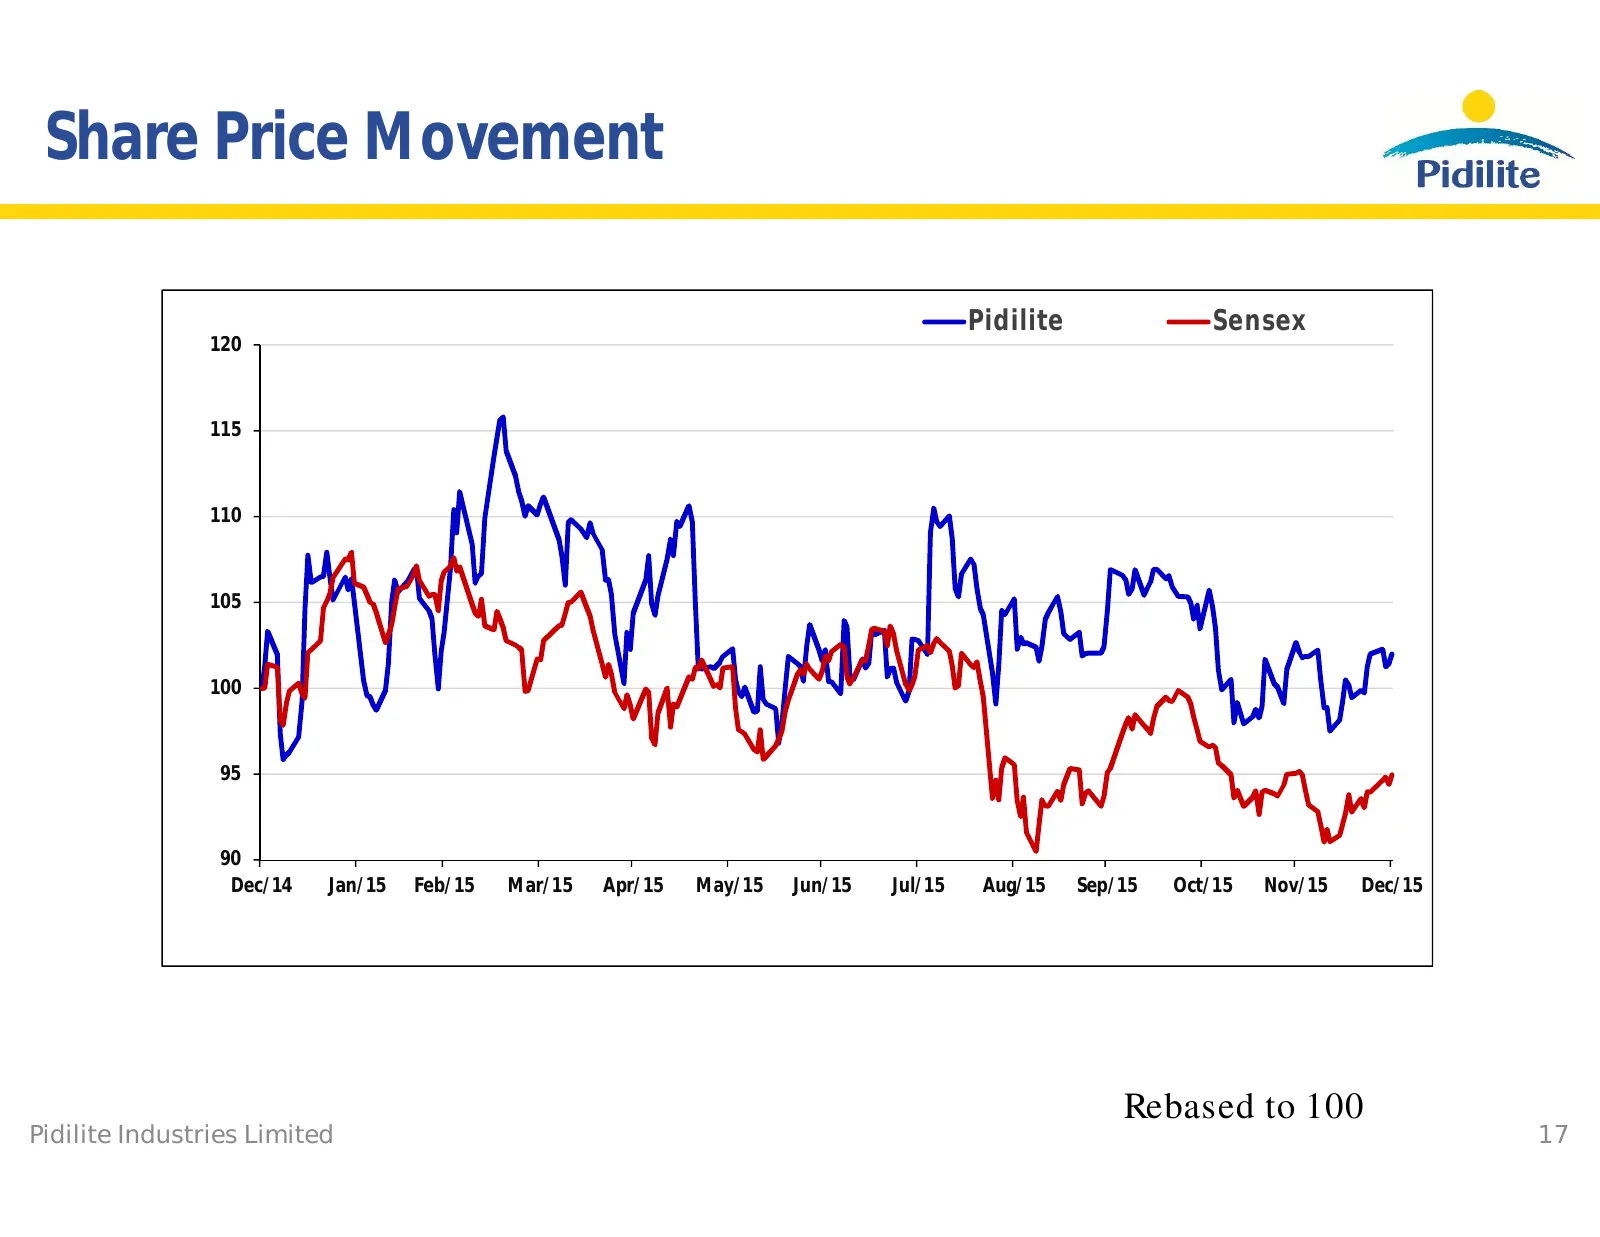
Slide 17: Share Price Movement
Share Price Movement Pidilite Sensex 120 115 110 105 100 95 90 Dec/14 Jan/15 Feb/15 Mar/15 Apr/15 May/15 Jun/15 Jul/15 Aug/15 Sep/15 Oct/15 Nov/15 Dec/15 Rebased to 100 Pidilite Industries Limited 17
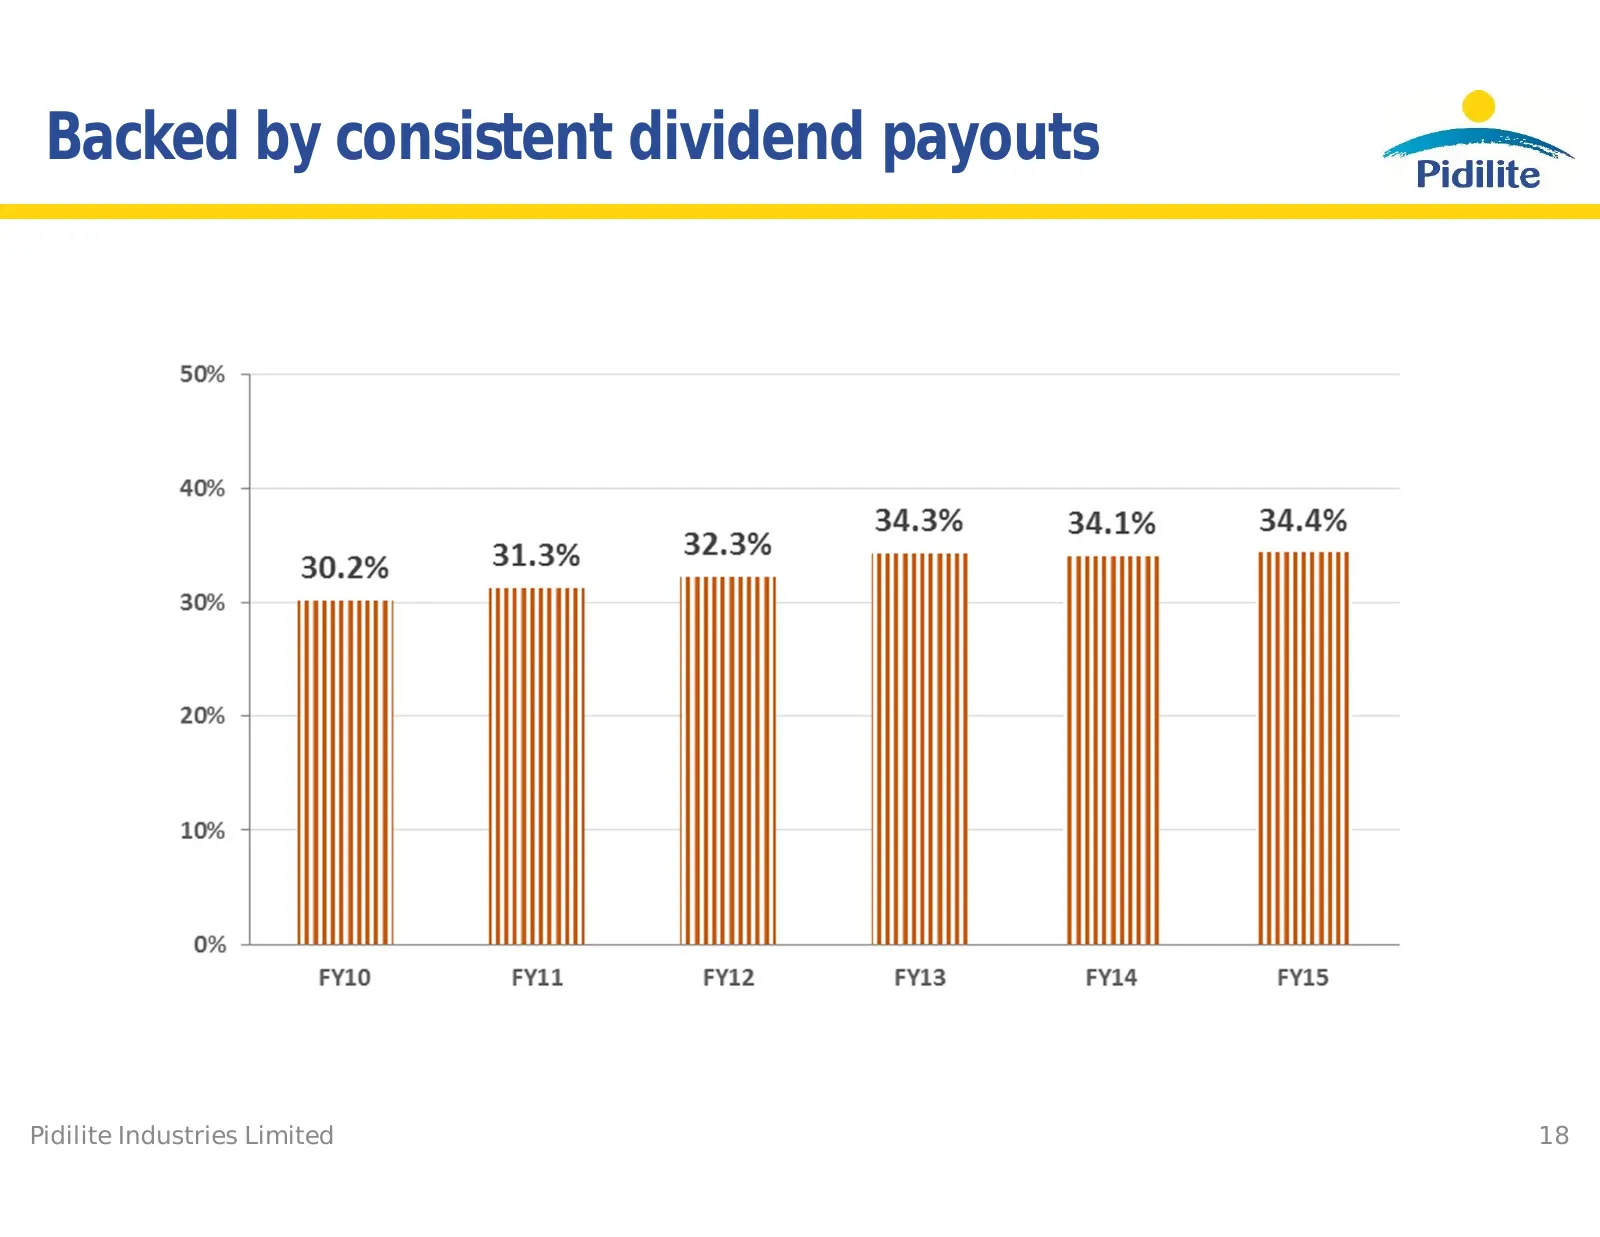
Slide 18: Backed by consistent dividend payouts
Backed by consistent dividend payouts Pidilite Industries Limited 18

Slide 19: Investor Contacts
Investor Contacts Investor Relations - investor.relations@pidilite.co.in Savithri Parekh, Company Secretary Ramkrishna Mandir Road, Off Mathuradas Vasanji Road, Andheri (E), Mumbai - 400 059. Phone : +91 22 67697000 CIN : L24100MH1969PLC014336 Fax : +91 22 28216007
Source: Internet Archive copy of pidilite.com
More decks from Pidilite Industries Limited
 Q2 FY27 Earnings Presentation42 slides · Oct 28, 2026
 Q1 FY27 Earnings Presentation38 slides · Aug 4, 2026
 Investor Presentation (May 2026)46 slides · May 22, 2026
 Q4 FY26 Earnings Presentation39 slides · May 7, 2026
 Investor Presentation (February 2026)45 slides · Feb 6, 2026
 Q3 FY26 Earnings Presentation40 slides · Feb 3, 2026