CMS Info Systems Ltd. · NSE:CMSINFO
CMS Info Systems — Investor Day (May 2023)
22 slides from CMS Info Systems's investor day presentation, May 25, 2023
Slide 1: Investor Day
~v CMS Connecting Commerce Investor Day May 25, 2023 = ACCELERATING TRANSFORMATION
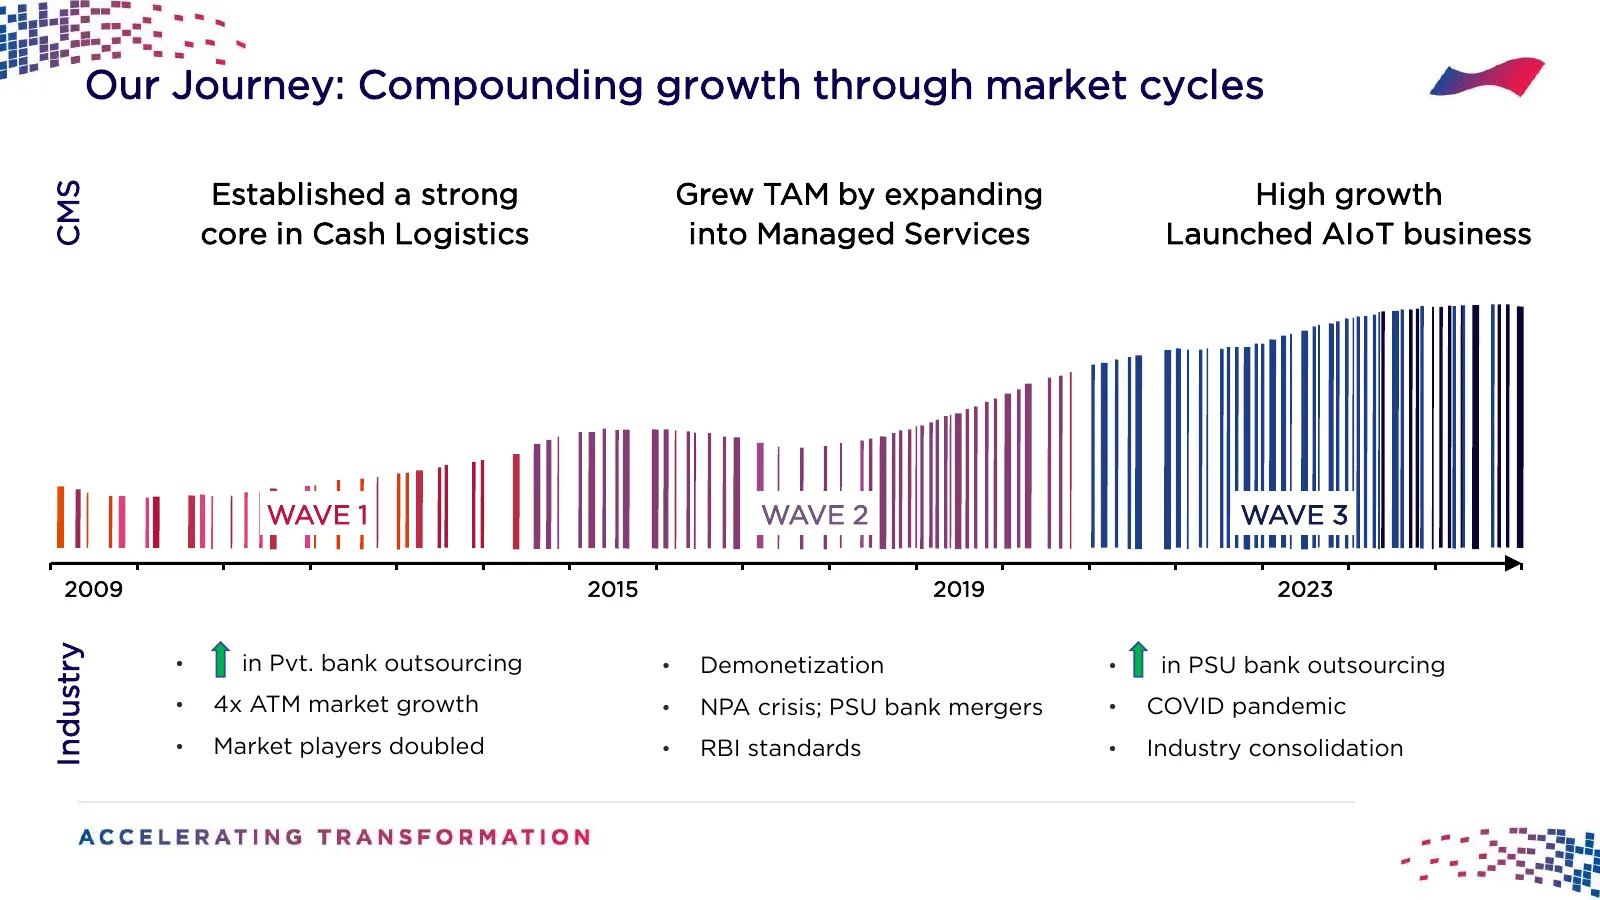
Slide 2: Our Journey: Compounding growth through market cycles
Our Journey: Compounding growth through market cycles Established a strong Grew TAM by expanding High growth CMS core in Cash Logistics into Managed Services Launched AIoT business WAVE 1 WAVE 2 WAVE 3 2009 2015 2019 2023 Industry • in Pvt. bank outsourcing • Demonetization • in PSU bank outsourcing
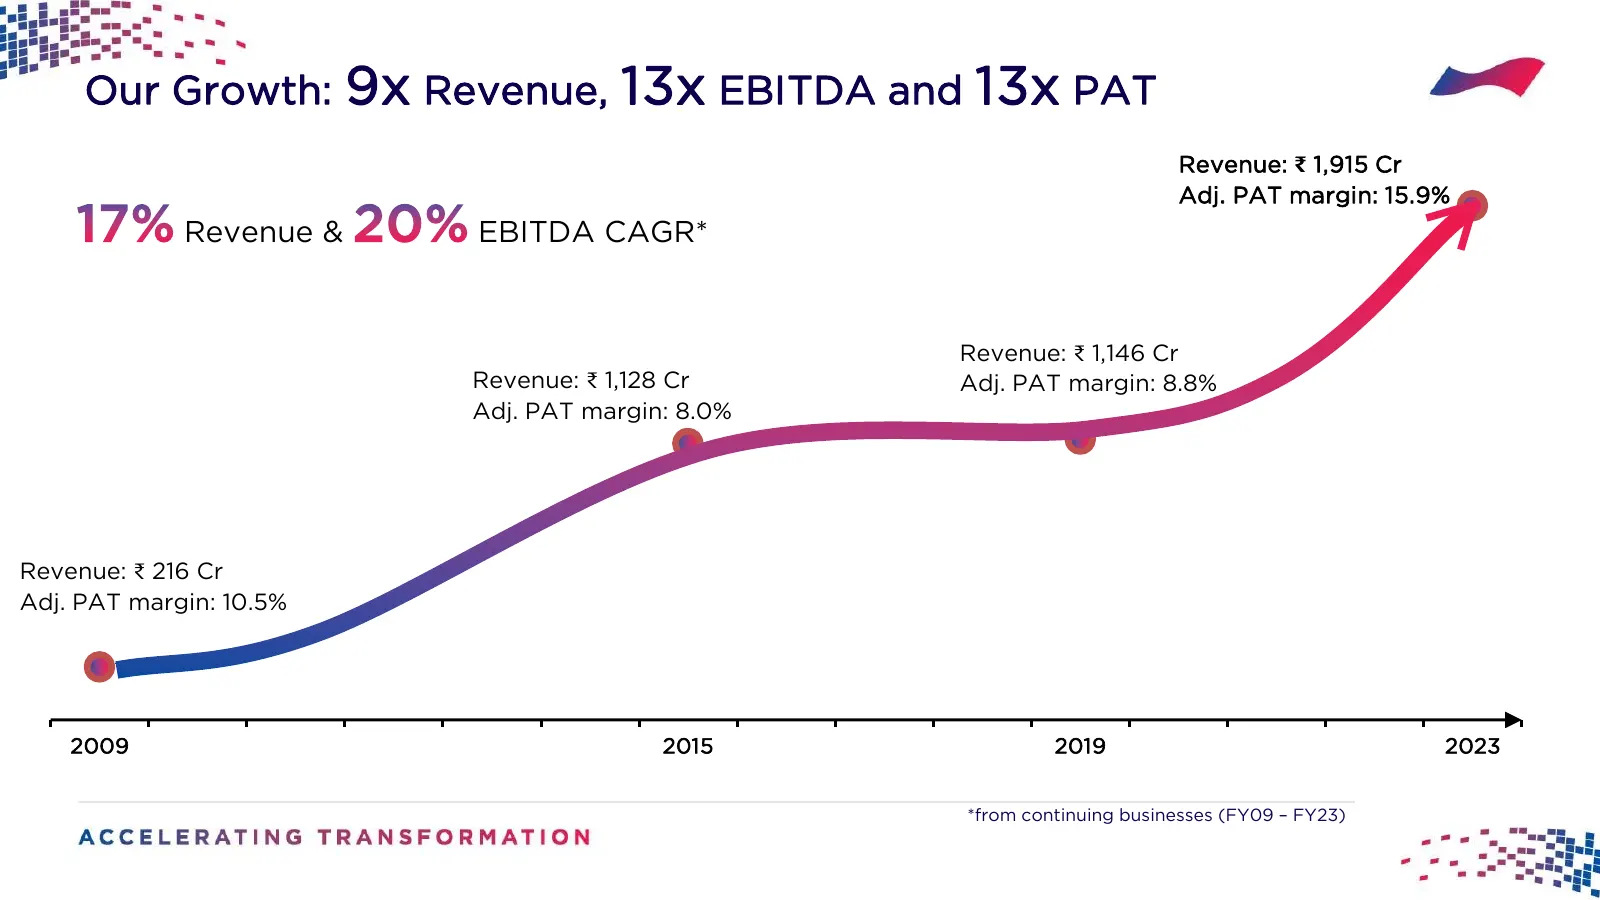
Slide 3: Our Growth: 9x Revenue, 13x EBITDA and 13x PAT
Our Growth: 9x Revenue, 13x EBITDA and 13x PAT Revenue: ₹ 1,915 Cr Adj. PAT margin: 15.9% Revenue & EBITDA CAGR* Revenue: ₹ 1,146 Cr Revenue: ₹ 1,128 Cr Adj. PAT margin: 8.8% Adj. PAT margin: 8.0% Revenue: ₹ 216 Cr Adj. PAT margin: 10.5% 2009 2015 2019 2023 *from continuing businesses (FY09 – FY23)
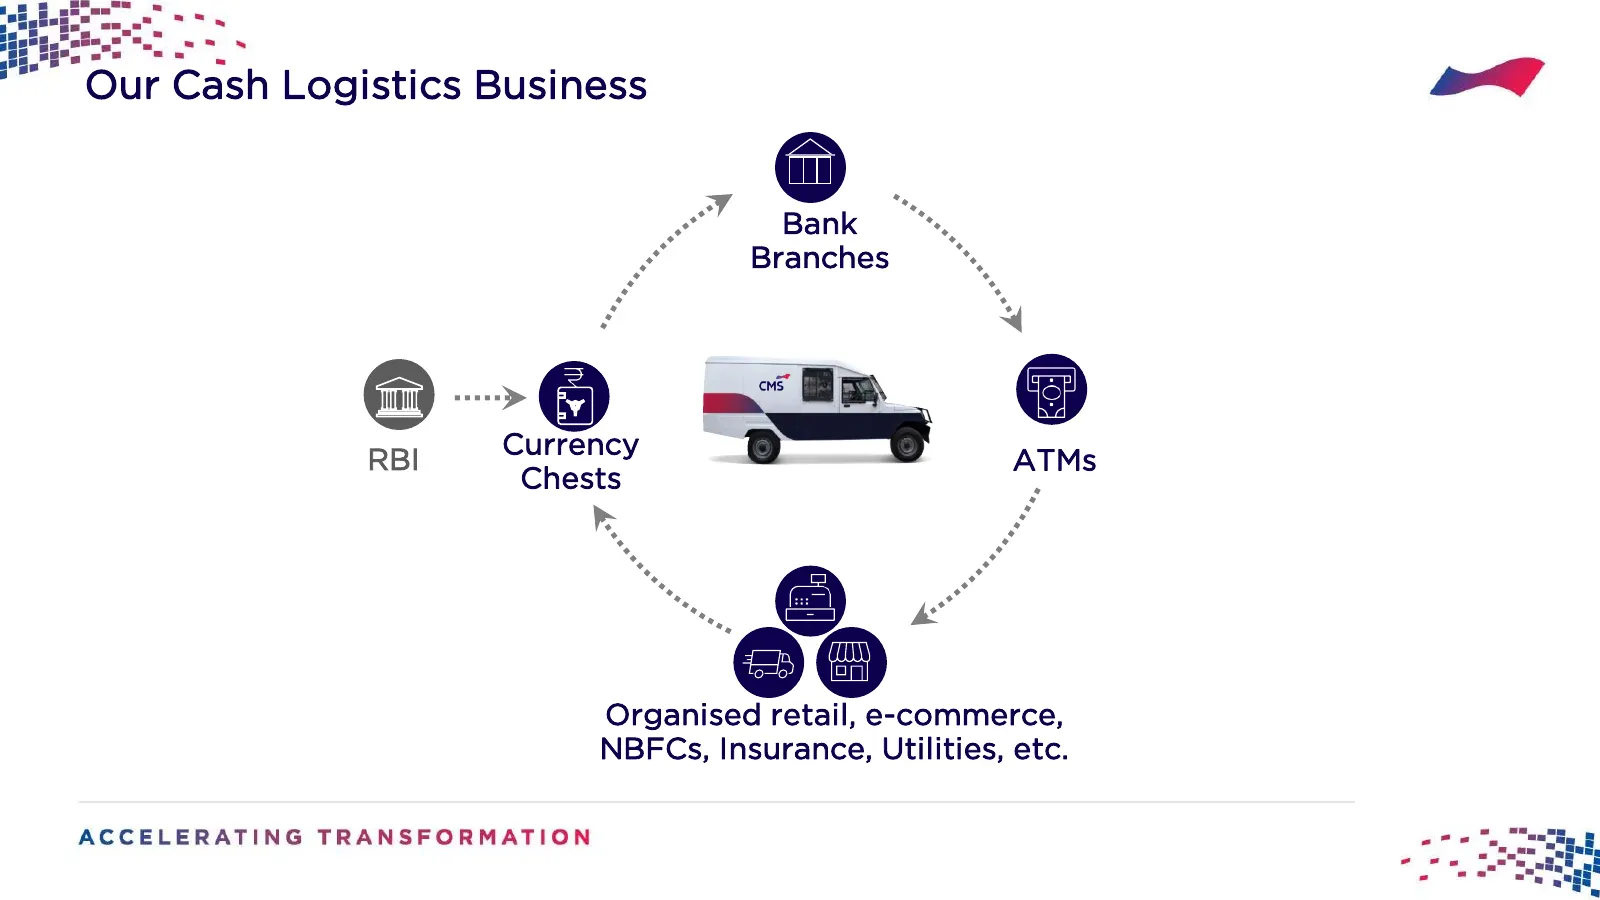
Slide 4: Our Cash Logistics Business
Our Cash Logistics Business Bank Branches Currency RBI ATMs Chests Organised retail, e-commerce, NBFCs, Insurance, Utilities, etc.
Slide 5: CMS Logistics Platform powers the Currency Cycle in India
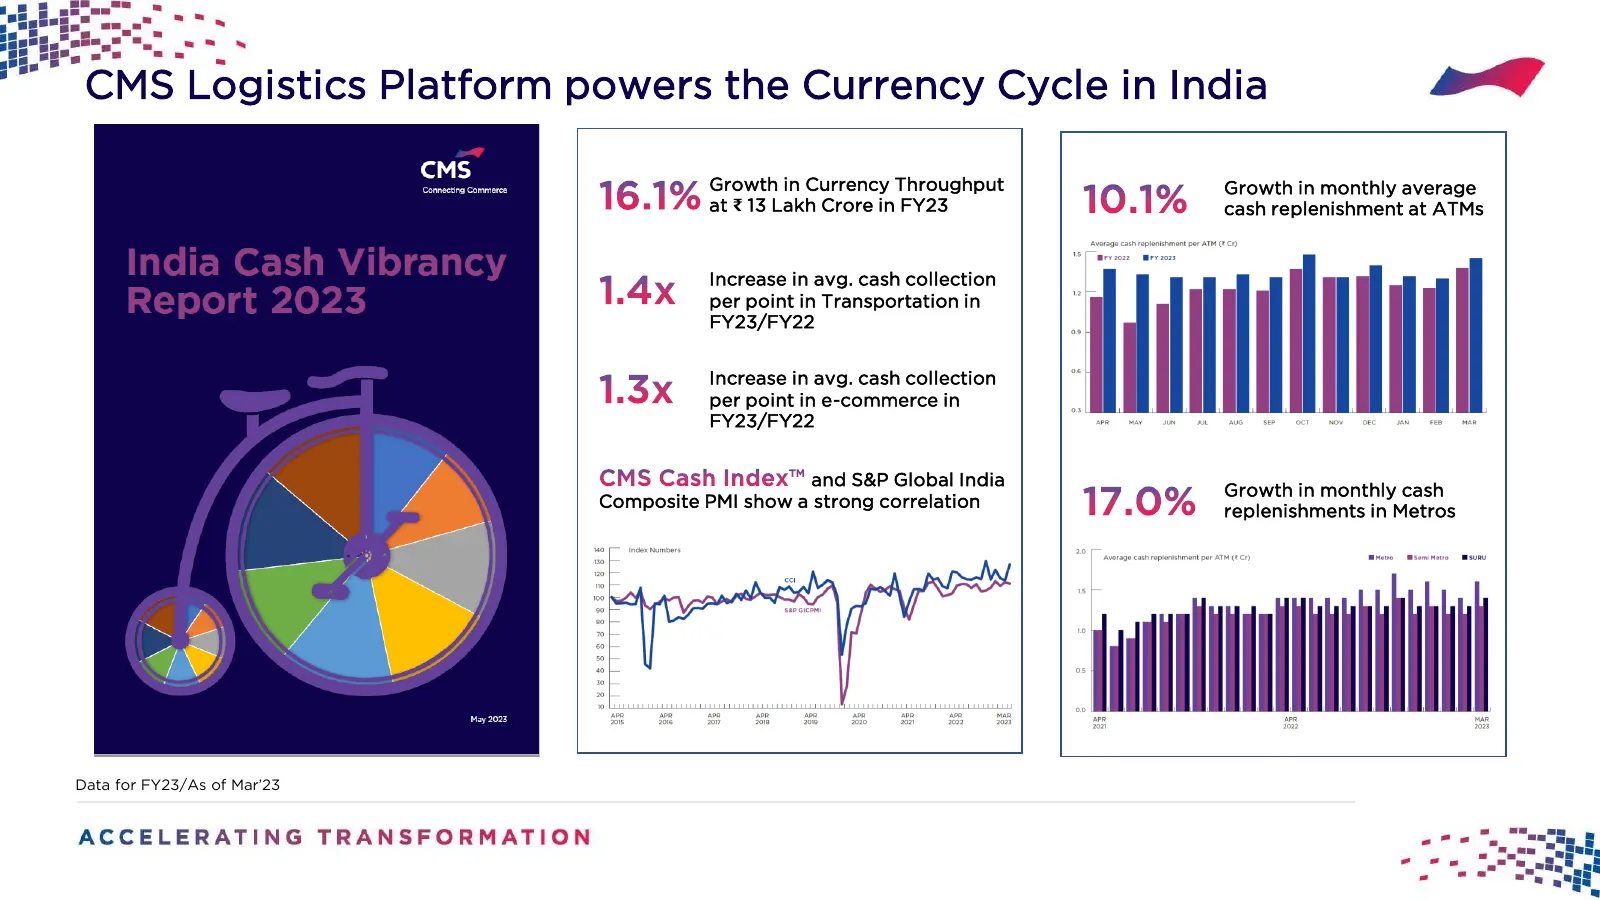
CMS Logistics Platform powers the Currency Cycle in India Growth in Currency Throughput Growth in monthly average at ₹ 13 Lakh Crore in FY23 cash replenishment at ATMs Increase in avg. cash collection per point in Transportation in FY23/FY22 Increase in avg. cash collection per point in e-commerce i
Slide 6: Our Cash Logistics Network
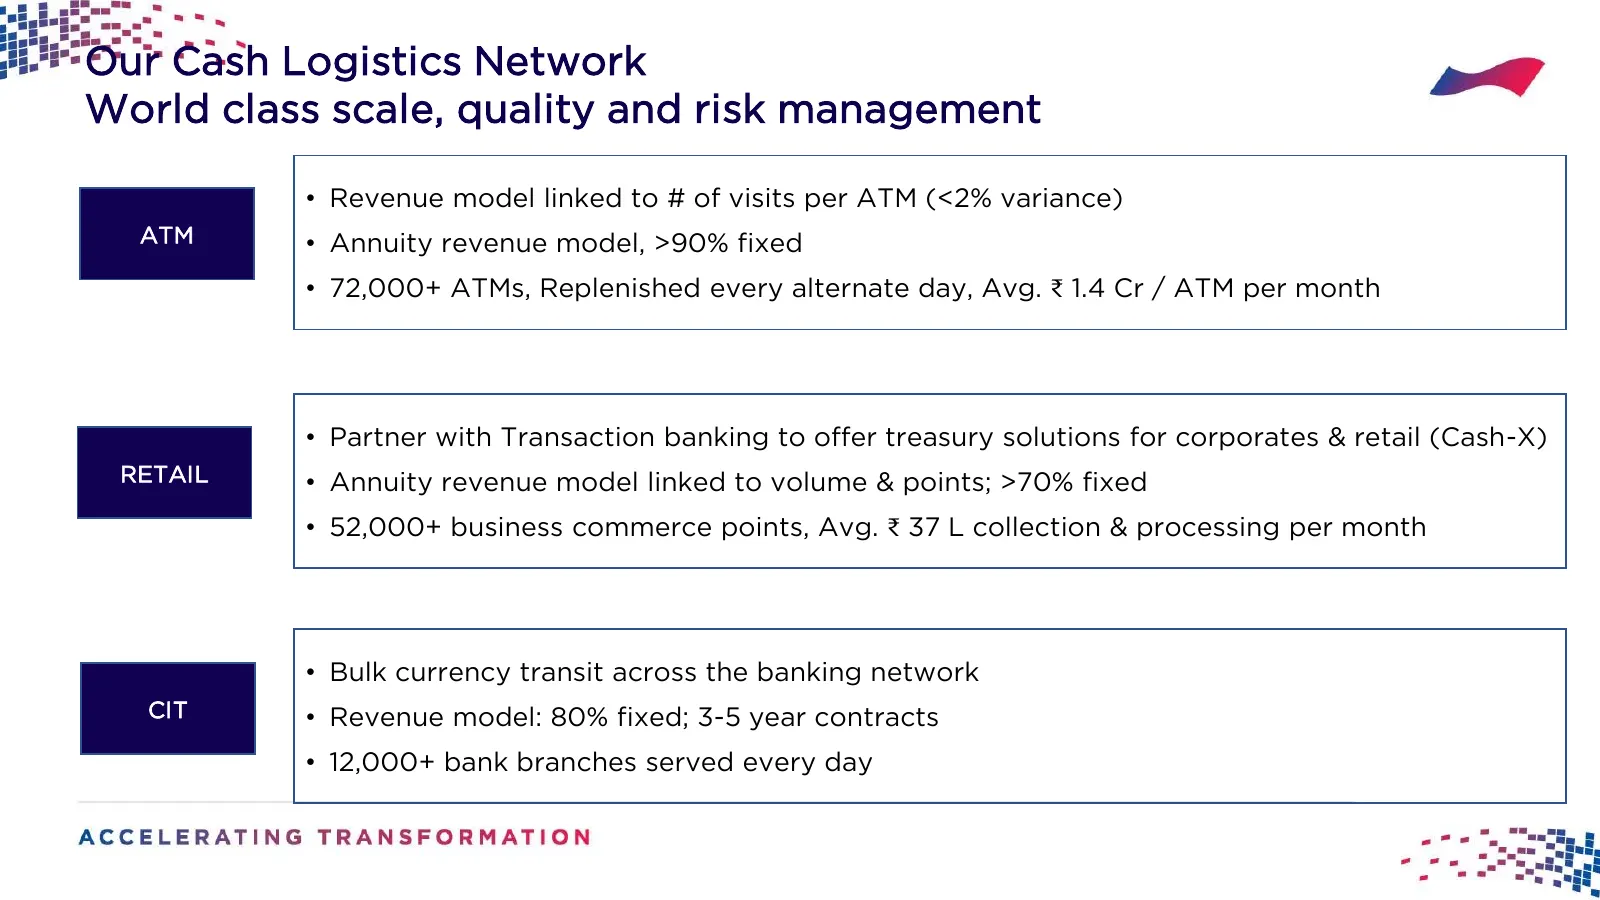
Our Cash Logistics Network World class scale, quality and risk management • Revenue model linked to # of visits per ATM (<2% variance) ATM • Annuity revenue model, >90% fixed • 72,000+ ATMs, Replenished every alternate day, Avg. ₹ 1.4 Cr / ATM per month • Partner with Transaction banking to offer tr
Slide 7: Last 5-years Financials: Cash Logistics business
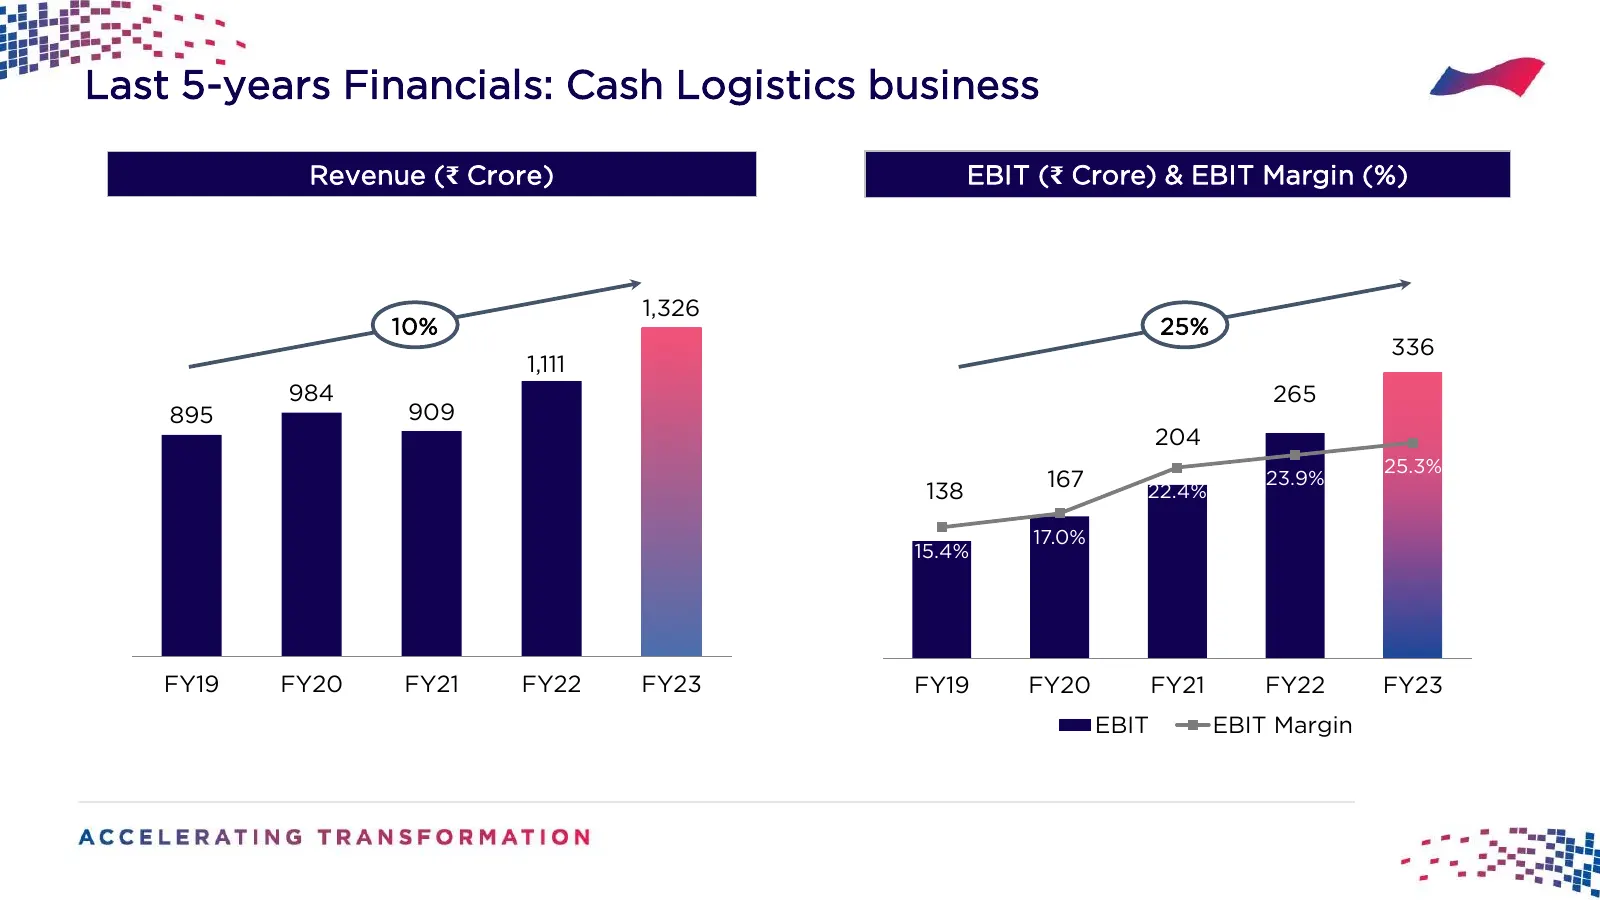
Last 5-years Financials: Cash Logistics business Revenue (₹ Crore) EBIT (₹ Crore) & EBIT Margin (%) 1,326 10% 25% 336 1,111 984 265 895 909 204 25.3% 138 167 22.4% 23.9% 17.0% 15.4% FY19 FY20 FY21 FY22 FY23 FY19 FY20 FY21 FY22 FY23 EBIT EBIT Margin
Slide 8: Business of Cash Logistics
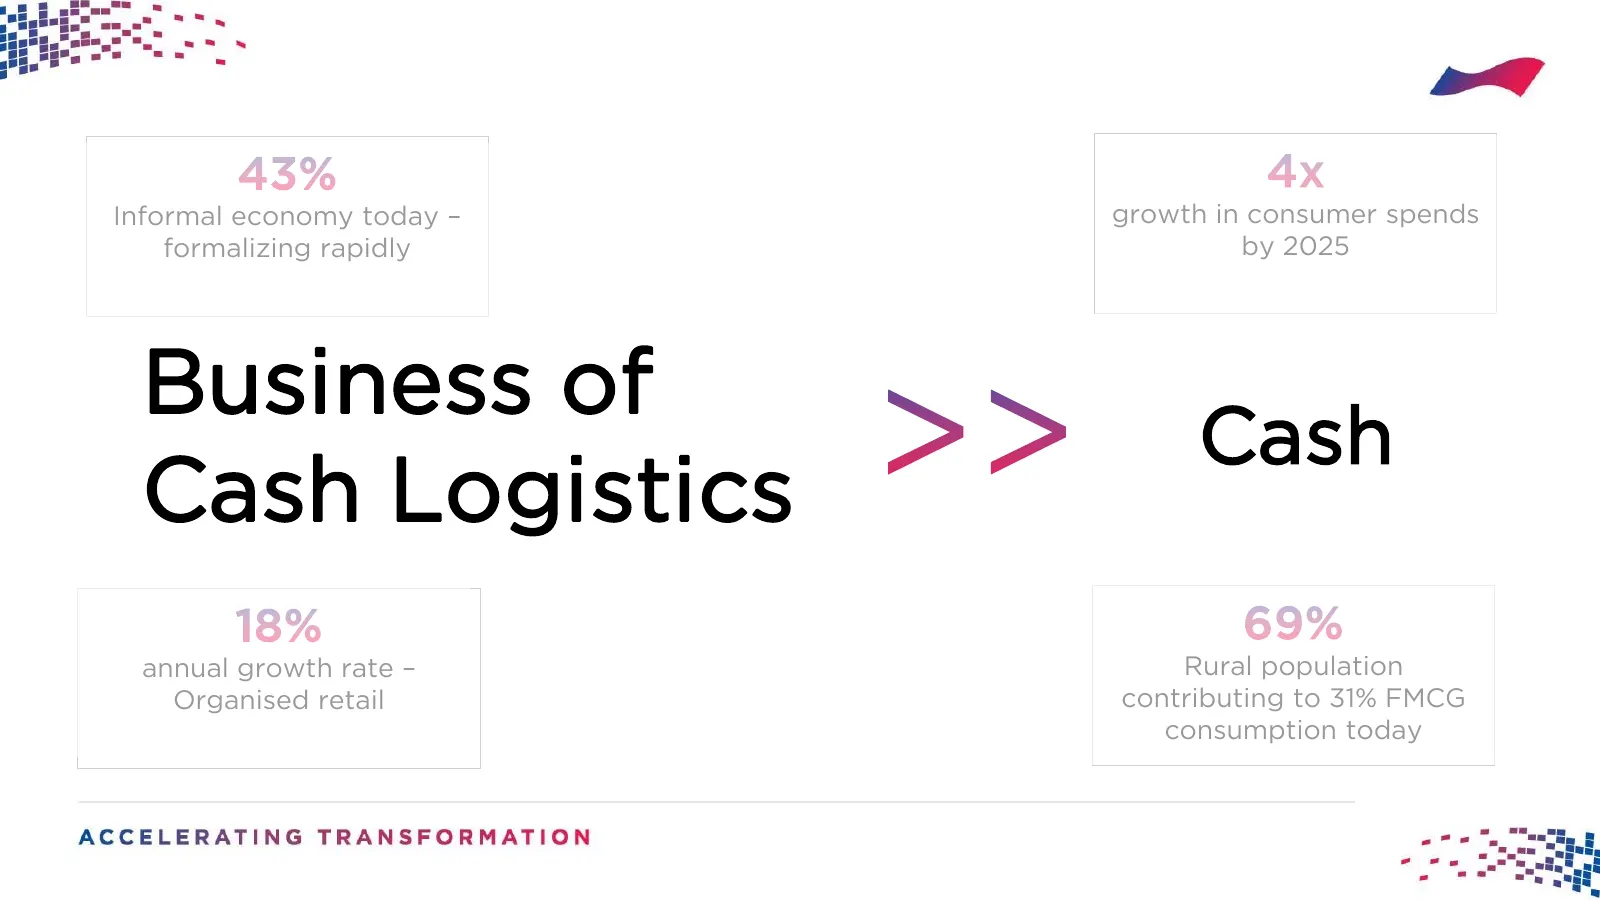
Informal economy today – growth in consumer spends formalizing rapidly by 2025 Business of Cash Cash Logistics annual growth rate – Rural population Organised retail contributing to 31% FMCG consumption today
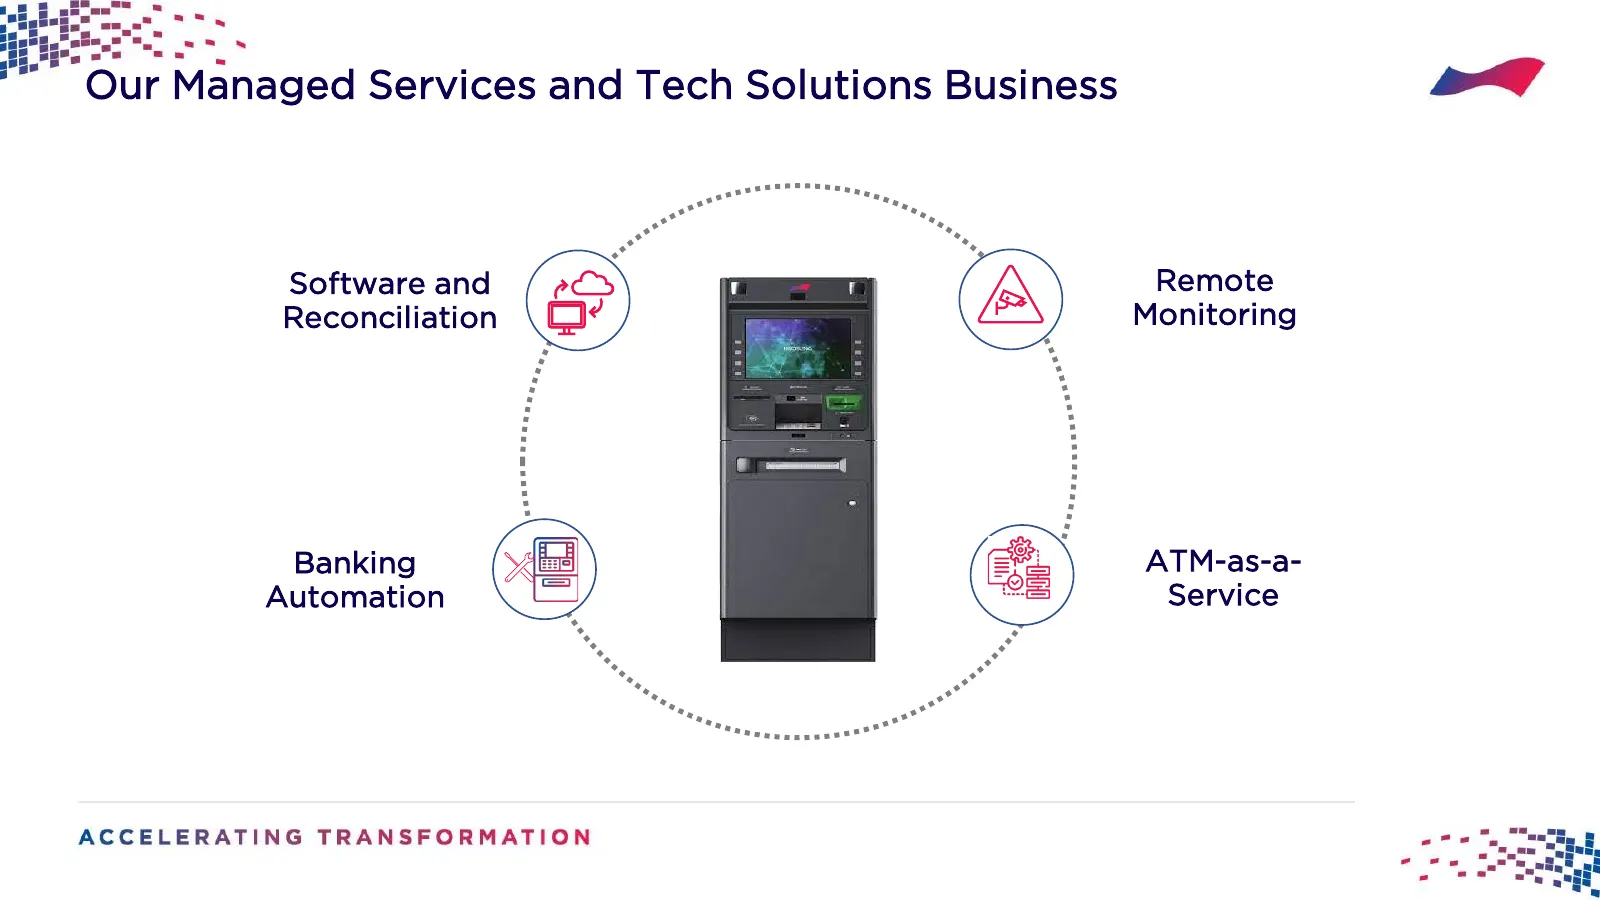
Slide 9: Our Managed Services and Tech Solutions Business
Our Managed Services and Tech Solutions Business Software and Remote Reconciliation Monitoring Banking ATM-as-a- Automation Service
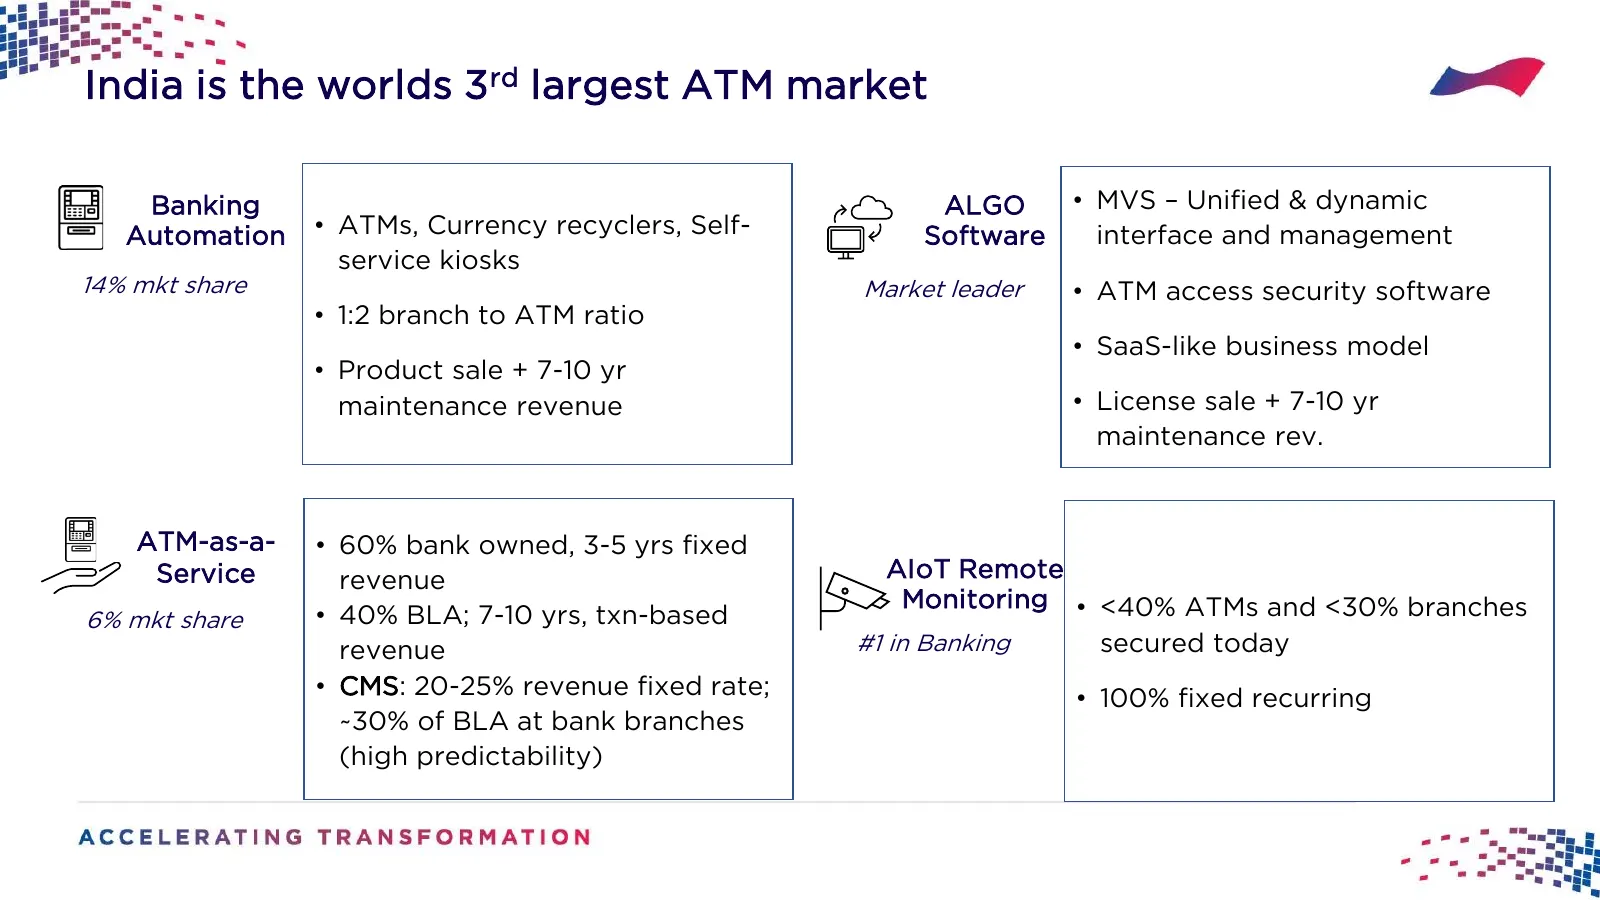
Slide 10: India is the world's 3rd largest ATM market
India is the worlds 3rd largest ATM market Banking ALGO • MVS – Unified & dynamic Automation • ATMs, Currency recyclers, Self- Software interface and management service kiosks 14% mkt share Market leader • ATM access security software • 1:2 branch to ATM ratio • SaaS-like business model • Product sa
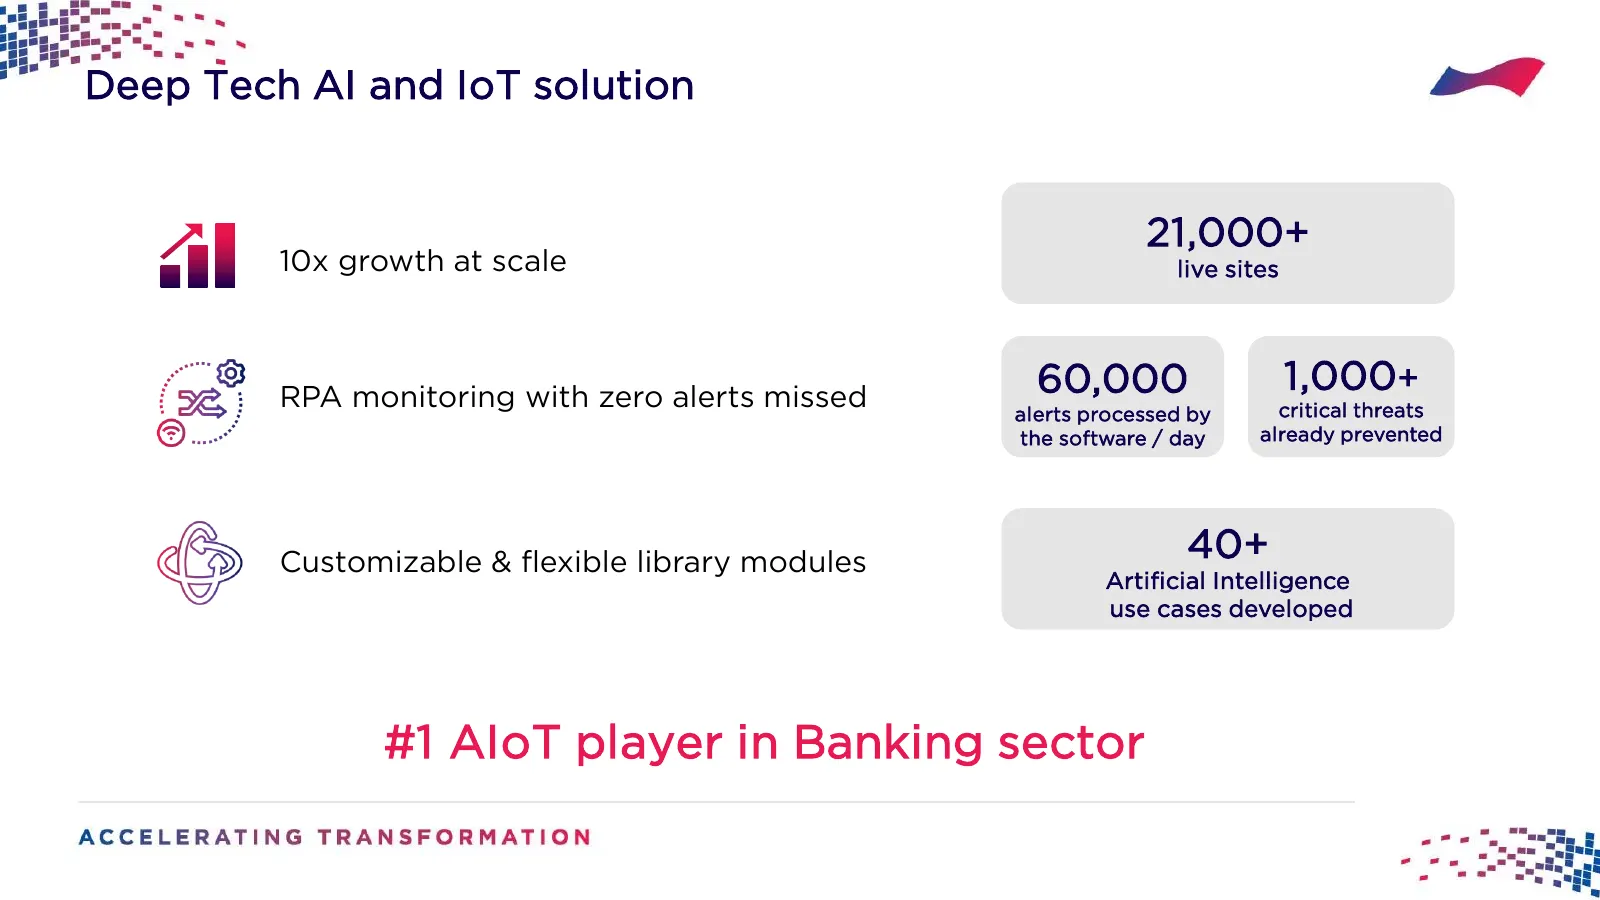
Slide 11: #1 AIoT player in Banking sector
Deep Tech AI and IoT solution 21,000+ 10x growth at scale live sites RPA monitoring with zero alerts missed 60,000 1,000+ alerts processed by critical threats the software / day already prevented Customizable & flexible library modules 40+ Artificial Intelligence use cases developed #1 AIoT player i
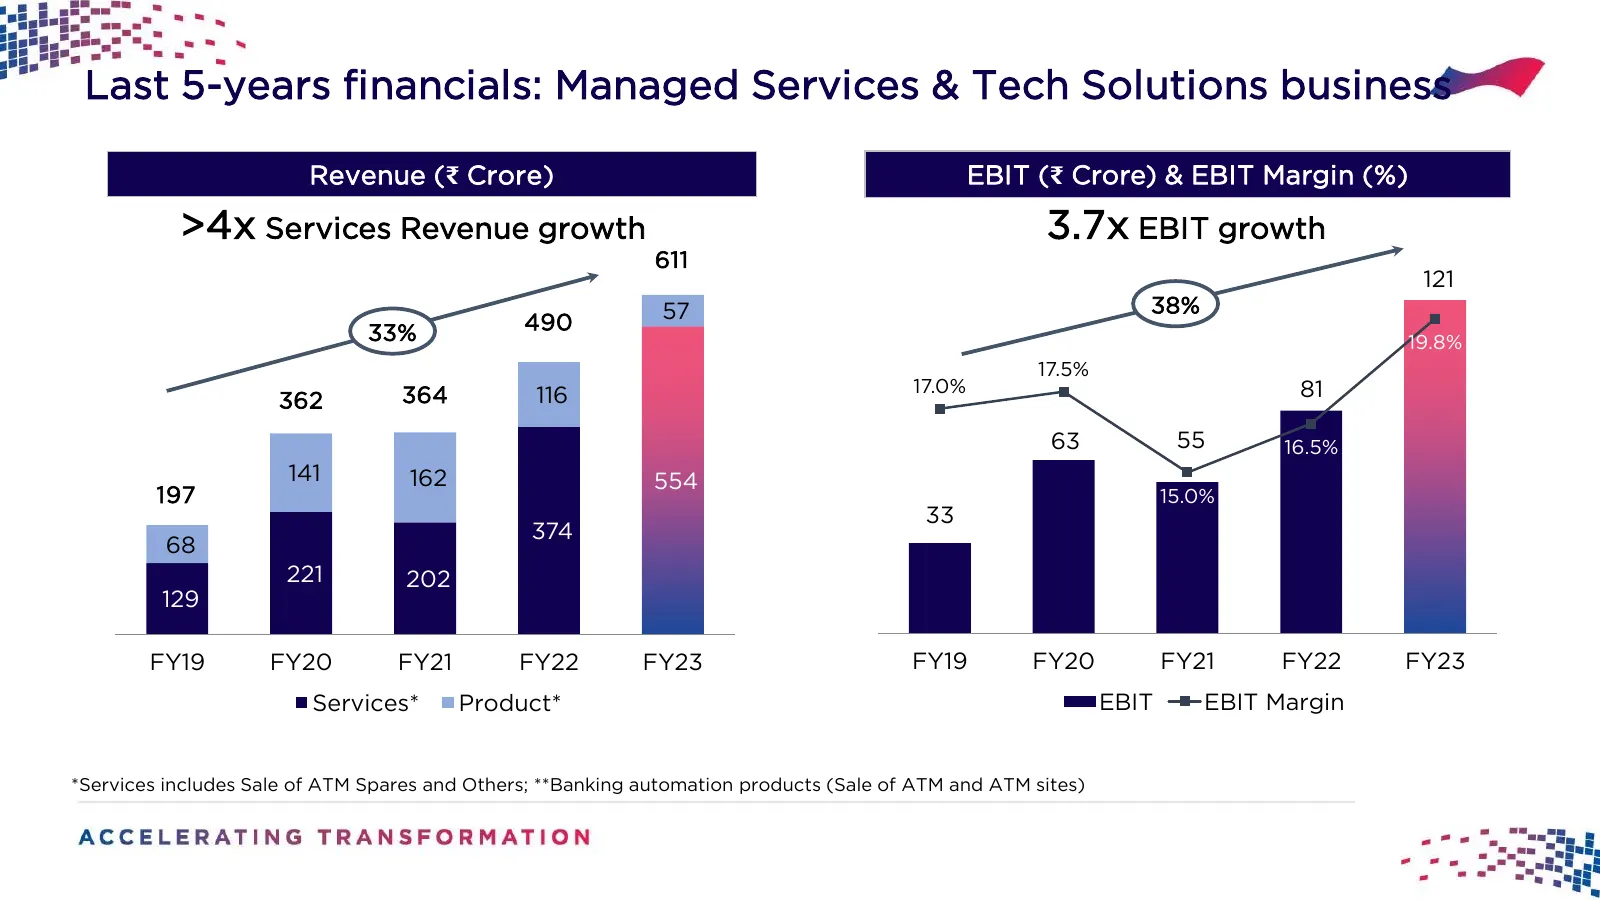
Slide 12: Last 5-years financials: Managed Services & Tech Solutions business
Last 5-years financials: Managed Services & Tech Solutions business Revenue (₹ Crore) EBIT (₹ Crore) & EBIT Margin (%) >4x Services Revenue growth 3.7x EBIT growth 611 121 57 38% 33% 490 19.8% 17.5% 364 17.0% 81 362 116 63 55 16.5% 141 162 554 197 15.0% 33 374 68 221 202 129 FY19 FY20 FY21 FY22 FY23
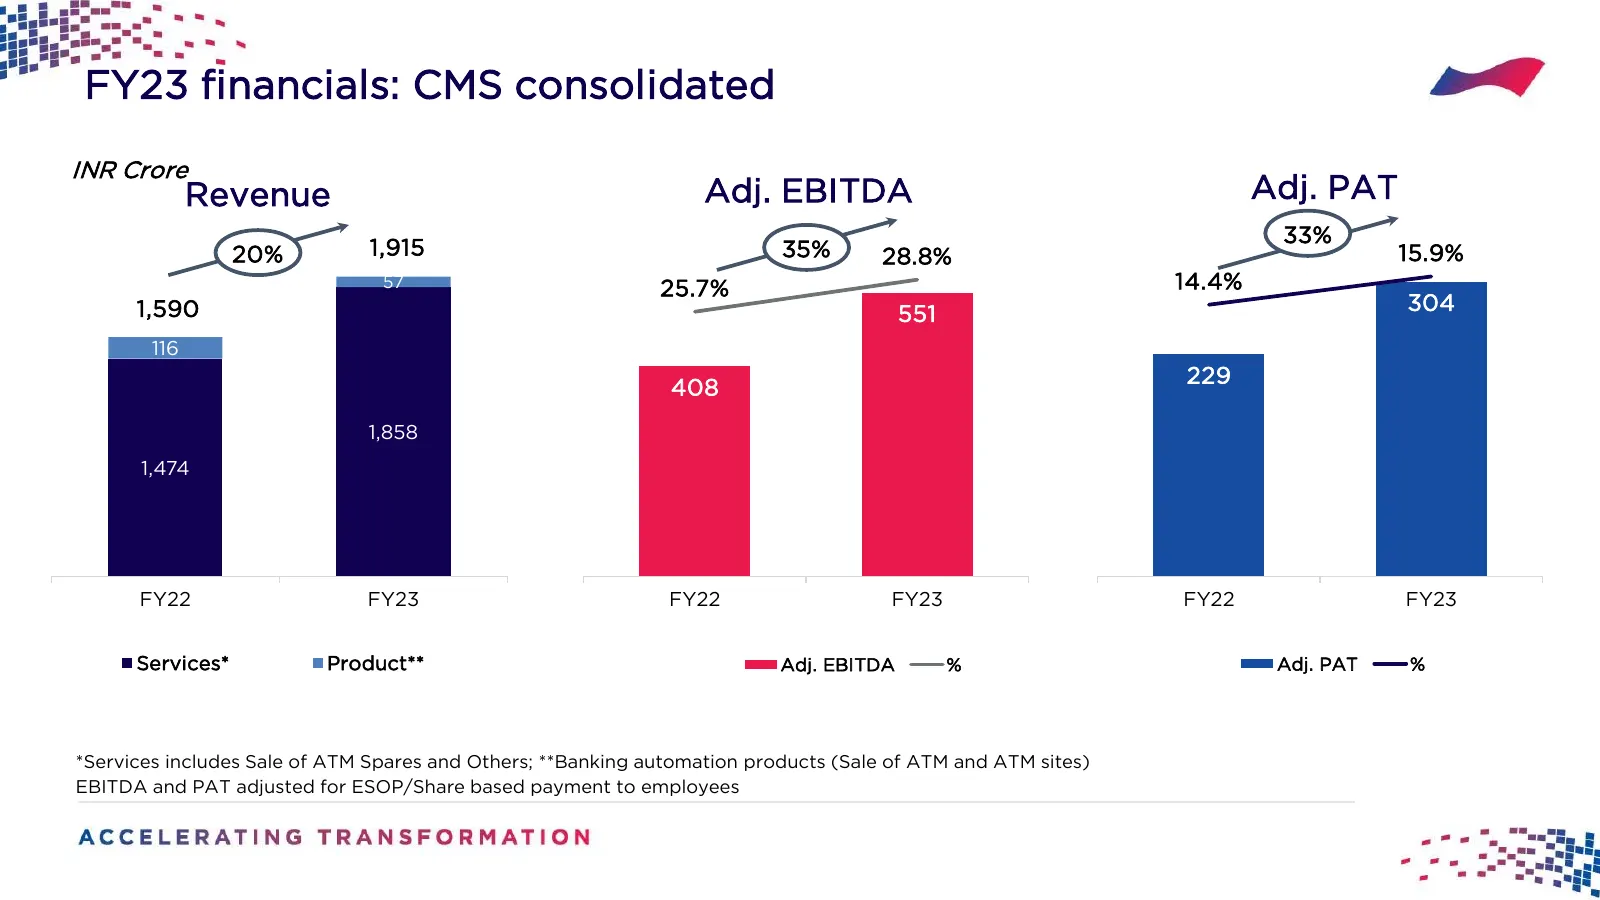
Slide 13: FY23 financials: CMS consolidated
FY23 financials: CMS consolidated INR Crore Revenue Adj. EBITDA Adj. PAT 350 33% 20% 1,915 35% 28.8% 15.9% 600 30.0% 57 25.7% 300 14.4% 1,590 551 304 500 25.0% 250 116 400 20.0% 229 408 200 300 15.0% 1,858 150 1,474 200 10.0% 100 100 5.0% 50 0 0.0% 0 FY22 FY23 FY22 FY23 FY22 FY23 Services* Product**
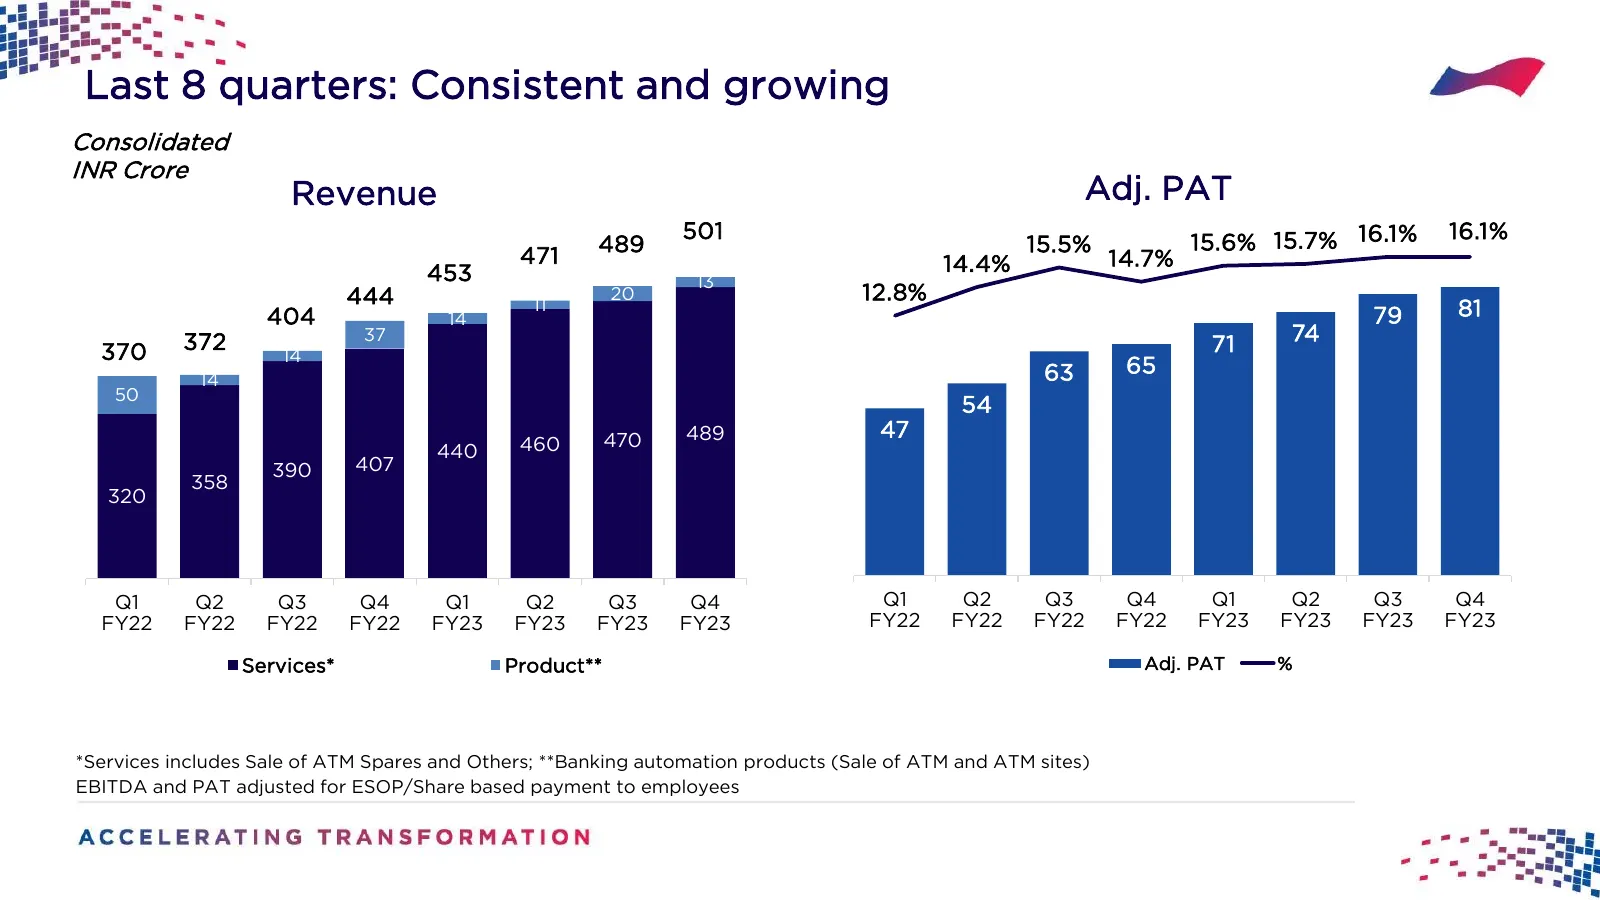
Slide 14: Last 8 quarters: Consistent and growing
Last 8 quarters: Consistent and growing Consolidated INR Crore Revenue Adj. PAT 501 15.6% 15.7% 16.1% 16.1% 471 489 15.5% 90 14.4% 14.7% 453 13 444 20 80 12.8% 404 14 11 79 81 70 372 37 71 74 370 14 60 63 65 14 50 50 54 470 489 40 47 440 460 390 407 30 358 320 20 10 0 Q1 Q2 Q3 Q4 Q1 Q2 Q3 Q4 Q1 Q2 Q
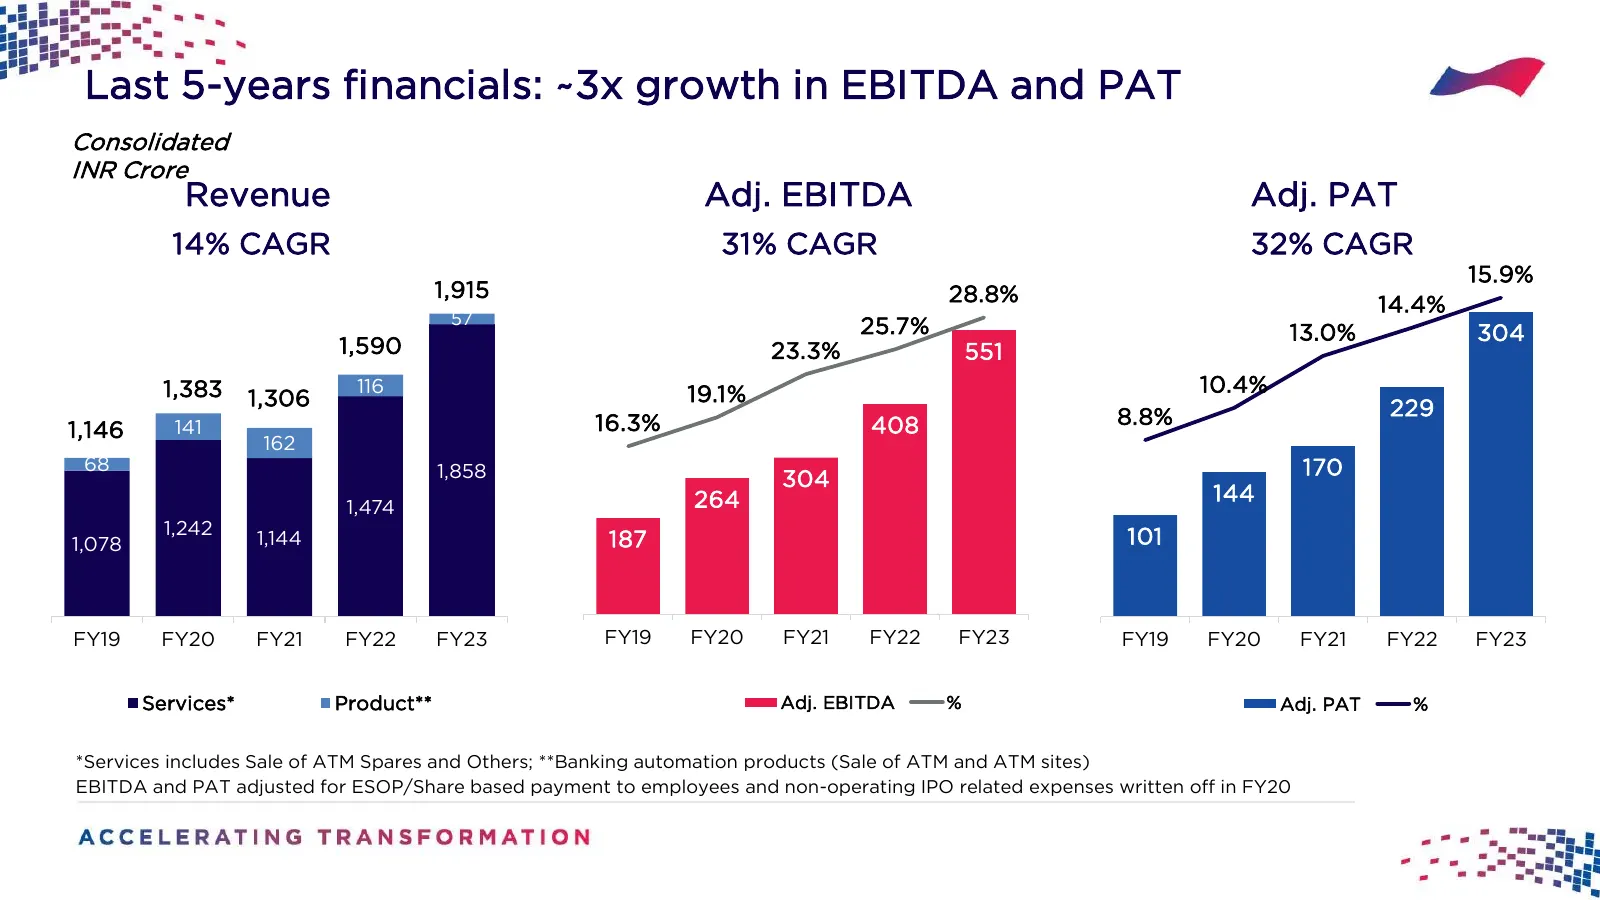
Slide 15: Last 5-years financials: ~3x growth in EBITDA and PAT
Last 5-years financials: ~3x growth in EBITDA and PAT Consolidated INR Crore Revenue Adj. EBITDA Adj. PAT 14% CAGR 31% CAGR 32% CAGR 15.9% 1,915 28.8% 600 30.0% 300 14.4% 57 25.7% 13.0% 304 1,590 500 23.3% 551 25.0% 250 1,383 116 19.1% 10.4% 1,306 400 20.0% 229 141 16.3% 408 200 8.8% 1,146 162 68 30
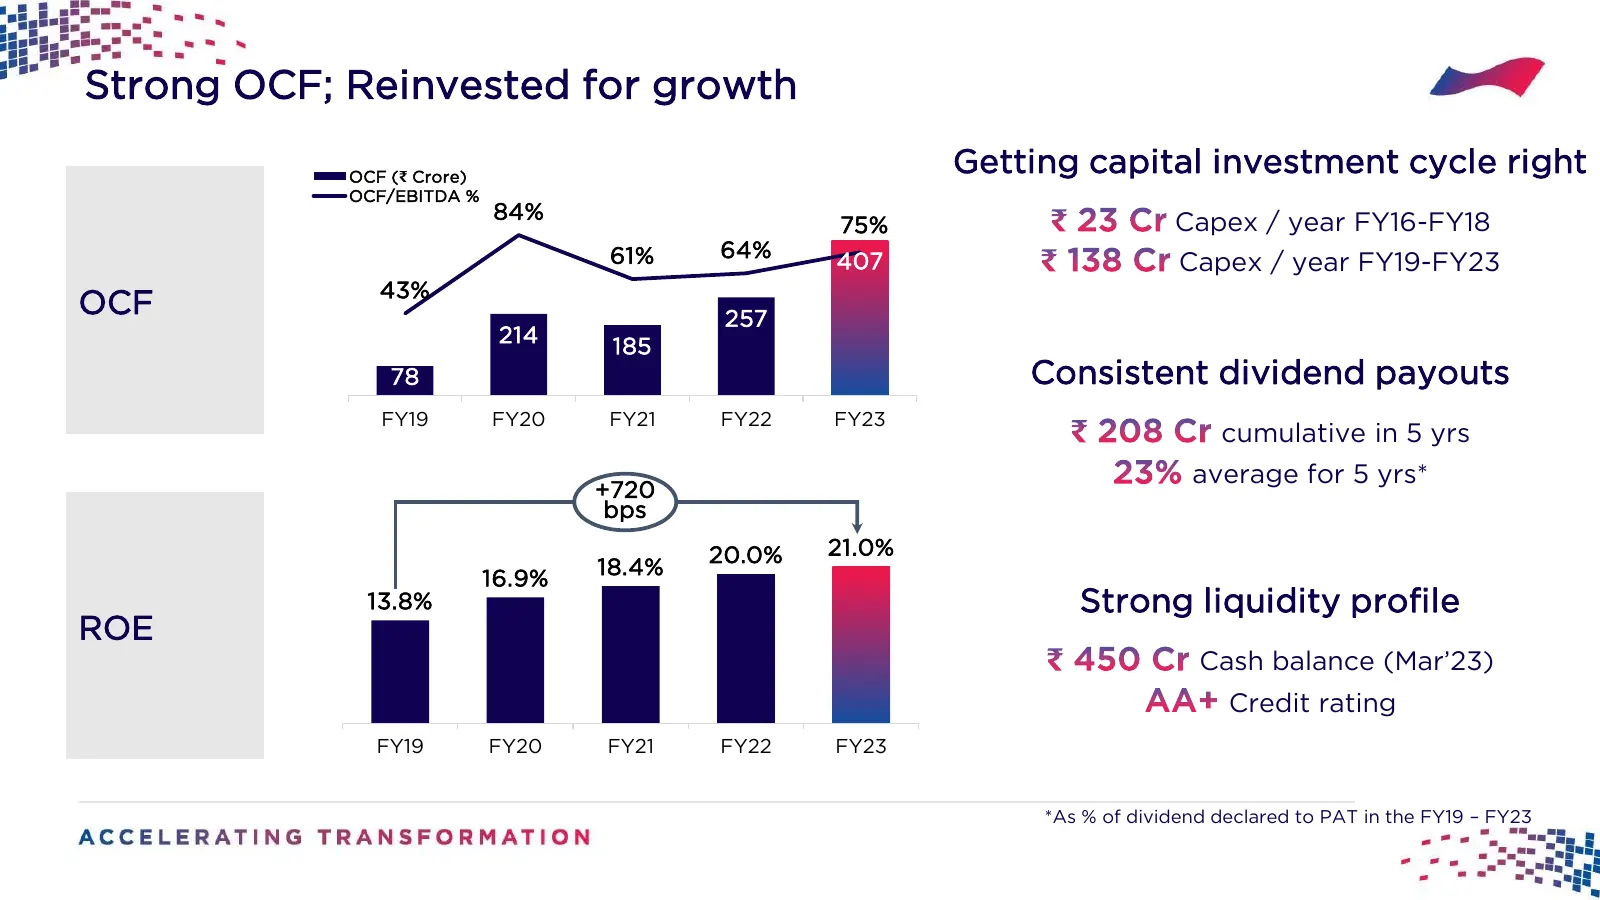
Slide 16: Strong OCF; Reinvested for growth
Strong OCF; Reinvested for growth OCF (₹ Crore) Getting capital investment cycle right OCF/EBITDA % 84% 450 75% 90% Capex / year FY16-FY18 400 80% 61% 64% 350 407 70% Capex / year FY19-FY23 300 60% 43% OCF 250 200 257 50% 40% 150 214 185 30% 100 20% 50 78 10% Consistent dividend payouts 0 0% FY19 FY
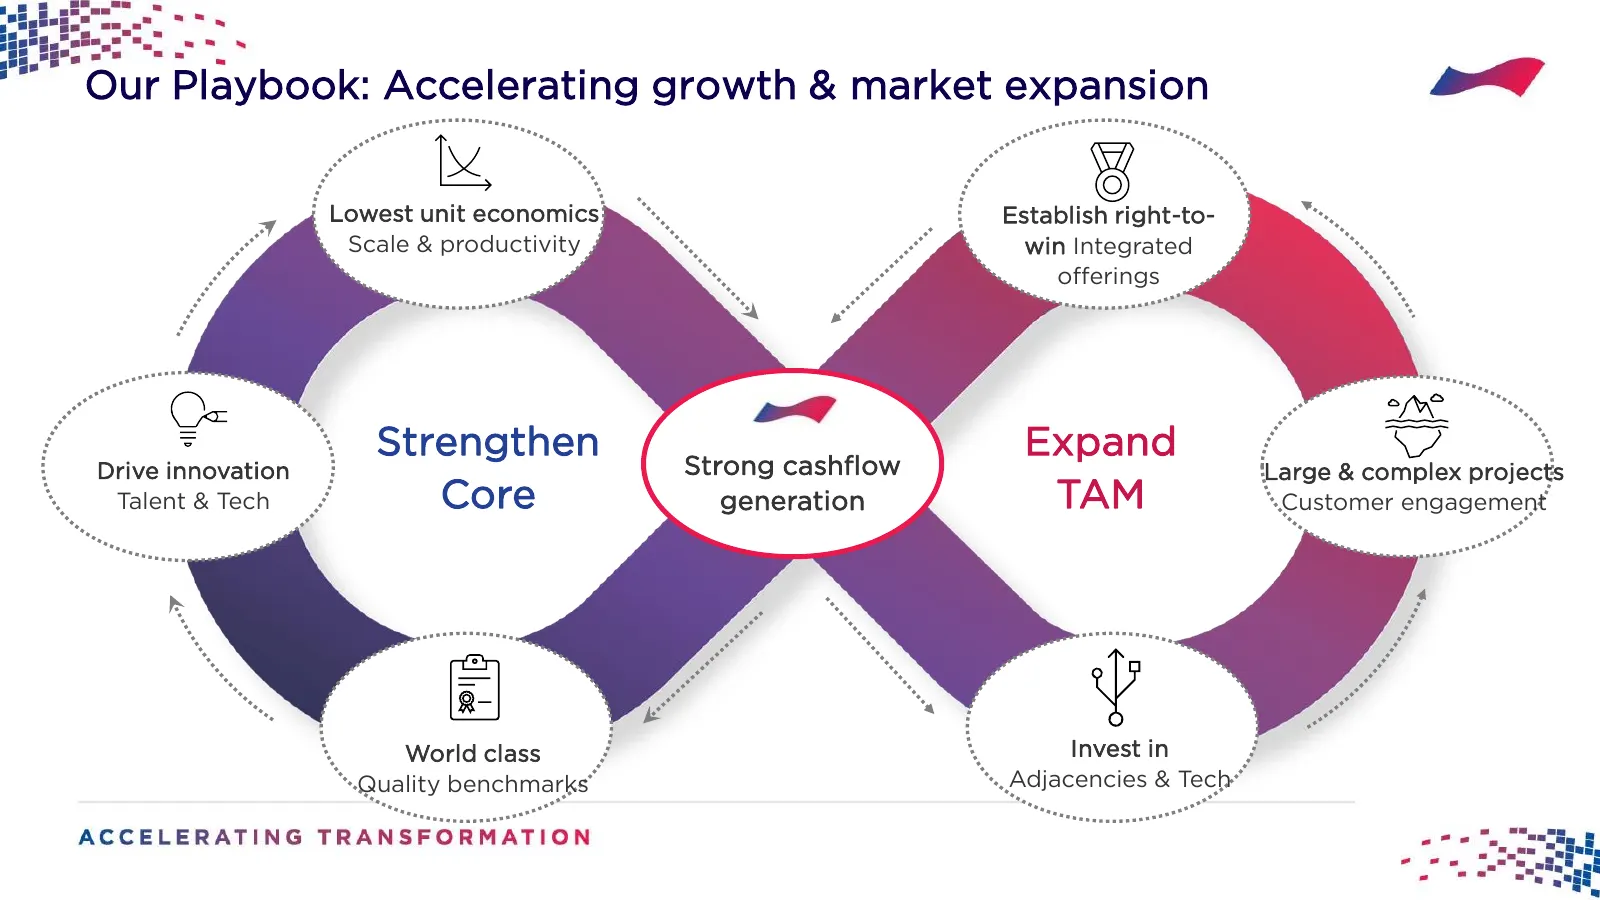
Slide 17: Our Playbook: Accelerating growth & market expansion
Our Playbook: Accelerating growth & market expansion Lowest unit economics Establish right-to- Scale & productivity win Integrated offerings Strengthen Strong cashflow Expand Drive innovation Large & complex projects Talent & Tech Core generation TAM Customer engagement World class Invest in Quality
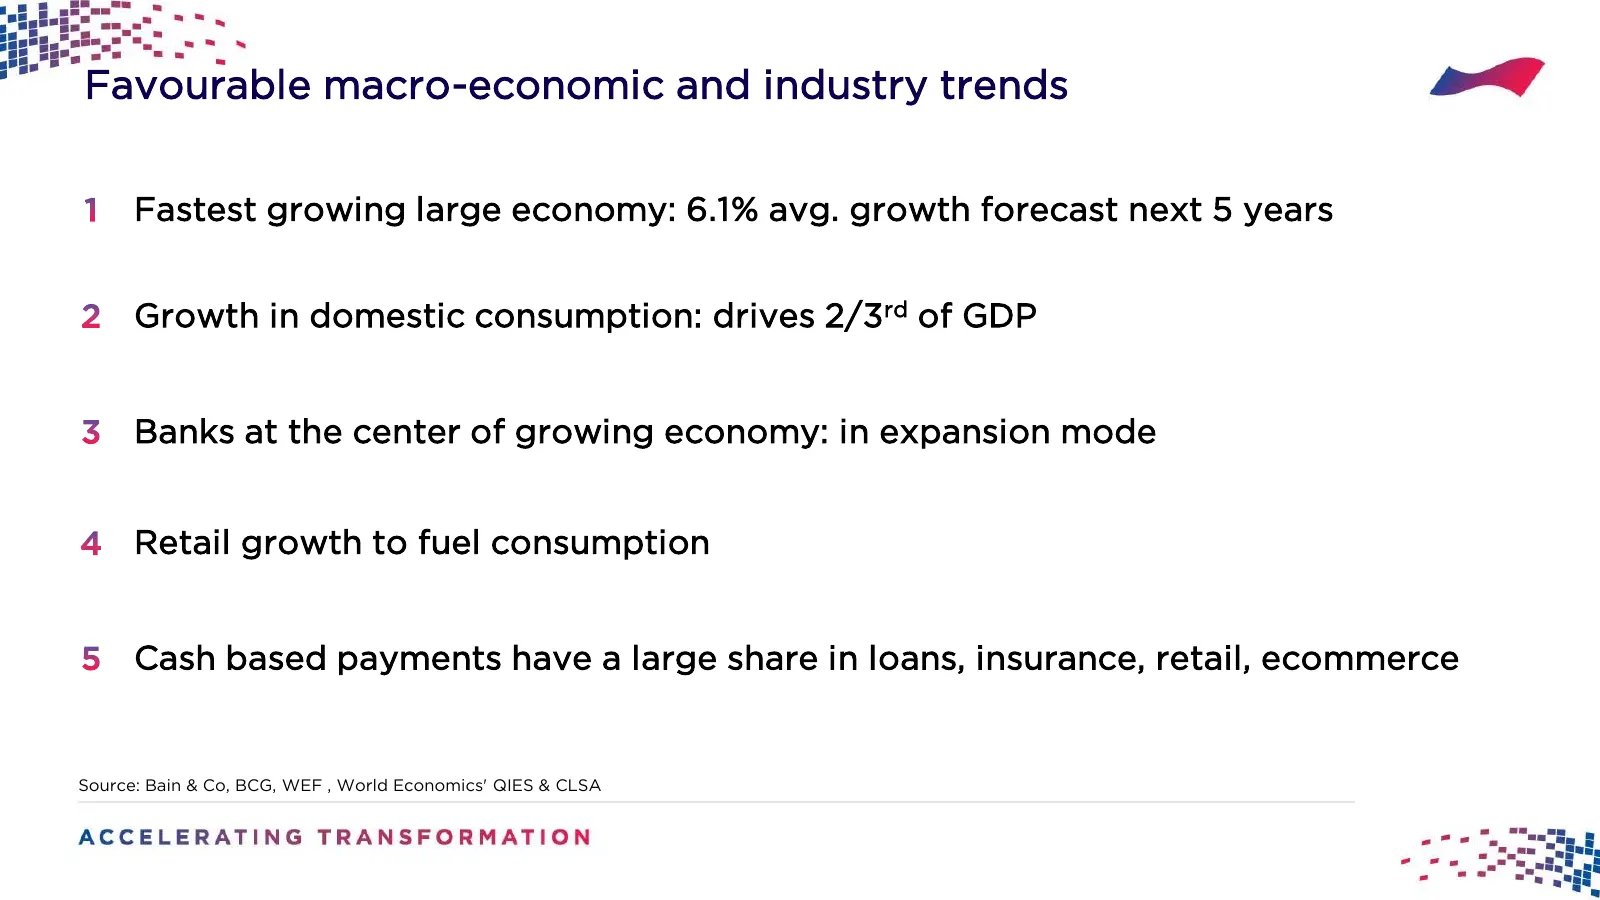
Slide 18: Favourable macro-economic and industry trends
Favourable macro-economic and industry trends Fastest growing large economy: 6.1% avg. growth forecast next 5 years Growth in domestic consumption: drives 2/3rd of GDP Banks at the center of growing economy: in expansion mode Retail growth to fuel consumption Cash based payments have a large share i
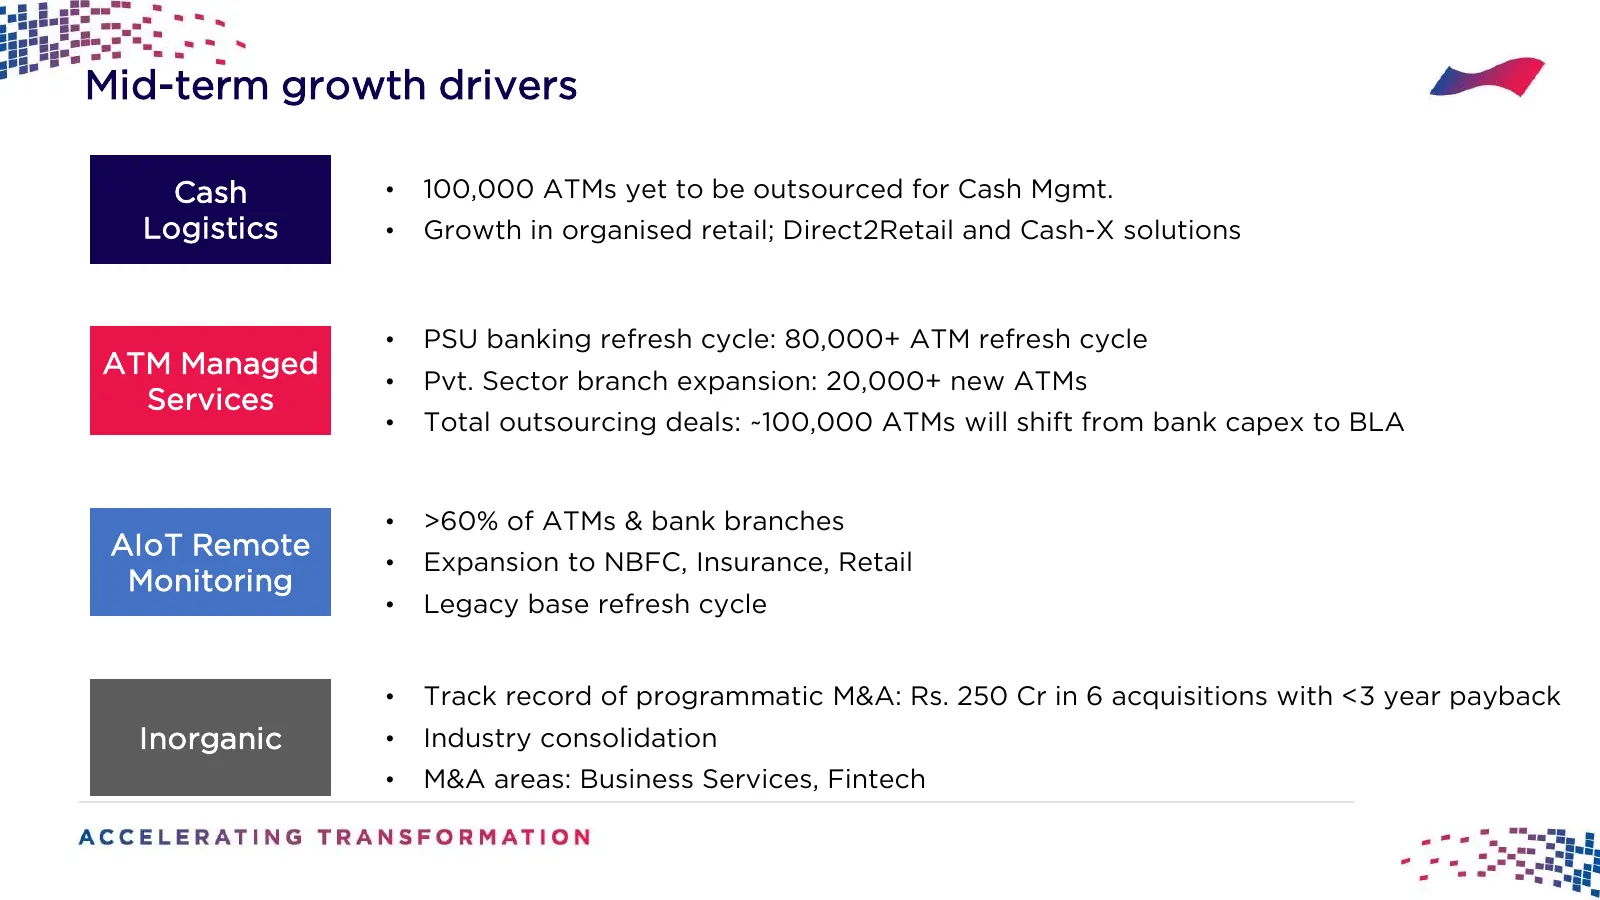
Slide 19: Mid-term growth drivers
Mid-term growth drivers Cash • 100,000 ATMs yet to be outsourced for Cash Mgmt. Logistics • Growth in organised retail; Direct2Retail and Cash-X solutions • PSU banking refresh cycle: 80,000+ ATM refresh cycle ATM Managed • Pvt. Sector branch expansion: 20,000+ new ATMs Services • Total outsourcing
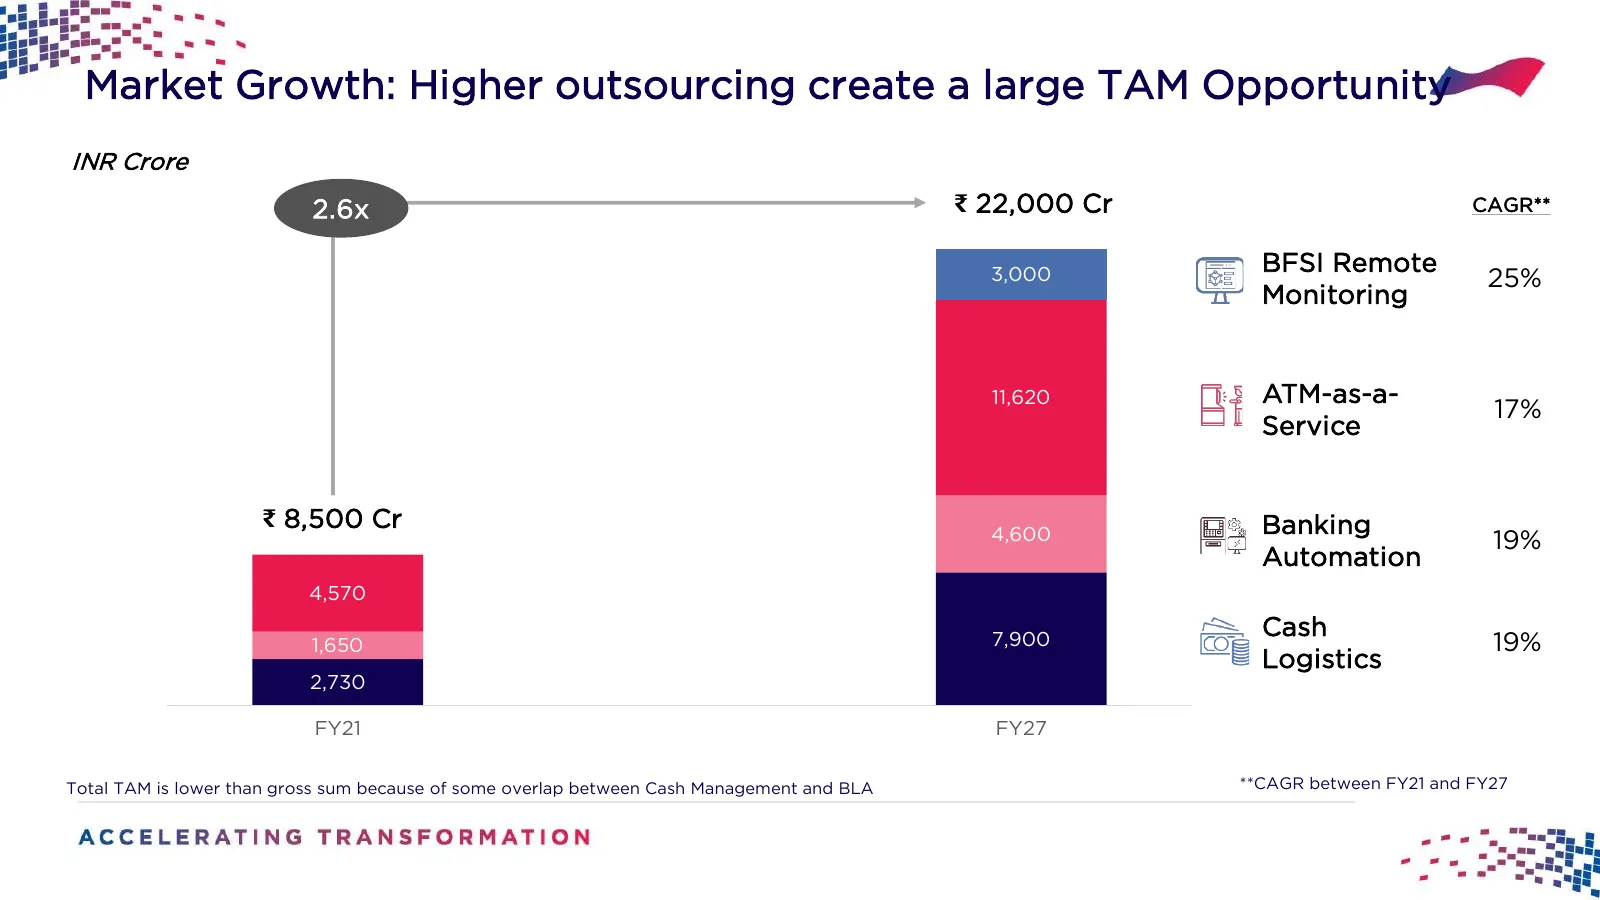
Slide 20: Market Growth: Higher outsourcing create a large TAM Opportunity
Market Growth: Higher outsourcing create a large TAM Opportunity INR Crore 2.6x ₹ 22,000 Cr CAGR** BFSI Remote 3,000 25% Monitoring 11,620 ATM-as-a- 17% Service ₹ 8,500 Cr Banking 4,600 19% 6,200-6,500 Automation 4,570 1,800-2,000 Cash 1,650 7,900 19% 3,500-3,700 Logistics 2,730 FY21 FY27 Total TAM
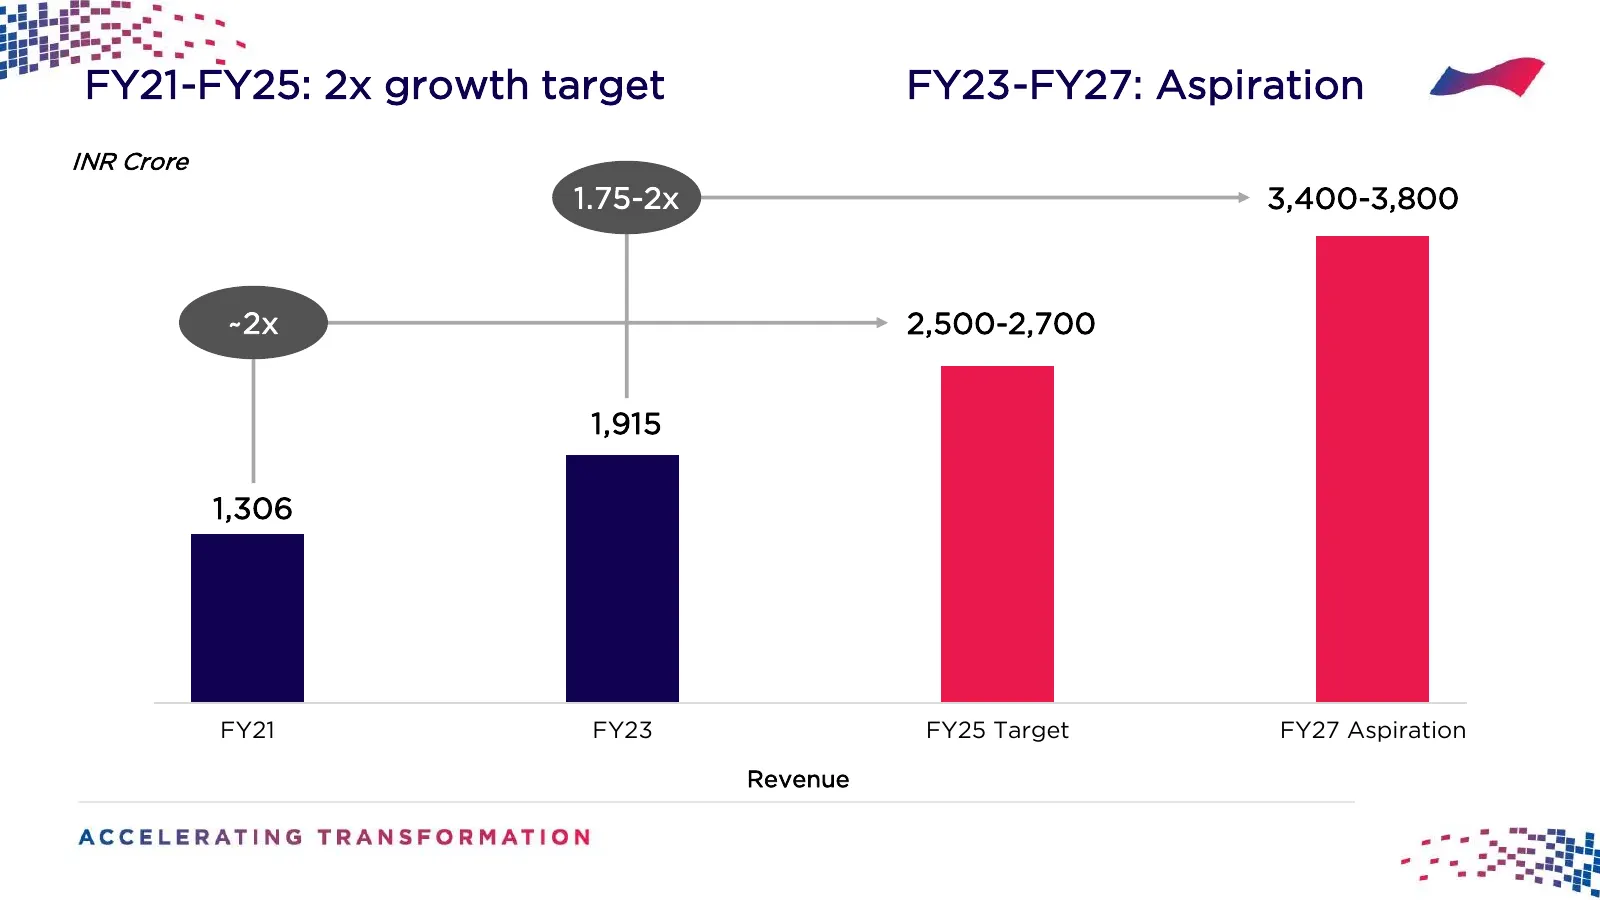
Slide 21: FY21-FY25: 2x growth target FY23-FY27: Aspiration
FY21-FY25: 2x growth target FY23-FY27: Aspiration INR Crore 4,000 1.75-2x 3,400-3,800 3,500 3,000 ~2x 2,500-2,700 2,500 1,915 2,000 1,500 1,306 1,000 500 0 FY21 FY23 FY25 Target FY27 Aspiration Revenue
Slide 22: Thank You
Thank You Disclaimer: No representation or warranty, express or implied, is made as to, and no reliance should be placed on the fairness, accuracy, completeness or correctness of the information or opinions contained in this presentation. Such information and opinions are in all events not current a
Source: Internet Archive copy of cms.com
More decks from CMS Info Systems Ltd.
 Q2 FY27 Earnings Presentation27 slides · Nov 13, 2026
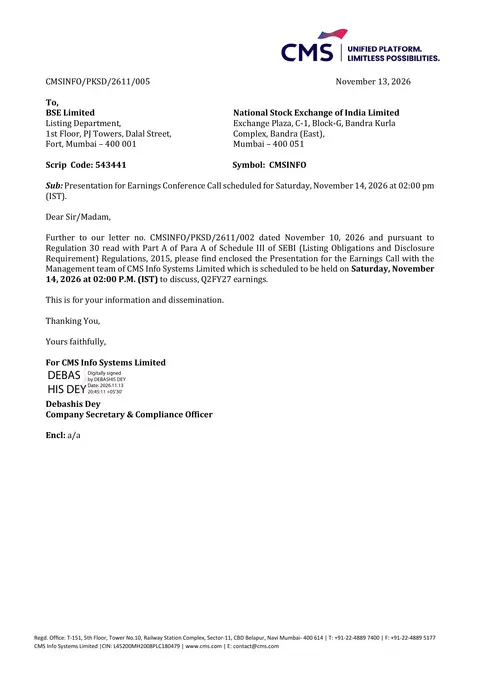 Q2 FY27 Earnings Presentation28 slides · Nov 13, 2026
 Q1 FY27 Earnings Presentation24 slides · Aug 11, 2026
 Q1 FY2027 Earnings Presentation23 slides · Aug 10, 2026
 Q1 FY27 Earnings Presentation23 slides · Aug 10, 2026
 Q4 FY2026 Earnings Presentation30 slides · May 14, 2026