CMS Info Systems Ltd. · NSE:CMSINFO
CMS Info Systems — Q2 FY27 Earnings Presentation
27 slides from CMS Info Systems's earnings presentation, Nov 13, 2026
Slide 1: Q2FY27 Earnings Presentation
CMS INFO SYSTEMS LIMITED Q2FY27 Earnings Presentation Where Platform Meets Possibilities 13th Nov 2026 cms.com
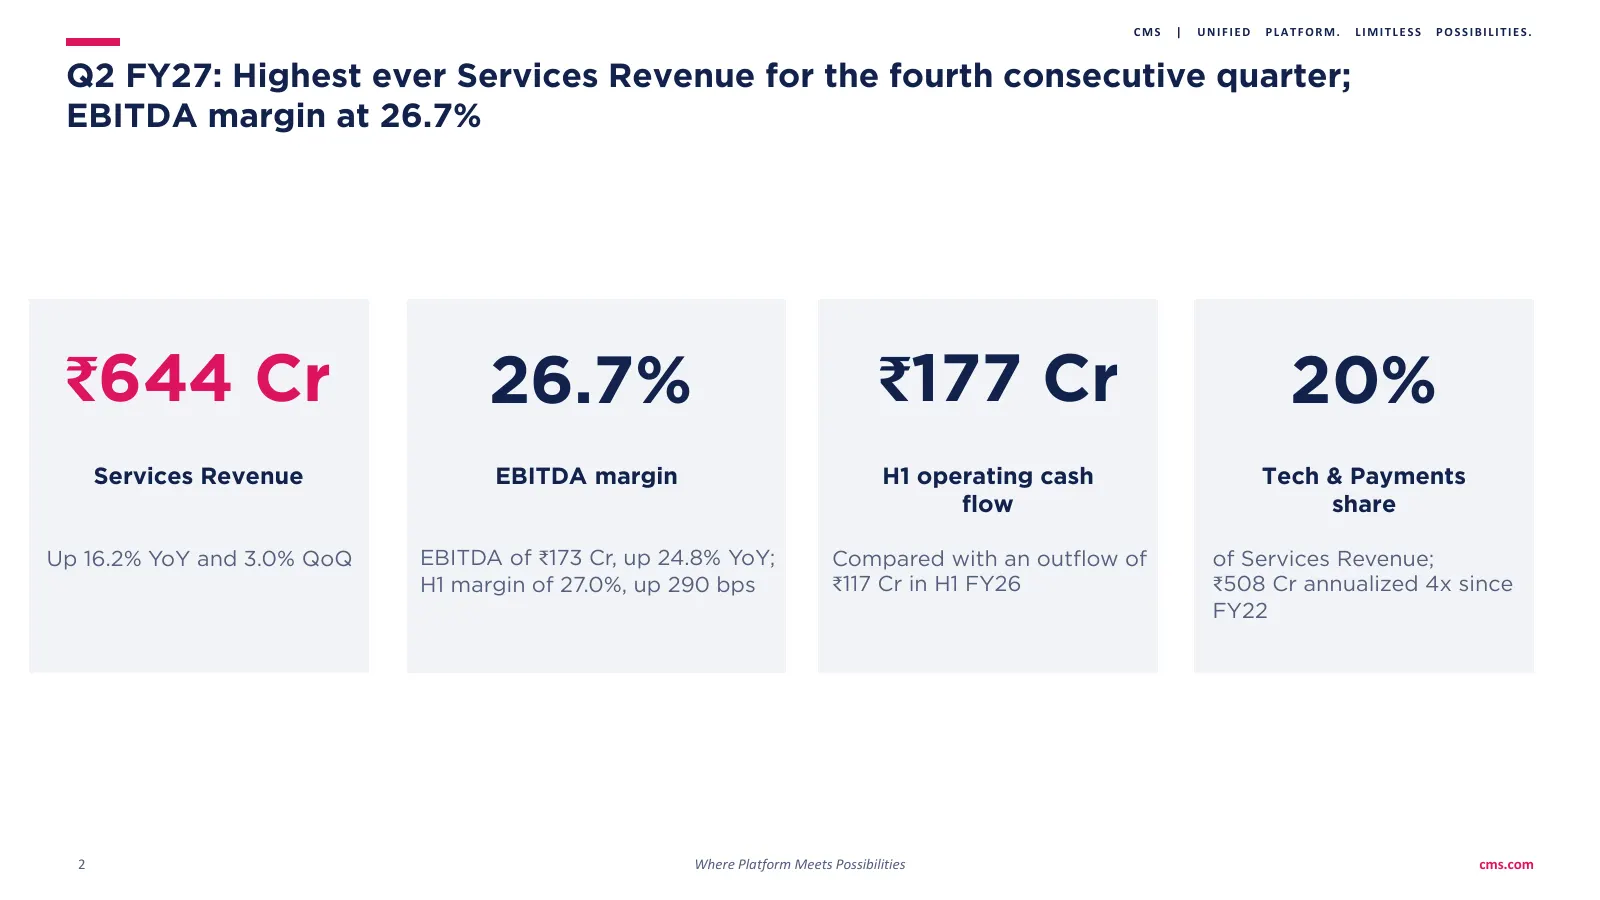
Slide 2: Q2 FY27: Highest ever Services Revenue; EBITDA margin at 26.7%
CMS | UNIFIED PLATFORM. LIMITLESS POSSIBILITIES. Q2 FY27: Highest ever Services Revenue for the fourth consecutive quarter; EBITDA margin at 26.7% ₹644 Cr 26.7% ₹177 Cr 20% Services Revenue EBITDA margin H1 operating cash Tech & Payments flow share Up 16.2% YoY and 3.0% QoQ EBITDA of ₹173 Cr, up 24.
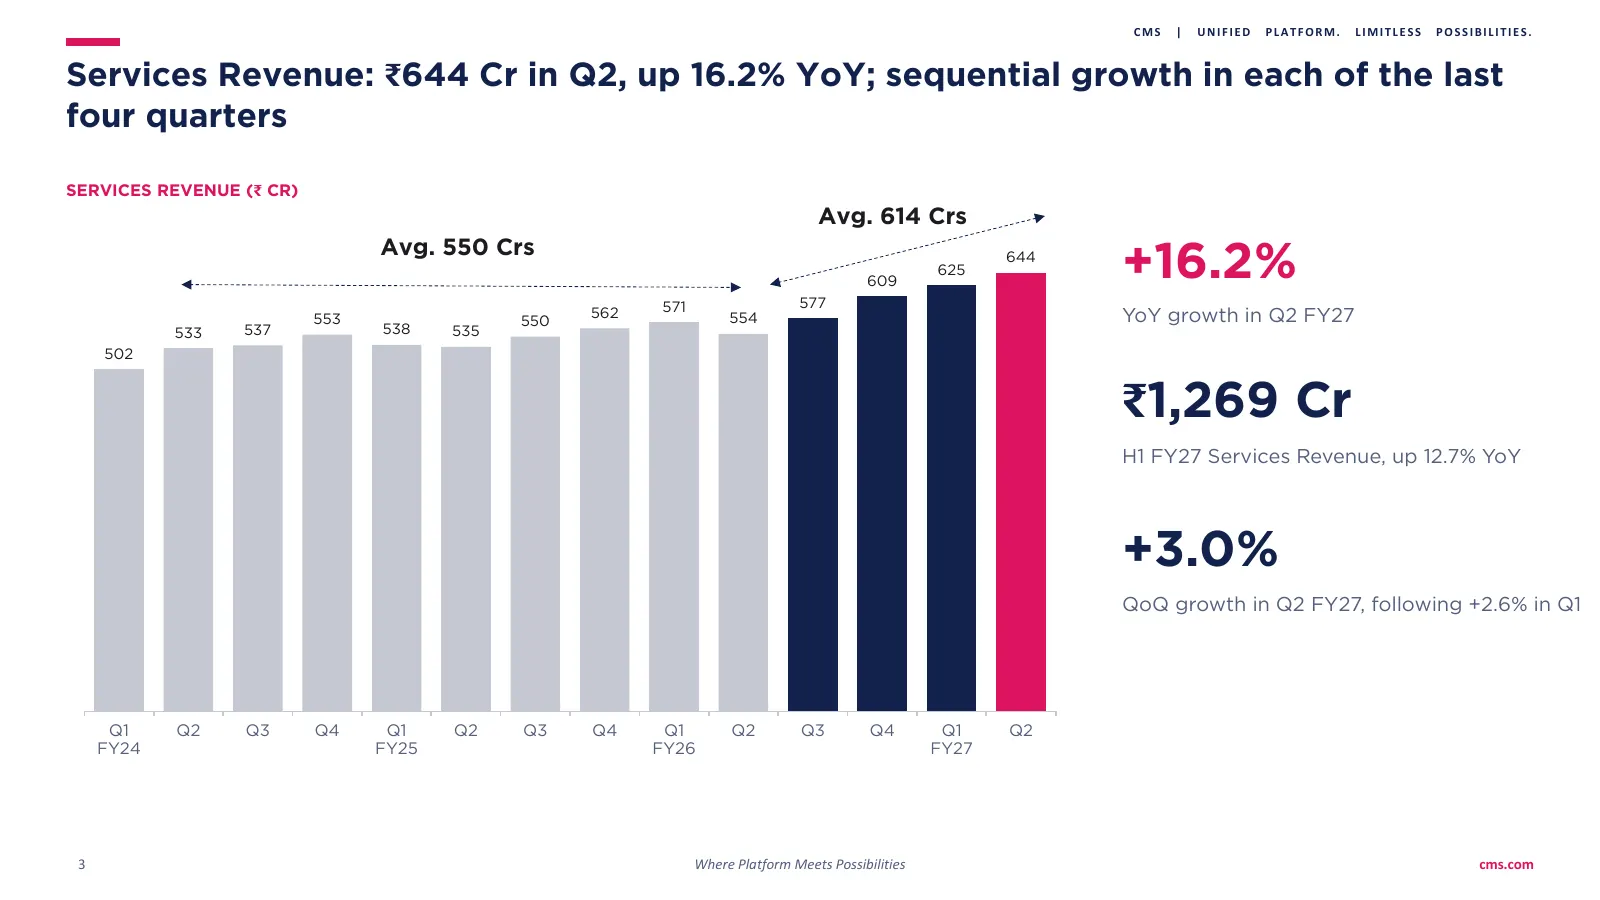
Slide 3: Services Revenue: ₹644 Cr in Q2, up 16.2% YoY
CMS | UNIFIED PLATFORM. LIMITLESS POSSIBILITIES. Services Revenue: ₹644 Cr in Q2, up 16.2% YoY; sequential growth in each of the last four quarters SERVICES REVENUE (₹ CR) Avg. 614 Crs Avg. 550 Crs 609 625 644 +16.2% 571 577 553 550 562 554 YoY growth in Q2 FY27 533 537 538 535 502 ₹1,269 Cr H1 FY27
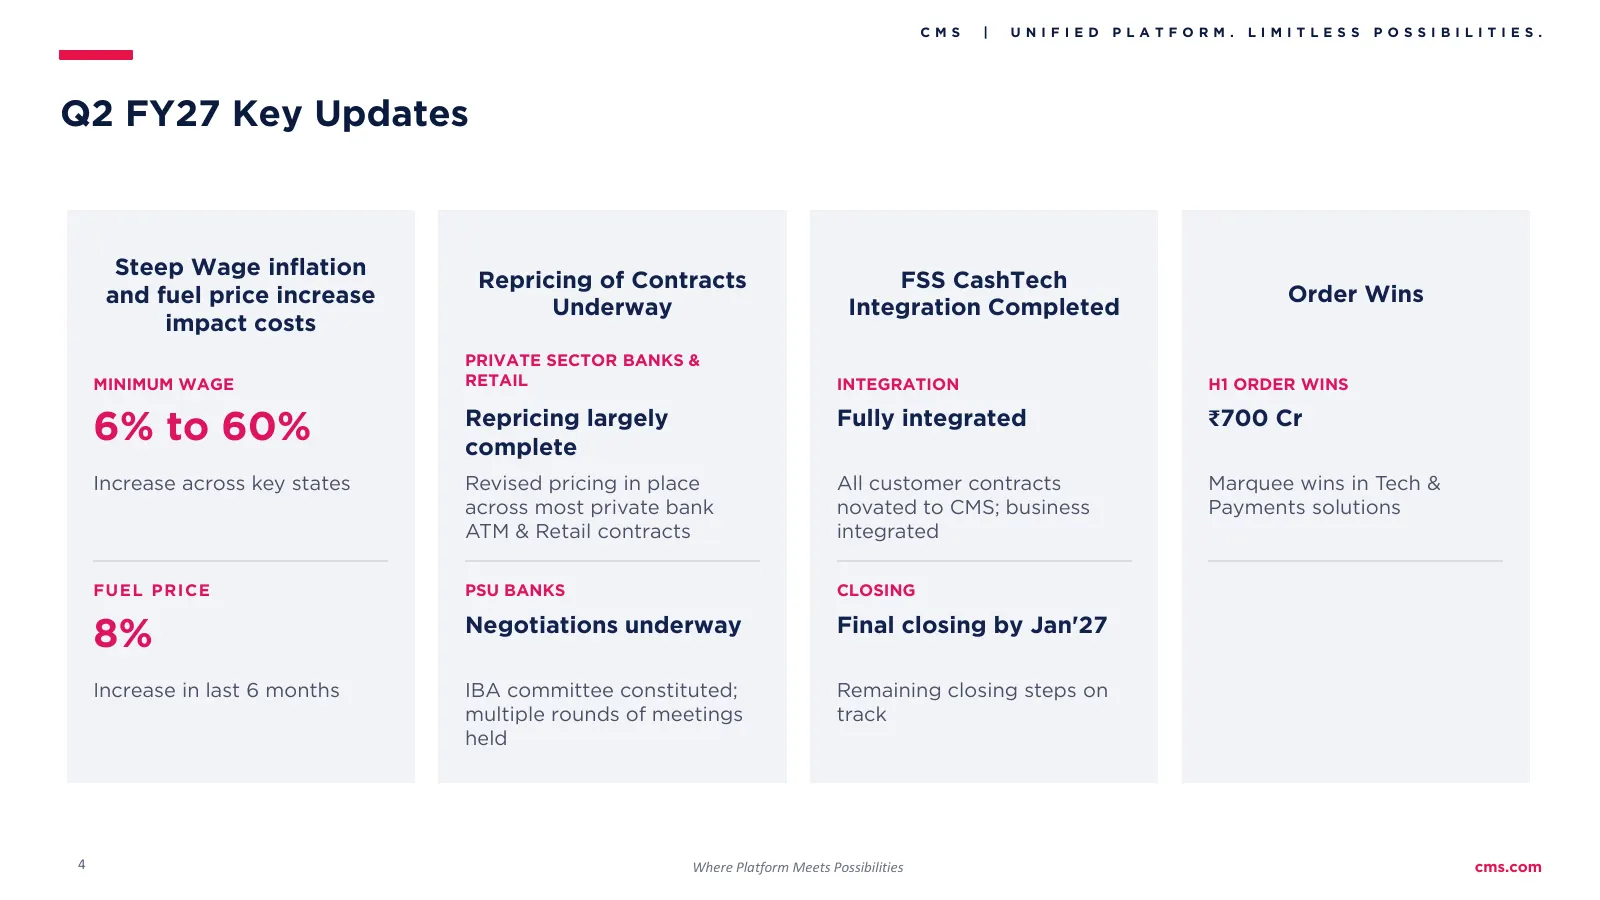
Slide 4: Q2 FY27 Key Updates
CMS | UNIFIED PLATFORM. LIMITLESS POSSIBILITIES. Q2 FY27 Key Updates Steep Wage inflation Repricing of Contracts FSS CashTech and fuel price increase Order Wins Underway Integration Completed impact costs PRIVATE SECTOR BANKS & MINIMUM WAGE RETAIL INTEGRATION H1 ORDER WINS 6% to 60% Repricing largel
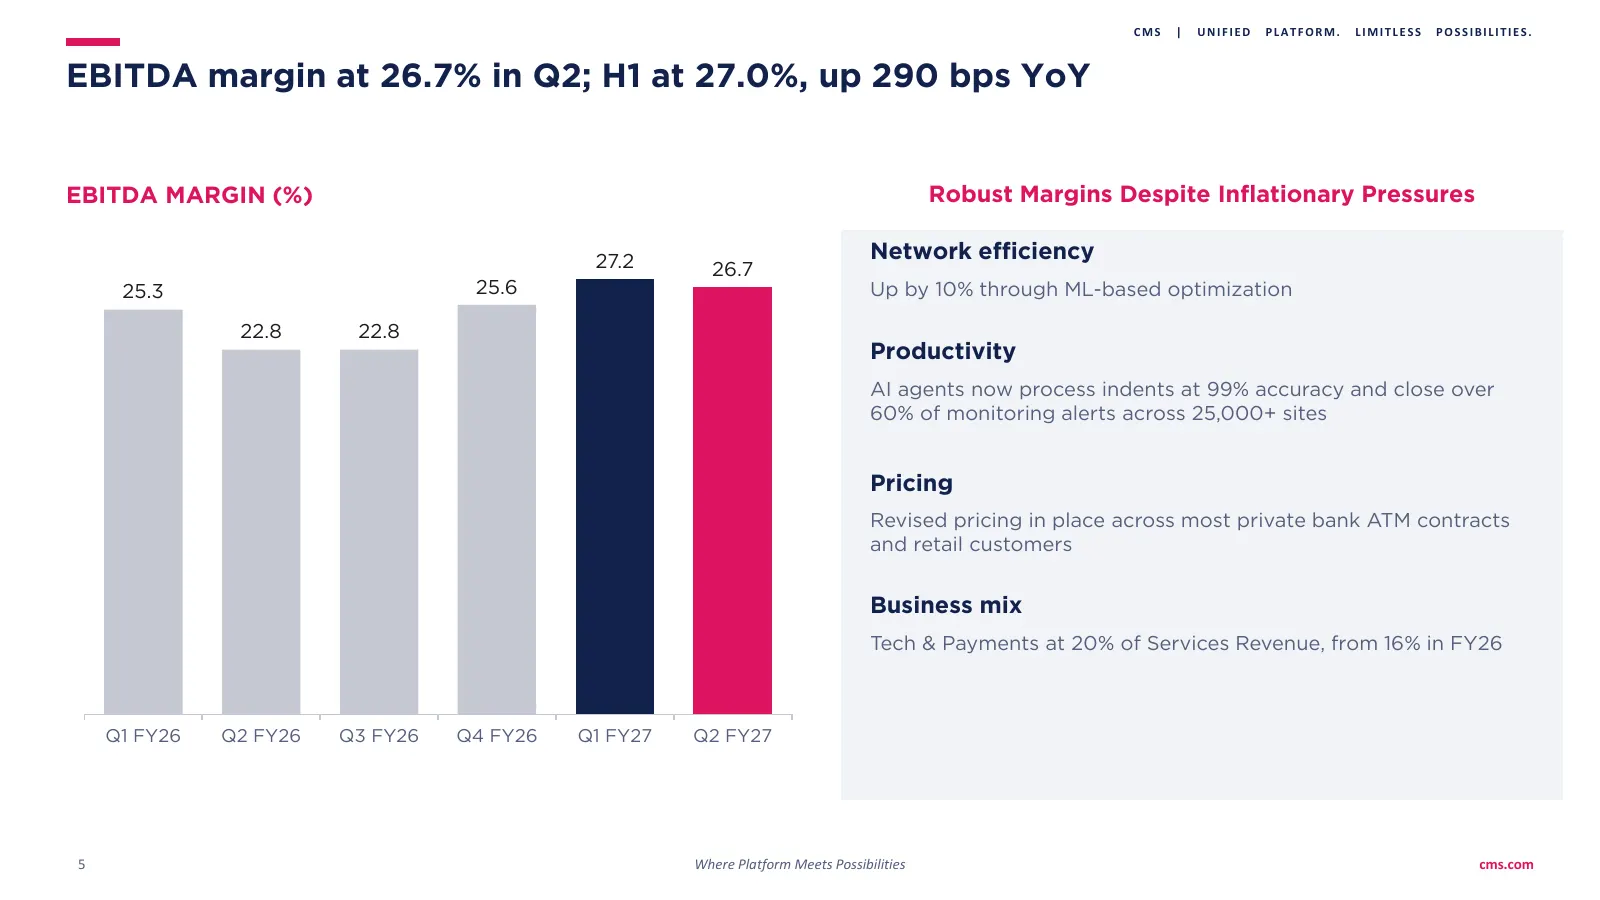
Slide 5: EBITDA margin at 26.7% in Q2; H1 at 27.0%, up 290 bps YoY
CMS | UNIFIED PLATFORM. LIMITLESS POSSIBILITIES. EBITDA margin at 26.7% in Q2; H1 at 27.0%, up 290 bps YoY EBITDA MARGIN (%) Robust Margins Despite Inflationary Pressures 27.2 Network efficiency 26.7 25.3 25.6 Up by 10% through ML-based optimization 22.8 22.8 Productivity AI agents now process inden
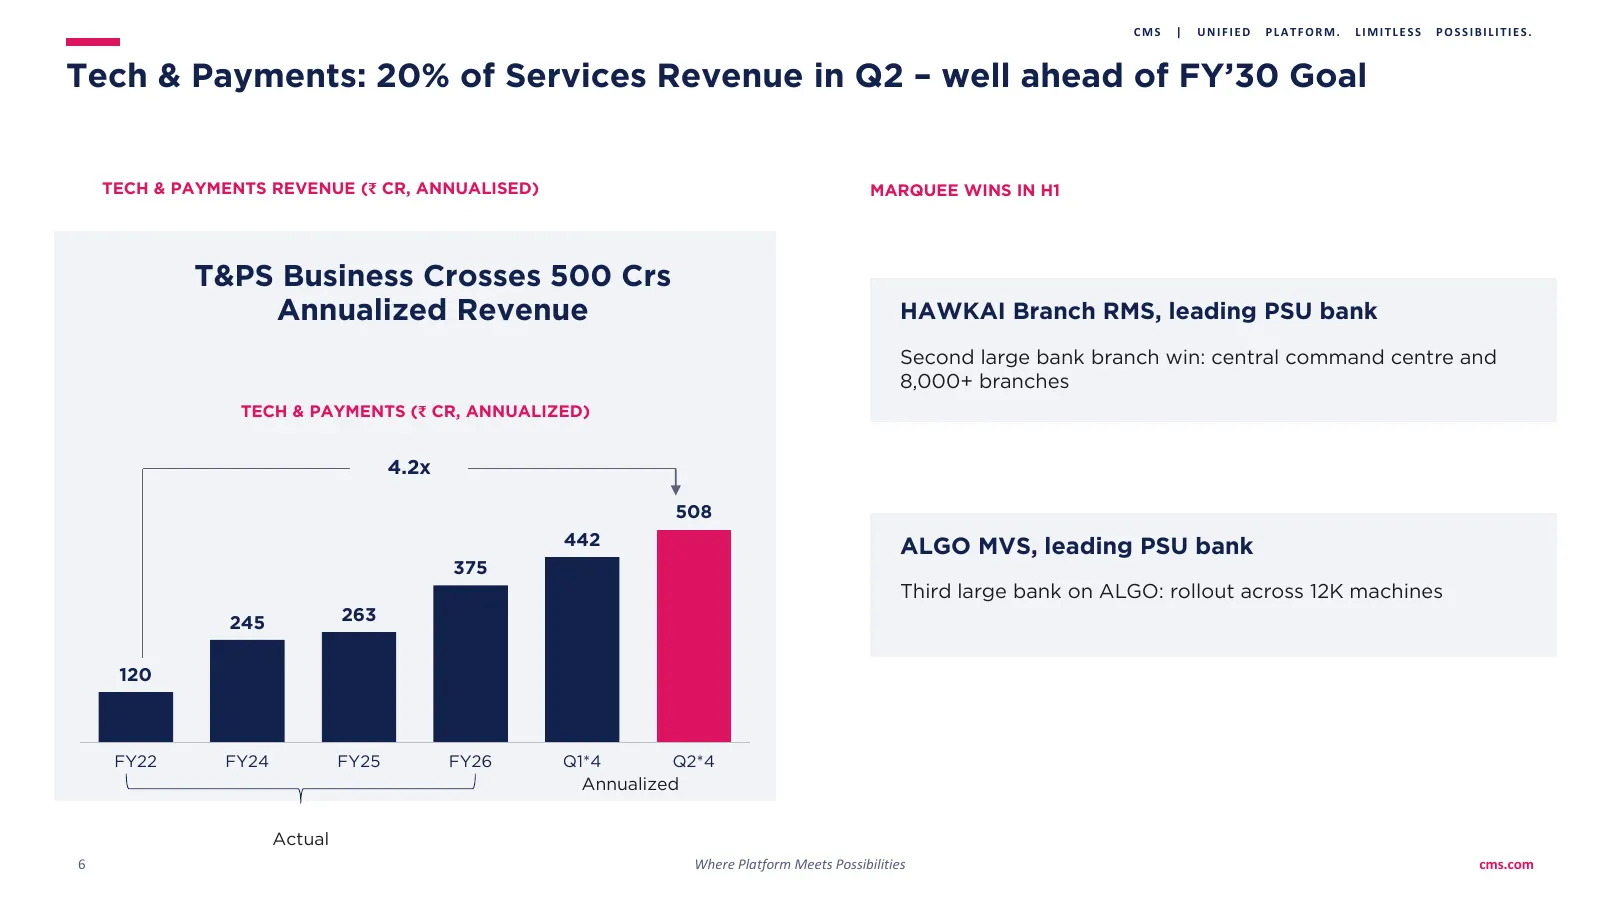
Slide 6: Tech & Payments: 20% of Services Revenue in Q2
CMS | UNIFIED PLATFORM. LIMITLESS POSSIBILITIES. Tech & Payments: 20% of Services Revenue in Q2 – well ahead of FY’30 Goal TECH & PAYMENTS REVENUE (₹ CR, ANNUALISED) MARQUEE WINS IN H1 T&PS Business Crosses 500 Crs Annualized Revenue HAWKAI Branch RMS, leading PSU bank Second large bank branch win:
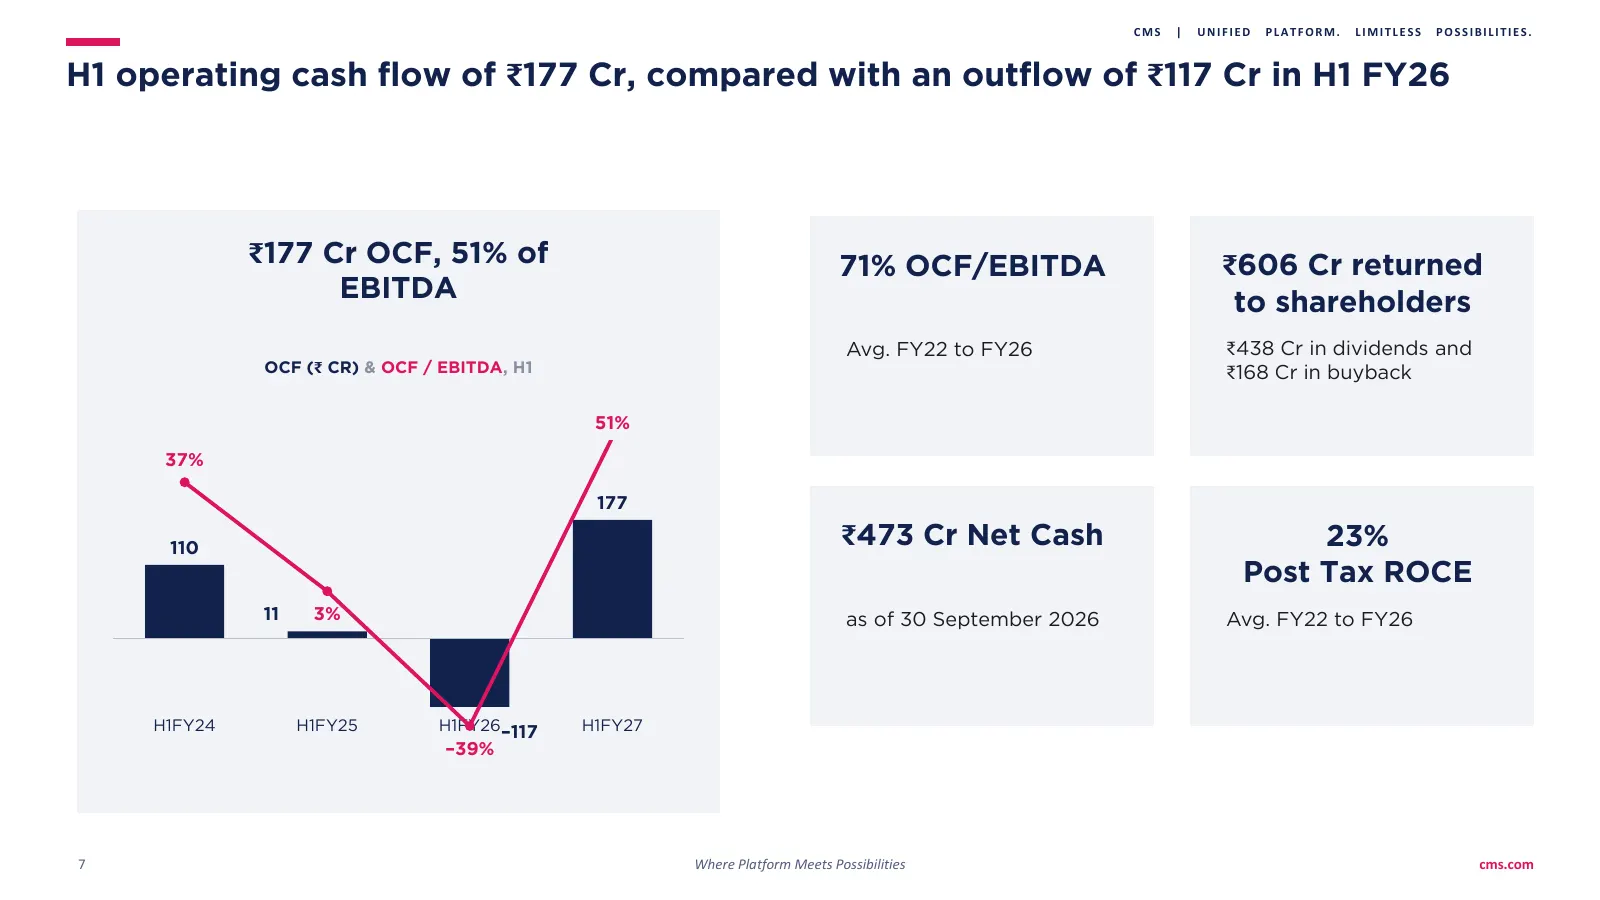
Slide 7: H1 operating cash flow of ₹177 Cr, compared with an outflow of ₹117 Cr
CMS | UNIFIED PLATFORM. LIMITLESS POSSIBILITIES. H1 operating cash flow of ₹177 Cr, compared with an outflow of ₹117 Cr in H1 FY26 ₹177 Cr OCF, 51% of 71% OCF/EBITDA ₹606 Cr returned EBITDA to shareholders Avg. FY22 to FY26 ₹438 Cr in dividends and OCF (₹ CR) & OCF / EBITDA, H1 ₹168 Cr in buyback 51
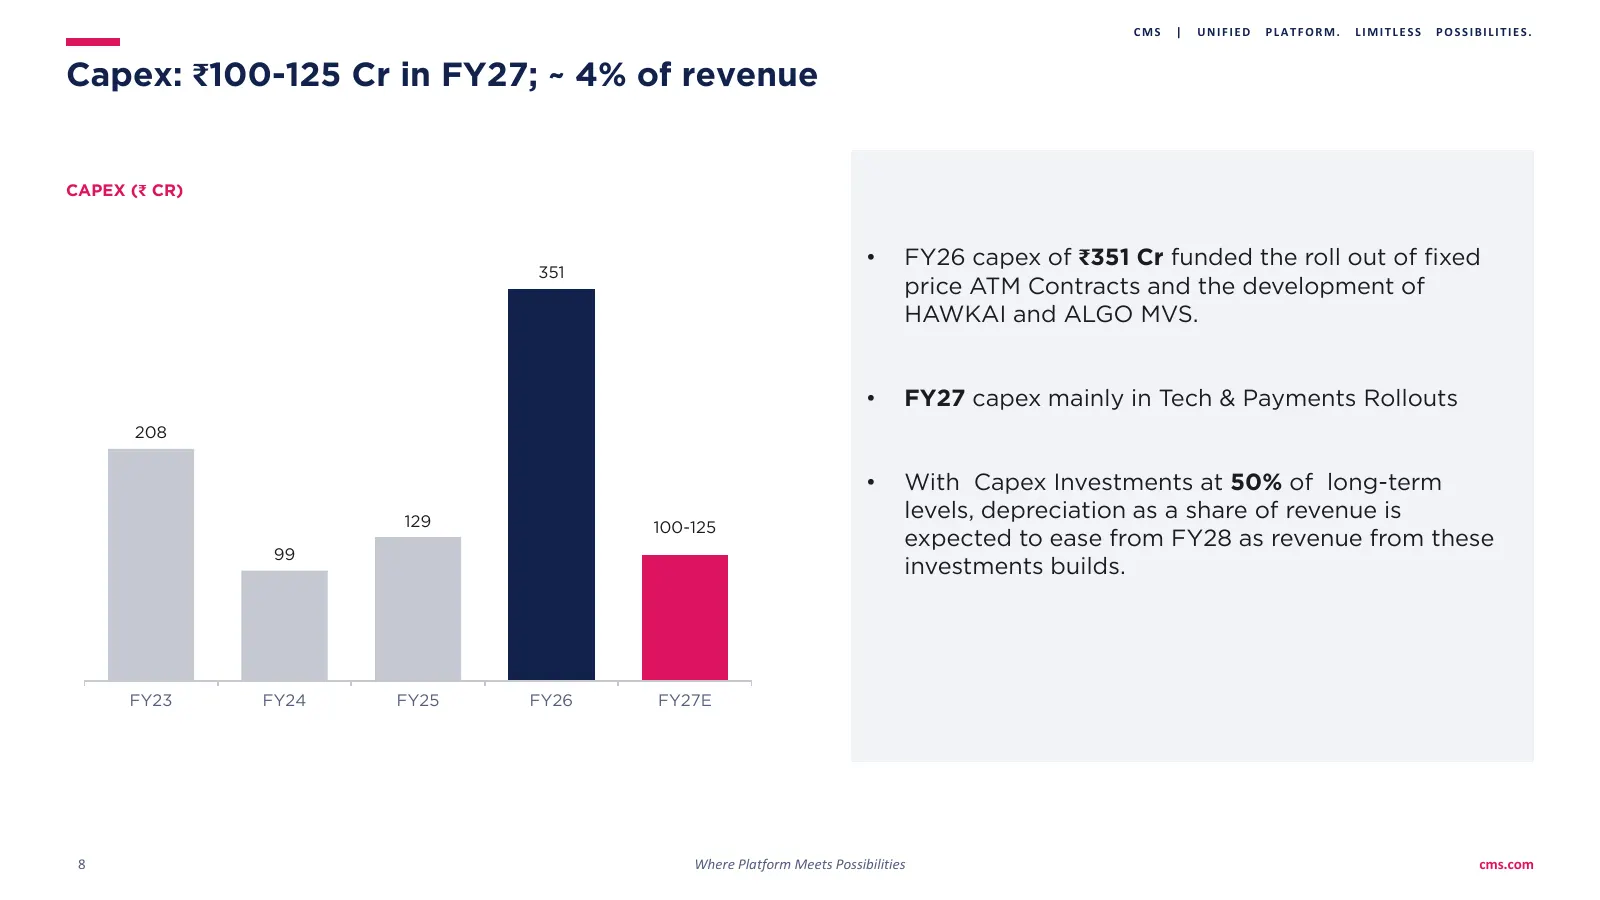
Slide 8: Capex: ₹100-125 Cr in FY27; ~4% of revenue
CMS | UNIFIED PLATFORM. LIMITLESS POSSIBILITIES. Capex: ₹100-125 Cr in FY27; ~ 4% of revenue CAPEX (₹ CR) • FY26 capex of ₹351 Cr funded the roll out of fixed 351 price ATM Contracts and the development of HAWKAI and ALGO MVS. • FY27 capex mainly in Tech & Payments Rollouts 208 • With Capex Investme
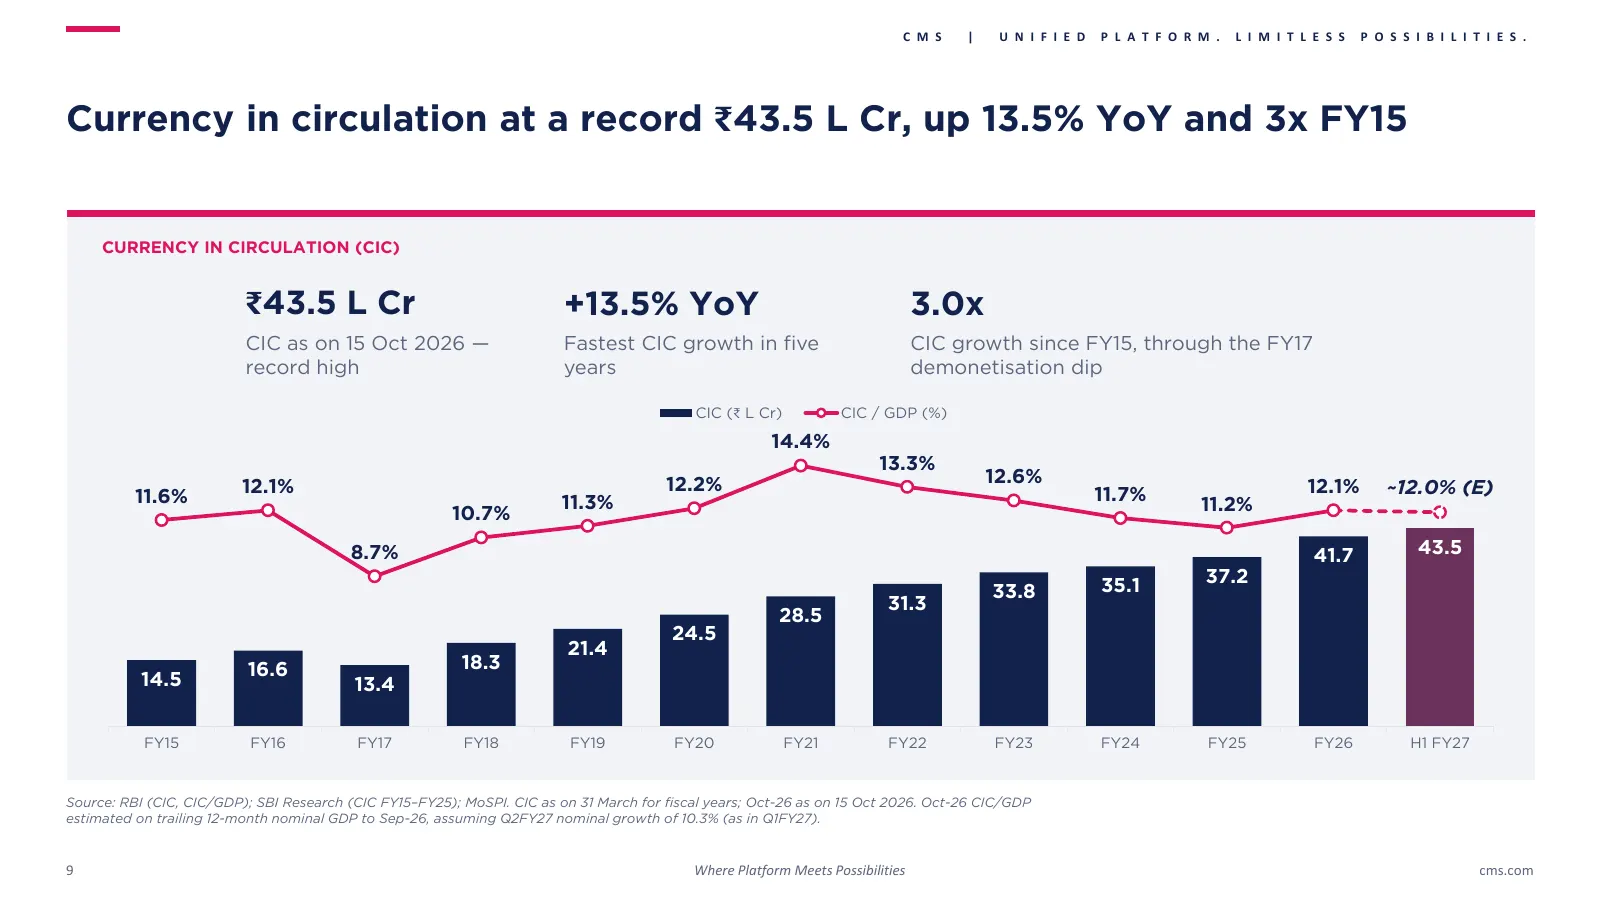
Slide 9: Currency in circulation at a record ₹43.5 L Cr
C M S | U N I F I E D P L A T F O R M . L I M I T L E S S P O S S I B I L I T I E S . Currency in circulation at a record ₹43.5 L Cr, up 13.5% YoY and 3x FY15 CURRENCY IN CIRCULATION (CIC) ₹43.5 L Cr +13.5% YoY 3.0x CIC as on 15 Oct 2026 — Fastest CIC growth in five CIC growth since FY15, through th
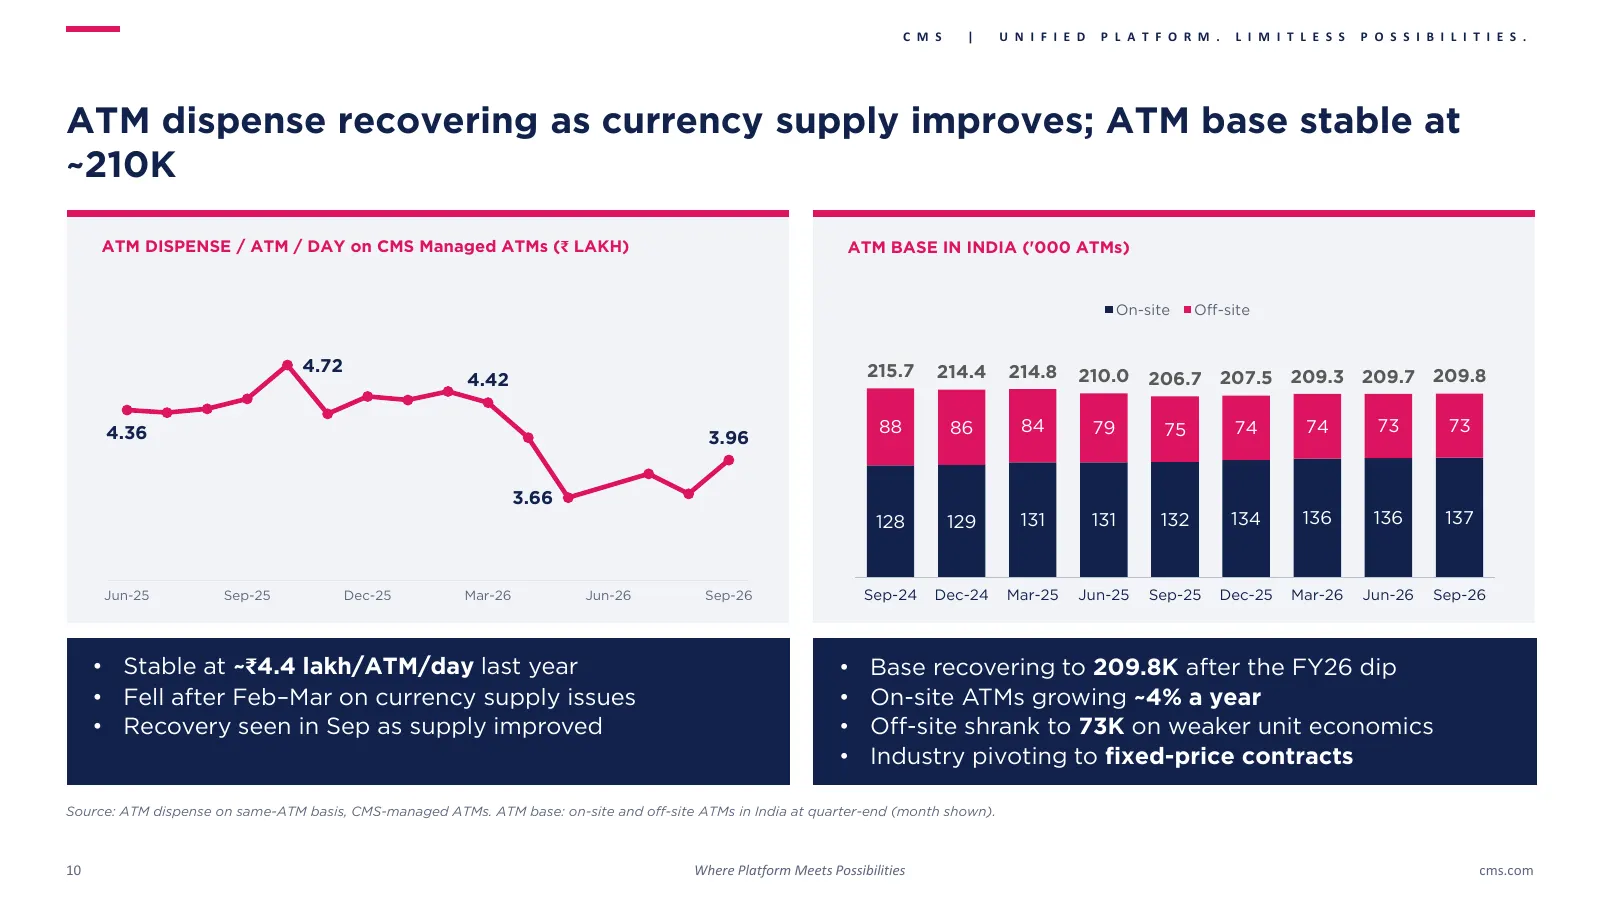
Slide 10: ATM dispense recovering as currency supply improves; ATM base stable at ~210K
C M S | U N I F I E D P L A T F O R M . L I M I T L E S S P O S S I B I L I T I E S . ATM dispense recovering as currency supply improves; ATM base stable at ~210K ATM DISPENSE / ATM / DAY on CMS Managed ATMs (₹ LAKH) ATM BASE IN INDIA ('000 ATMs) On-site Off-site 4.72 215.7 214.4 214.8 4.42 210.0 2
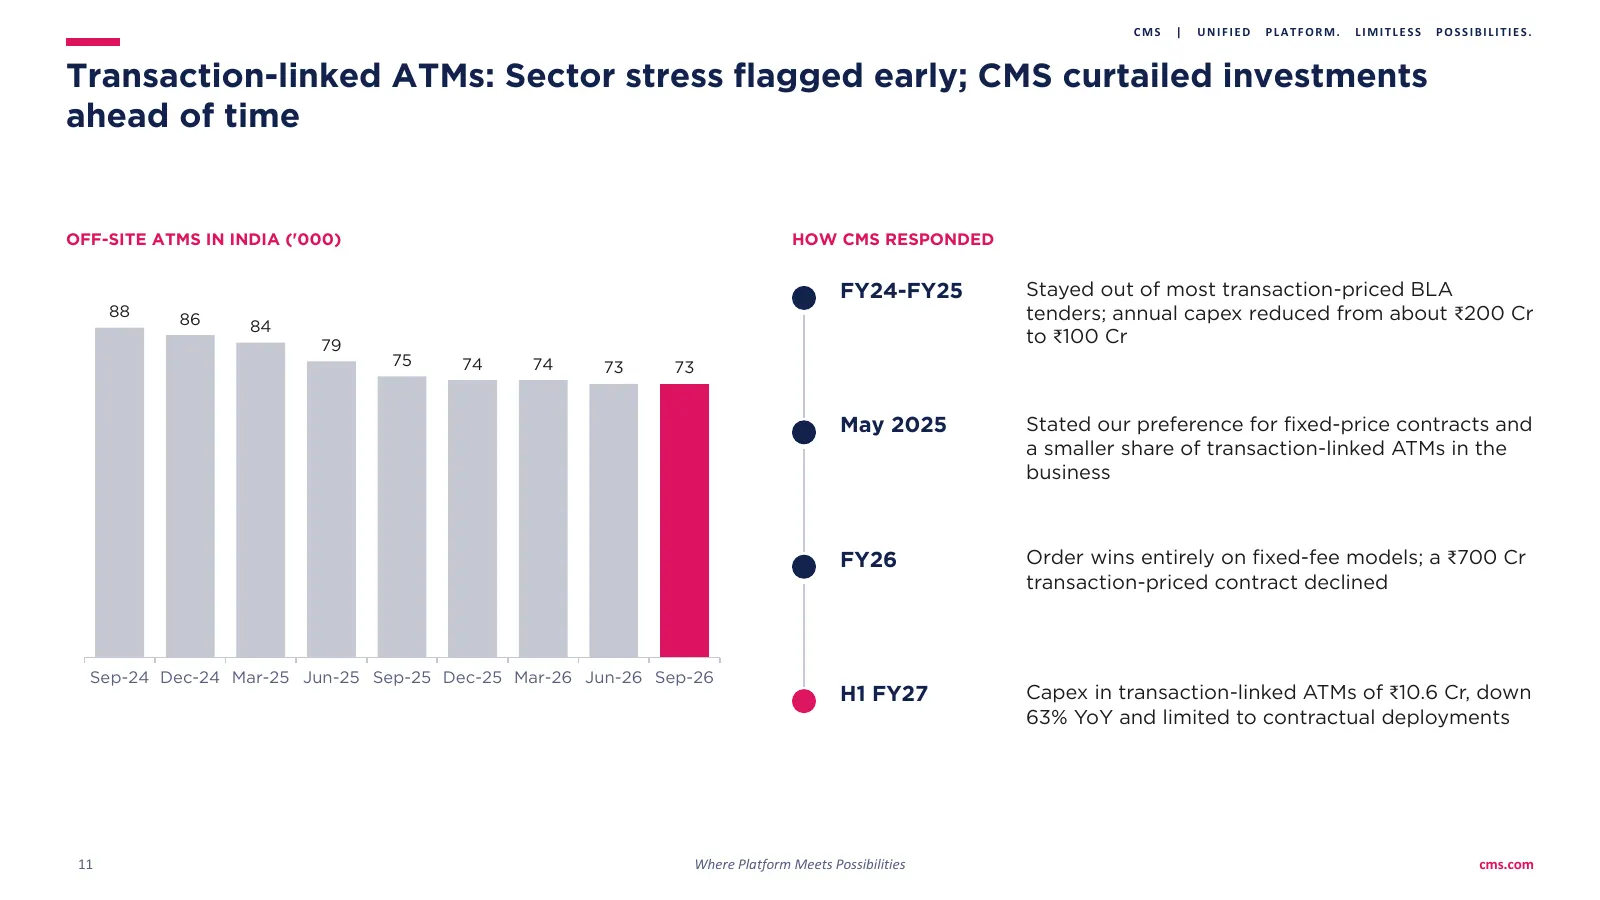
Slide 11: Transaction-linked ATMs: Sector stress flagged early; CMS curtailed investments
CMS | UNIFIED PLATFORM. LIMITLESS POSSIBILITIES. Transaction-linked ATMs: Sector stress flagged early; CMS curtailed investments ahead of time OFF-SITE ATMS IN INDIA ('000) HOW CMS RESPONDED FY24-FY25 Stayed out of most transaction-priced BLA 88 86 tenders; annual capex reduced from about ₹200 Cr 84
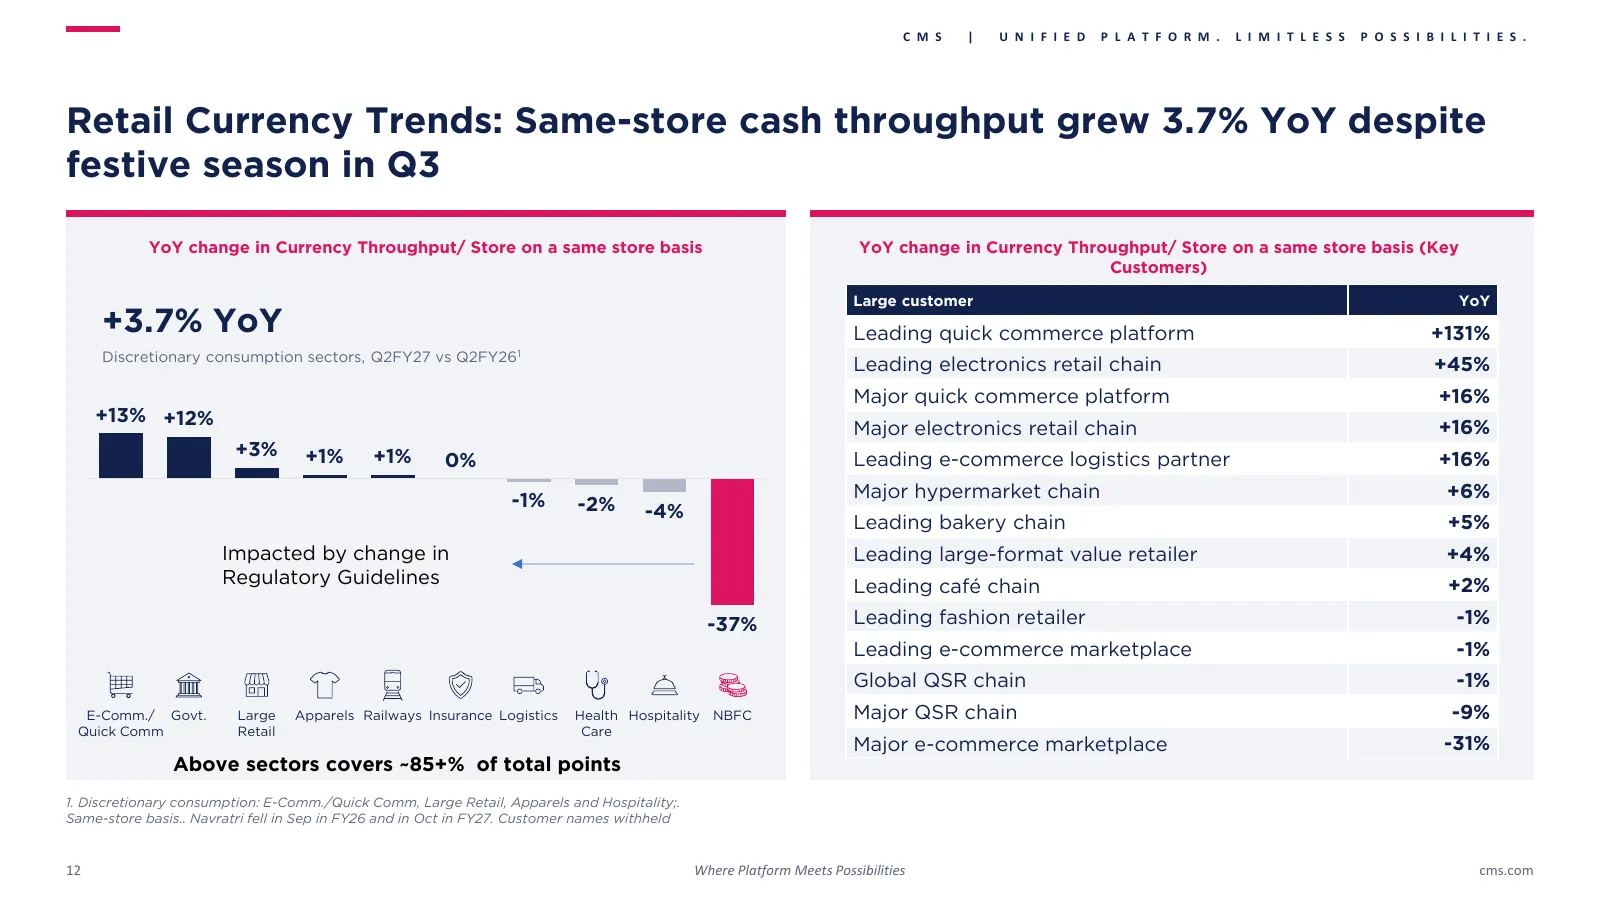
Slide 12: Retail Currency Trends: Same-store cash throughput grew 3.7% YoY
C M S | U N I F I E D P L A T F O R M . L I M I T L E S S P O S S I B I L I T I E S . Retail Currency Trends: Same-store cash throughput grew 3.7% YoY despite festive season in Q3 YoY change in Currency Throughput/ Store on a same store basis YoY change in Currency Throughput/ Store on a same store
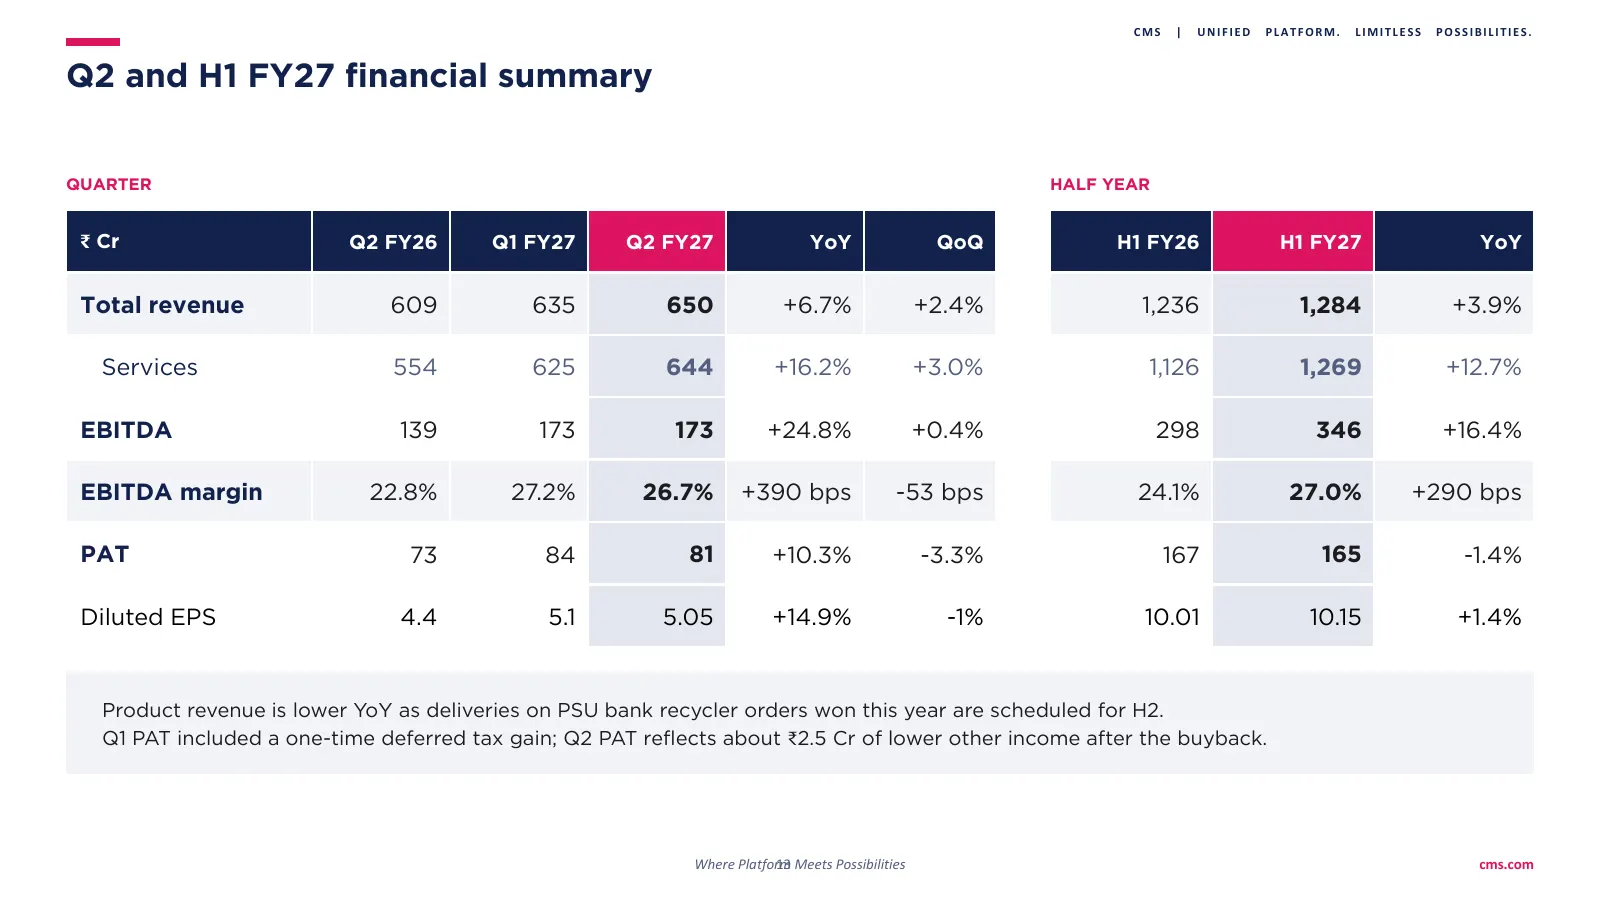
Slide 13: Q2 and H1 FY27 financial summary
CMS | UNIFIED PLATFORM. LIMITLESS POSSIBILITIES. Q2 and H1 FY27 financial summary QUARTER HALF YEAR ₹ Cr Q2 FY26 Q1 FY27 Q2 FY27 YoY QoQ H1 FY26 H1 FY27 YoY Total revenue 609 635 650 +6.7% +2.4% 1,236 1,284 +3.9% Services 554 625 644 +16.2% +3.0% 1,126 1,269 +12.7% EBITDA 139 173 173 +24.8% +0.4% 29
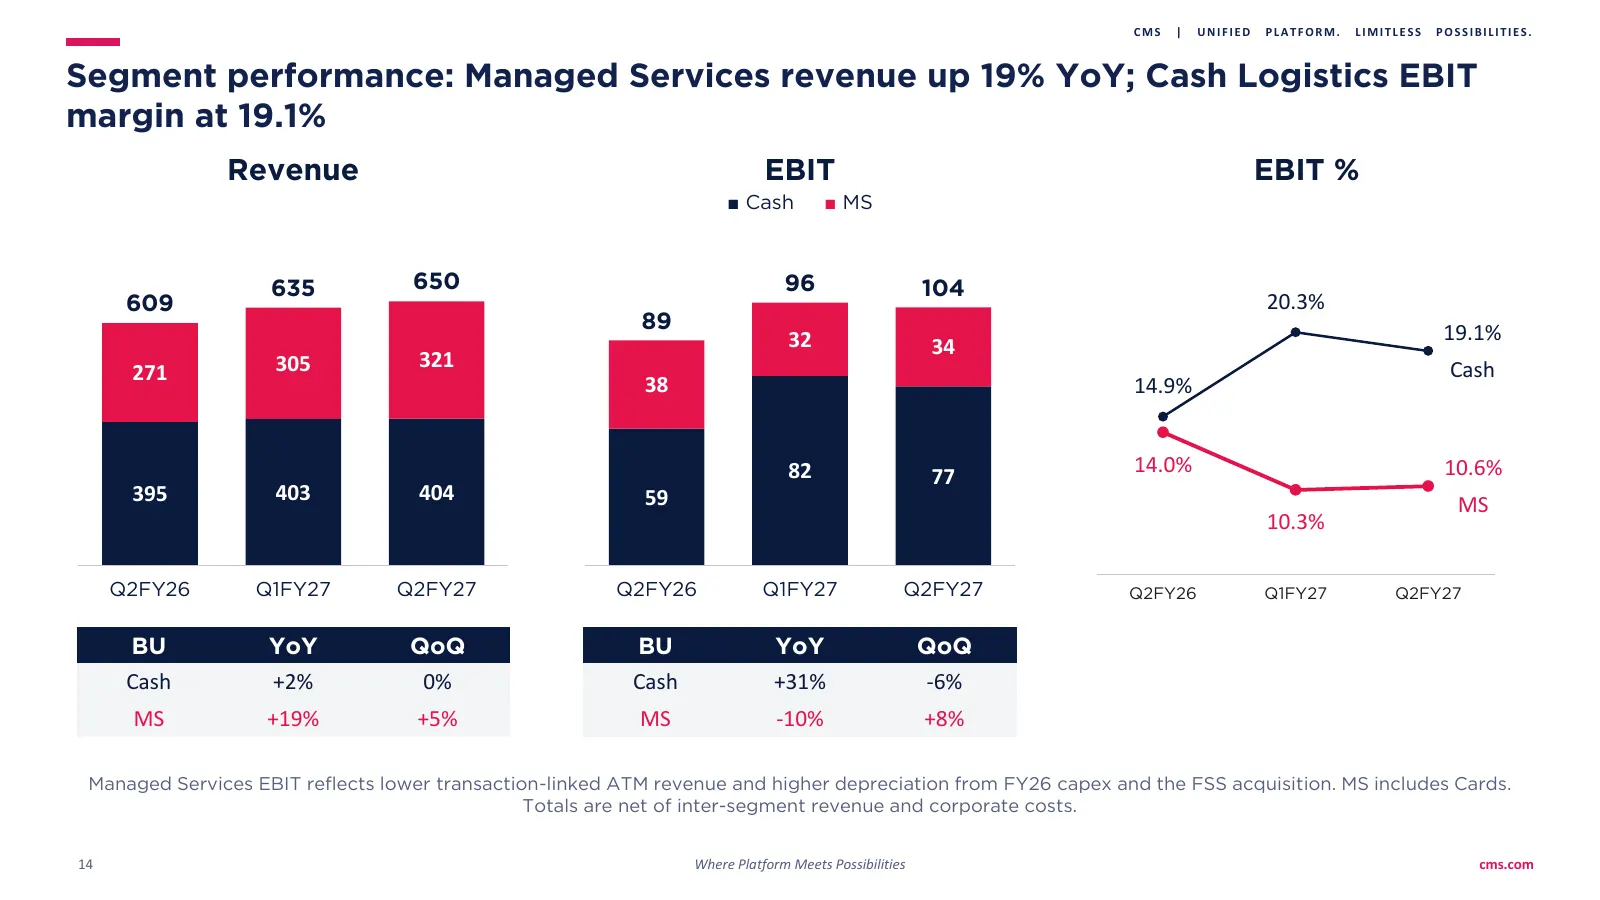
Slide 14: Segment performance: Managed Services revenue up 19% YoY
CMS | UNIFIED PLATFORM. LIMITLESS POSSIBILITIES. Segment performance: Managed Services revenue up 19% YoY; Cash Logistics EBIT margin at 19.1% Revenue EBIT EBIT % ■ Cash ■ MS 635 650 96 104 609 20.3% 89 19.1% 32 34 305 321 Cash 271 38 14.9% 82 14.0% 10.6% 77 395 403 404 59 MS 10.3% Q2FY26 Q1FY27 Q2F
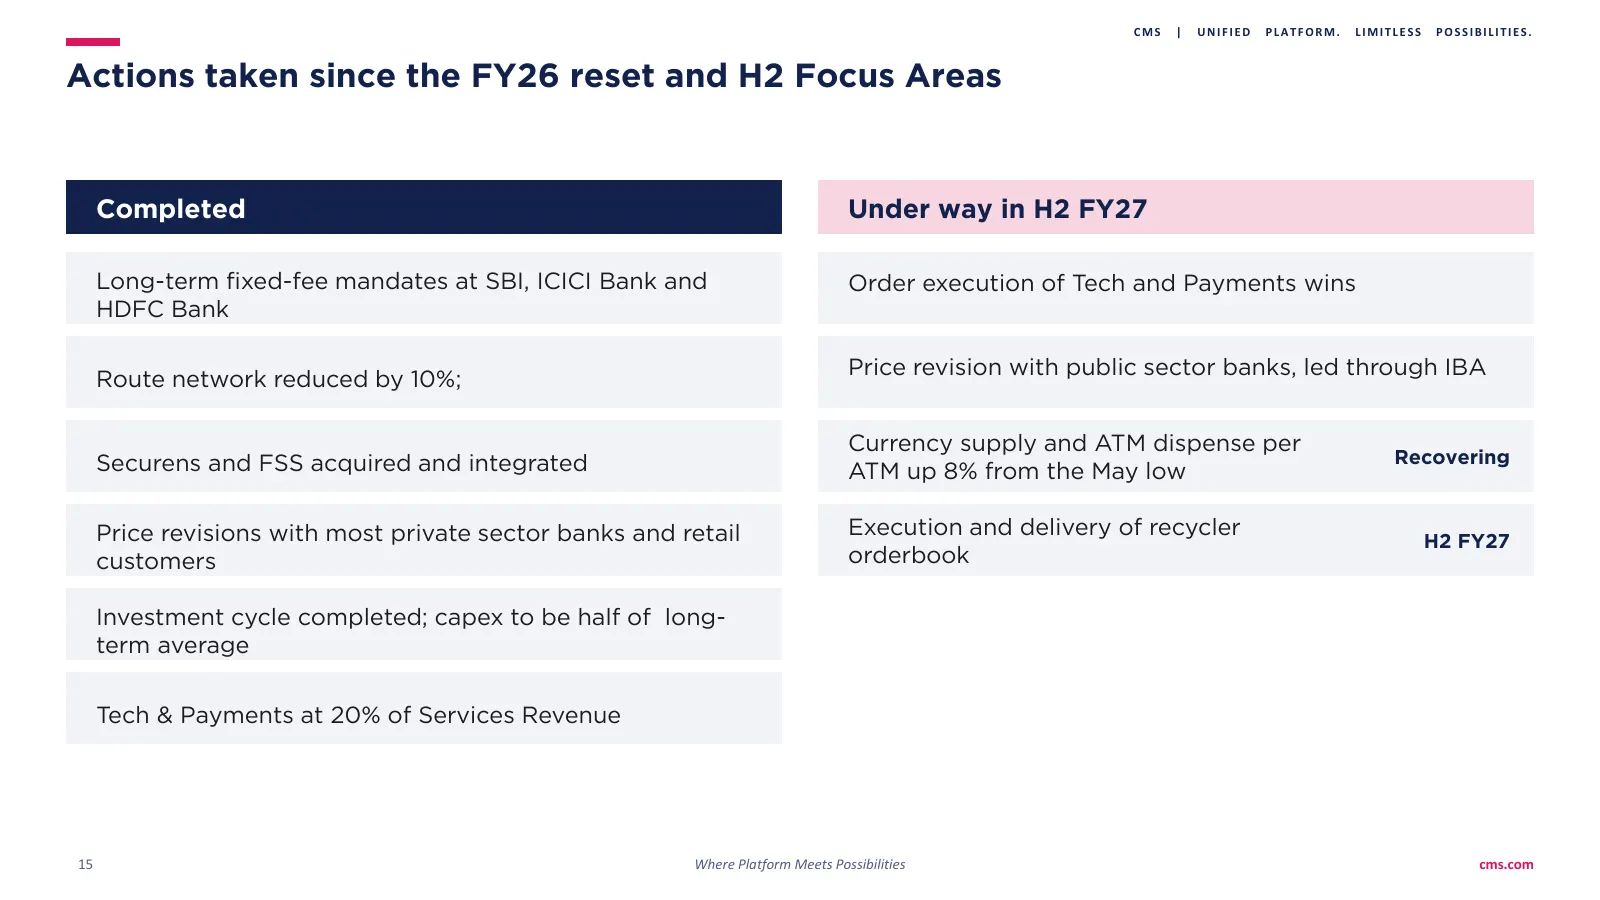
Slide 15: Actions taken since the FY26 reset and H2 Focus Areas
CMS | UNIFIED PLATFORM. LIMITLESS POSSIBILITIES. Actions taken since the FY26 reset and H2 Focus Areas Completed Under way in H2 FY27 Long-term fixed-fee mandates at SBI, ICICI Bank and Order execution of Tech and Payments wins HDFC Bank Price revision with public sector banks, led through IBA Route
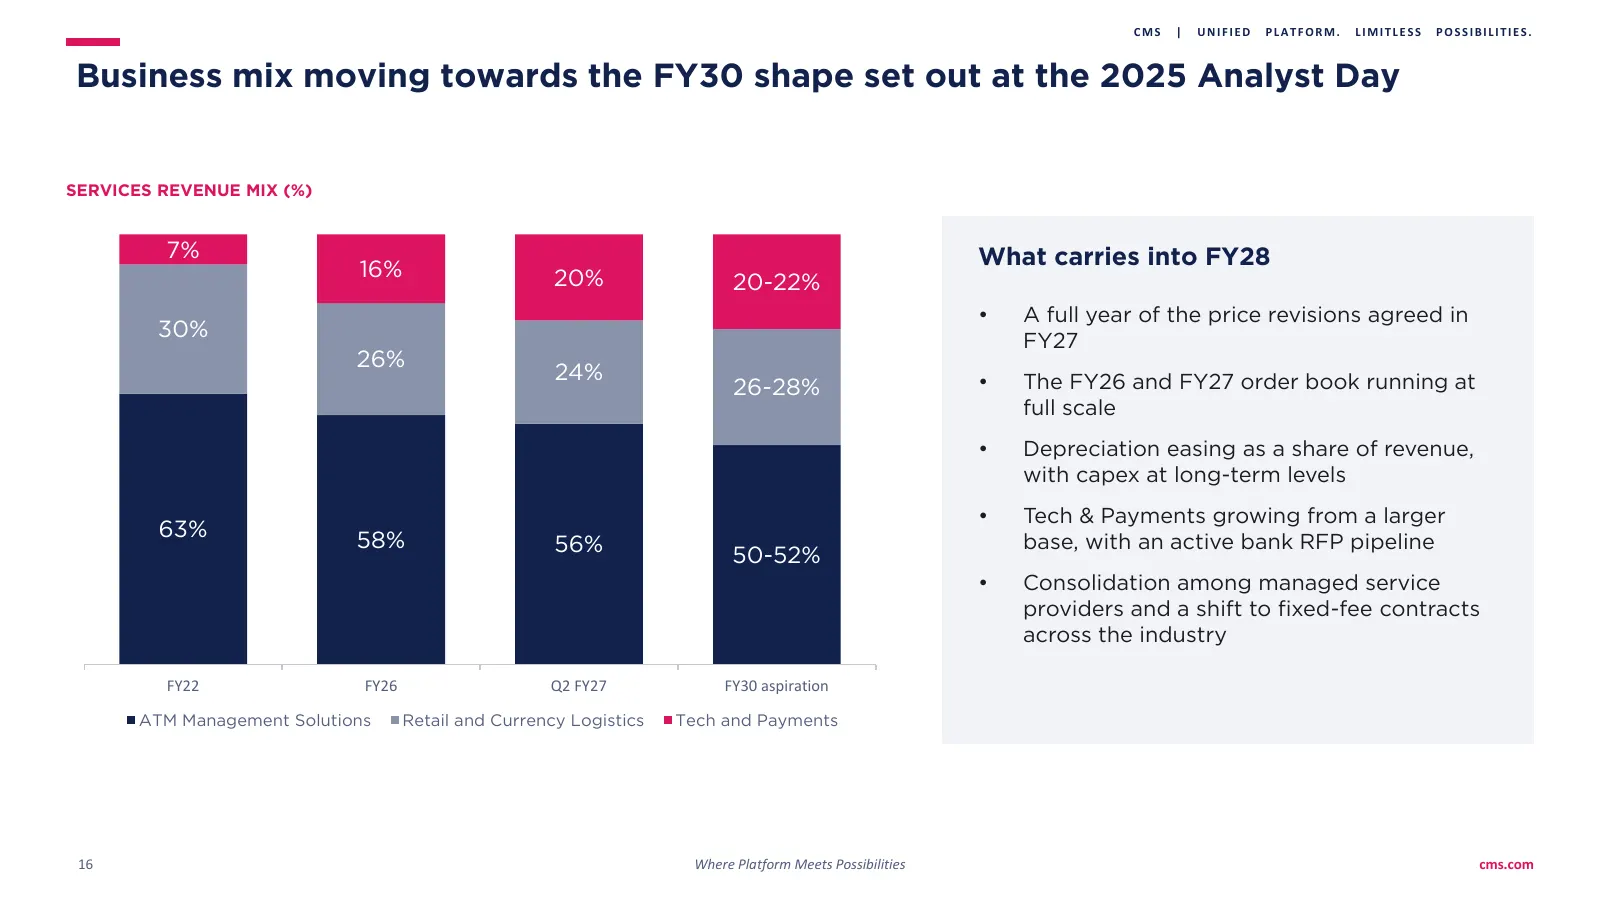
Slide 16: Business mix moving towards the FY30 shape set out at the 2025 Analyst Day
CMS | UNIFIED PLATFORM. LIMITLESS POSSIBILITIES. Business mix moving towards the FY30 shape set out at the 2025 Analyst Day SERVICES REVENUE MIX (%) 7% What carries into FY28 16% 20% 20-22% • A full year of the price revisions agreed in 30% FY27 26% 24% • The FY26 and FY27 order book running at 26-2
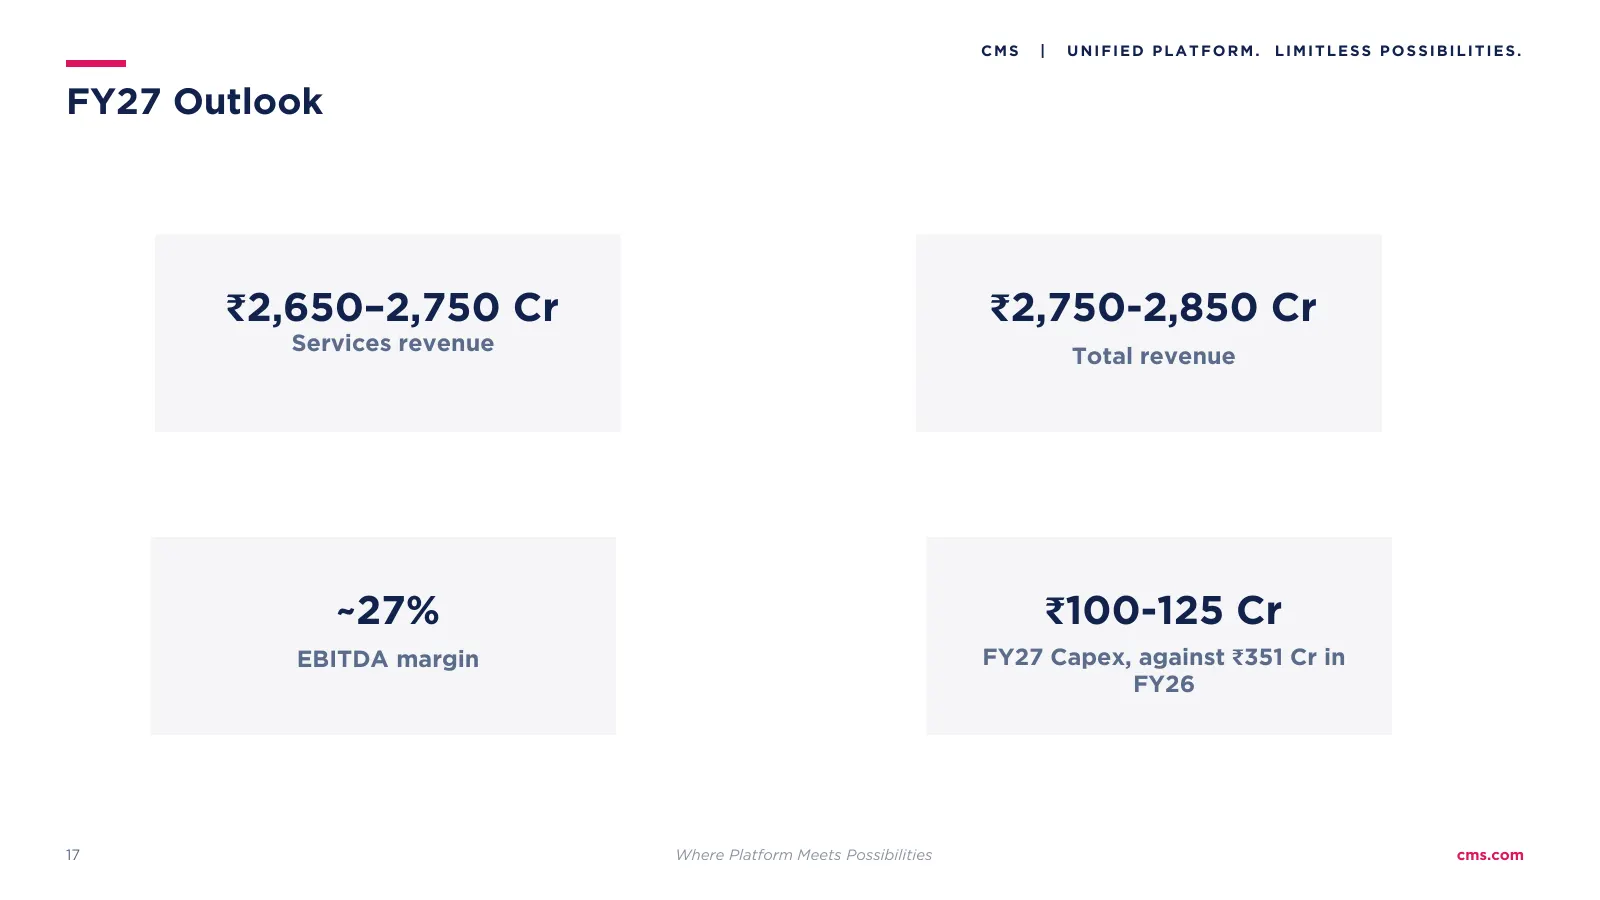
Slide 17: FY27 Outlook
CMS | UNIFIED PLATFORM. LIMITLESS POSSIBILITIES. FY27 Outlook ₹2,650–2,750 Cr ₹2,750-2,850 Cr Services revenue Total revenue ~27% ₹100-125 Cr EBITDA margin FY27 Capex, against ₹351 Cr in FY26 17 Where Platform Meets Possibilities cms.com
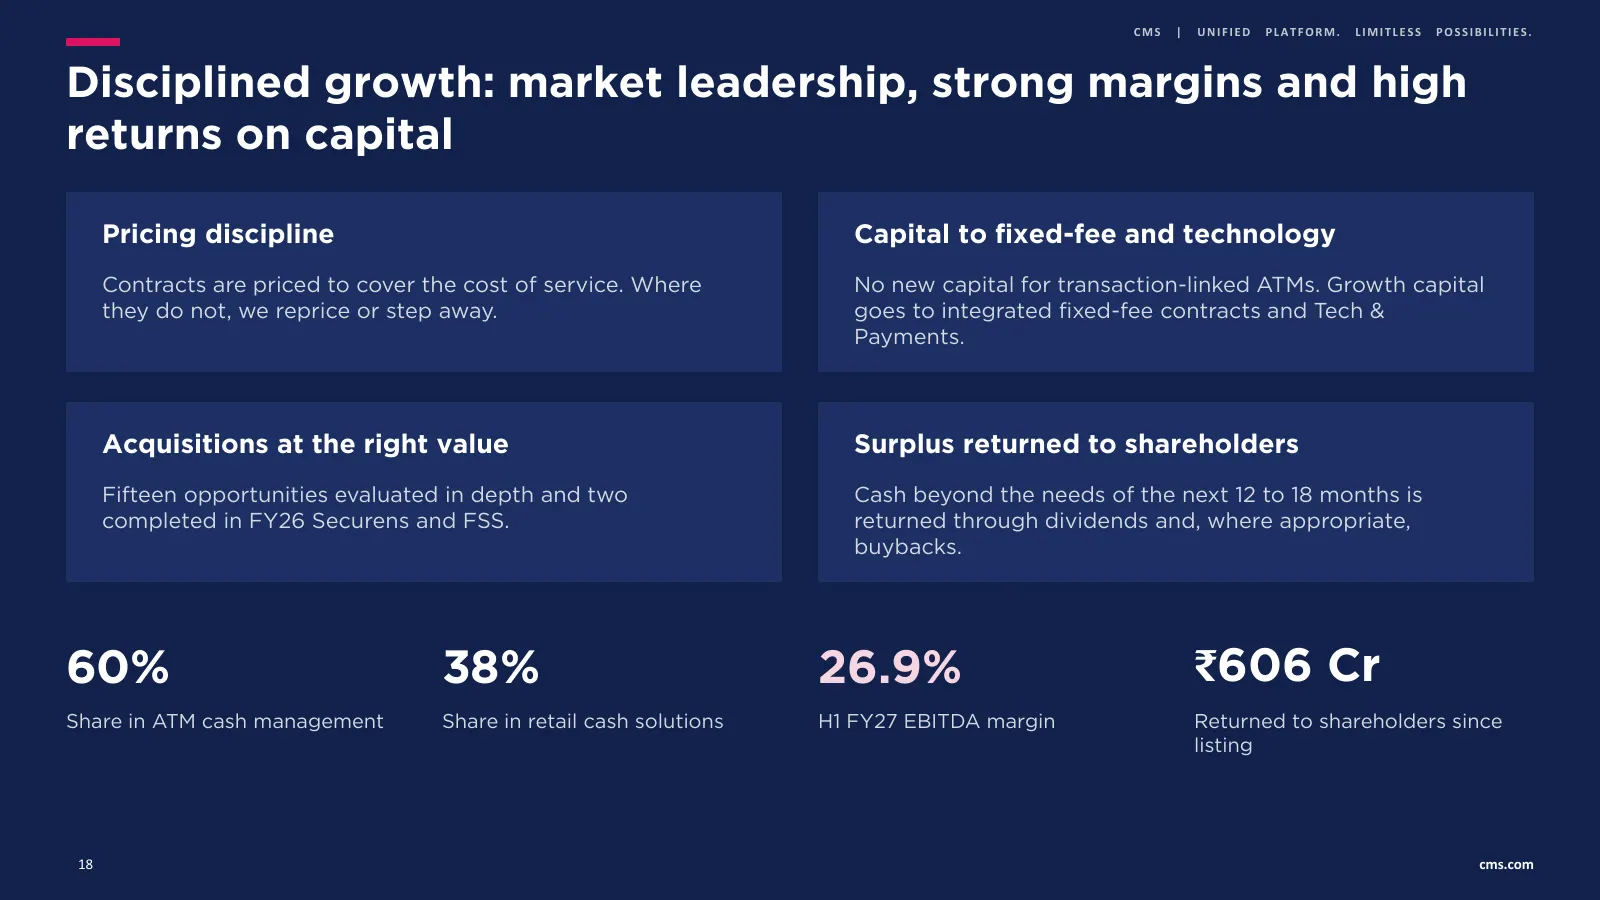
Slide 18: Disciplined growth: market leadership, strong margins and high returns on capital
CMS | UNIFIED PLATFORM. LIMITLESS POSSIBILITIES. Disciplined growth: market leadership, strong margins and high returns on capital Pricing discipline Capital to fixed-fee and technology Contracts are priced to cover the cost of service. Where No new capital for transaction-linked ATMs. Growth capita

Slide 19: Appendix
Appendix
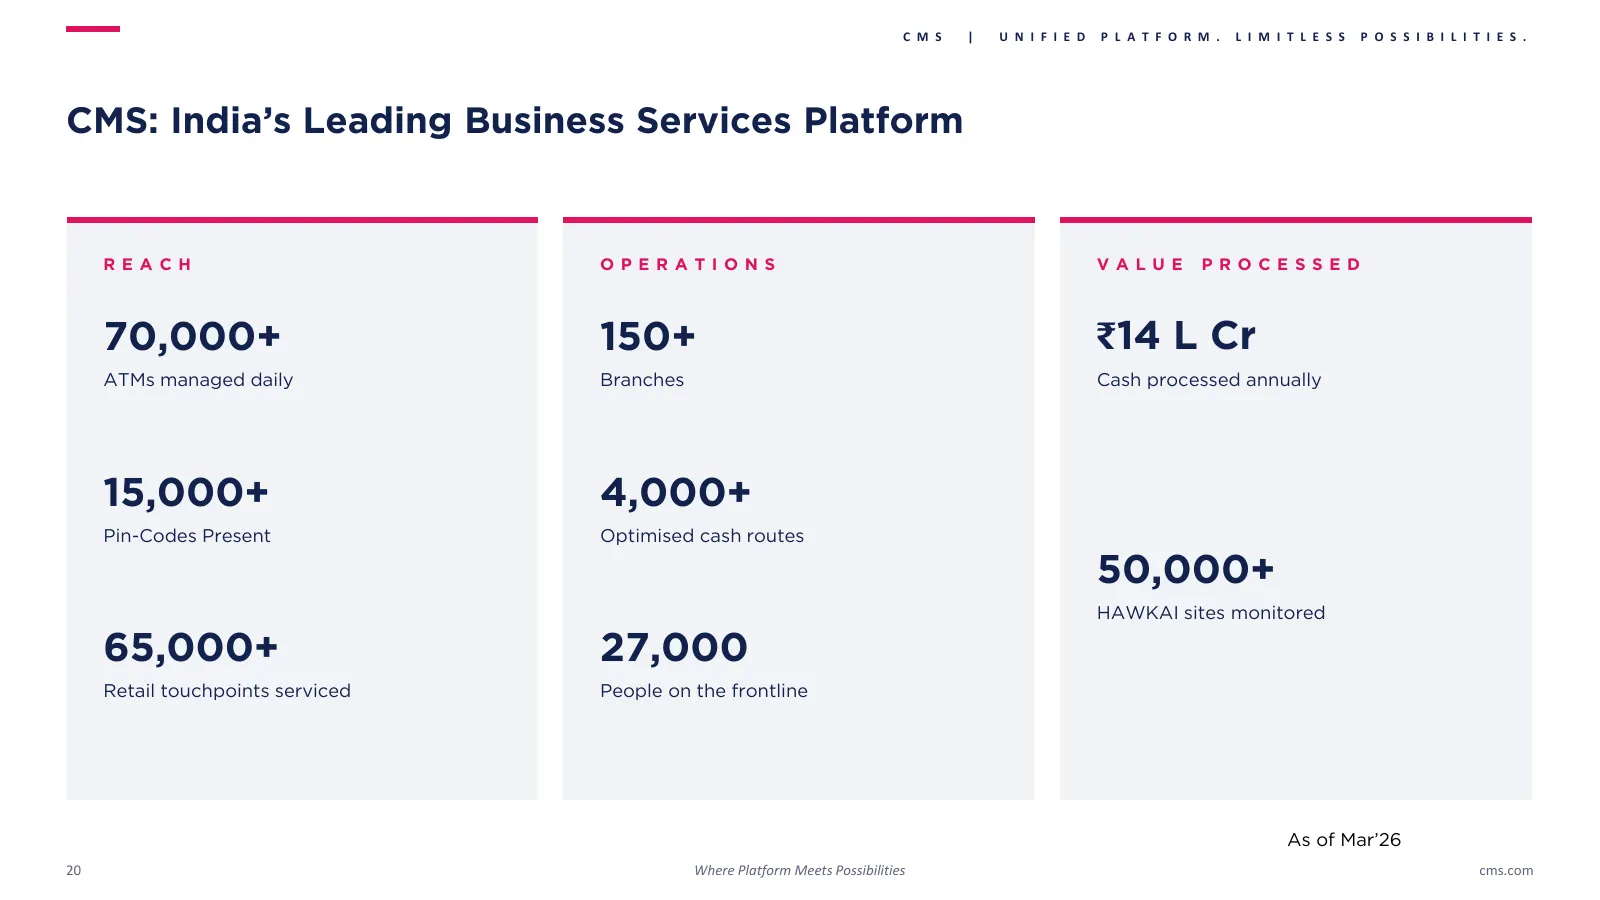
Slide 20: CMS: India's Leading Business Services Platform
C M S | U N I F I E D P L A T F O R M . L I M I T L E S S P O S S I B I L I T I E S . CMS: India’s Leading Business Services Platform RE A CH O PE RA TIO N S VA LU E PRO CE SSE D 70,000+ 150+ ₹14 L Cr ATMs managed daily Branches Cash processed annually 15,000+ 4,000+ Pin-Codes Present Optimised cash
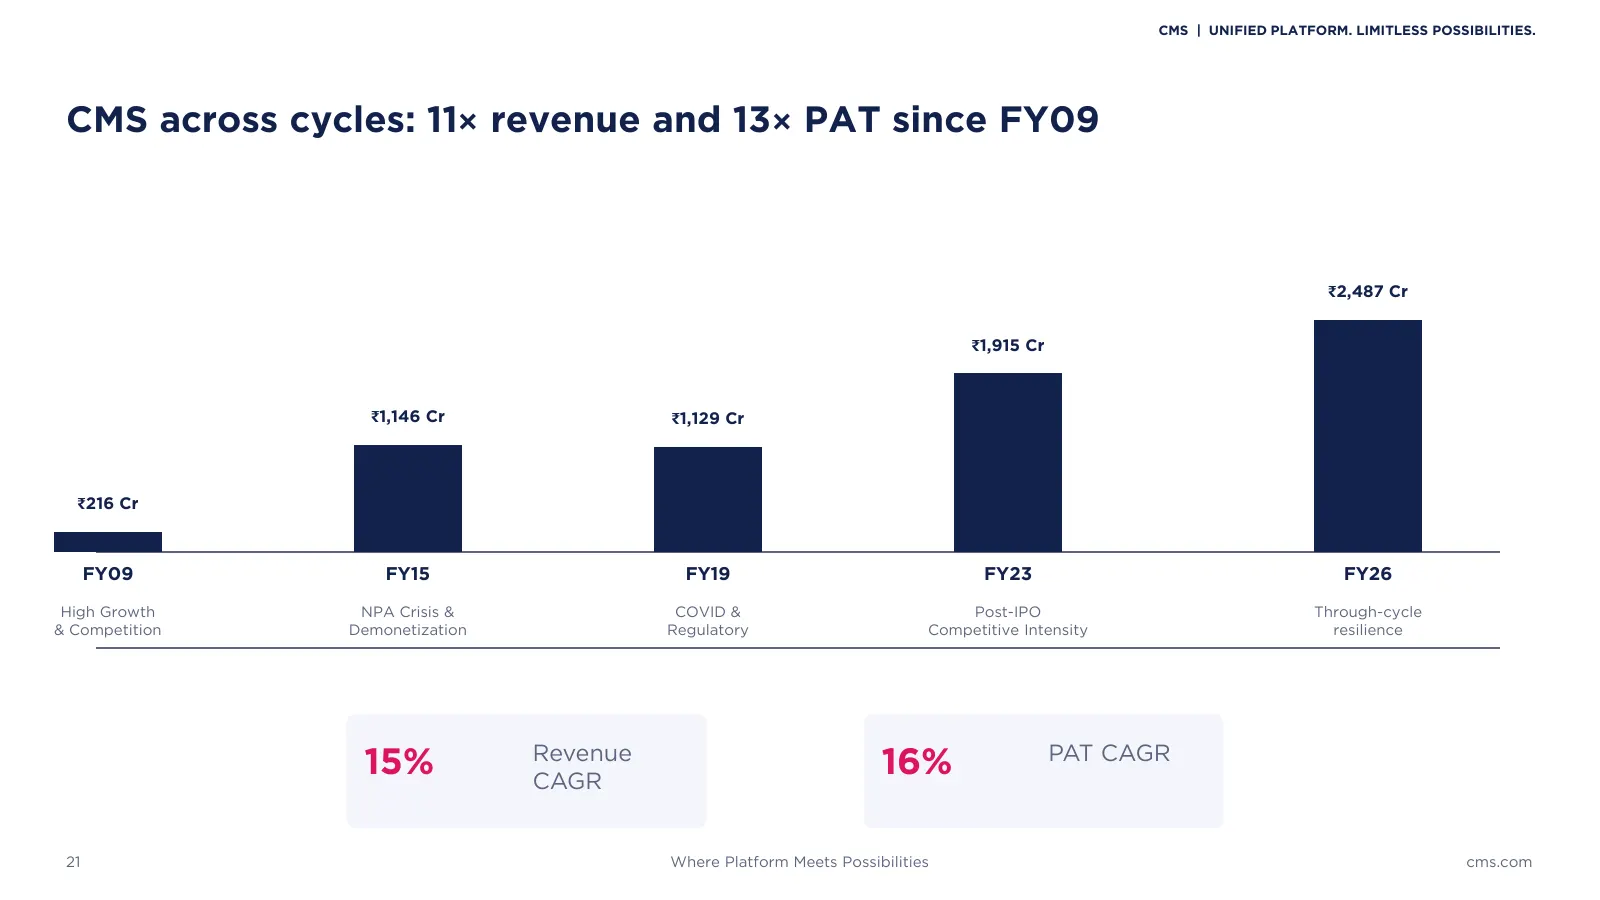
Slide 21: CMS across cycles: 11× revenue and 13× PAT since FY09
CMS | UNIFIED PLATFORM. LIMITLESS POSSIBILITIES. CMS across cycles: 11× revenue and 13× PAT since FY09 ₹2,487 Cr ₹1,915 Cr ₹1,146 Cr ₹1,129 Cr ₹216 Cr FY09 FY15 FY19 FY23 FY26 High Growth NPA Crisis & COVID & Post-IPO Through-cycle & Competition Demonetization Regulatory Competitive Intensity resili
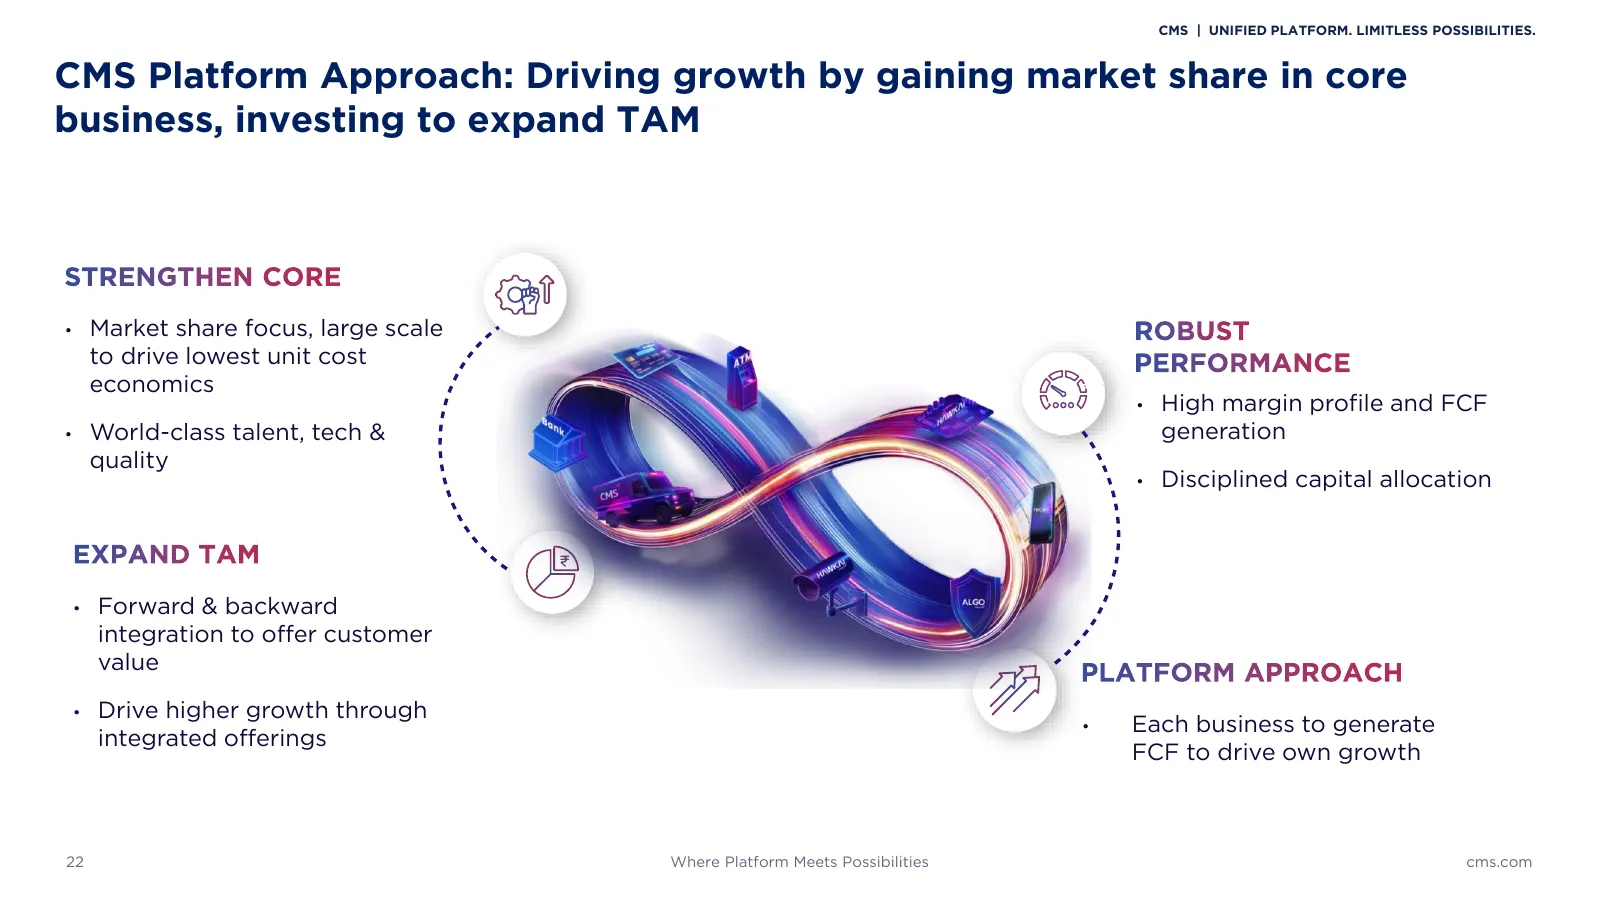
Slide 22: CMS Platform Approach
CMS | UNIFIED PLATFORM. LIMITLESS POSSIBILITIES. CMS Platform Approach: Driving growth by gaining market share in core business, investing to expand TAM STRENGTHEN CORE • Market share focus, large scale ROBUST to drive lowest unit cost PERFORMANCE economics • High margin profile and FCF • World-clas
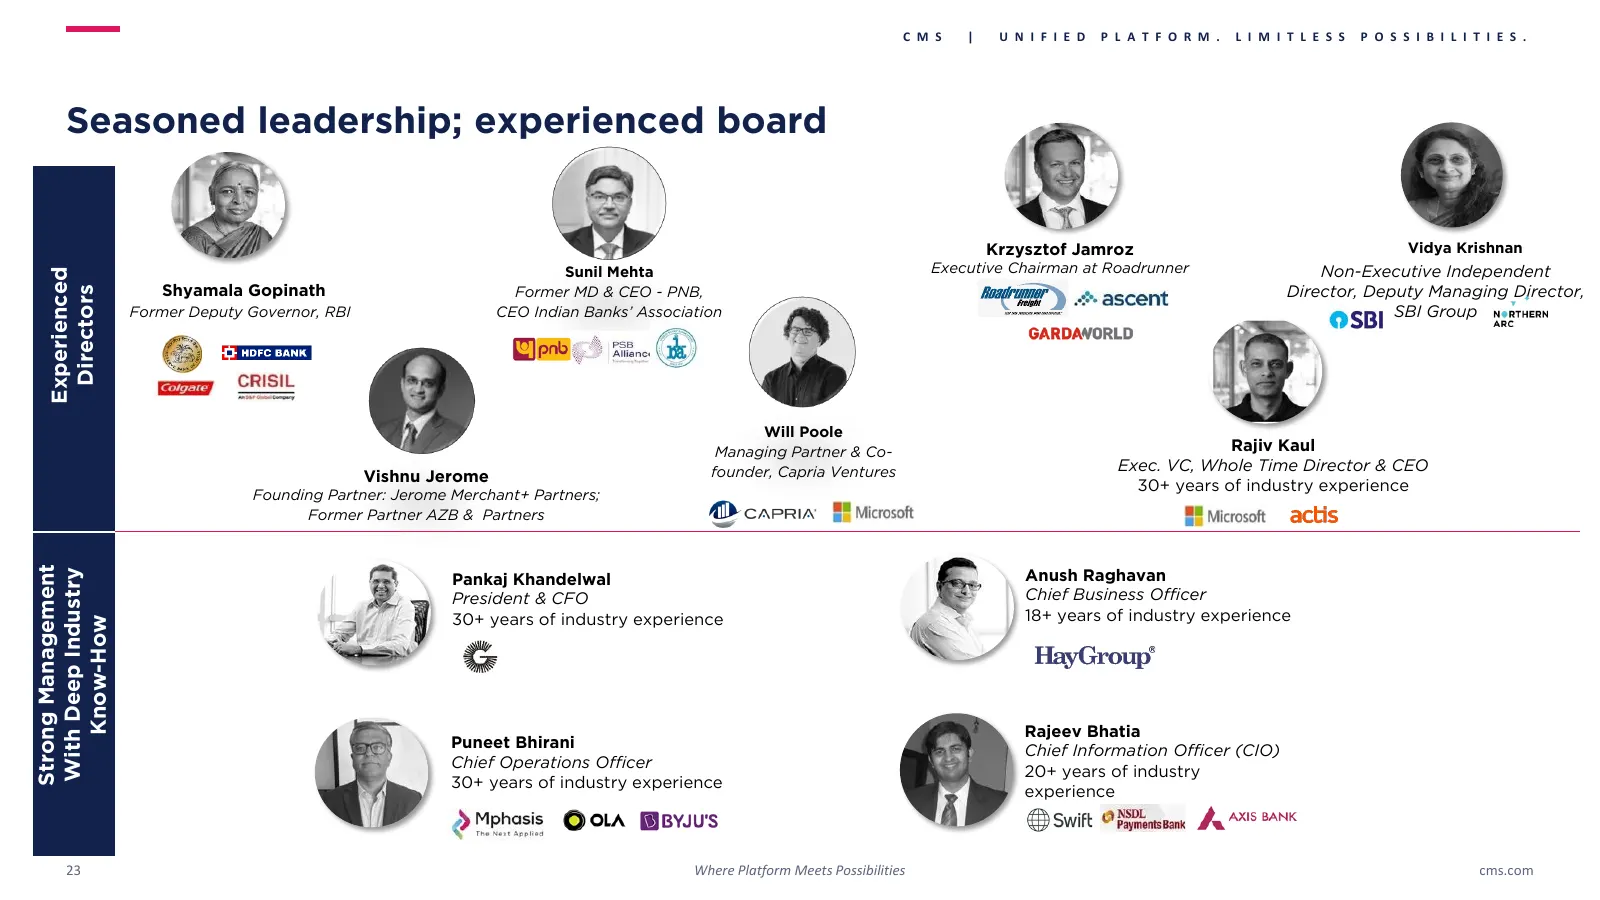
Slide 23: Seasoned leadership; experienced board
C M S | U N I F I E D P L A T F O R M . L I M I T L E S S P O S S I B I L I T I E S . Seasoned leadership; experienced board Krzysztof Jamroz Vidya Krishnan Sunil Mehta Executive Chairman at Roadrunner Non-Executive Independent Experienced Shyamala Gopinath Former MD & CEO - PNB, Director, Deputy Ma
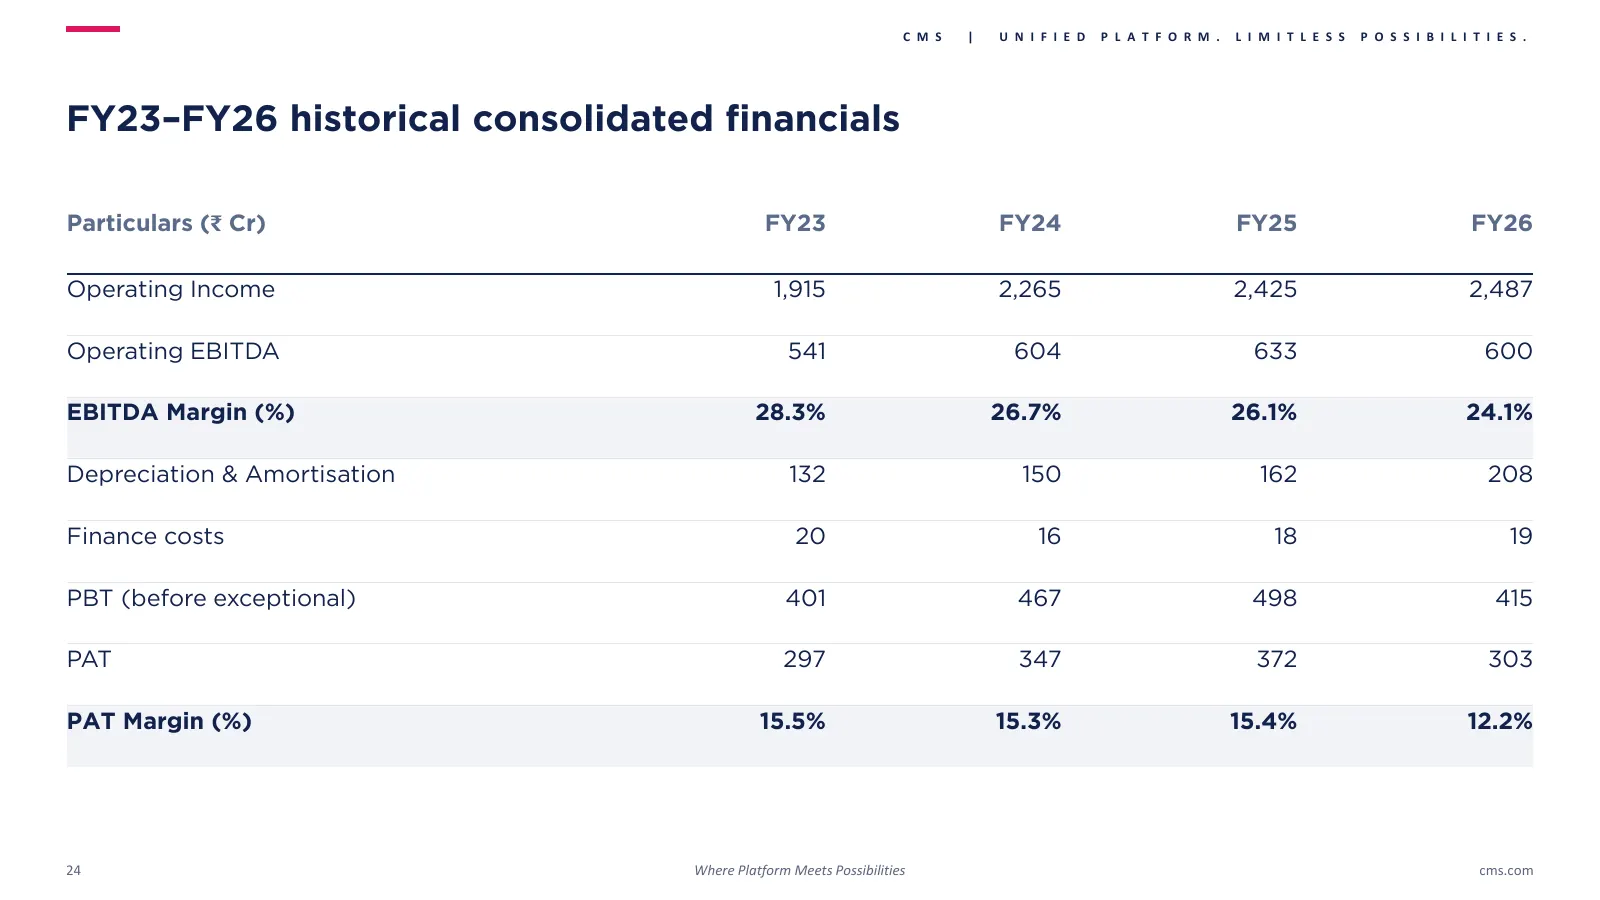
Slide 24: FY23–FY26 historical consolidated financials
C M S | U N I F I E D P L A T F O R M . L I M I T L E S S P O S S I B I L I T I E S . FY23–FY26 historical consolidated financials Particulars (₹ Cr) FY23 FY24 FY25 FY26 Operating Income 1,915 2,265 2,425 2,487 Operating EBITDA 541 604 633 600 EBITDA Margin (%) 28.3% 26.7% 26.1% 24.1% Depreciation &
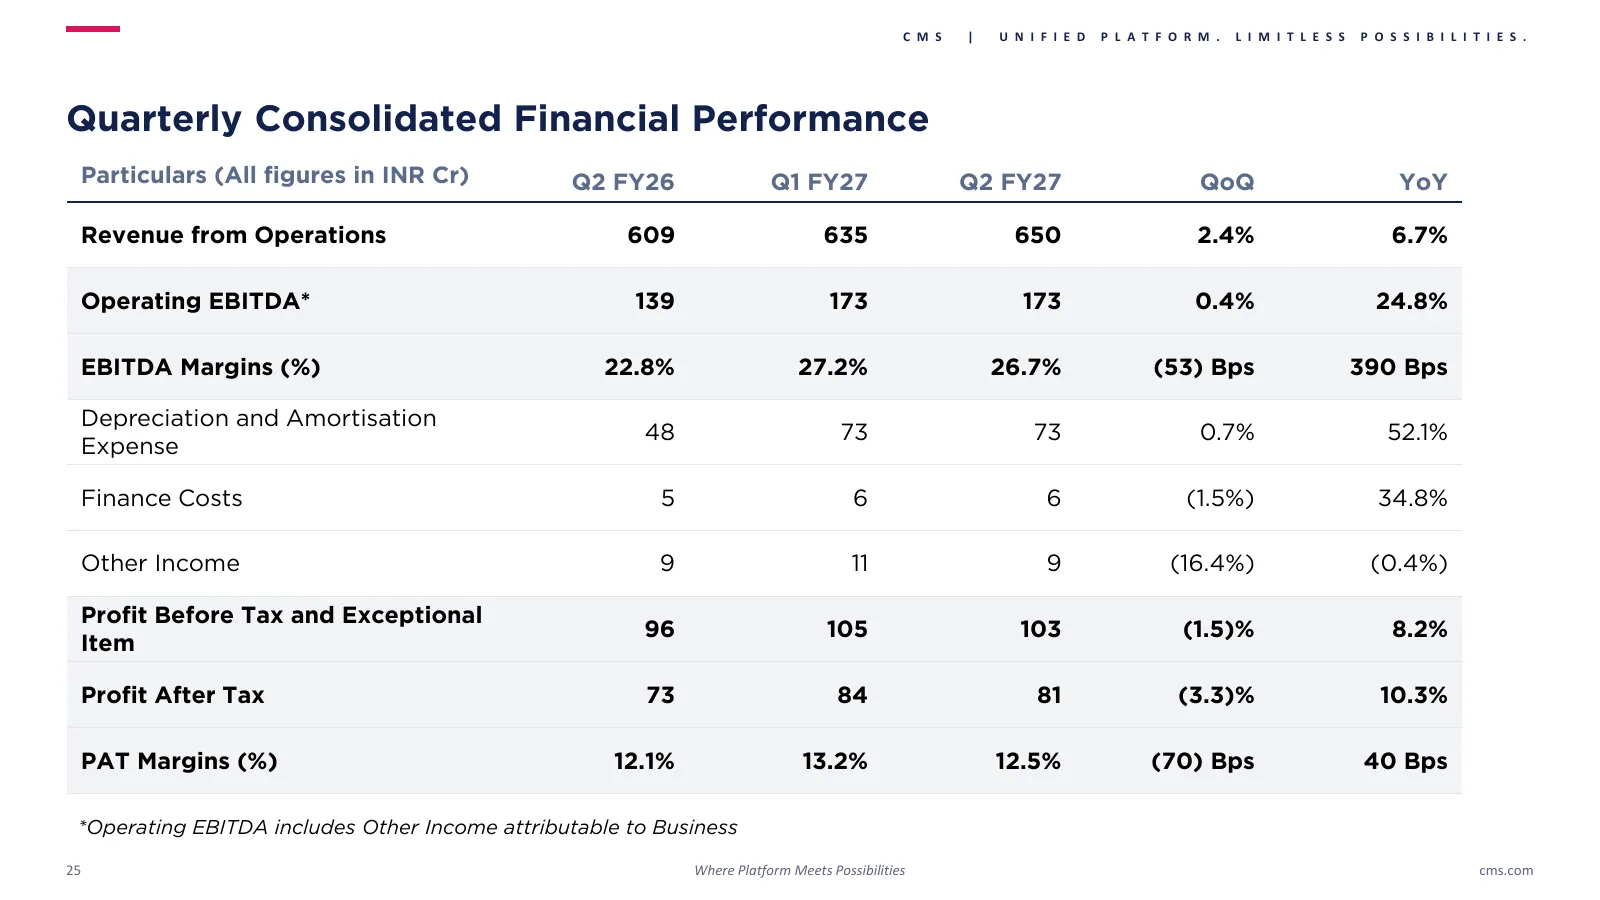
Slide 25: Quarterly Consolidated Financial Performance
C M S | U N I F I E D P L A T F O R M . L I M I T L E S S P O S S I B I L I T I E S . Quarterly Consolidated Financial Performance Particulars (All figures in INR Cr) Q2 FY26 Q1 FY27 Q2 FY27 QoQ YoY Revenue from Operations 609 635 650 2.4% 6.7% Operating EBITDA* 139 173 173 0.4% 24.8% EBITDA Margins
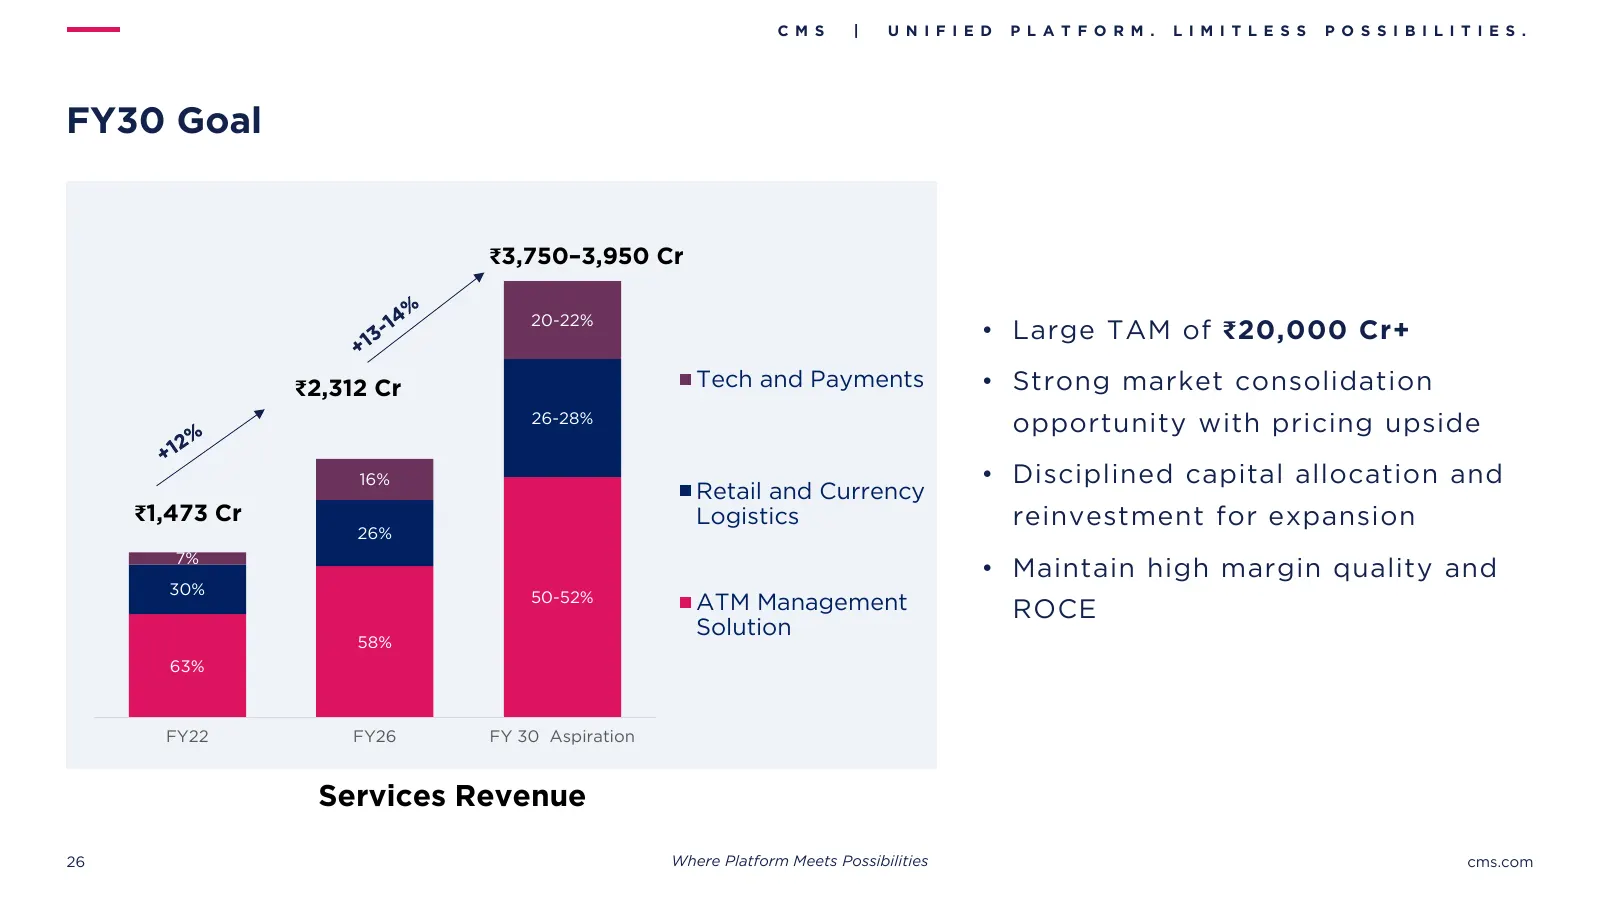
Slide 26: FY30 Goal
C M S | U N I F I E D P L A T F O R M . L I M I T L E S S P O S S I B I L I T I E S . FY30 Goal ₹3,750–3,950 Cr 20-22% • Large TAM of ₹20,000 Cr+ ₹2,312 Cr Tech and Payments • Strong market consolidation 26-28% opportunity with pricing upside 16% • Disciplined capital allocation and Retail and Curre
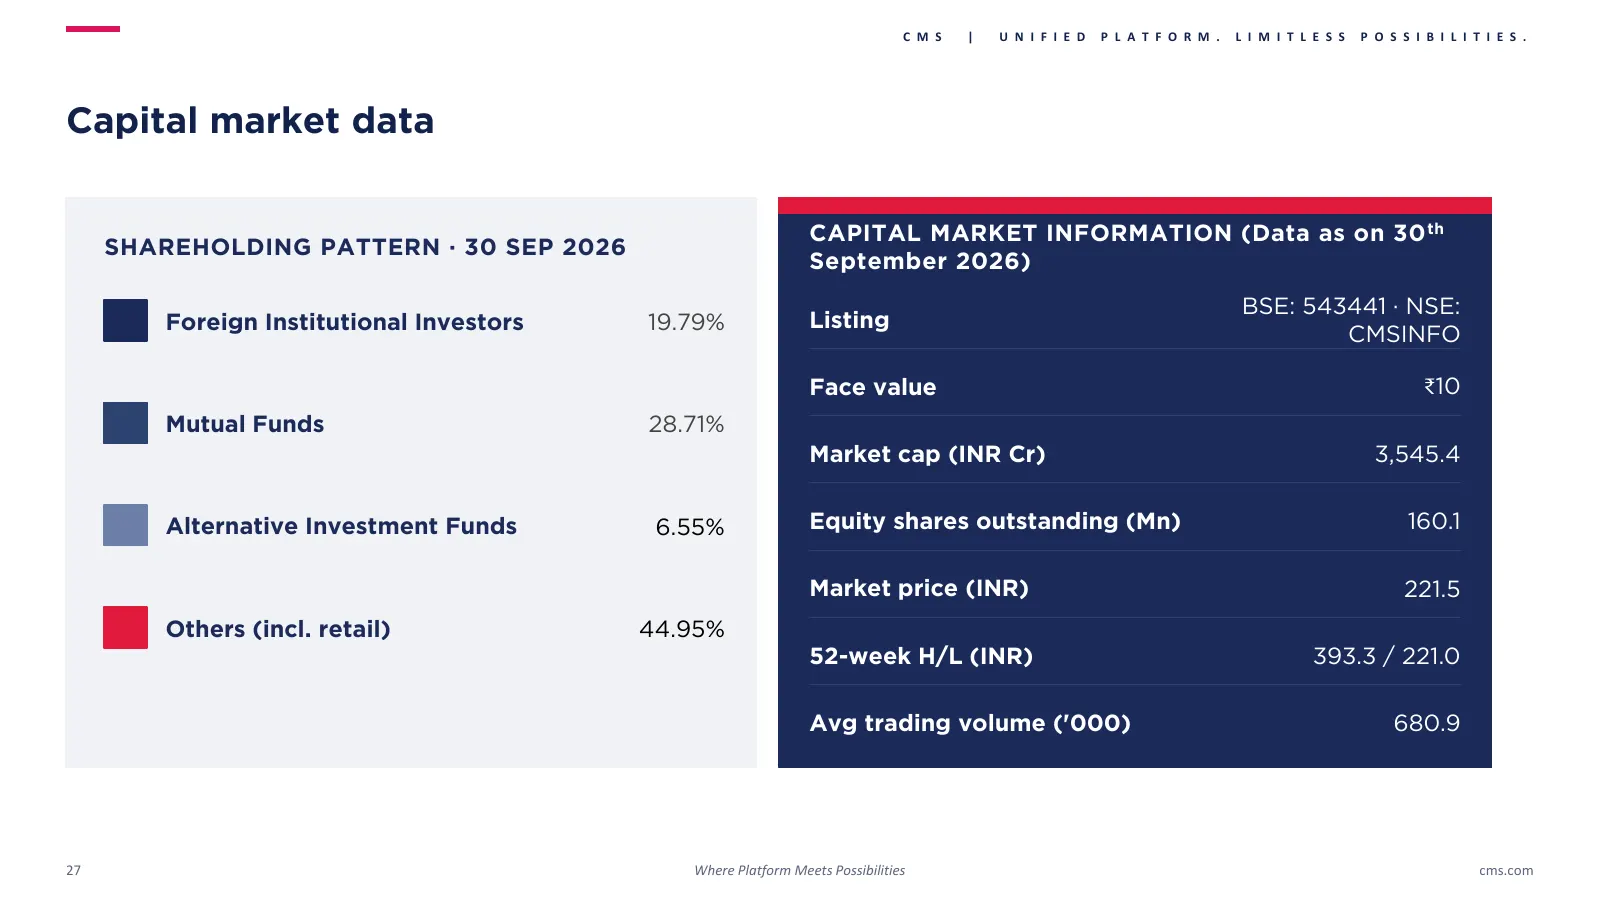
Slide 27: Capital market data
C M S | U N I F I E D P L A T F O R M . L I M I T L E S S P O S S I B I L I T I E S . Capital market data CAPITAL MARKET INFORMATION (Data as on 30 th SHAREHOLDING PATTERN · 30 SEP 2026 September 2026) BSE: 543441 · NSE: Foreign Institutional Investors 19.79% Listing CMSINFO Face value ₹10 Mutual Fu
Source: company website
More decks from CMS Info Systems Ltd.
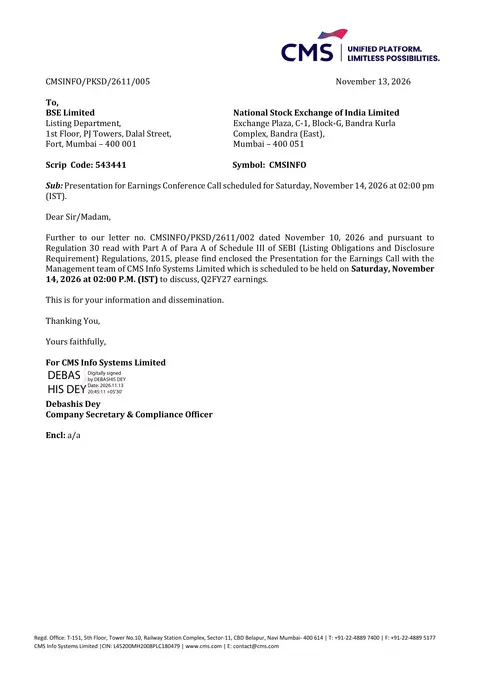 Q2 FY27 Earnings Presentation28 slides · Nov 13, 2026
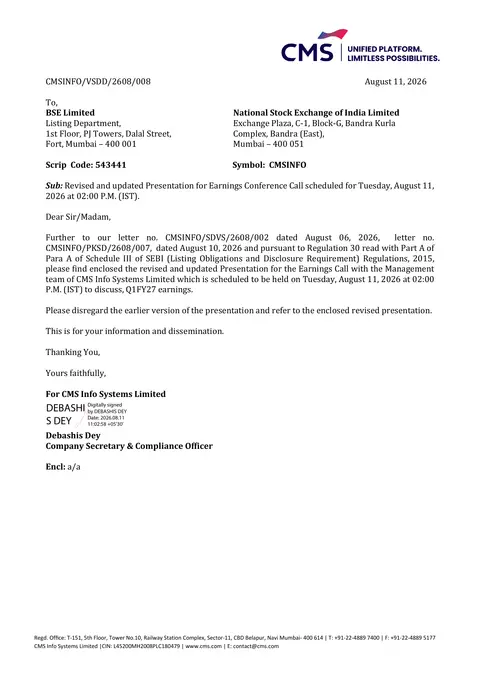 Q1 FY27 Earnings Presentation24 slides · Aug 11, 2026
 Q1 FY2027 Earnings Presentation23 slides · Aug 10, 2026
 Q1 FY27 Earnings Presentation23 slides · Aug 10, 2026
 Q4 FY2026 Earnings Presentation30 slides · May 14, 2026
 Q3 FY26 Earnings Presentation34 slides · Feb 12, 2026