SITE Centers Corp. · NYSE:SITC
SITE Centers — Q4 2019 Earnings Presentation
17 slides from SITE Centers's earnings presentation, Feb 13, 2020
Slide 1: 4Q19 Earnings Conference Call
4Q19 Earnings SITE CENTERS CONFERENCE CALL 1 3 F E B R U A R Y, 2 0 2 0
Slide 2: Safe Harbor Statement
S A F E H A R B O R S TAT E M E N T SITE Centers considers portions of the information in this presentation to be forward-looking statements within the meaning of Section 27A of the Securities Act of 1933 and Section 21E of the Securities Exchange Act of 1934, both as amended, with respect to the Co
Slide 3: Table of Contents
Table of 4 Q 1 9 K E Y TA K E AWAYS 4 4 Q 19 R E S U LT S S U M M A R Y 5 Contents ACQUISITIONS 6 4 Q 19 L E A S I N G U P DAT E 8 B A L A N C E S H E E T U P DAT E 9 GUIDANCE & EARNINGS C O N S I D E R AT I O N S 10 APPENDIX 11 3
Slide 4: 4Q19 Key Takeaways – Five-Year Plan on Track
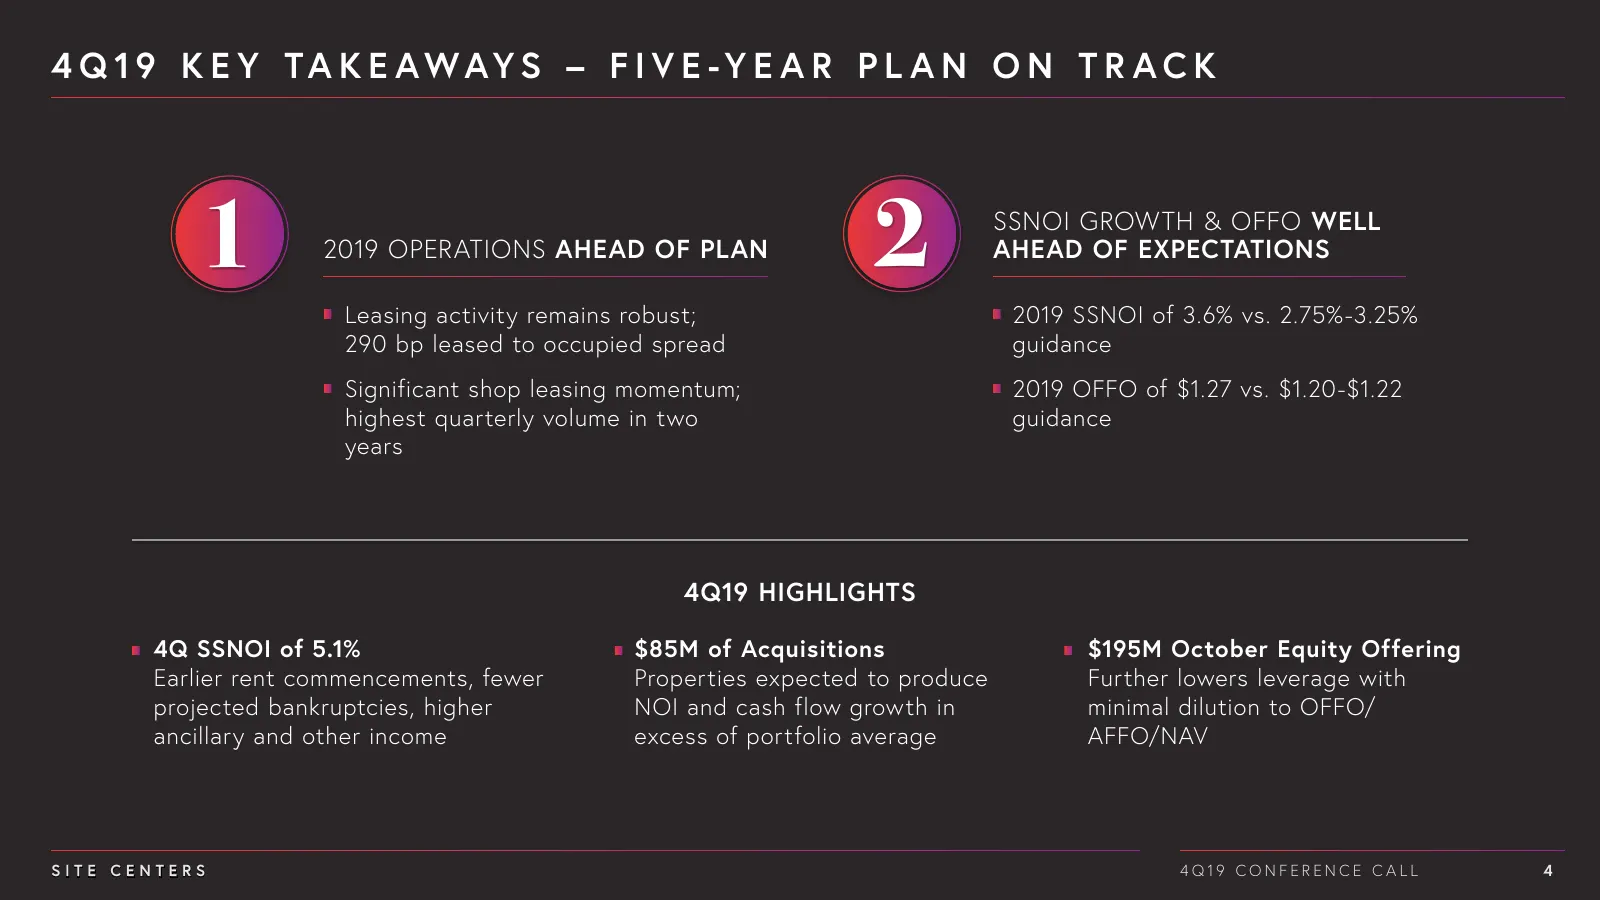
4 Q 1 9 K E Y TA K E AWAY S – F I V E -Y E A R P L A N O N T R A C K 1 2019 OPERATIONS AHEAD OF PLAN 2 SSNOI GROWTH & OFFO WELL AHEAD OF EXPECTATIONS Leasing activity remains robust; 2019 SSNOI of 3.6% vs. 2.75%-3.25% 290 bp leased to occupied spread guidance Significant shop leasing momentum; 2019
Slide 5: 4Q19 Results Summary
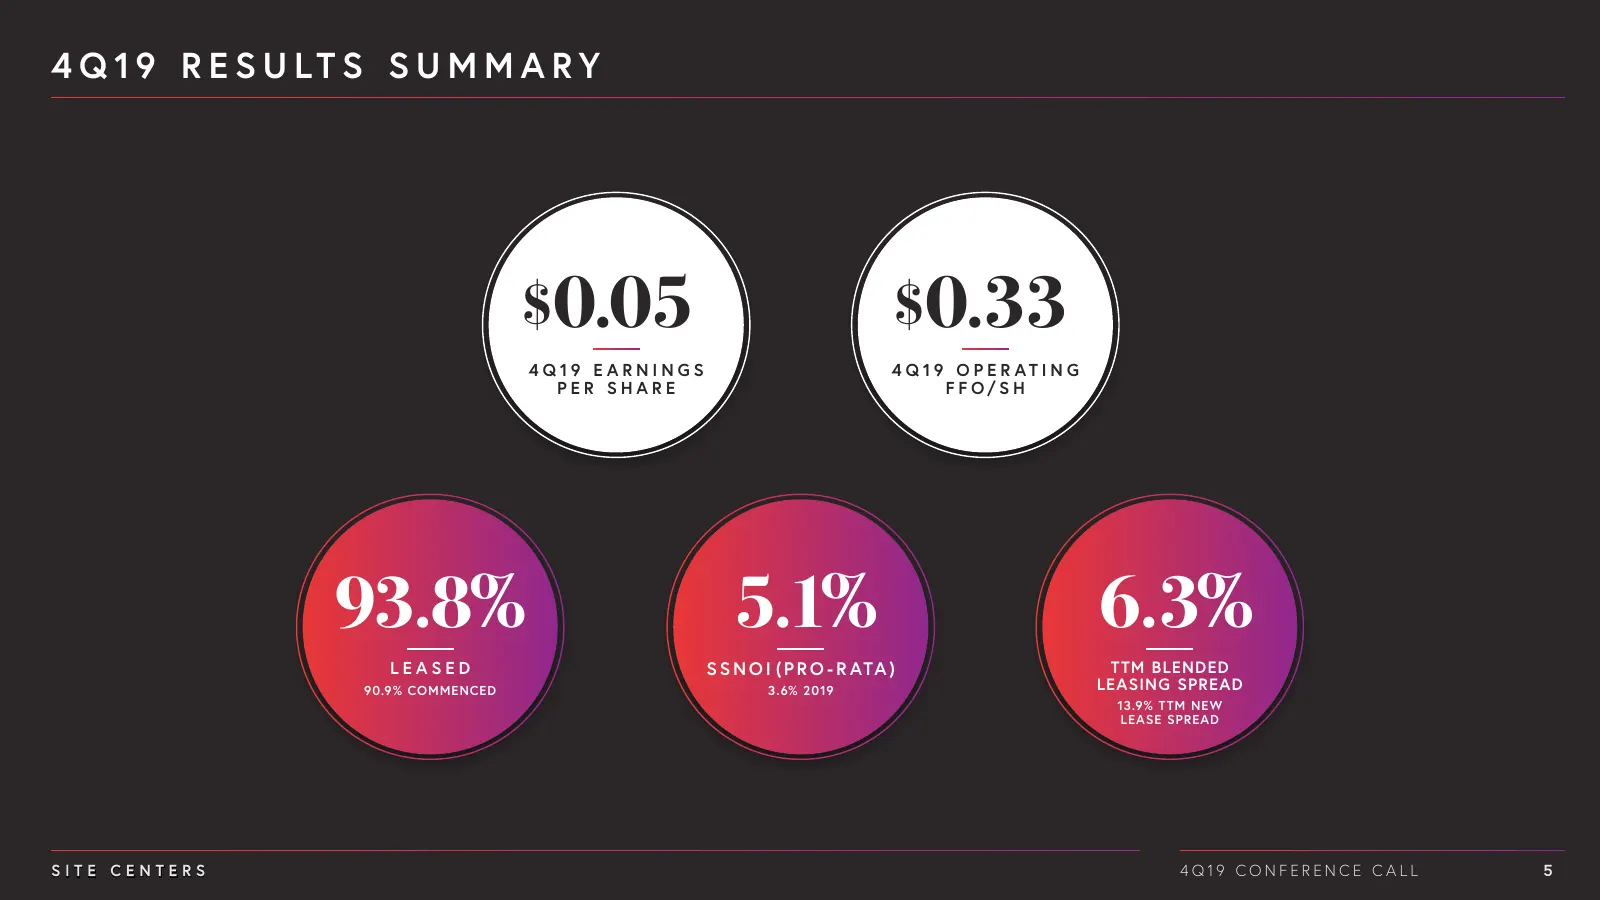
4 Q 1 9 R E S U LT S S U M M A R Y $0.05 $0.33 4Q19 EARNINGS 4 Q 19 O P E R AT I N G PER SHARE FF O/S H 93.8% 5.1% 6.3% LEASED S S N O I ( P R O - R ATA ) TTM BLENDED 90.9% COMMENCED 3.6% 2019 LEASING SPREAD 13.9% TTM NEW LEASE SPREAD SITE CENTERS 4Q19 CONFERENCE C ALL 5
Slide 6: The Block, Portland, Oregon
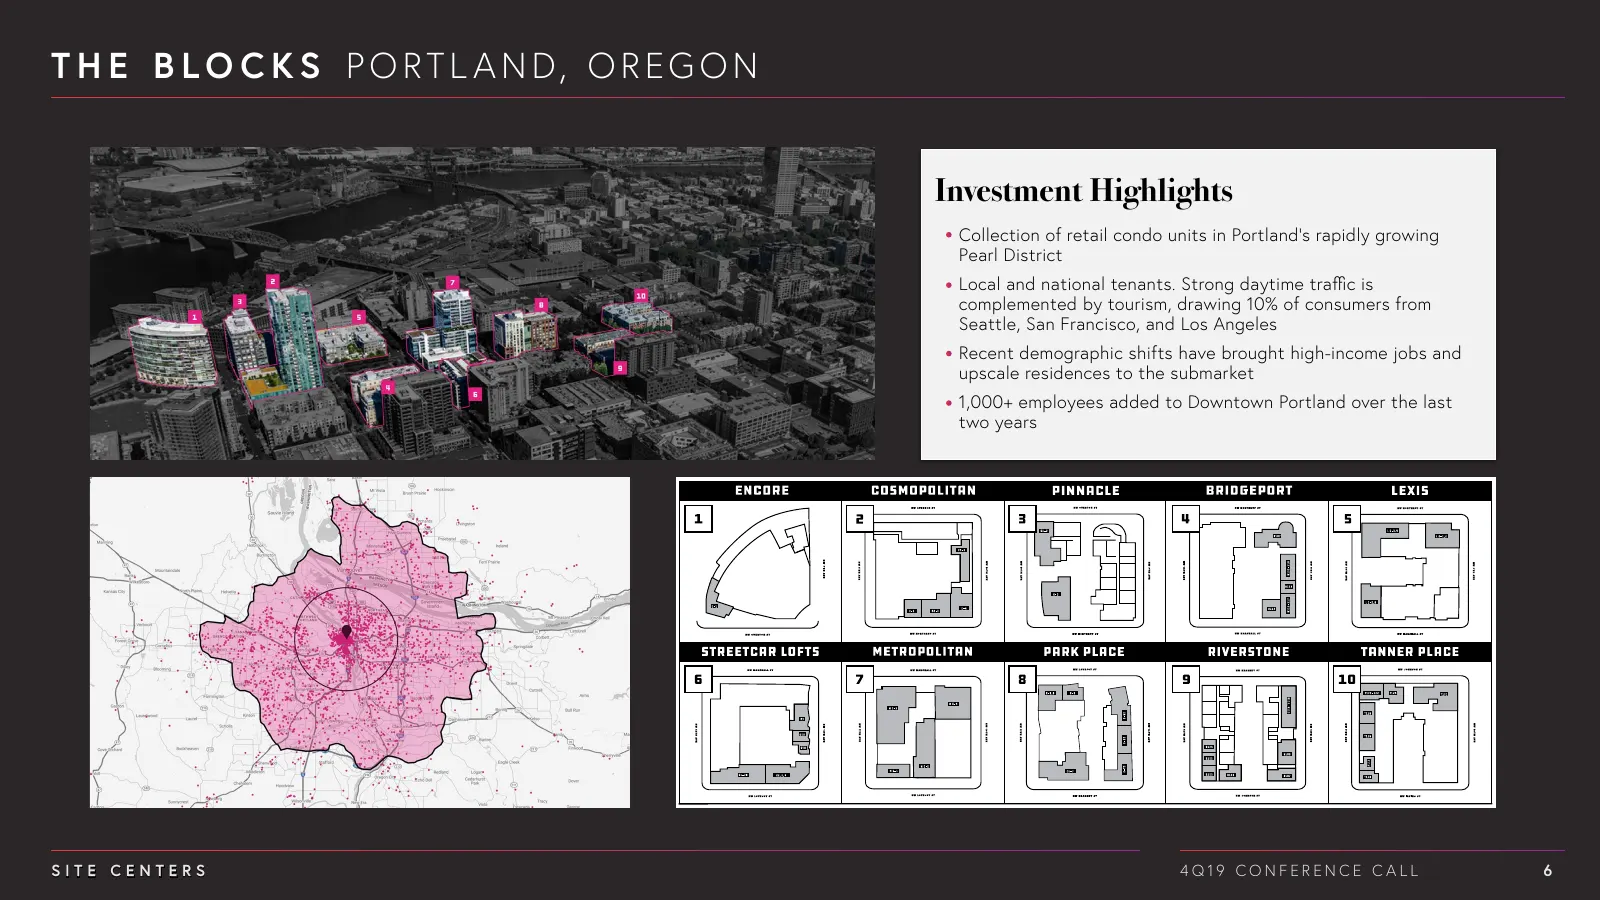
T H E B L O C K S P O R T L A N D, O R E G O N Investment Highlights Collection of retail condo units in Portland’s rapidly growing Pearl District Local and national tenants. Strong daytime traffic is complemented by tourism, drawing 10% of consumers from Seattle, San Francisco, and Los Angeles Rece
Slide 7: SouthTown Center, Tampa, Florida
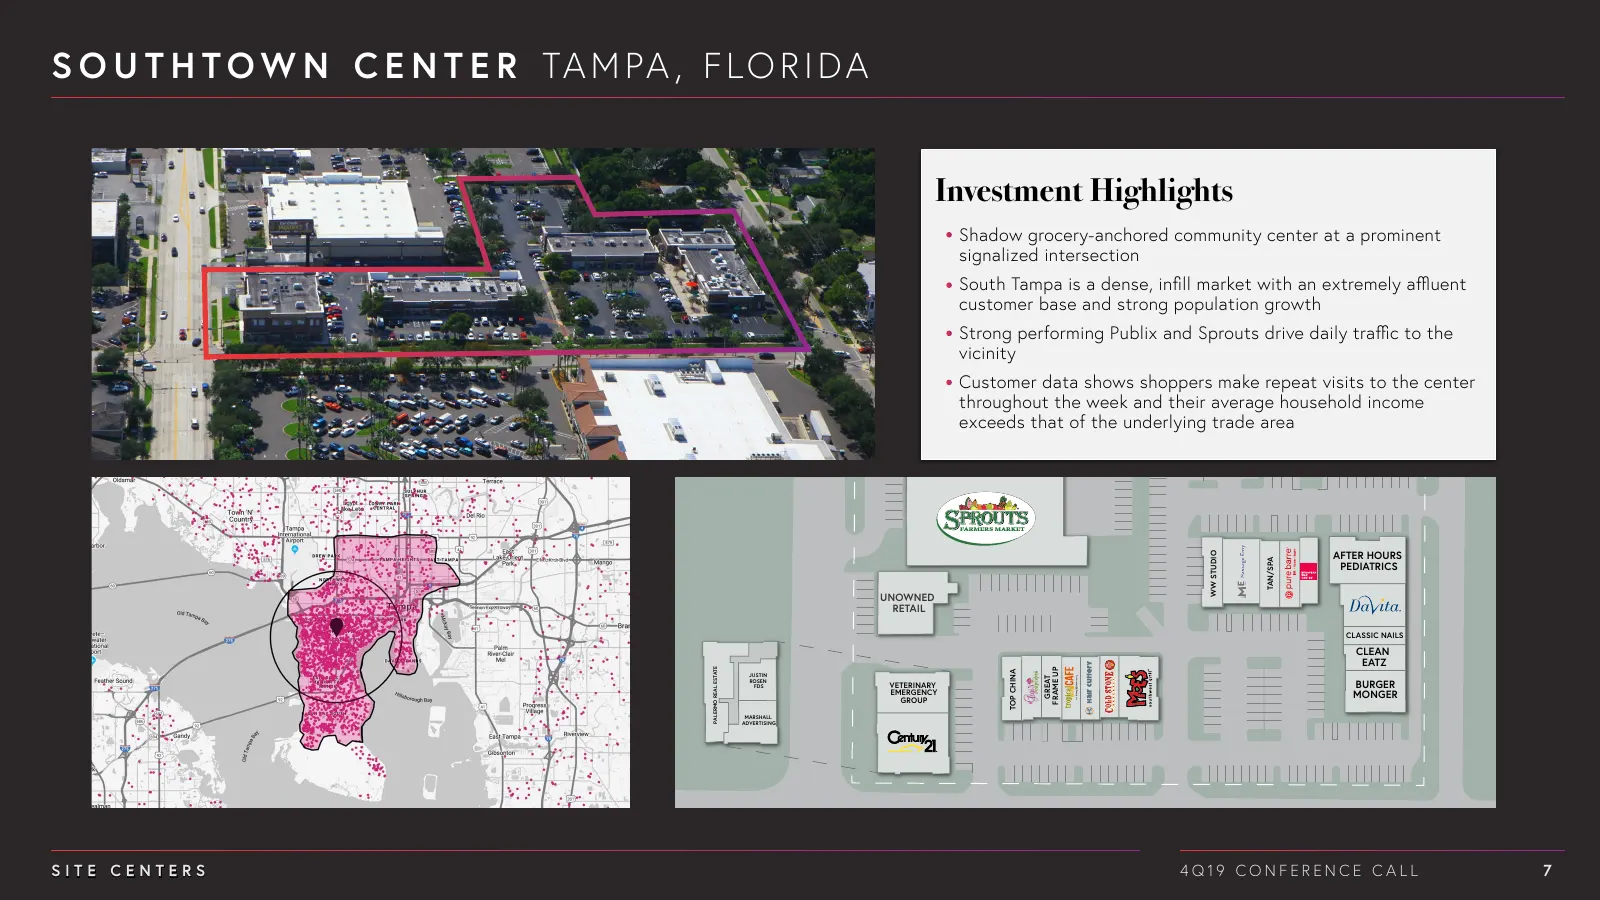
S O U T H T O W N C E N T E R TA M PA , F LO R I D A Investment Highlights Shadow grocery-anchored community center at a prominent signalized intersection South Tampa is a dense, infill market with an extremely affluent customer base and strong population growth Strong performing Publix and Sprouts
Slide 8: 4Q19 Leasing Update
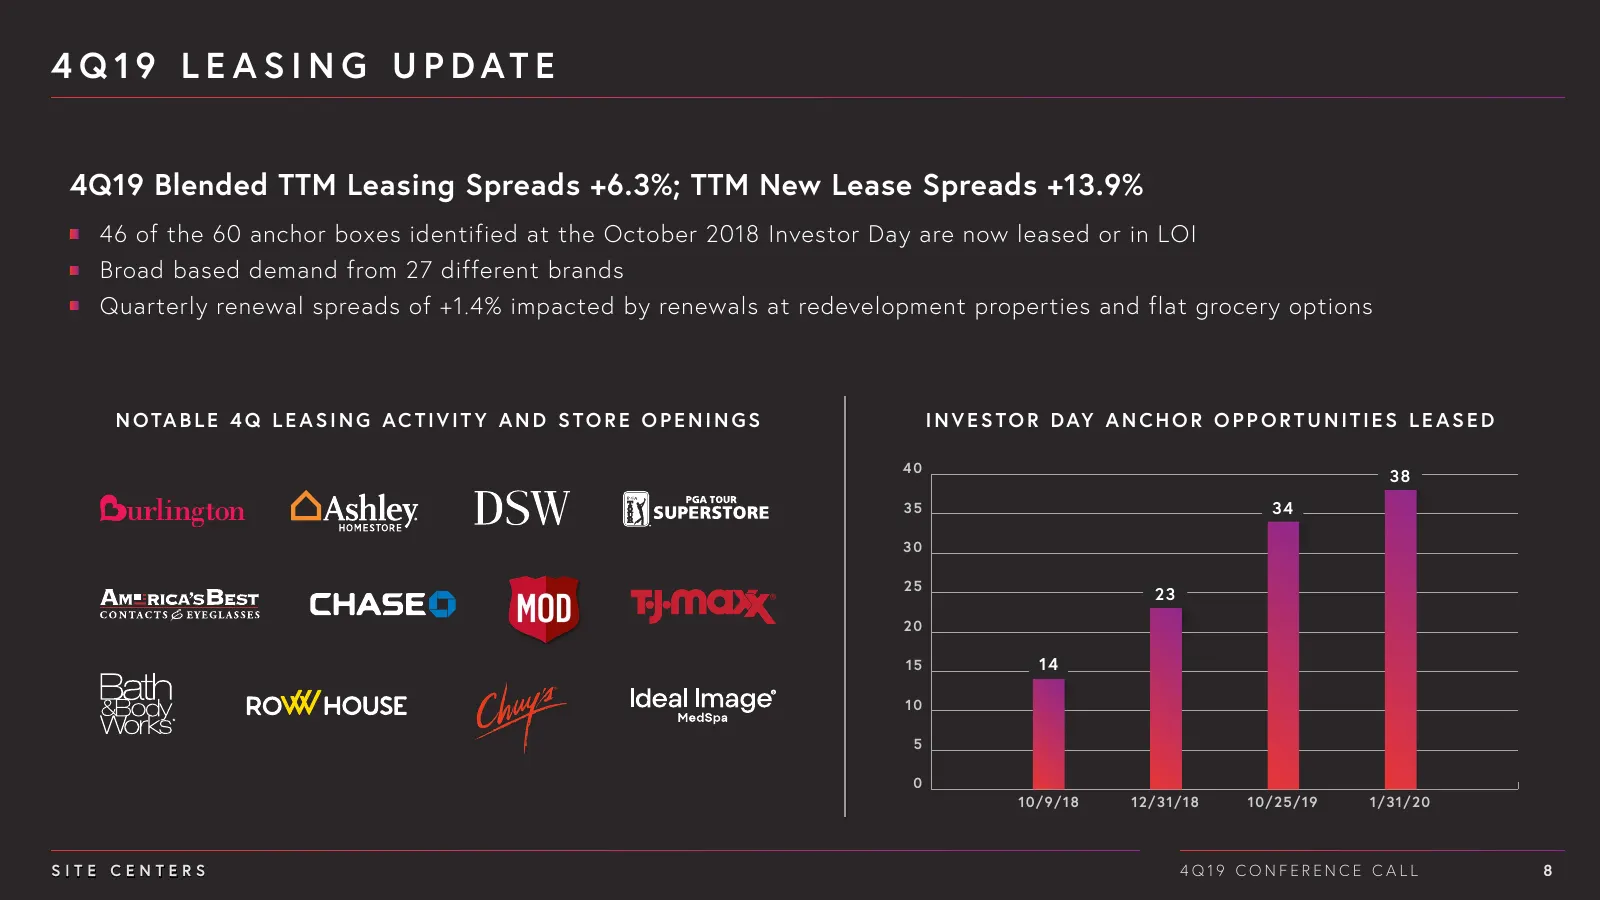
4 Q 1 9 L E A S I N G U P D AT E 4Q19 Blended TTM Leasing Spreads +6.3%; TTM New Lease Spreads +13.9% 46 of the 60 anchor boxes identified at the October 2018 Investor Day are now leased or in LOI Broad based demand from 27 different brands Quarterly renewal spreads of +1.4% impacted by renewals at
Slide 9: Balance Sheet Update
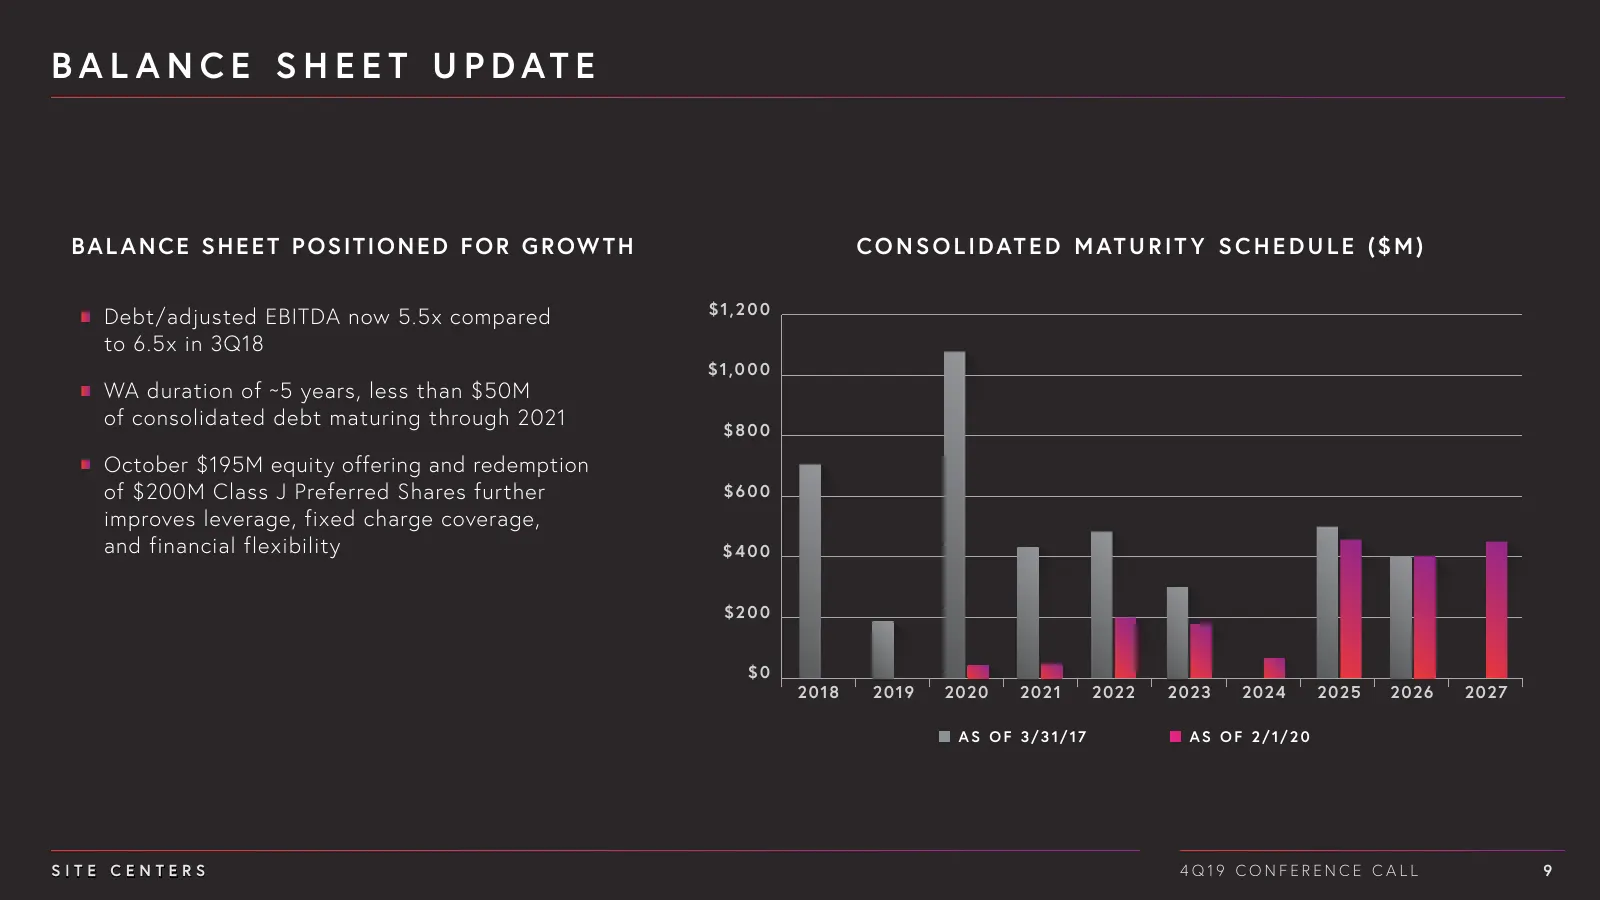
B A L A N C E S H E E T U P D AT E B A L A N C E S H E E T P OS I T I O N E D F O R G R OW T H C O N S O L I D AT E D M AT U R I T Y S C H E D U L E ( $ M ) $1, 2 0 0 Debt/adjusted EBITDA now 5.5x compared to 6.5x in 3Q18 $1,0 0 0 WA duration of ~5 years, less than $50M of consolidated debt maturing
Slide 10: 2020 Guidance & Earnings Considerations
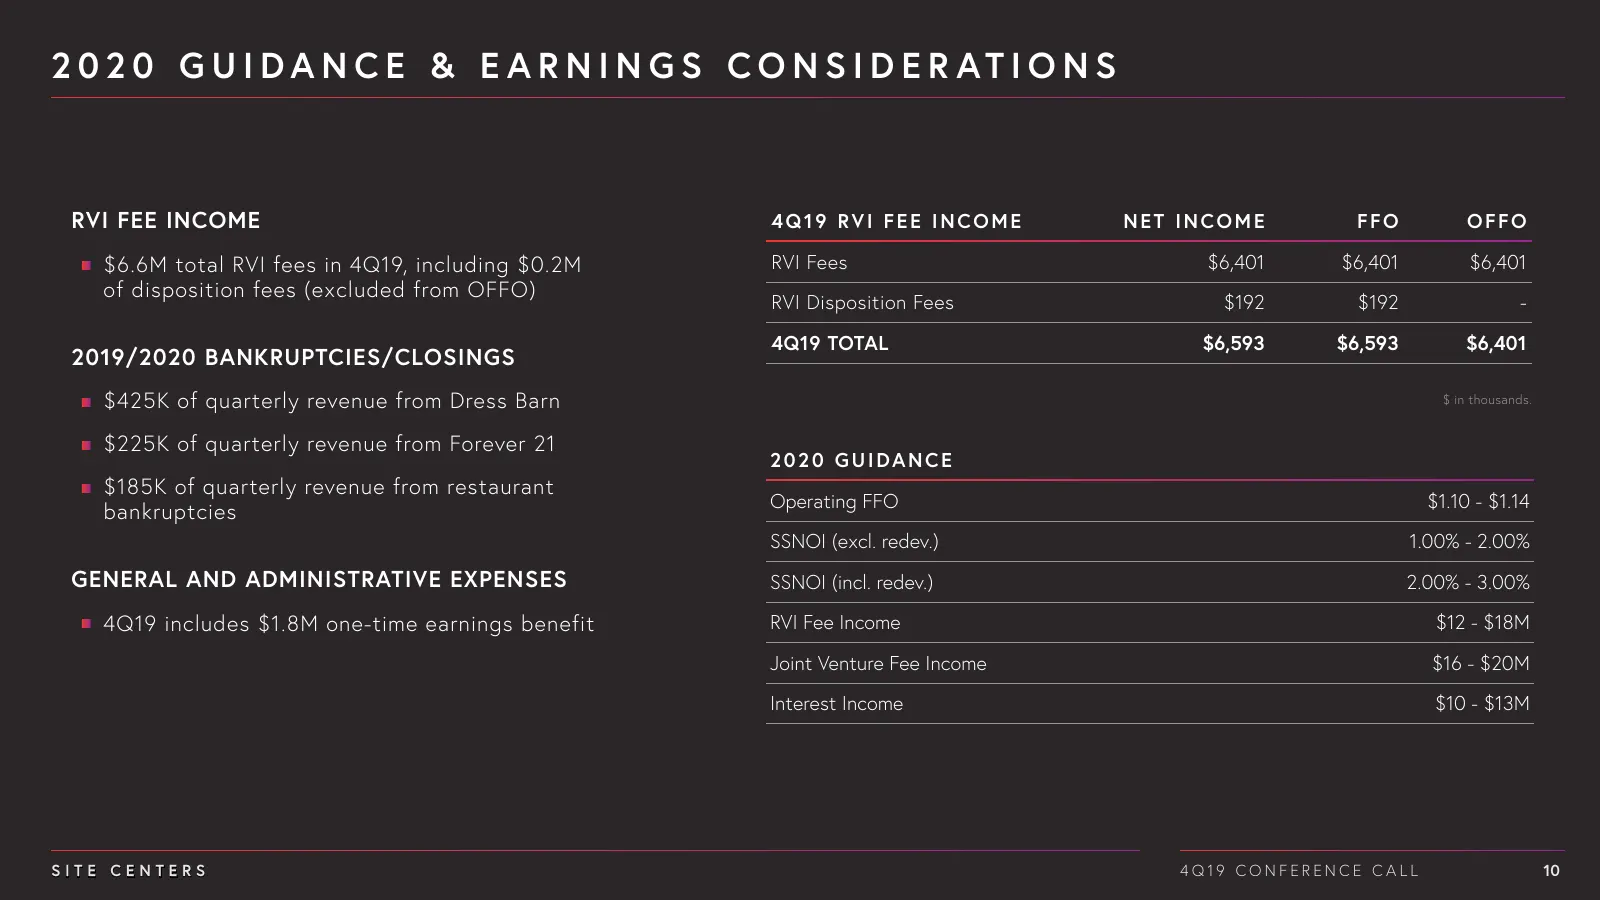
2 0 2 0 G U I D A N C E & E A R N I N G S C O N S I D E R AT I O N S RVI FEE INCOME 4Q19 RVI FEE INCOME NET INCOME FFO OFFO $6.6M total RVI fees in 4Q19, including $0.2M RVI Fees $6,401 $6,401 $6,401 of disposition fees (excluded from OFFO) RVI Disposition Fees $192 $192 - 4Q19 TOTAL $6,593 $6,593 $

Slide 11: Appendix
Appendix 11
Slide 12: Non-GAAP Financial Measures - Definitions
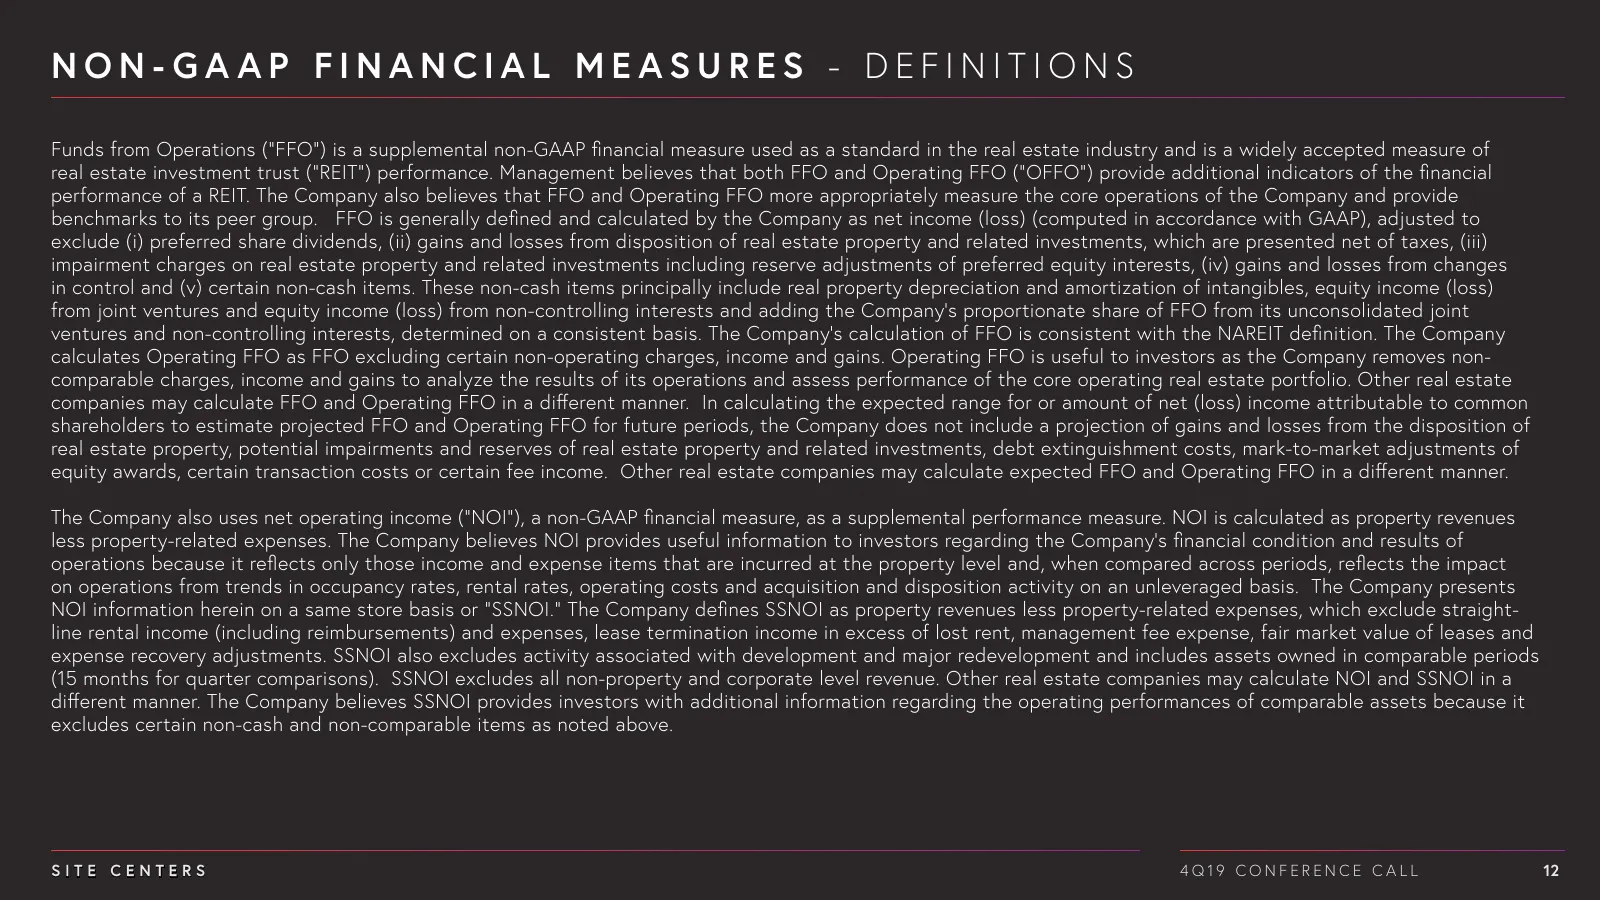
NON - GA AP FINANCIAL MEASURES - DEFINITIONS Funds from Operations (“FFO”) is a supplemental non-GAAP financial measure used as a standard in the real estate industry and is a widely accepted measure of real estate investment trust (“REIT”) performance. Management believes that both FFO and Operatin
Slide 13: Non-GAAP Financial Measures - Definitions Continued
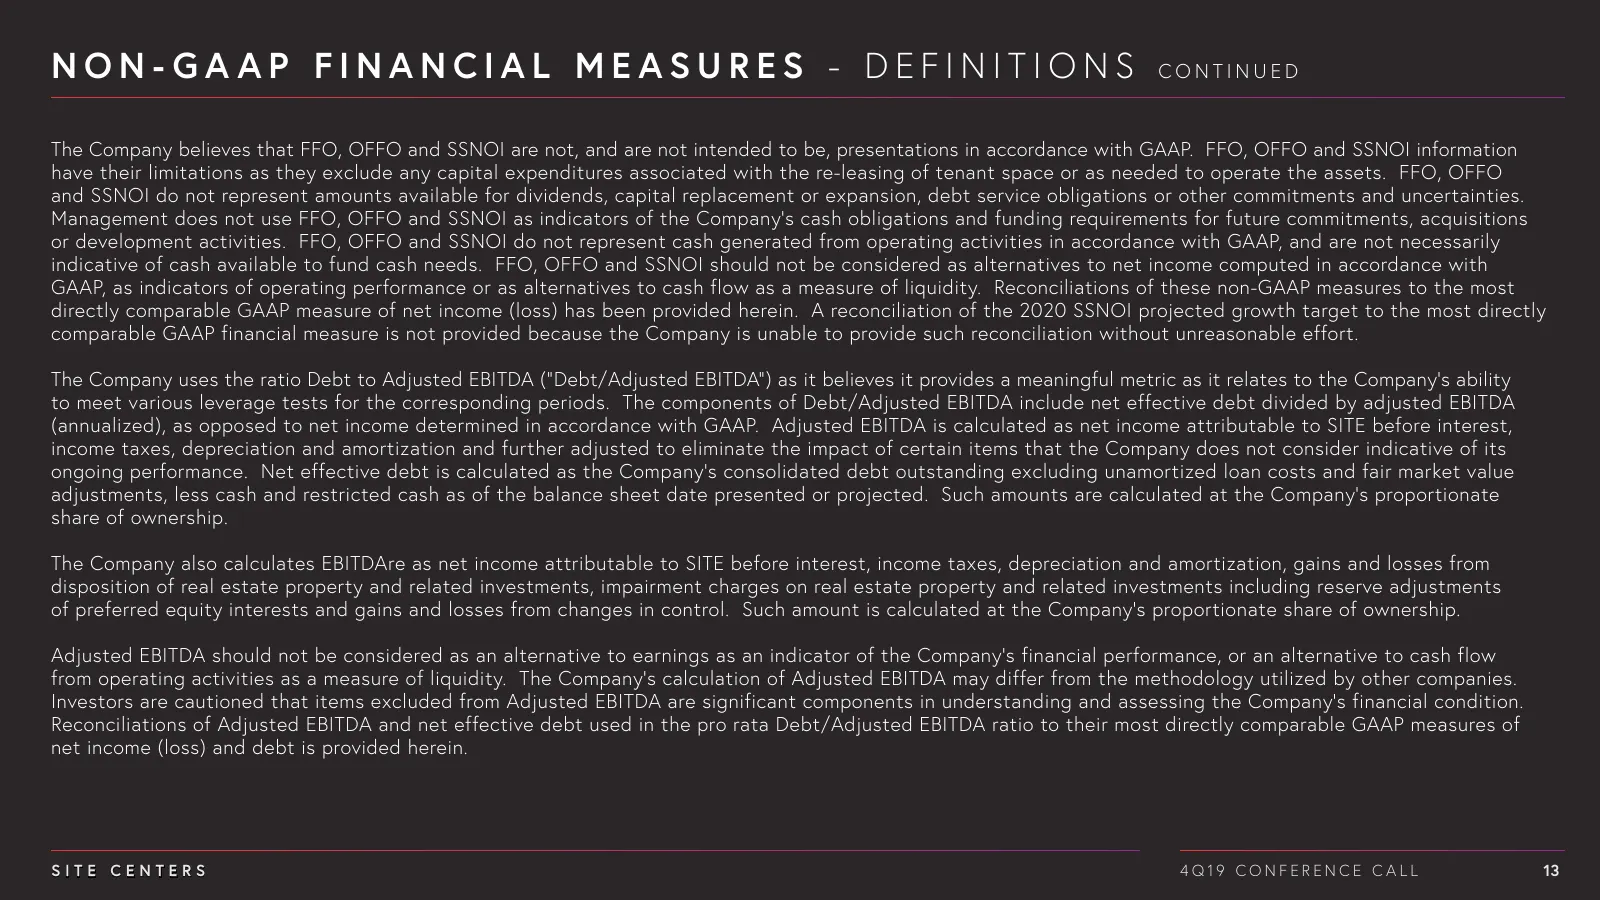
N O N - G A A P F I N A N C I A L M E A S U R E S - D E F I N I T I O N S CONTINUED The Company believes that FFO, OFFO and SSNOI are not, and are not intended to be, presentations in accordance with GAAP. FFO, OFFO and SSNOI information have their limitations as they exclude any capital expenditure
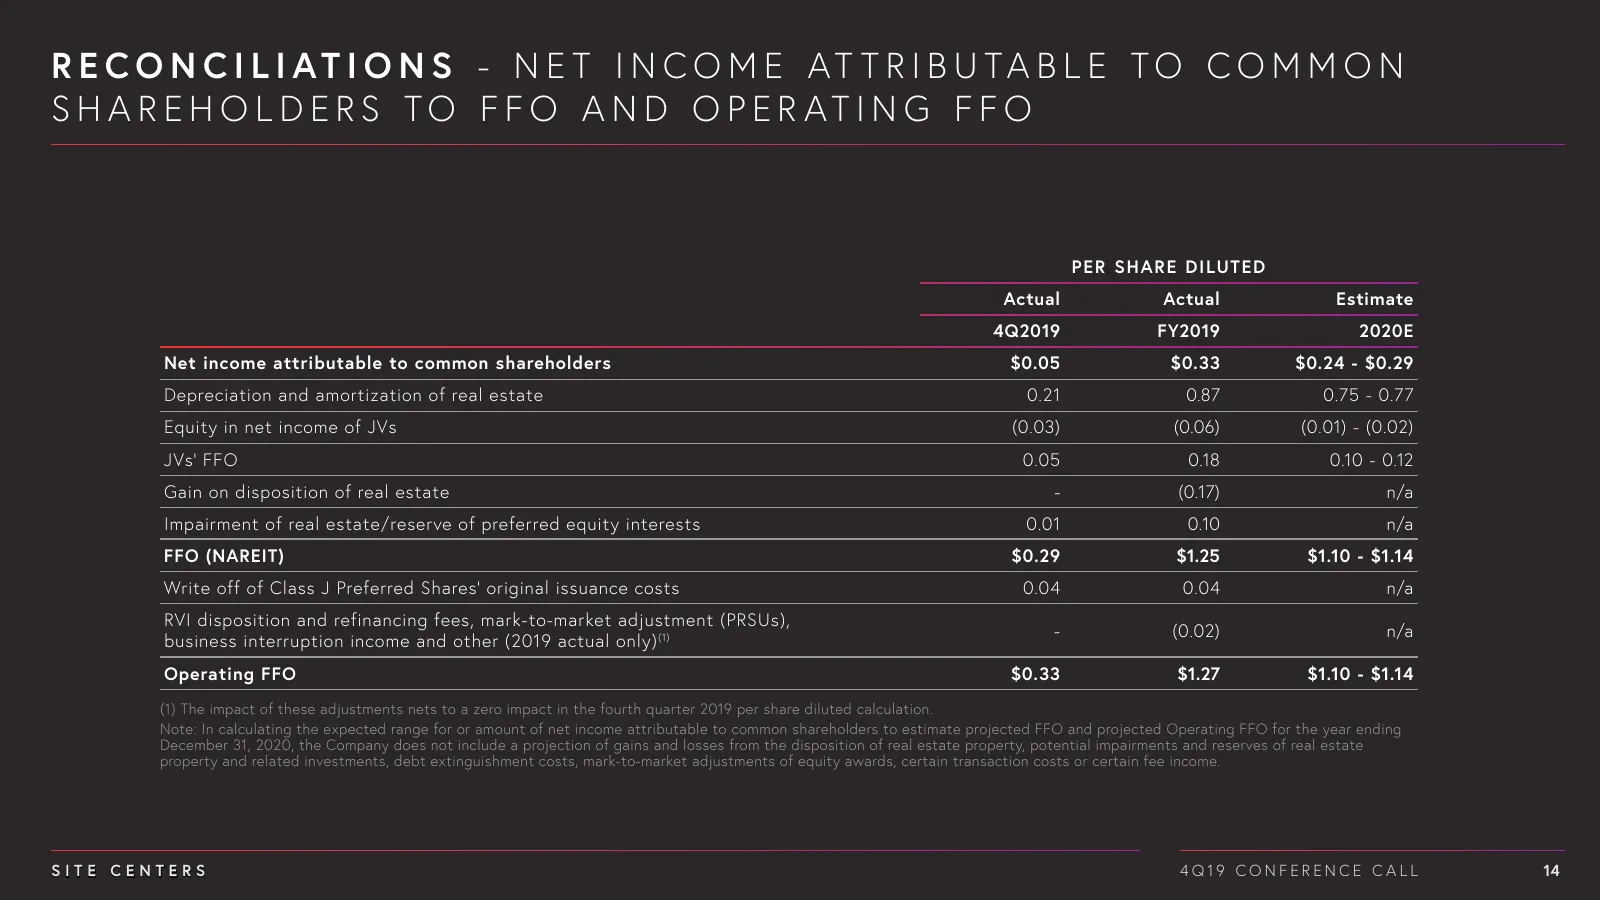
Slide 14: Reconciliation - Net Income to FFO and Operating FFO
R E C O N C I L I AT I O N S - N E T I N C O M E AT T R I B U TA B L E TO C O M M O N S H A R E H O L D E R S TO F F O A N D O P E R AT I N G F F O PER SHARE DILUTED Actual Actual Estimate 4Q2019 FY2019 2020E Net income attributable to common shareholders $0.05 $0.33 $0.24 - $0.29 Depreciation and a
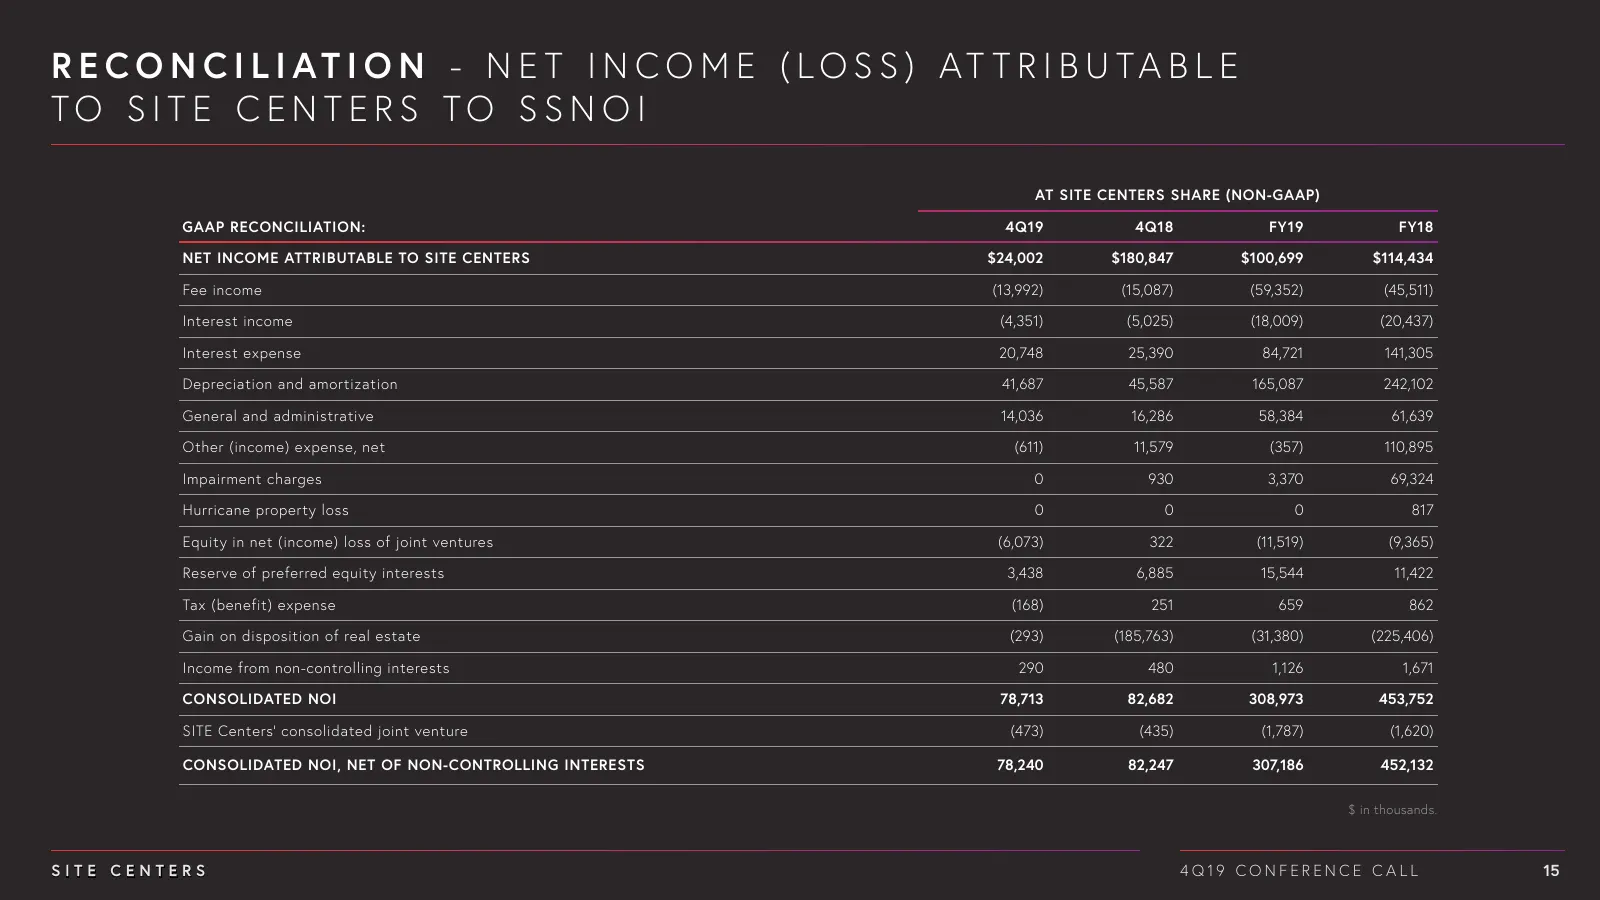
Slide 15: Reconciliation - Net Income to SSNOI
R E C O N C I L I AT I O N - N E T I N C O M E ( LO S S ) AT T R I B U TA B L E TO SITE CEN TERS TO SSN O I AT SITE CENTERS SHARE (NON-GAAP) GAAP RECONCILIATION: 4Q19 4Q18 FY19 FY18 NET INCOME ATTRIBUTABLE TO SITE CENTERS $24,002 $180,847 $100,699 $114,434 Fee income (13,992) (15,087) (59,352) (45,5
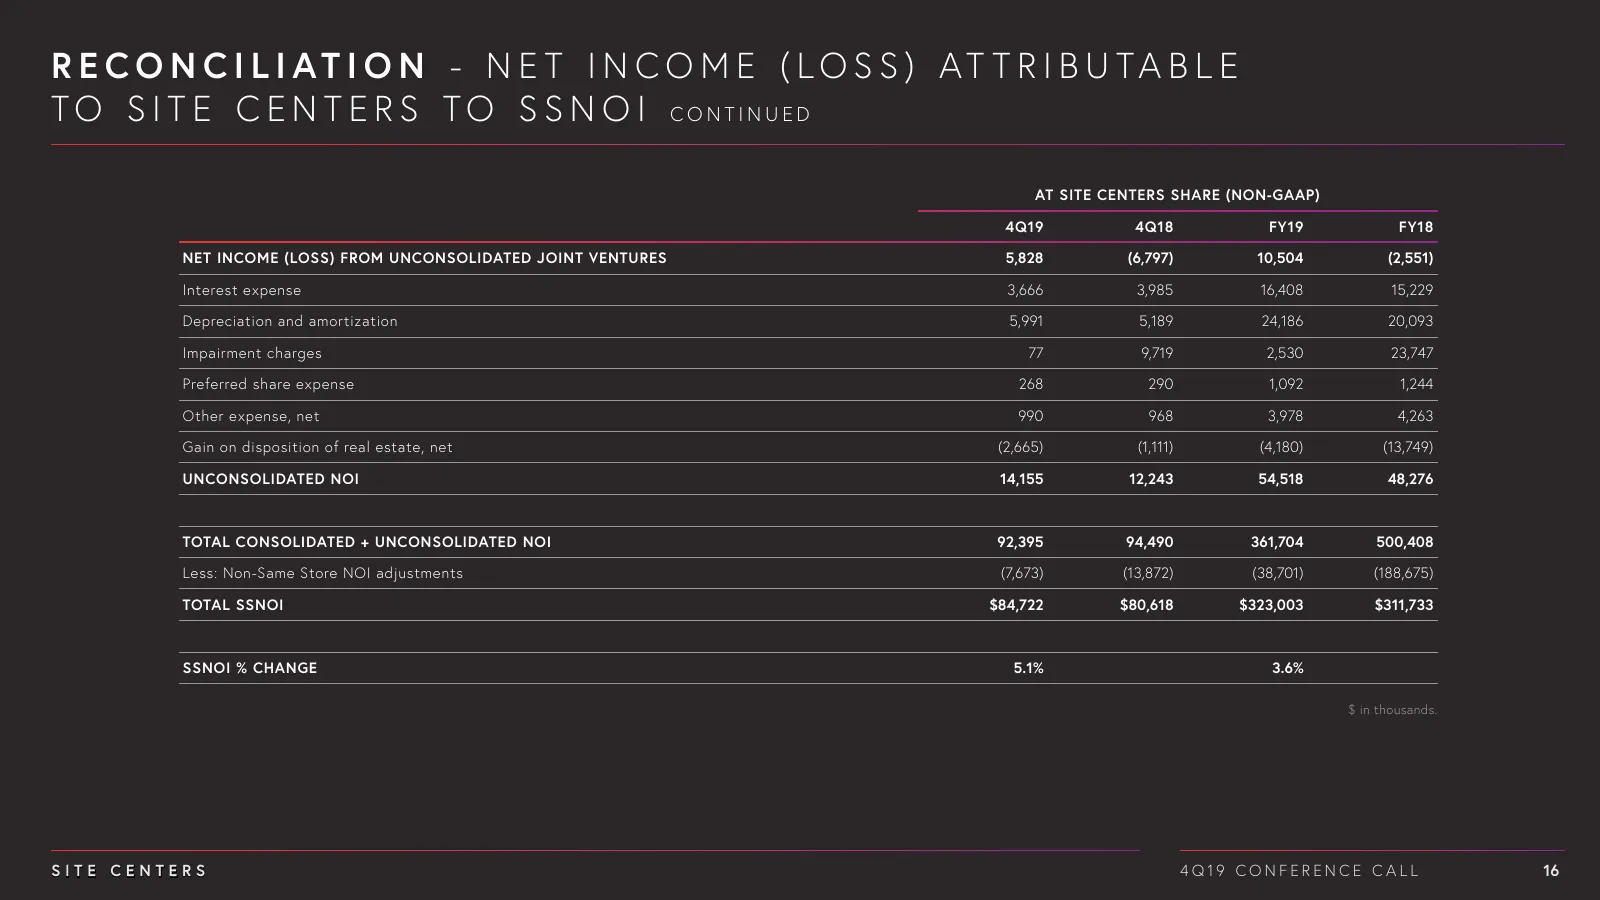
Slide 16: Reconciliation - Net Income to SSNOI Continued
R E C O N C I L I AT I O N - N E T I N C O M E ( LO S S ) AT T R I B U TA B L E T O S I T E C E N T E R S T O S S N O I CONTINUED AT SITE CENTERS SHARE (NON-GAAP) 4Q19 4Q18 FY19 FY18 NET INCOME (LOSS) FROM UNCONSOLIDATED JOINT VENTURES 5,828 (6,797) 10,504 (2,551) Interest expense 3,666 3,985 16,408
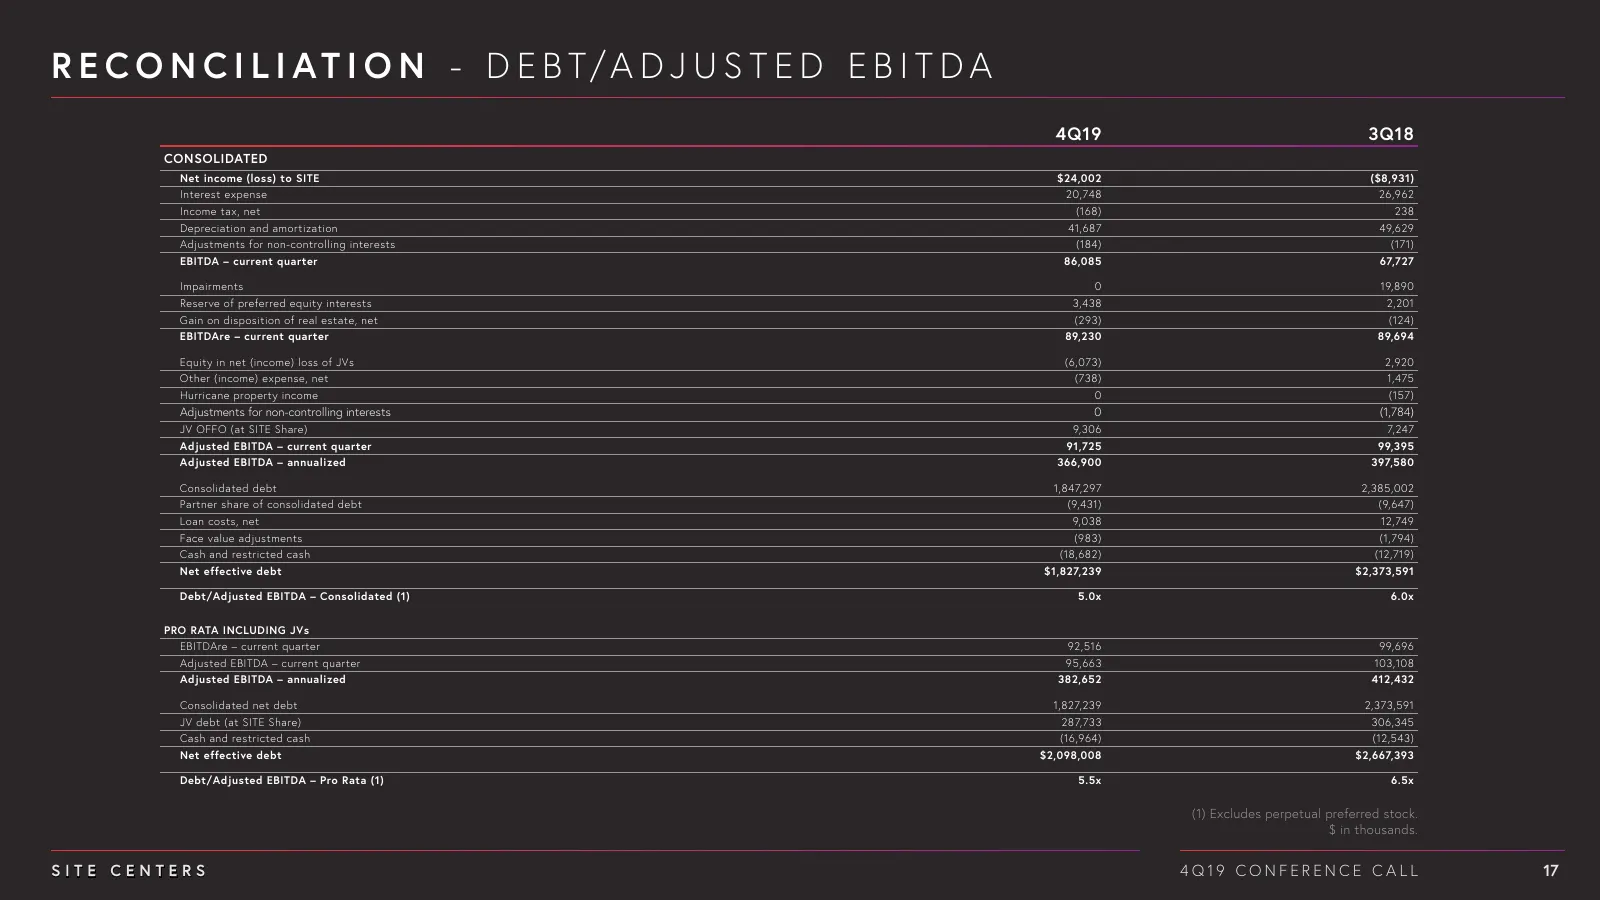
Slide 17: Reconciliation - Debt/Adjusted EBITDA
R E C O N C I L I A T I O N - D E B T/A D J U S T E D E B I T D A 4Q19 3Q18 CONSOLIDATED Net income (loss) to SITE $24,002 ($8,931) Interest expense 20,748 26,962 Income tax, net (168) 238 Depreciation and amortization 41,687 49,629 Adjustments for non-controlling interests (184) (171) EBITDA – curr
Source: Internet Archive copy of images.sitecenters.com
More decks from SITE Centers Corp.
 Merger or Acquisition (September 2024)32 slides · Sep 17, 2024
 Q2 2024 Earnings Presentation39 slides · Jul 30, 2024
 Q1 2024 Earnings Presentation28 slides · Apr 30, 2024
 Citi Global Property CEO Conference 202442 slides · March 2024
 Q4 2023 Earnings Presentation29 slides · Feb 13, 2024
 Merger or Acquisition (November 2023)42 slides · Nov 1, 2023